Article

Numerical Simulation and Optimization of Novel and Efficient Screw Structures for Spinnable Pitch

1
School of Airspace Science and Engineering, Shandong University, Weihai 264209, China
2
Shandong Key Laboratory of Carbon Fiber and Composite Materials Manufacture and Application, Shandong University, Weihai 264211, China
3
Preparation and Application of Aerospace High-Performance Composite Materials, Future Industry Laboratory of Higher Education Institutions in Shandong Province, Shandong University, Weihai 264209, China
4
Weihai Institute of Industrial Technology, Shandong University, Weihai 264209, China
5
Shandong Huilu Carbon Materials Technology Co., Ltd., Jining 272199, China
*
Authors to whom correspondence should be addressed.
Modelling 2025, 6(4), 140; https://doi.org/10.3390/modelling6040140
Submission received: 13 September 2025 / Revised: 22 October 2025 / Accepted: 27 October 2025 / Published: 3 November 2025

Abstract

In recent years, there has been a growing shift toward the use of screw extruders in the pitch modification process. To further improve the mixing efficiency of twin-screw extruders in pitch processing, this study focuses on redesigning the mixing elements of a co-rotating twin-screw extruder. By integrating the conventional kneading block assembly with PTA technology, three innovative screw mixing elements were developed. In this study, numerical simulations were performed using the finite element method (FEM) in the ANSYS Polyflow 2022 R1 software. The dynamic mesh technique was employed to model the screw rotation. The mixing performance of these novel screw elements was then evaluated in terms of distribution, mixing, and shear effects by utilizing the Particle Tracking Analy sis (PTA) technique within the Polyflow statistical module. The results demonstrate that the configuration and structural design of the mixing screw elements significantly influence the mixing effectiveness of spinnable pitch. Among the tested configurations, the slotted thread mixing element with six slots and a 30° slot angle (Model 2) was identified as the optimal design, exhibiting markedly superior mixing performance compared to the traditional kneading block (Model 4).

Graphical Abstract

1. Introduction

The screw extruder plays a critical role in preparing high-performance pitch-based materials by efficiently blending polymers with pitch to enhance modifier dispersibility and stability [1,2]. It is a vital shaping equipment in current industrial production and incorporates the basic chemical processes of solid particle transport, compression, melting, molten material transport, mixing, homogenization, and polymerization [3]. With the continuing development of application fields and technological advancements, screw extruders also play a key role in various polymer reactive compounding [4,5] and composite material processing applications, including pitch [6], multi-walled carbon nanotubes [7], glass fibers, and carbon fibers.
Screw extruders are categorized as single-screw extruders and twin-screw extruders [8]. Owing to their uncomplicated design and robust stability, single-screw extruders were extensively utilized in the initial stages, particularly in single-component formulated product manufacturing [9]. However, their mixing efficacy is comparatively inadequate. Nevertheless, with technical developments, twin-screw extruders have rapidly supplanted single-screw extruders due to their superior mixing efficiency, becoming the preferred equipment for polymer blending and modification [10]. In the twin-screw extruder, co-rotating twin-screw extruder provides superior mixing efficiency, effective devolatilization efficiency, adaptable screw configurations and exceptional processing capabilities, rendering them extensively utilized in polymer chemical modification and devolatilization processes [11,12,13].
The screw components of a twin-screw extruder can be assembled and replaced like to building blocks, primarily categorized into conveying elements, shear elements, and mixing elements, as illustrated in Figure 1. The threads of the conveying elements are axially arranged to advance the material, while specifically reverse-oriented threads serve to prolong the material’s residence time and enhance the filling rate of the screw. Shear elements use axially staggered kneading blocks to severely deform, compress, and shear the material, substantially enhancing the mixing effect of the material [14]. A screw element combination with kneading blocks set at a 45° staggered angle can generate the strongest shear force and achieve the best dispersion effect. The radially distributed groove structures in these mixing elements improve material uniformity.
In the past, the performance evaluation of extruder screw element designs primarily relied on experimental and theoretical calculation methods. This assessment involves two main criteria: the first concerns the evaluation of mixing performance, generally carried out through direct assessment based on Residence Time Distribution (RTD) [15,16] and indirect analysis via the physicochemical properties of the extrudate [17]; the second aims to characterize the numerical distribution of the flow field within the screw. Conventional methods such as emergency shutdown and disassembly are complex to perform and involve safety risks [18]. Experimental approaches face difficulties in directly characterizing mixing performance and are susceptible to interference from various factors such as formulation and processing parameters [19]. Although numerical methods have been introduced, the ultimate evaluation criteria often still fail to directly quantify the degree of mixing. Moreover, traditional design methodologies focus mainly on end-product performance, making it challenging to achieve optimal mixing efficiency [20].
The development of computational numerical simulation technology allows for a multi-angle, intuitive assessment of materials. Flow simulation techniques can determine relevant parameters at any point in the flow field. Additionally, by employing Particle Tracking Analysis (PTA), the internal mixing conditions can be analyzed based on particle trajectories [21]. Hu Dongdong and Chen Jinnan [22] employed the finite element software Polyflow to simulate three-dimensional isothermal flow in both co-rotating and counter-rotating twin-screw extruders and conducted visualization of the particle trajectories as well as statistical analysis of the mixing state. Due to its numerous advantages, computer numerical simulation is increasingly used in the design and optimization of screw elements [23,24,25,26,27].
As research progresses, several novel screw element structures have emerged, such as the wavy twin-screw, eccentric screw, and embedded twin-screw. However, previous studies have predominantly focused on foodstuffs and plastics as the working fluids, with limited exploration into the optimization of screw element structures for spinnable pitch. In this paper, we employ the Particle Tracking Analysis (PTA) technique, which allows for the precise tracing of the motion of individual or a small number of particles and is characterized by a relatively straightforward model construction and solution process. Using spinnable pitch as the raw material, we have optimized and improved the most common mixing elements in parallel twin-screw extruders. Specifically, we have designed three novel mixing screw elements and established an evaluation method for mixing effectiveness based on the Polyflow statistical module. We have conducted a comparative analysis of the mixing performance of these three novel mixing screw elements. It is hoped that this work will provide new insights and references for the design of mixing screw structures for spinnable pitch and the research and development of parallel twin-screw extruders.

2. Mixing Component Structure Design

2.1. Design of Novel Mixing Screw Elements

The traditional kneading block SK45 (Model 4) is widely used in twin-screw extruders due to its good shear capabilities. However, its performance in material distribution, mixing, and conveying is often suboptimal. To overcome these limitations, this study introduces three new mixing elements, each based on a distinct design concept, intended to enhance mixing and distribution efficiency while maintaining adequate shear performance. As illustrated in Figure 2a, the first type of new mixing screw element is the staggered-pin mixing element (Model 1). It comprises eight cylindrical pins uniformly distributed in each row along the shaft core, with four rows positioned at equal intervals. When installed in a twin-screw extruder, two elements are positioned side by side in opposite axial orientations so that the pins of one element pass precisely through the gaps between the pins of the other element, forming a staggered arrangement. The pin screw demonstrates superior mixing performance in both single-screw and twin-screw extruders, while also exhibiting commendable shear capability. The design idea of Model 1 is to refit the asymmetric pins from the barrel to the screw element, simplifying the barrel structure and with the aim of producing a better mixing effect. As shown in Figure 2b, the second new mixing screw element is a slotted-thread mixing element (Model 2). This model contains six through-slots on a double-thread conveying screw, with the slots uniformly dispersed in a circular pattern on the cross-section. Each slot has a circumferential angle of 30°, with rounded edges at the slot bottom. During installation in a twin-screw extruder, two elements are put side by side, with one element rotated 90° around its core axis, such that the threads of one element match precisely with the slots of the other, forming an intermeshing arrangement. The design concept of Model 2 integrates conveying element and pin element, employing the groove to create distinctively shaped “pins.” This seeks to attain the superior material distribution capabilities of the conveying element [28] in conjunction with the efficient shear mixing capabilities of the pin element.
Figure 2c illustrates the third novel mixing screw element, a gear-disc mixing element (Model 3), which comprises four helical gear discs, each with eight teeth, symmetrically arranged along the core shaft. In a twin-screw extruder, the two elements are installed side-by-side in axially reversed orientations. This configuration allows the gear disc of one element to precisely pass through the inter-disc gaps of the other, resulting in a staggered arrangement. The design of Model 3 represents an advancement over the conventional gear-disc element, substituting straight teeth with helical teeth. This alteration is intended to improve material conveyance and mixing efficiency while preserving the robust shearing capability of the gear-disc element. Figure 2d illustrates that the kneading block SK45 (Model 4) has five uniformly spaced kneading blocks with a 45° axial rotation. Its circular cross-section corresponds precisely with that of the conveying screw. In a twin-screw extruder, two elements are positioned adjacently, with one element rotated 90° about its core axis to prevent interference during rotation, so creating an intermeshing configuration. Detailed information on the four models and their meshing configurations are presented in the Supplementary Materials (Figures S15 and S16).

2.2. Grid Independence Verification

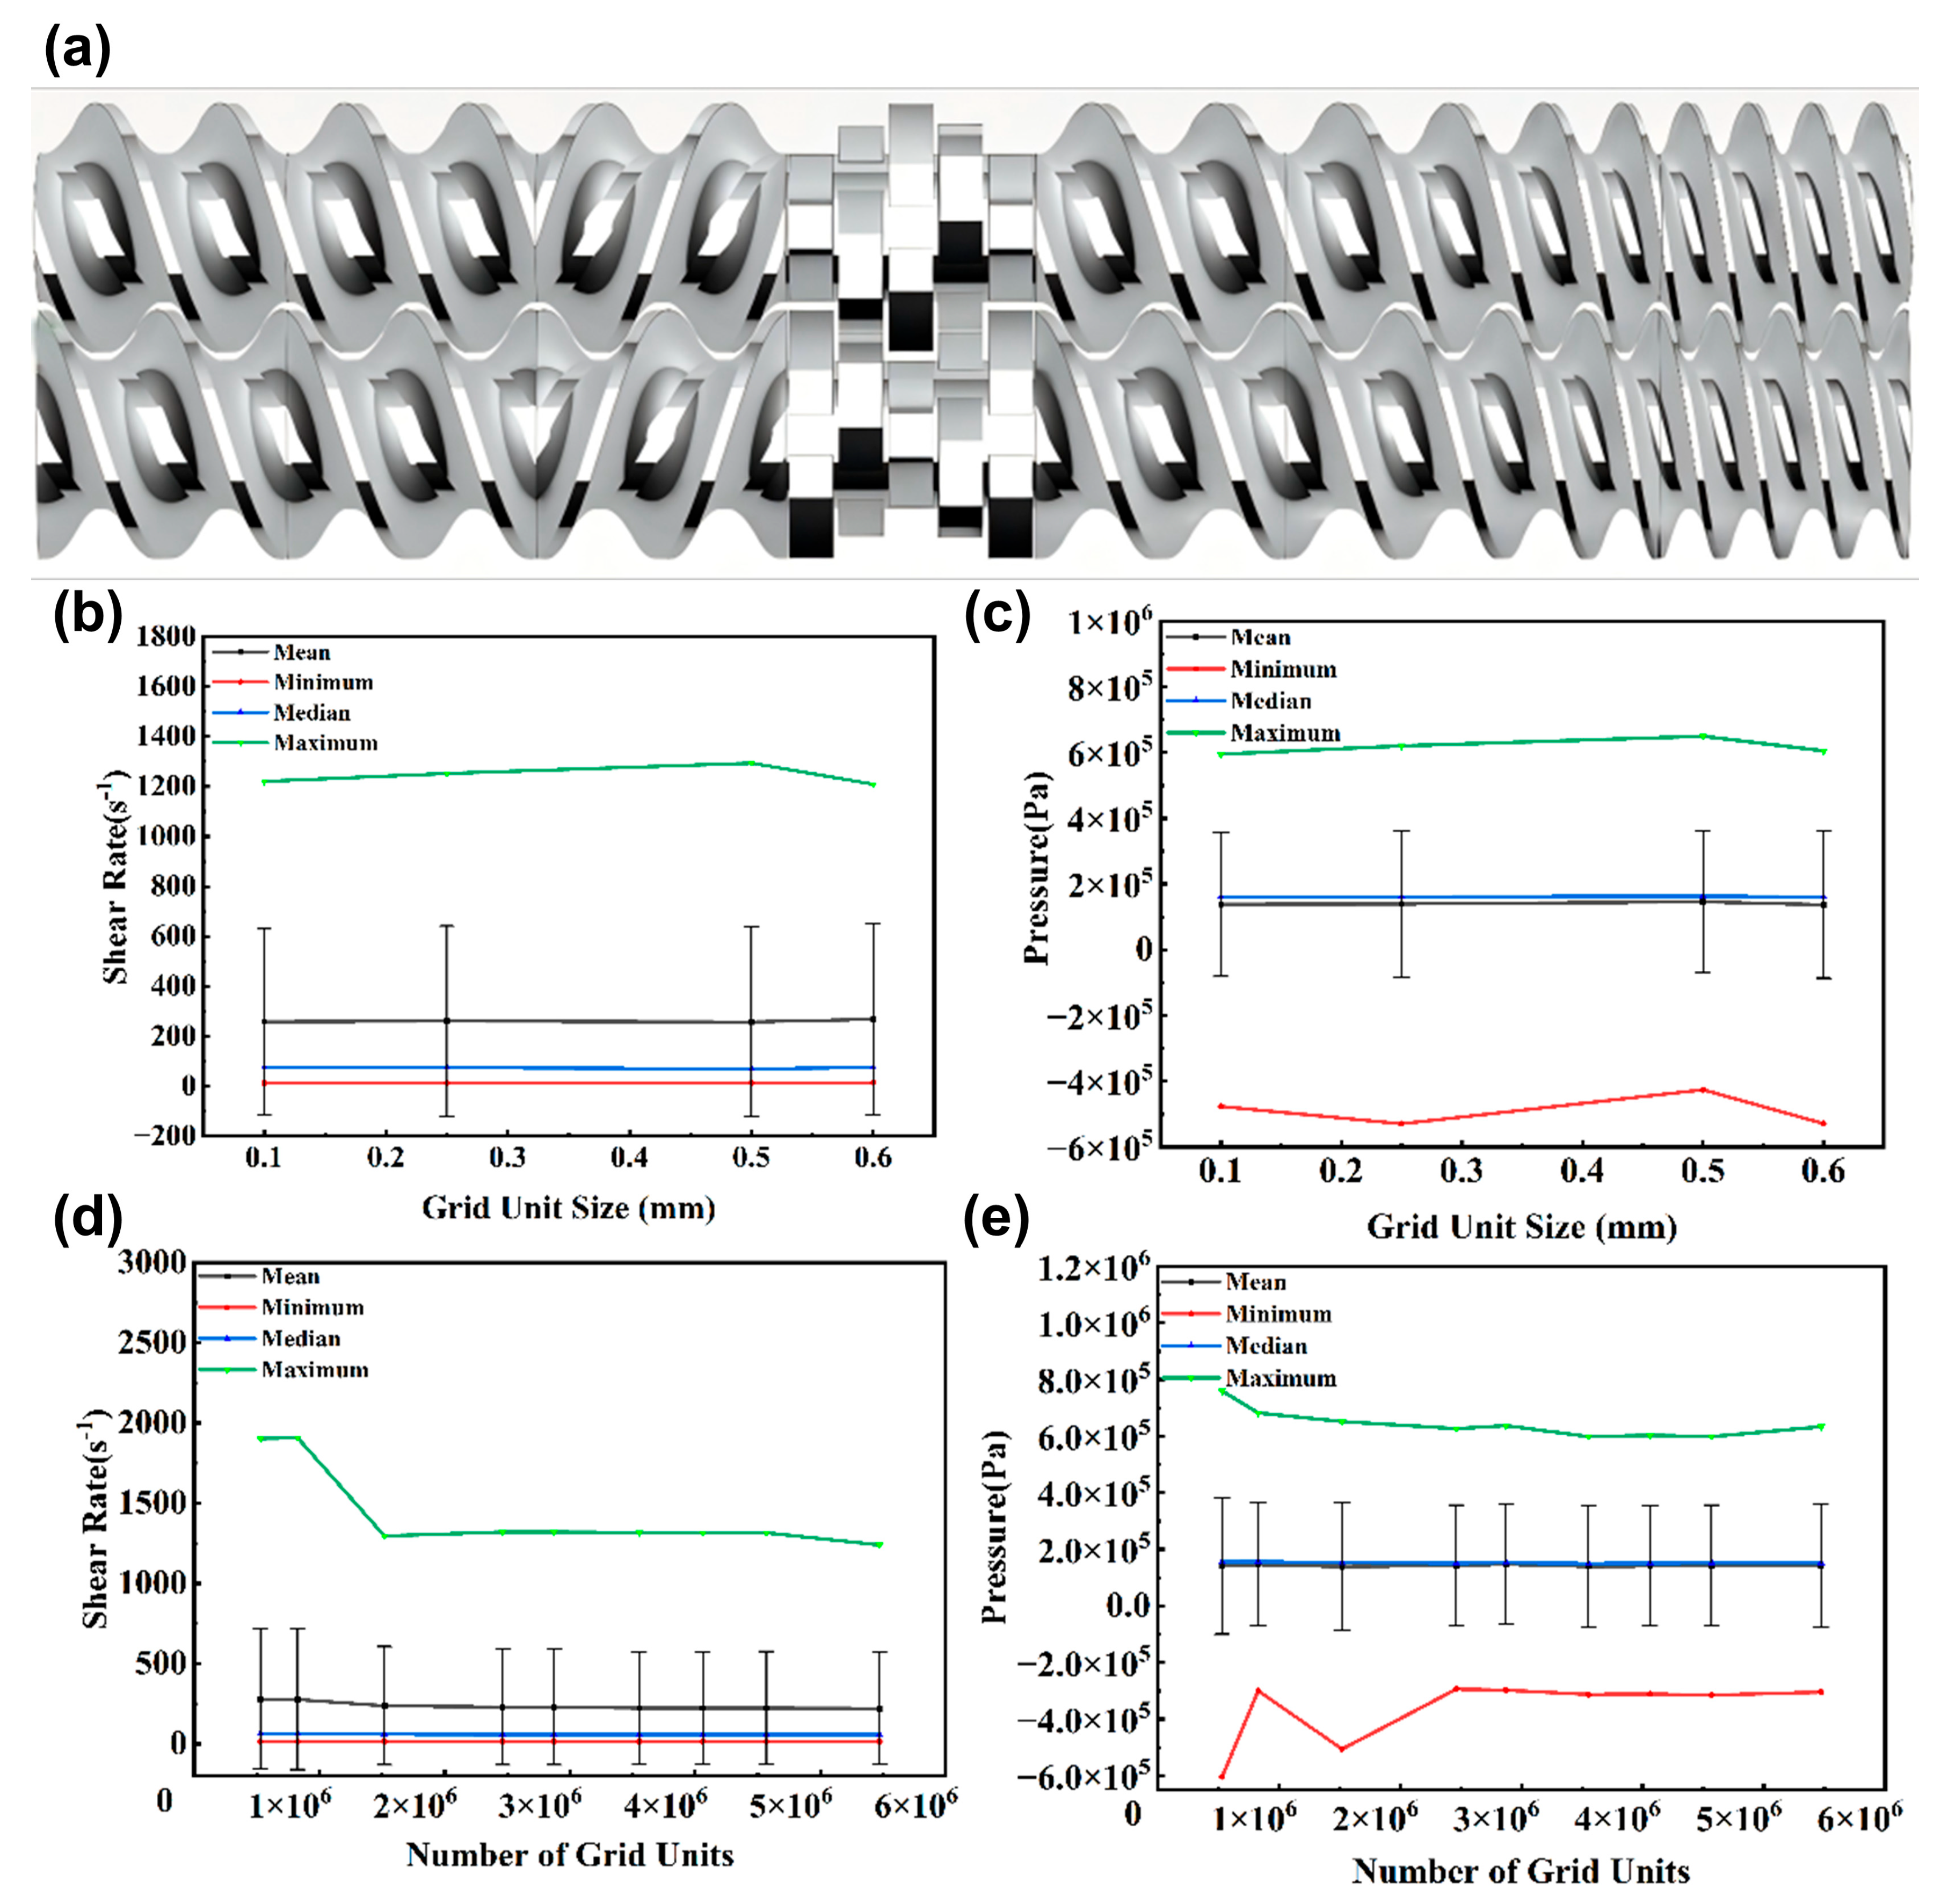
In order to achieve a balance between computational efficiency and precision, a twin-screw model with a length of 150 mm and its corresponding fluid domain, depicted in Figure 3a, were employed for grid independence verification. The pressure on the screw crest and the axial distribution of shear rate were analyzed, with the statistical data presented in Figure 3b–e.
The statistical data demonstrates that the screw mesh size has a negligible effect on computational precision. In the figure, the screw mesh with an element size of 0.6 mm, which was locally refined for the screw crest structure, yields simulation results that are almost equivalent to those generated by a mesh with an element size of 0.1 mm. When the number of fluid mesh elements reaches 1.5 to 2.5 million, the data fluctuations become significantly smaller, and the statistical results stabilize.
Therefore, for the fluid mesh, when the cross-sectional area remains constant, approximately 10,000 mesh elements per millimeter in the axial direction are sufficient to meet the requirements. For the screw mesh, local refinement of complex structural features is sufficient. This meshing strategy achieves an effective balance between computational efficiency and precision.

2.3. Mesh Generation and Dynamic Grid Simulation

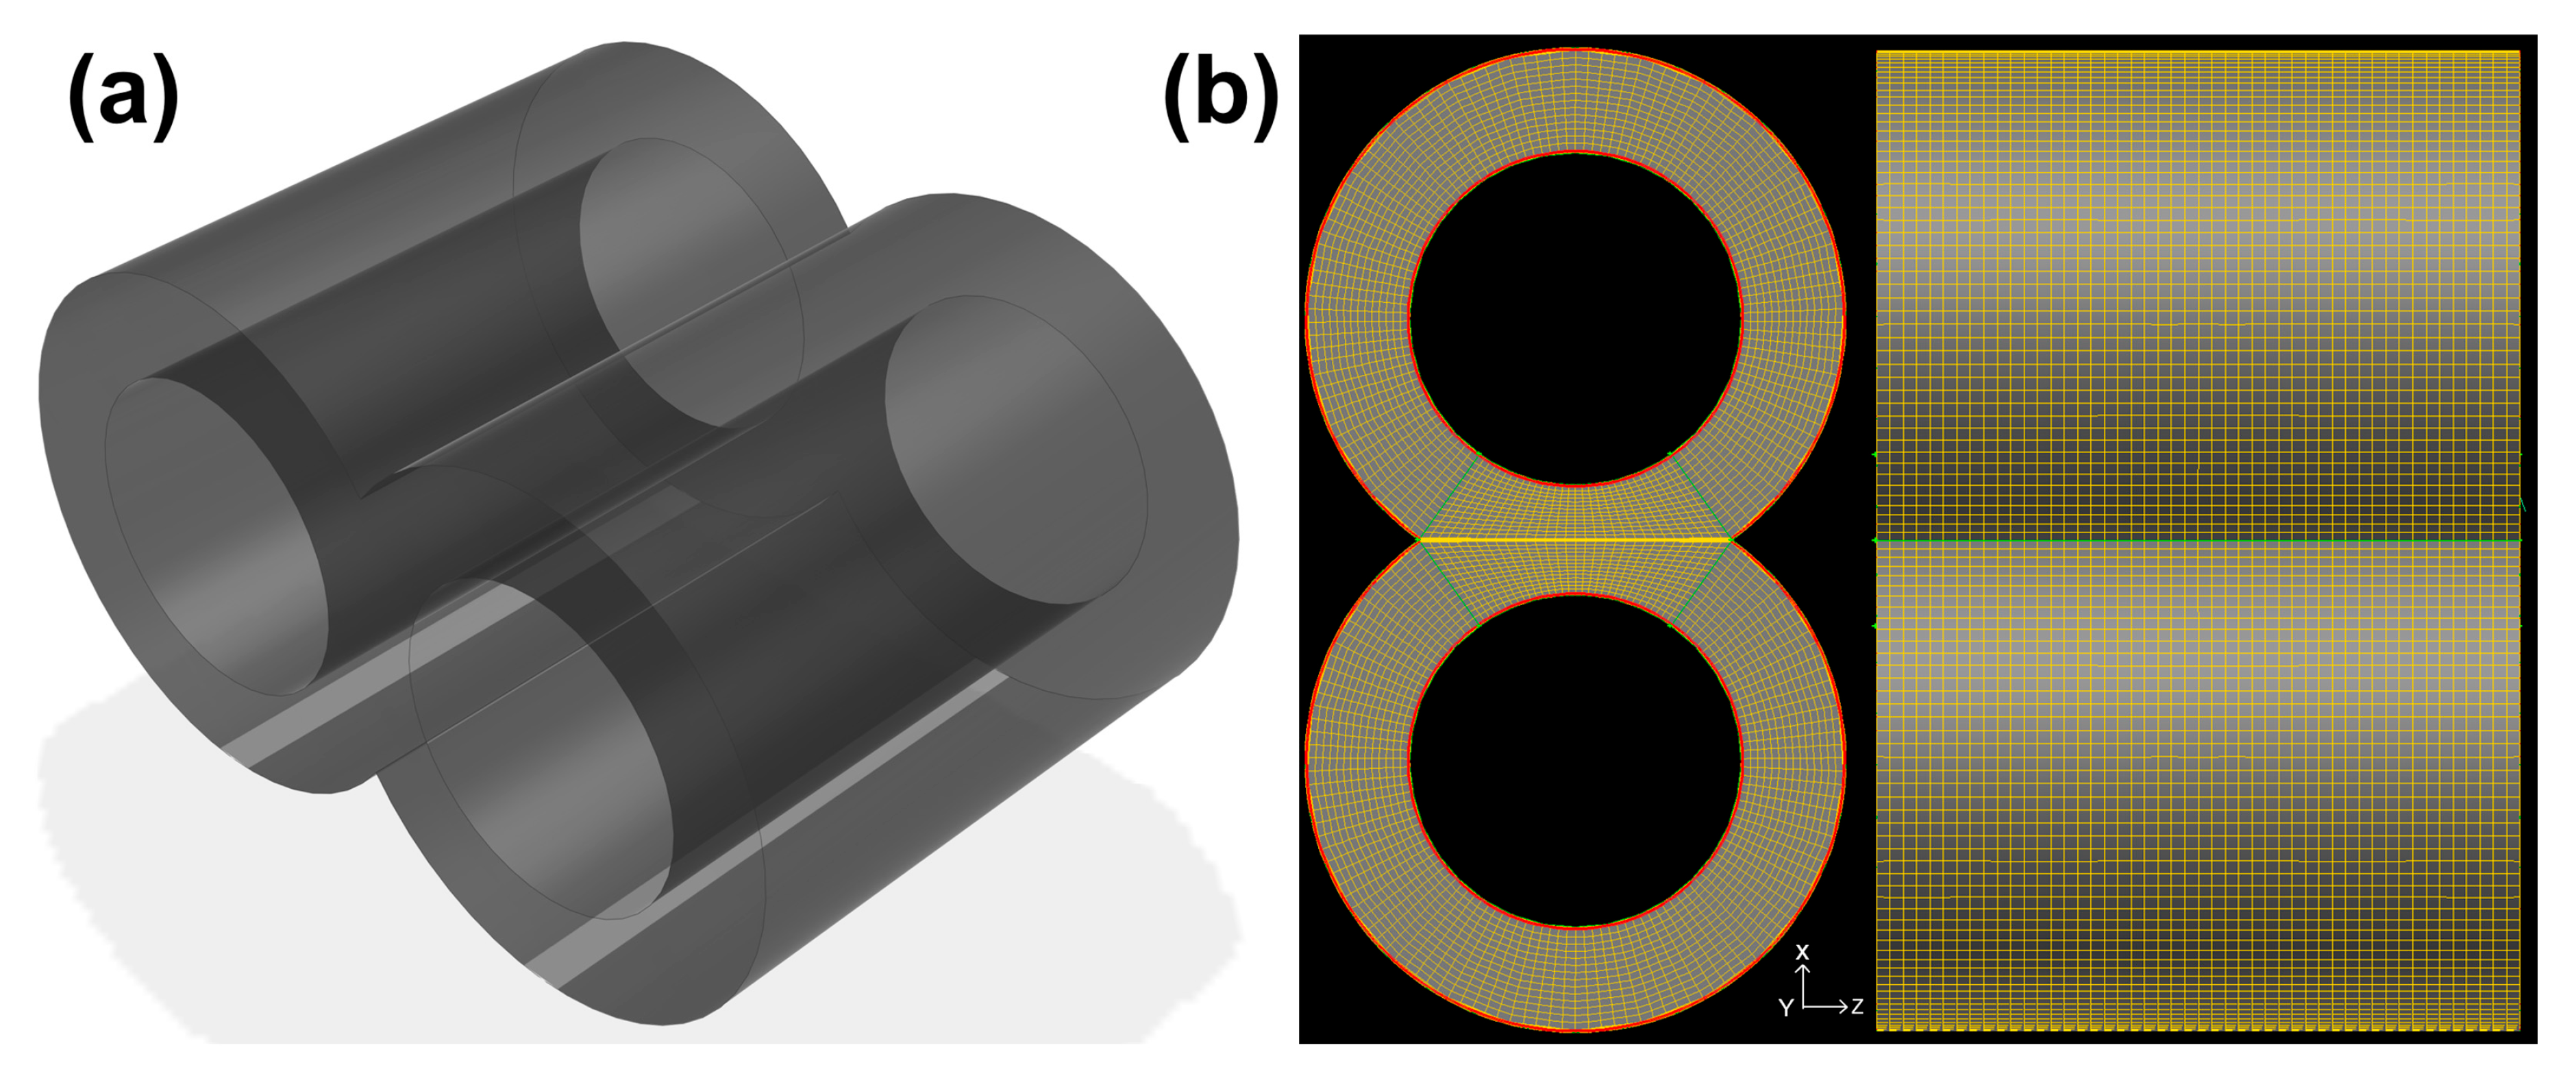
According to the principles of finite element analysis, a finer mesh division yields greater accuracy in the solution findings [29]. The results of grid independence verification indicate that for fluid grids with a constant cross-sectional area, a grid density of 10,000 grids per millimeter in the length direction is sufficient to ensure computational accuracy. For the screw mesh, local refinement is applied to complex structures to balance computational efficiency and accuracy. The fluid domain represents the volume occupied by the asphalt melt, and the solid model of the barrel with two axial holes is subtracted from the solid model of the twin screw in its working position. The resulting negative space precisely defines the flow channel between the screw and the barrel, which is used as the fluid domain for the simulation, as shown in Figure 4a. The length of the fluid is 24 mm, and the cross-sectional shape consists of two concentric rings with an outer diameter of 20.1 mm, an inner diameter of 12.3 mm, and a center-to-center distance of 16.4 mm. The coordinate system is defined with the origin at the center of the fluid inlet plane (x-z plane). The positive Y direction represents the extrusion direction, and Y (mm) represents the axial distance from the inlet. The mesh was created utilizing Gambit 2.4.6 software, with the outcomes illustrated in Figure 4b. The fluid domain was entirely meshed with hexahedral elements. Specifically, boundary layer meshing was implemented in the regions of the top clearance and meshing clearance, with five layers of boundary mesh and a thickness of 0.02 mm. In total, the mesh comprised 308,736 elements. For models with complex curving surfaces, such as Model 2 and Model 3, local refinement was conducted using the ANSYS Mesh module, with a maximum mesh size of 7.5 mm. For models without complex curving surfaces, such as Model 1 and Model 4, no local refinement was applied. Nonetheless, to ensure uniformity in mesh scale, the maximum mesh size was reduced to 0.25 mm for these models. The mesh element counts for the four models are 674,473; 782,083; 567,039; and 820,938, respectively.
The simulations were conducted under conditions of lower temperatures and higher screw speeds, as these parameters yield greater variation in the data and enhanced discernibility. The corresponding results are presented in Supplementary Figures S1–S11. Therefore, based on dynamic mesh technology, in the flow simulation process of this paper, the fluid region remains stationary. An isothermal transient simulation was designed, ignoring the heat generated by friction. The processing conditions were set to 315 °C, with the twin screw rotating in the flow field at a speed of 50 revolutions per minute. The boundary of the flow field continuously changes as the twin screw rotates.

3. Theoretical Basis of Flow Simulation

3.1. Basic Assumptions and Governing Equations

Actual extrusion processes involve fluctuations in the properties of the pitch melt within the screw channels, complicating flow simulations. To simplify the governing equations, the following assumptions are adopted for the pitch melt [30,31]: (1) isothermal laminar flow; (2) steady-state and fully developed flow; (3) incompressible fluid completely filling the screw channel; (4) negligible gravitational and inertial effects due to the melt’s high viscosity. The flow of the pitch melt follows the law of mass conservation, the law of momentum conservation, and the law of energy conservation. Its flow is governed by the continuity equation, the momentum conservation equation, and the energy conservation equation, as shown in Equations (1)–(3).
· V = 0
ρ dV dt = p + τ
ρ C p = d T dt = q + τ υ
In the equations, represents the differential operator; V is the velocity vector (m/s), ρ is the density (kg/m3), τ is the stress tensor (Pa), p is the pressure (Pa), T is the melt temperature (K), Cp is the specific heat capacity at constant pressure (J/kg·K), q is the heat flux (W/m2).

3.2. Raw Material Rheological Testing and Constitutive Equations

The constitutive equation, or rheological equation, delineates the interrelations among kinematic variables, dynamical variables, and thermodynamic states of a particular continuous medium. The Polyflow flow simulation employs a mathematical model of shear rate, temperature, and fluid viscosity as the constitutive equation for the fluid. The often utilized Power law, as presented in Equation (4), is typically applied to characterize the relationship between the viscosity of polymeric substances, such as polyethylene and rubber, and the shear rate [30]. When fitting behavior at low shear rates, the Bird-Carreau law, as shown in Equation (5), better captures the plateau region of the viscosity curve at low shear rates, which is in good agreement with the high viscosity behavior of asphalt melts at low shear rates. If the fluid is non-isothermal, the dependency of viscosity on both temperature and shear rate must be considered simultaneously. The Arrhenius approximate law, as shown in Equation (6), is commonly used to describe the correlation of viscosity with temperature for polymer materials.
η = K λ γ ˙     n 1
η = ( η + η 0 η 1 + λ 2 γ ˙ 2 n 1 2 )
η = e a ( T T 0 ) η 0 γ ˙
In this formula, η is the apparent viscosity (Pa·s), K is the viscosity coefficient (Pa·s), λ is the relaxation time (s), γ ˙ is the shear rate (s−1), n is the power law index, η is the limiting viscosity (Pa·s), η0 is the zero-shear viscosity (Pa·s), α is the ratio of activation energy to the thermodynamic constant, T is the temperature (°C), and T0 is the reference temperature (°C).
Pitch, utilized as a precursor for carbon fiber, can be classified according to its characteristics into anisotropic mesophase pitch (MP) and isotropic pitch (IP). The fabrication procedure of IP is straightforward and economical. However, the resulting carbon fiber exhibits subpar performance and is generally utilized as a functional material. Conversely, MP entails a more intricate and expensive production method, yet, the resultant carbon fiber demonstrates superior mechanical properties, rendering it a prevalent choice for structural applications [31]. This study focuses on the rheological properties of isotropic asphalt (IP) through testing and characterization, with the softening point curve shown in Supplementary Material Figure S12 and the temperature-viscosity curve in Figure S13. Based on the tests, the rheological behavior is described by coupling the Approximate Arrhenius Law and Bird-Carreau Law, as shown in Equation (7).
η = e a ( T T 0 ) × ( η + η 0 η 1 + λ 2 γ ˙ 2 n 1 2 )
The meanings of the related parameters in the equation are consistent with those in the previous text.
Based on the test data, the rheological properties of IP are fitted using Equation (7), resulting in the rheological model shown in Figure S14. This model can accurately predict the viscosity of IP at the corresponding temperature and shear rate. It is worth noting that due to the limitations of experimental conditions, this study focuses on the low shear rate region. The fit of the equation is better in the low shear rate range. This paper mainly focuses on the flow simulation in the low shear range. Based on the rheological model in Figure S14, the material parameters of IP at 315 °C are: η0 = 3106.53 Pa·s; η = 3.89645 × 10⁻⁸ Pa·s; λ = 25.0774 s; n = 0.51083.

3.3. Boundary Conditions

In actual production, materials are transported by conveying elements to mixing elements. Consequently, before conducting comparative experiments, a steady–state simulation of free flow was performed in the fluid region illustrated in Figure 4a using the conveying element SS24 shown in Figure 1a to ascertain the inlet flow rate of the mixing element. The geometric model’s origin was defined at the center of the fluid inlet plane (the x–z plane), with the positive y direction indicating the extrusion direction. The outlet flow rate of the conveying element SS24 in the steady-state simulation is 2.96 × 10⁻⁶ m3/s. The boundary conditions for the flow simulation are specified as follows: the inlet is designated as the inflow boundary with a flow rate of 2.96 × 10⁻⁶ m3/s, the outer wall is set as a no-slip boundary (Vn = vs. = 0), the two inner holes (the interface between the screw and the fluid) are configured as slip boundaries (Vn = Fs = 0), and the outlet is classified as a free-flow boundary (Fn = Fs = 0). It is worth noting that dynamic mesh technology is used in this study to simplify the treatment of rotational motion and avoid mesh distortion or computational instability issues that may arise from directly using no-slip boundaries. The geometric model of the screw element is defined as a moving part, and its rotational speed is directly defined at the mesh boundary by a predefined angular velocity (50 rpm in this case). The Particle Tracing Analysis (PTA) technique is based on the transient simulation of the velocity field. It involves specifying material particles at the inlet of the flow field and calculating their real-time trajectories within the flow field based on the velocity field results, as well as the corresponding values of various metrics. The following assumptions are made for these particles: (1) The particles are massless, and their volumes can be neglected. (2) The particles have no influence on the flow field. (3) There is no interaction between the particles. (4) The motion of the particles is completely determined by the velocity field. The parameters for the mixing simulation’s boundary conditions were established as follows: 3000 IP particles enter through the inlet and exit through the outlet. The outside wall and the two inside holes are impenetrable. The concentration on the left side of the inlet is 1, and the particles are marked in red; the concentration on the right side of the inlet is 0, and the particles are marked in blue.

4. Results and Discussion

4.1. Flow Characteristics Analysis

The distribution of the velocity vector diagrams of the outlet cross-sections of the four types of screw elements is shown in Figure 5. When the screw elements are positioned in a staggered configuration, as illustrated in Figure 5a,c, significant regional velocity disparities in the melt flow are evident, with certain areas exhibiting comparatively low flow velocities. When the screw elements are arranged in a meshing configuration, as shown in Figure 5b,d, the numerical distribution of the flow velocity of the pitch melt is relatively uniform. There are no regional velocity differences. It flows at a high speed in the meshing region and has improved fluidity. As shown in Figure 5d, the kneading blocks of two Model 4 elements are meshed over a large area, and the flow velocity of the pitch melt is significantly faster in the meshed area. From the perspective of structural analysis, when the screw elements are arranged in a staggered configuration, although this arrangement ensures that the two elements do not interfere with each other, it is also necessary to set up a non-working section with no working structure. This is the reason for the existence of regional velocity differences and slower local flow velocities within the flow field. The meshing configuration can avoid interference between components without the need for a free non-working section. Compared to the misaligned arrangement of components, the meshing configuration provides a more uniform flow velocity distribution and a more stable mixing effect. This finding is completely consistent with the conclusion drawn by Ishikawa et al. in their classic study on co-rotating twin-screw mixing elements. They also pointed out that the stretching flow field generated in the meshing zone and the improved lateral exchange capability are key to enhancing mixing efficiency [13].
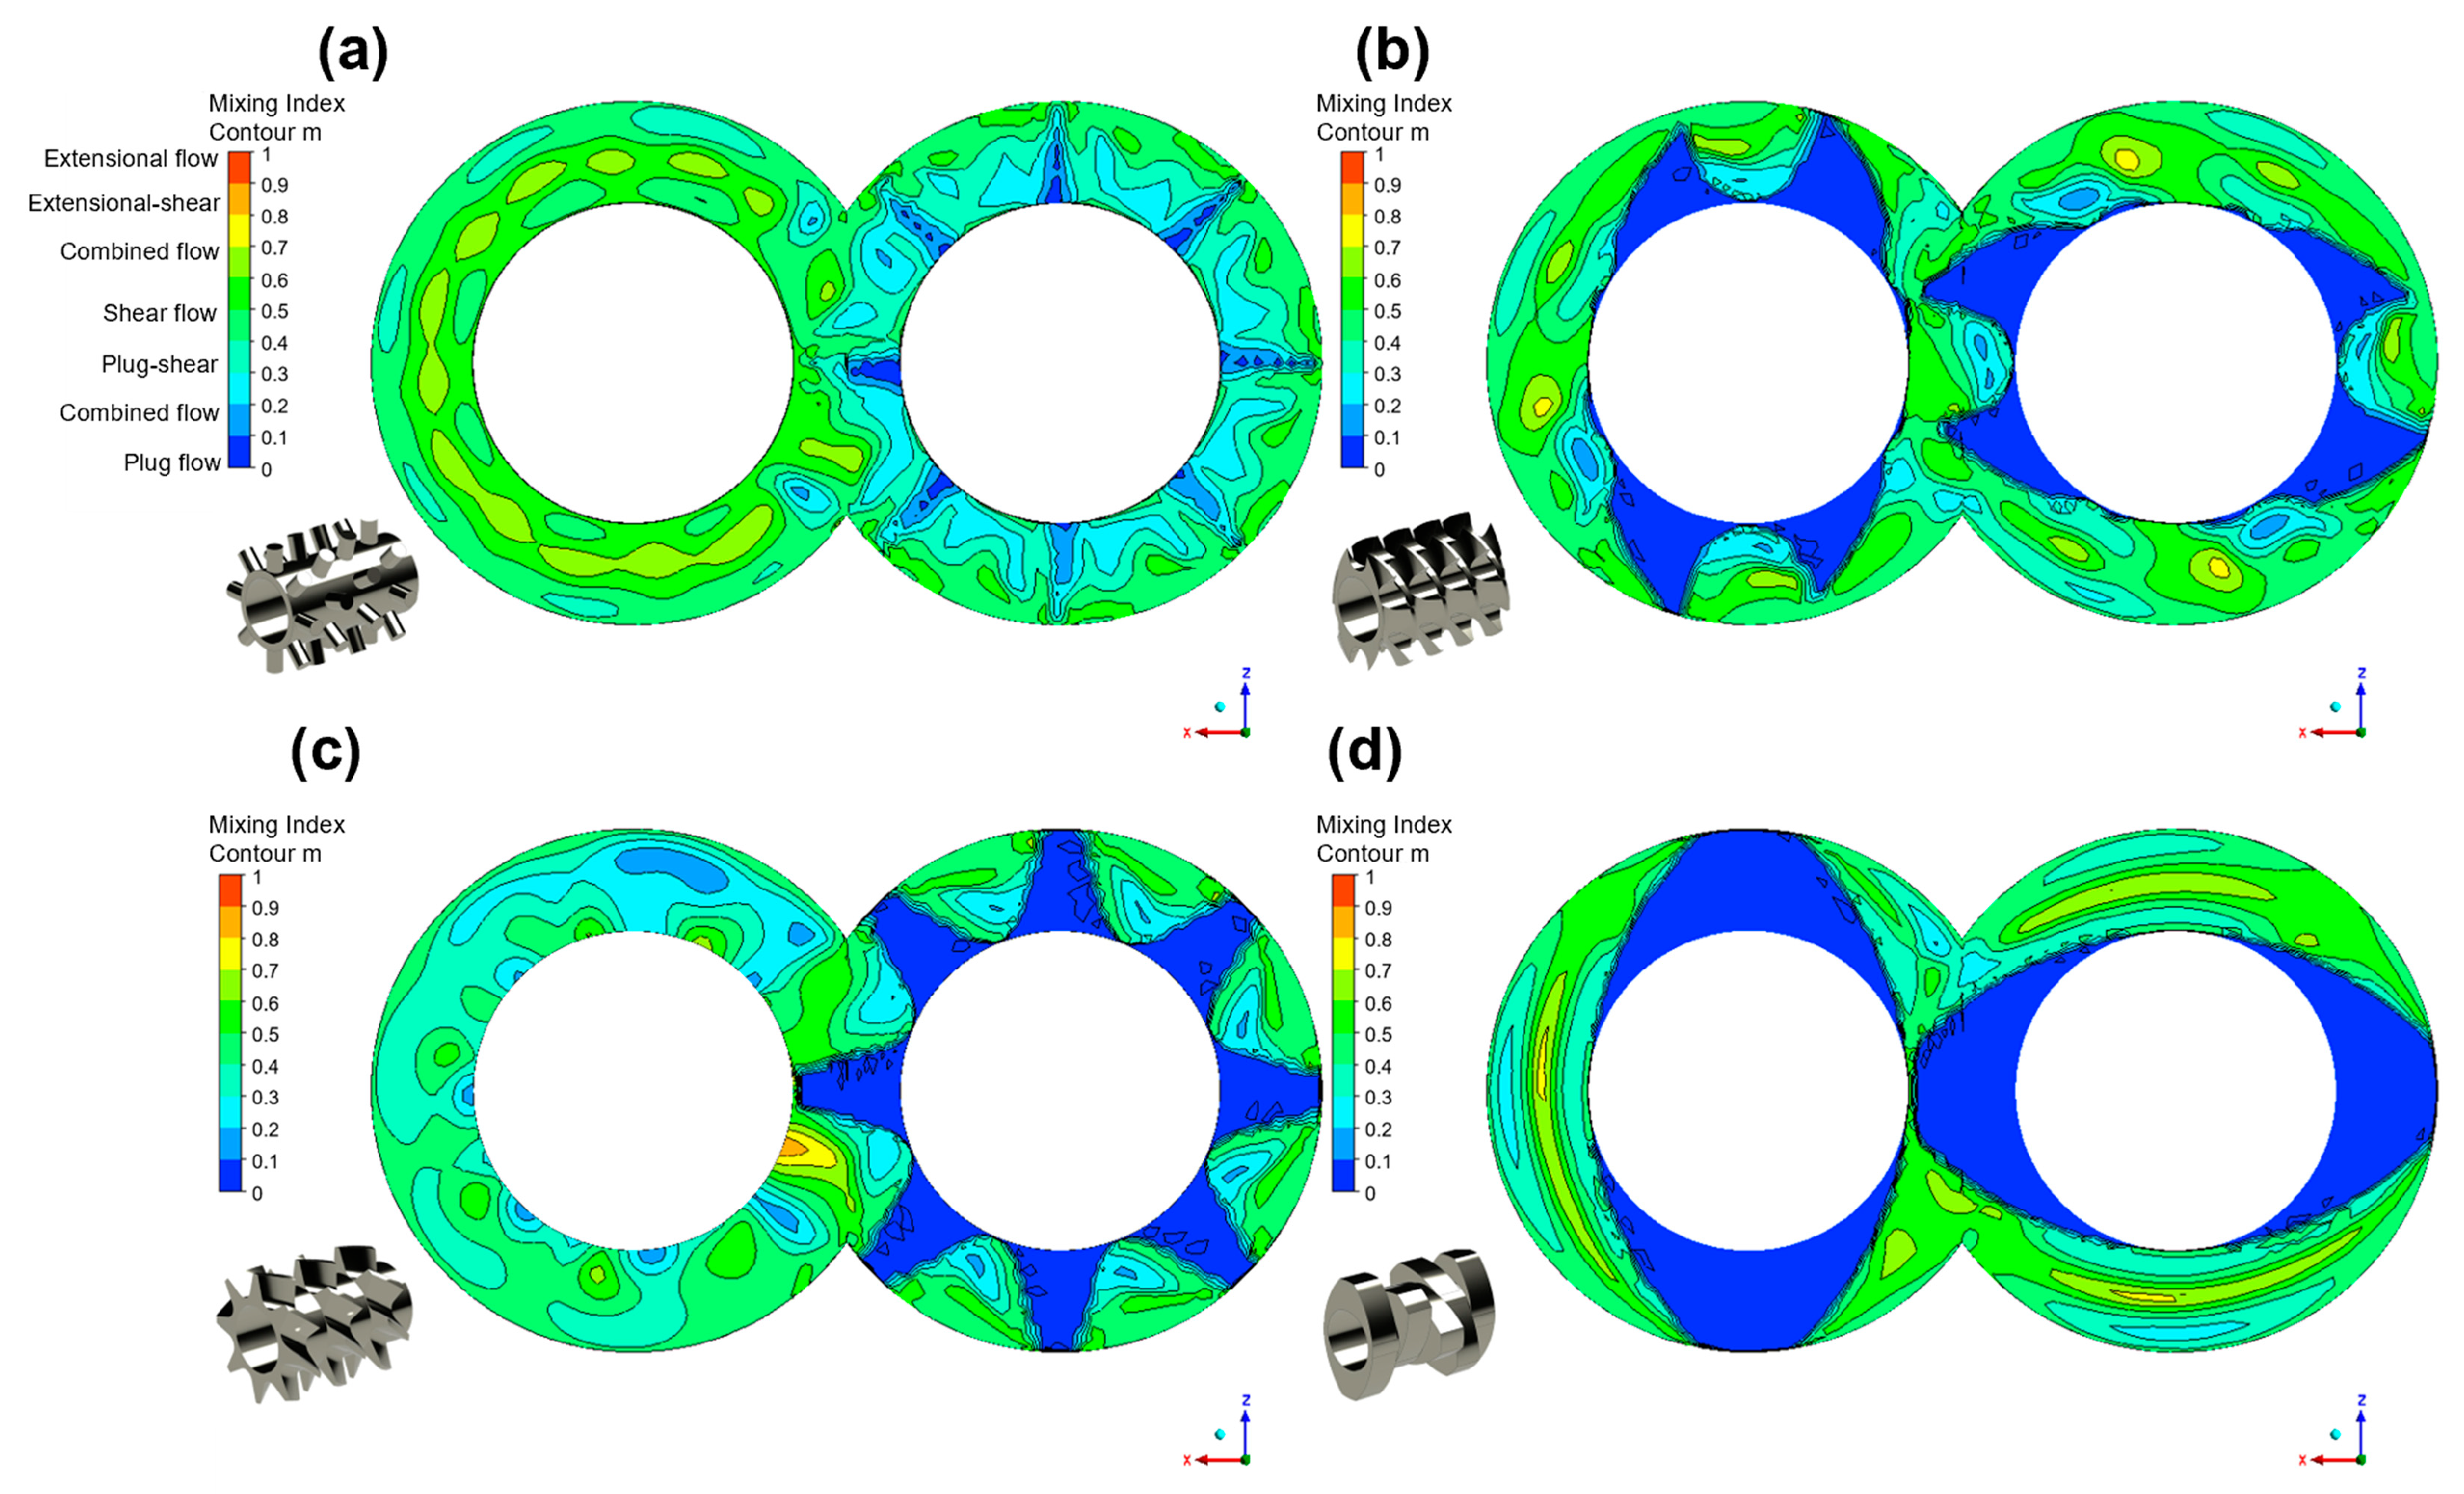
Figure 6 illustrates the dispersion of the mixing index over the output cross-sections of the four types of screw elements. Within the screw slots of all four elements, the pitch melt is generally in shear flow; however, the value of the mixing index is significantly affected by the screw structure. The flow characteristics of the modified pitch melt in Model 4 are influenced by velocity: at elevated velocities, it often exhibits plug-shearing combination flow, whereas at reduced velocities, it typically demonstrates extensional-shearing mixed flow. The flow of the modified pitch melt in Model 4 (kneading block) is primarily governed by its periodic geometry, characterized by extensional-shear flow in the narrow gaps and plug-shear flow in the open screw channels. Increasing the screw speed amplifies this geometrically induced extensional effect. As shown in Figure 6a,c, the flow of the modified pitch melt is more stable in the structurally non-working section(x–z plane) of Model 1 than in Model 3. This is likely because the non-working section lacks a conveying function. The pitch melt exiting the helical teeth of Model 3 undergoes a change in flow direction. Since conveying action is absent in the non-working section, the flow velocity decreases. In contrast, Model 1 does not exhibit this behavior. The flow field is segmented at 0.1 mm intervals along the y-axis. The mean mixing index for each segment is calculated and plotted as a numerical distribution curve in the extrusion direction, resulting in the statistical analysis diagram shown in Figure 7. Both the value and distribution of the mixing index are independent of the material and determined solely by the screw structure. The pitch melt in Models 1 and 2 exhibits a relatively stable shear flow. This stability is primarily due to their uniformly and symmetrically distributed screw slots, which are integrated with material exchange channels. In contrast, the flow characteristics in Models 3 and 4 consistently oscillate between two types of combined flows: extensional-shearing and plug-shearing. Therefore, the regular distribution of screw slots and sufficient material exchange are beneficial for stabilizing the flow characteristics.

4.2. Distribution Effect

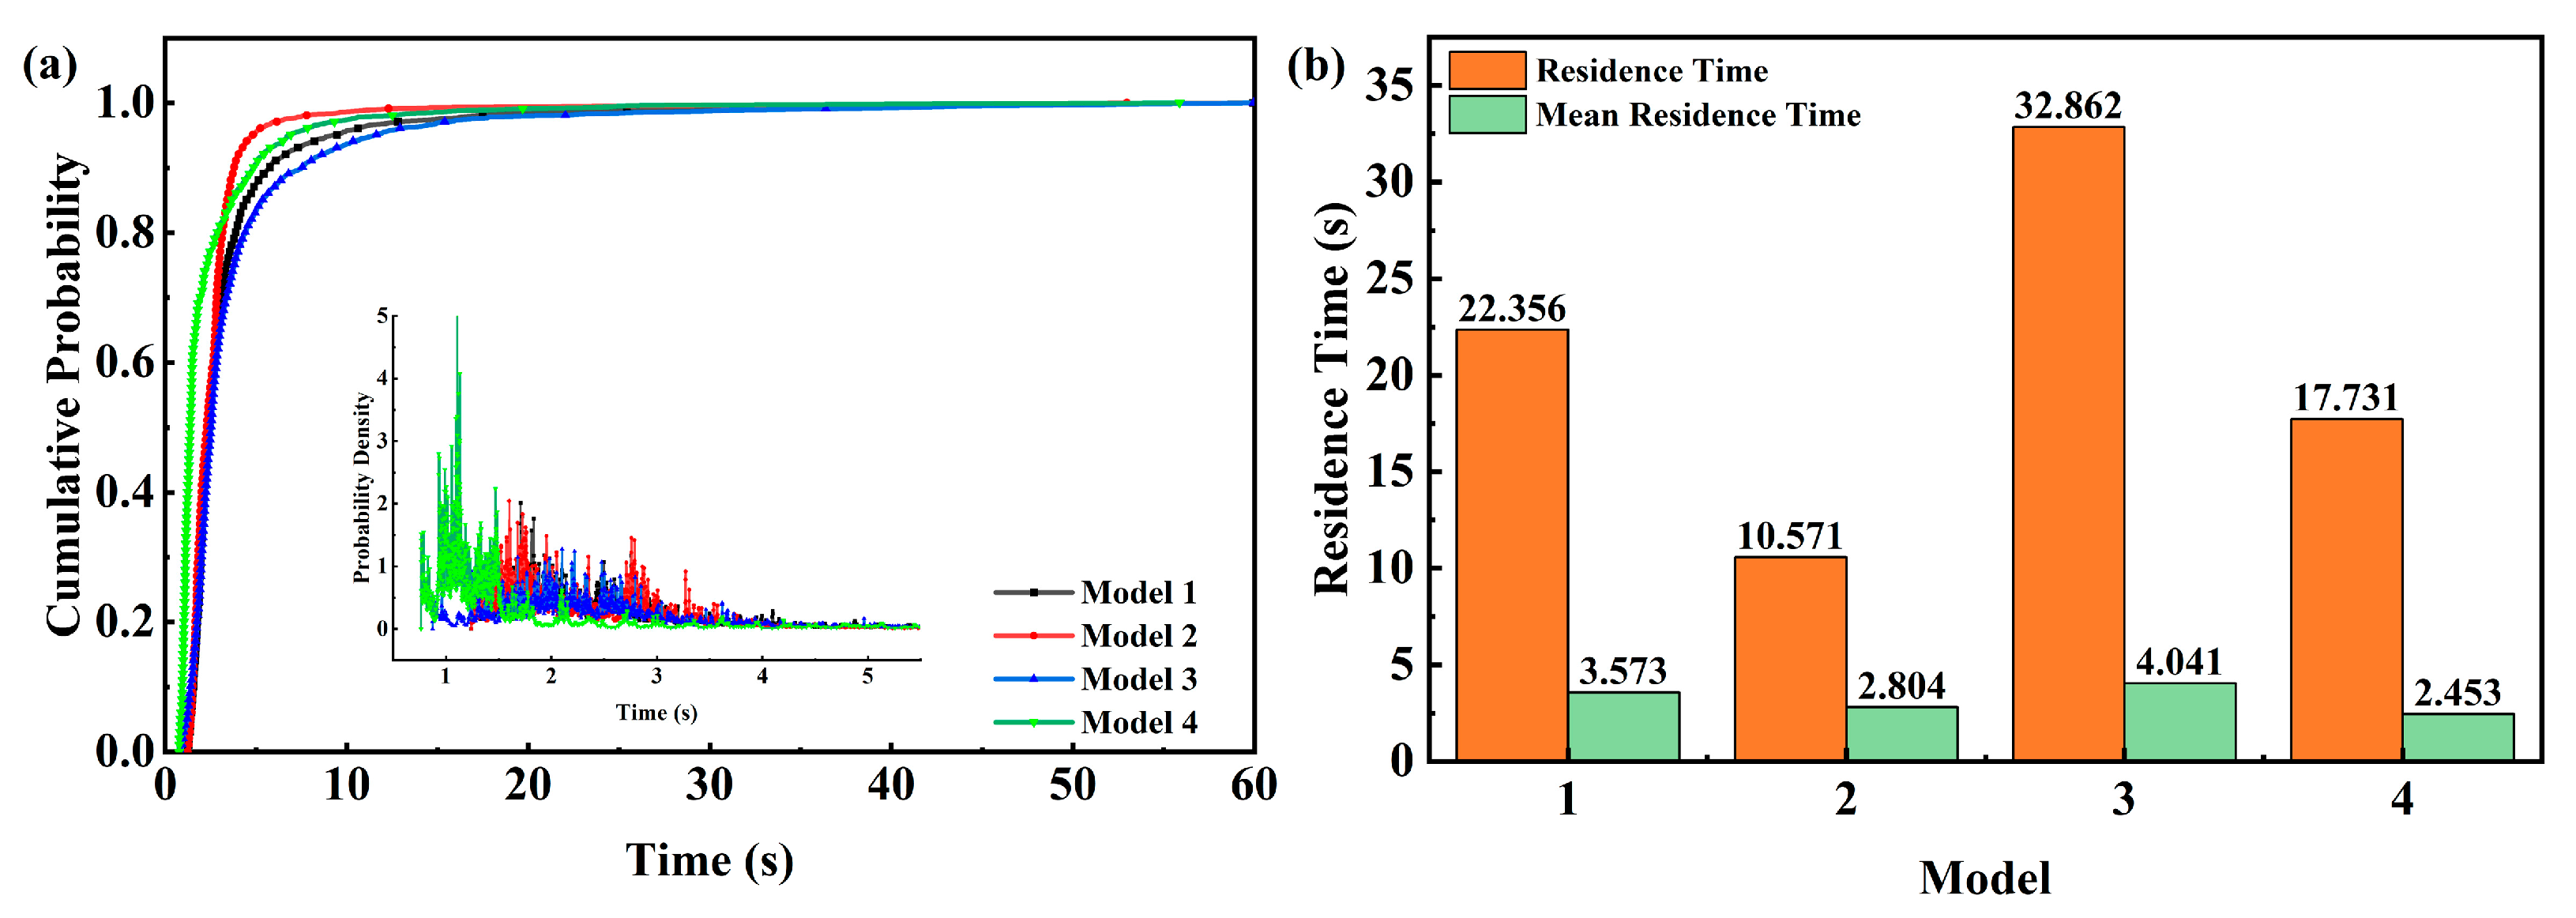
The distribution capability is assessed using two metrics: Residence Time (RT) and Distribution Index (DI). RT Calculation: The residence time distribution is derived by recording the departure time of each particle at the flow field outlet. The residence time for particles in the flow field is defined as the time difference between the departure of the first particle and the time when 99% of the particles have exited. Concurrently, cumulative probability and probability density analyses of the residence time were performed, from which the Mean Residence Time (MRT) was derived based on the probability density. Figure 8 presents the residence time analysis of IP particles in the four screw elements. The key parameters derived from this analysis—namely, the initial departure time (ts), the departure time for 99% of particles (t99), the residence time (RT), and the mean residence time (MRT)—are summarized in Table 1. The ranking of RT for IP particles across the four types of screw elements is Model 3, Model 1, Model 4, and Model 2. The Mean Residence Time (MRT) of IP particles across the four types of screw elements follows the sequence: Model 3 > Model 1 > Model 2 > Model 4. The average residence time distribution indicates that the three new mixing elements (Models 1, 2, and 3) all exhibit enhanced distribution capacity for IP particles compared to Model 4. Among them, Model 3 demonstrates the superior performance, followed by Model 1 and then Model 2. Particle retention is the primary cause of the significant disparity between the MRT and RT values. While this disparity cannot be precisely quantified, it serves as an indicator of potential retention issues. The peak value and width of the probability density function can provide further information on this phenomenon. In Model 3 and Model 1, where IP particles have a longer residence time, the probability density curves are broad and show multiple low-intensity peaks within the 1–4 s range. Increased particle retention can lead to flow instability, adversely affecting melt homogeneity and mixing efficiency. This issue is particularly pronounced during the processing of high-viscosity materials, where retention zones can act as flow bottlenecks, reducing the overall throughput and extending the production cycle. Consequently, minimizing particle retention is crucial for enhancing both production efficiency and material homogeneity. Model 2 and Model 4 exhibit distinct characteristics, as their probability density curves show higher peak values and a more concentrated distribution. This phenomenon indicates that the transport of IP particles is highly inefficient within the structures of Model 3 and Model 1. Structural elements such as pins and toothed discs exert a specific obstructive effect on the particles. While they prolong the residence time of IP particles, they also lead to challenges related to particle retention. The helical tooth configuration in Model 3 fails to achieve its intended design objective, and the resultant reverse flow is a significant contributor to IP particle retention. In contrast, the conveying screw geometry of Model 2 and Model 4 exhibit a dual nature. As the screw rotates, the flights propel the IP particles forward. However, these very flights also restrict the movement of the IP particles, preventing them from being transported rapidly in a straight path. In contrast, features such as slots and non-working section facilitate particle transport. From the standpoint of structural analysis, the configurations of mixed parts can be categorized into two types: conveyance structures and hindering structures. Therefore, the key to enhancing the axial distribution of IP particles by extending the Residence Time (RT) lies in achieving an optimal balance: the screw structure must provide sufficient obstruction to prolong residence without inducing problematic particle retention.
The calculation of DI involves establishing a uniform spatial distribution of particles within the flow field, which serves as the reference value for optimal distribution. The absolute value of the difference between the particle distribution for each moment and the optimal distribution is computed as the distribution index of the particles. A reduced value is preferable. This index comprises two sub-indices. One statistic pertains to all particles prior to any departure, denoted as the Distribution Index Particle (DIP); the other encompasses the statistics for the entire duration of the simulated flow time, referred to as the Distribution Index Full (DIF).
Figure 9 presents the distribution index of IP particles for the four screw element types. The DIP value of Model 2 is the lowest, but the DIF value of Model 1 is also the lowest. In comparison to Model 4, the spatial distribution capabilities of IP particles have been enhanced in all three new types of mixing elements. Model 2 is the most effective in achieving a uniform distribution, followed by Model 1, while the difference between Model 3 and Model 4 is negligible. The slotted-thread screw element (Model 2) achieves excellent distributive mixing capability due to its lateral exchange of material through the slots. This mechanism is consistent with the findings of Eitzlmayr et al., whose work also emphasized the key role of local obstruction structures and flow channel segmentation in enhancing distributive mixing [10]. From the initial point at 0 to ts, the DI of IP particles throughout the four categories of mixing elements exhibits a pattern of initial decline followed by subsequent increase. After roughly 10 s, the majority of the IP particles have departed. The DI of the retained IP particles progressively stabilizes due to the confluence flow of the twin screws, oscillating around a constant value. Models 2 and 4 exhibit lower retention of IP particles and greater fluctuations in their DI curves, whereas Models 1 and 3 show higher retention and less fluctuation. The uniform spatial distribution of particles is primarily governed by the configuration of the screw groove space. The screw groove distributions of Model 1 and Model 2 are uniform and symmetrical, whereas those of Model 3 and Model 4 are non–uniform, particularly in Model 4, which is consistent with the distribution index results. Consequently, the key to achieving a reduced DI and improving the spatial distribution of IP particles is a uniform screw groove spacing. In summary, by ensuring the unobstructed transport, a moderate obstruction of flow combined with uniform screw slots can extend the residence time and lower the distribution index, thus enhancing the screw structure’s ability to distribute IP particles.

4.3. Mixing Effect

Figure 10 illustrates the distribution of material particles within the four types of screw elements at the ts moment. In Model 1 and Model 2, the particles essentially fill the screw slots and a homogeneous mixture of particles at different concentrations. In contrast, the screw slots in Models 3 and 4 are not fully occupied by particles. While a limited number of particles have reached the exit, the distribution of particles with varying concentrations remains distinctly segregated. The complete transverse interchange of particles in Models 1 and 2 is the primary reason for the uniform mixing observed.
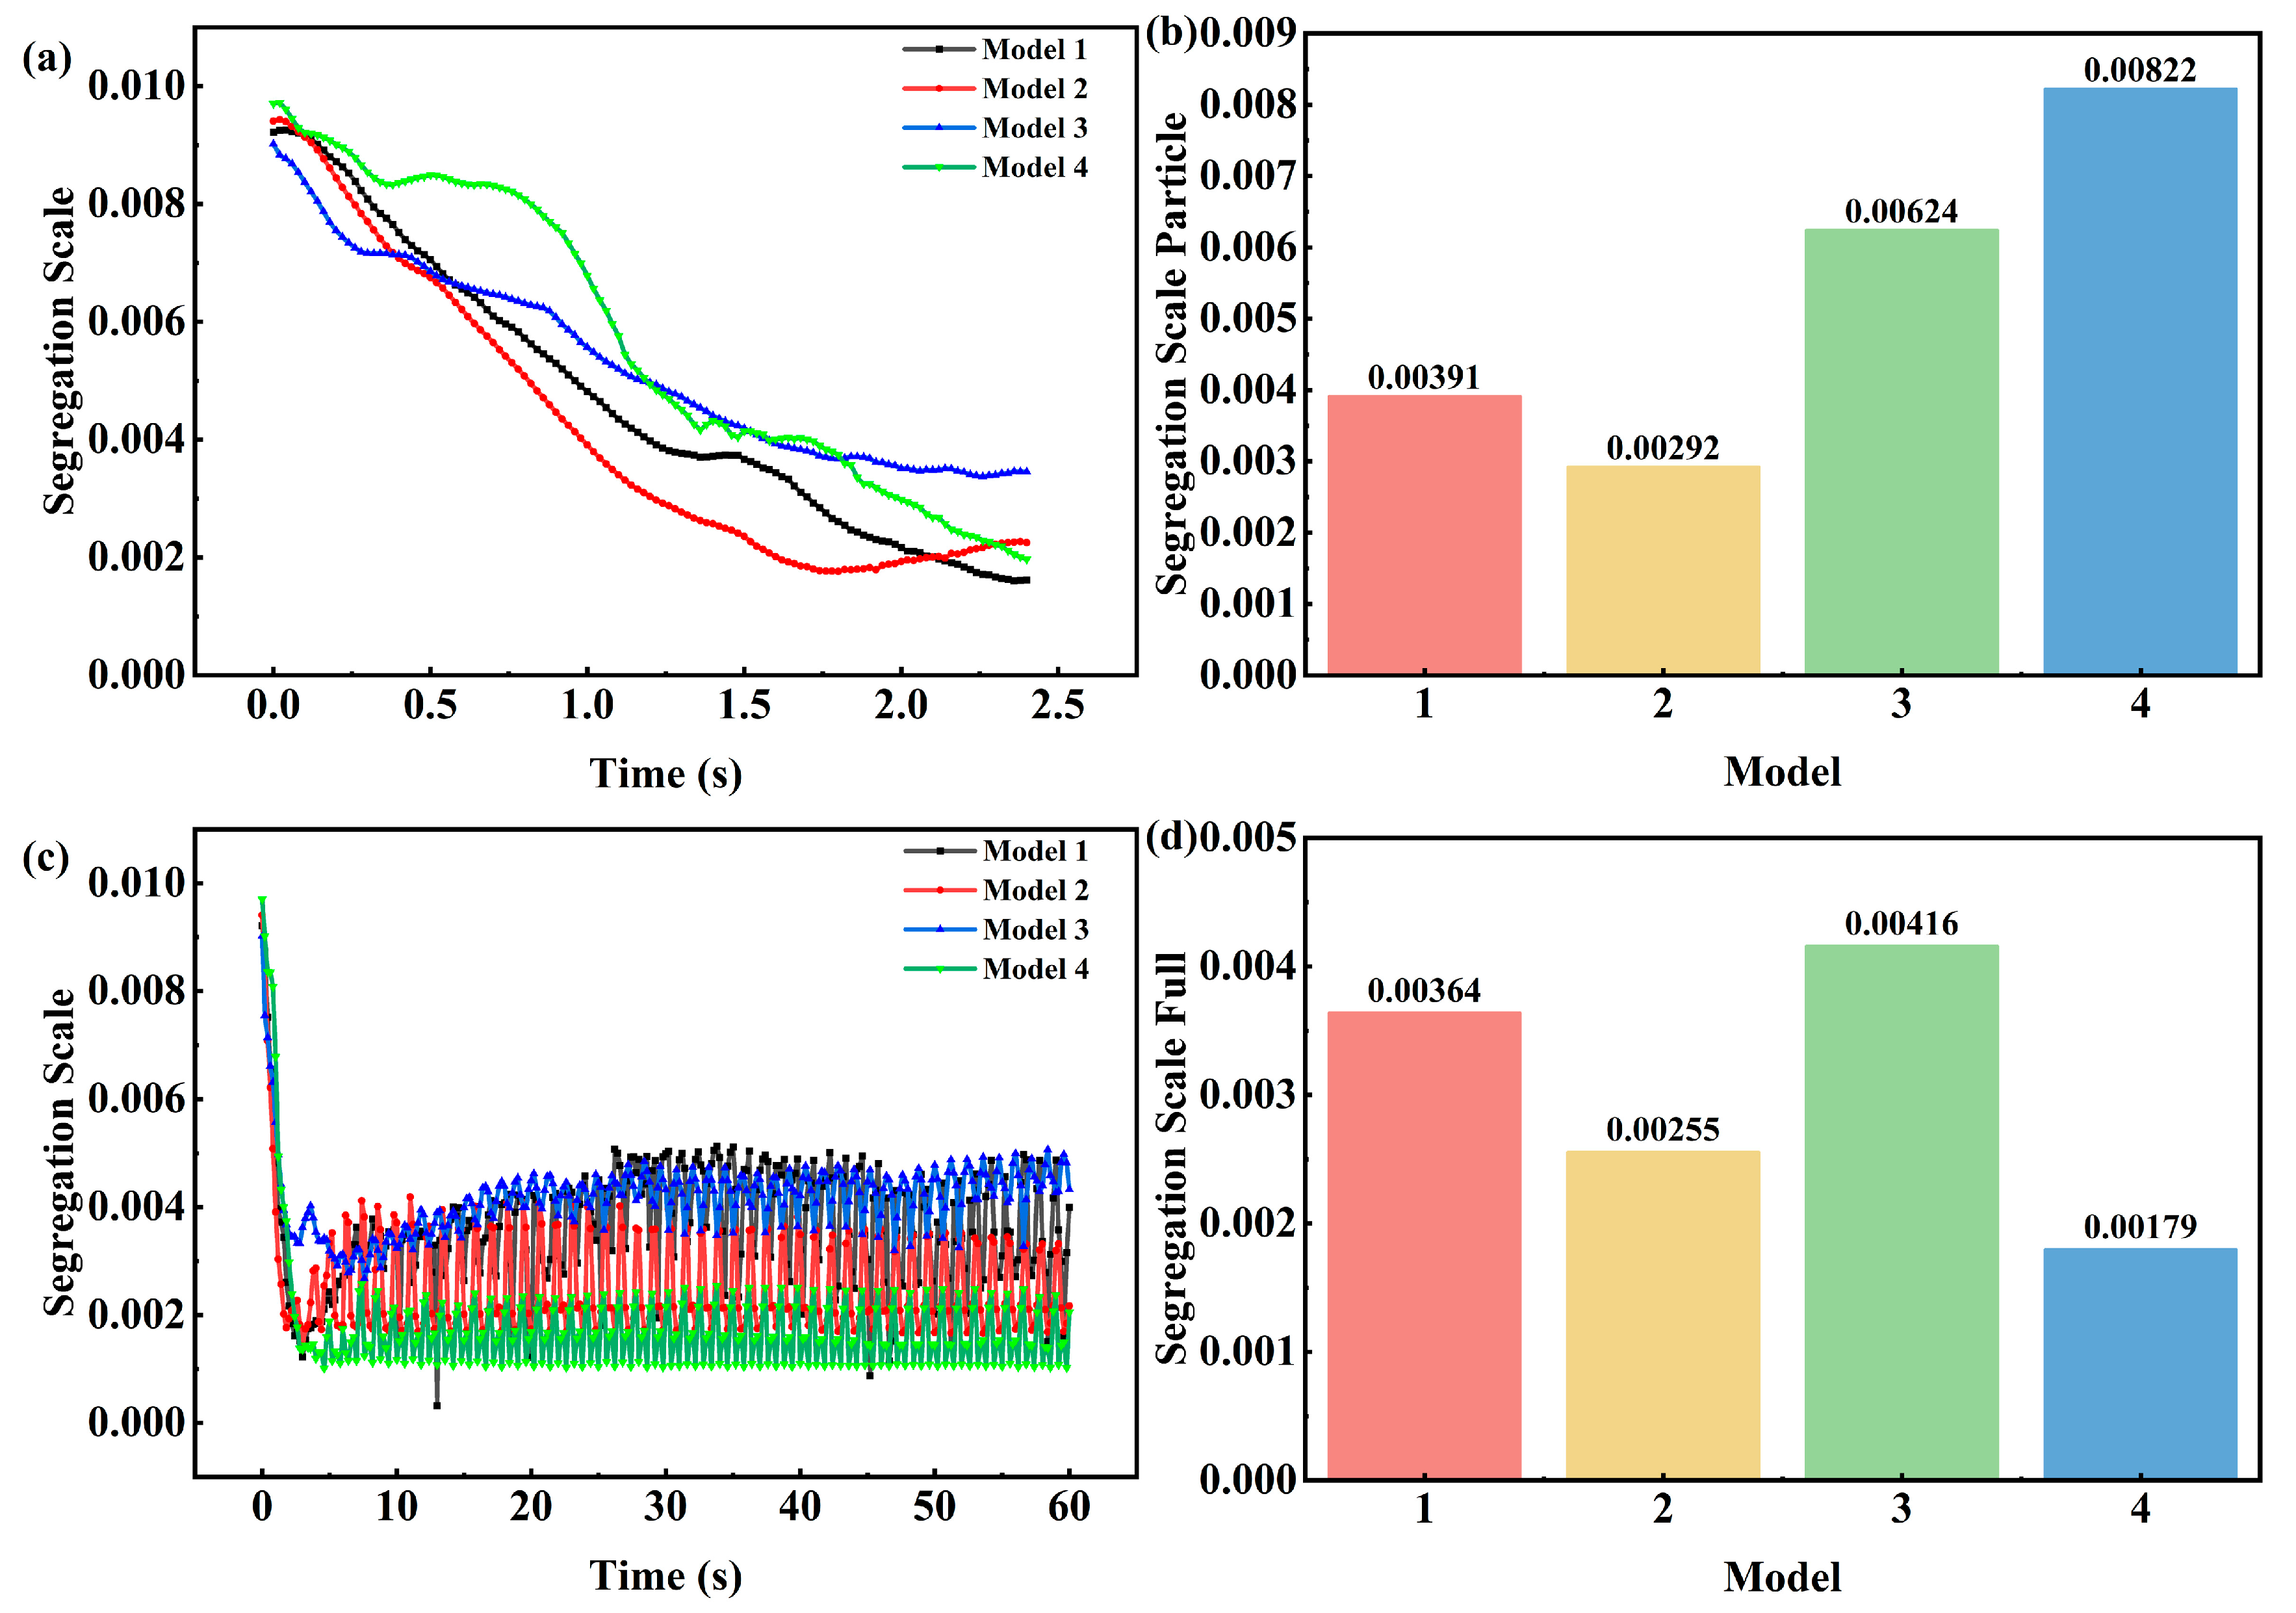
The mixing capability is assessed using two metrics: Segregation Scale (SS) and Mixing Uniformity Difference (MUD). Computation of SS: The segregation scale for each moment is determined using the concentration autocorrelation function within the statistical module of the PolyFlow program to assess the degree of mixing uniformity based on concentration values. A lower value is preferable. This indicator comprises two sub-indices. The statistics of all particles prior to the departure of any particles is documented as the Segregation Scale Particle (SSP). The alternative is the statistics for the complete duration of the simulated flow time, denoted as the Segregation Scale Full (SSF). The examination of the segregation scale regarding the mixing capability of IP particles across the four varieties of screw elements is illustrated in Figure 11. The SSP value of Model 2 is the lowest, while the SSF value of Model 4 is the lowest, succeeded by Model 2. In comparison to Model 4, the spatial mixing capabilities of IP particles in the three novel types of mixing elements have been enhanced. Model 2 exhibits the superior spatial mixing capability of IP particles. From the initial point at 0 to ts, the SS of IP particles in all four types of mixing elements exhibits a pattern of initial decline followed by subsequent increase. After roughly 10 s, the majority of the IP particles have departed. The SS of the retained IP particles progressively stabilizes due to the confluence effect of the twin screws, oscillating around a stable value. The degree of fluctuation of the curves is essentially identical, suggesting that the mixing degree of the retained particles in the modified pitch is unaffected by particle retention. The varying amplitudes suggest that the degree of mixing of the retained IP particles is constrained by structural constraints. The retention of IP particles in the screw slots of Model 4 is insufficient, being less than 5%, due to the combined effects of flow velocity and residence duration. Consequently, its SSF data lacks credibility.
The definition of Mixing Uniformity Difference (MUD): Generate positional slices along the extrusion axis and quantify the concentration values of these slices across the whole simulated flow. The proximity of the concentration value within the slice to 0.5 correlates positively with the efficacy of particle mixing within the slice. Consequently, compute the absolute value of the difference between the concentration value on the slice and 0.5 to determine the mixing uniformity difference in this slice. Subsequently, calculate the average of the mixing uniformity discrepancies across all positional slices to derive the overall mixing uniformity difference in the flow field. A reduced value is preferable. The MUD of the variance in mixing homogeneity of IP particles across the four types of screw elements is depicted in Figure 12. The MUD value of Model 2 is the lowest, whereas the MUD value of Model 3 is the greatest. The axial mixing capability of the Model 3 IP particle is much inferior, exhibiting an order of magnitude disparity compared to other mixing components. The extremely high MUD value of Model 3 is due to its gear-disc structure, which creates a flow barrier in the axial direction, severely hindering transverse exchange. This causes the material to pass between the discs primarily in a “plug flow” manner, resulting in very poor mixing. In contrast, the minor fluctuations in the MUD value at the junctions of each kneading block in Model 4 reflect its discrete and periodic mixing behavior. The examination of IP particle distribution indicates that the horizontal exchange of IP particles is equally significant as axial transit in the mixing impact of IP particles. The horizontal exchange facilitates uniform mixing of IP particles, whereas axial transport prevents the occurrence of localized mixing discrepancies. From the standpoint of structural analysis, it is essential to provide transverse exchange pathways for IP particles inside the component structure. The toothed disk of Model 3 and the kneading block of Model 4 are deficient in adequate transverse exchange channels for IP particles, resulting in an inability to achieve uniform spatial mixing. At the structural junction, IP particles may be exchanged across the structural gap; however, the frequency of these exchanges is insufficient to enhance the spatial mixing capability of IP particles. Owing to the meshing configuration of Model 4, IP particles may be exchanged laterally during the meshing process, and it is advisable to maintain the values of MUD at a minimal level. Model 1 and Model 2 differ in structure, featuring voids and slots that facilitate the horizontal exchange of IP particles, hence enhancing their spatial mixing capability. In conclusion, the essential factor for achieving a reduced segregation scale, minimizing mixing uniformity difference, and enhancing the mixing capability of IP particles is to augment the horizontal exchange of IP particles to ensure uniform mixing.

4.4. Shear Effect

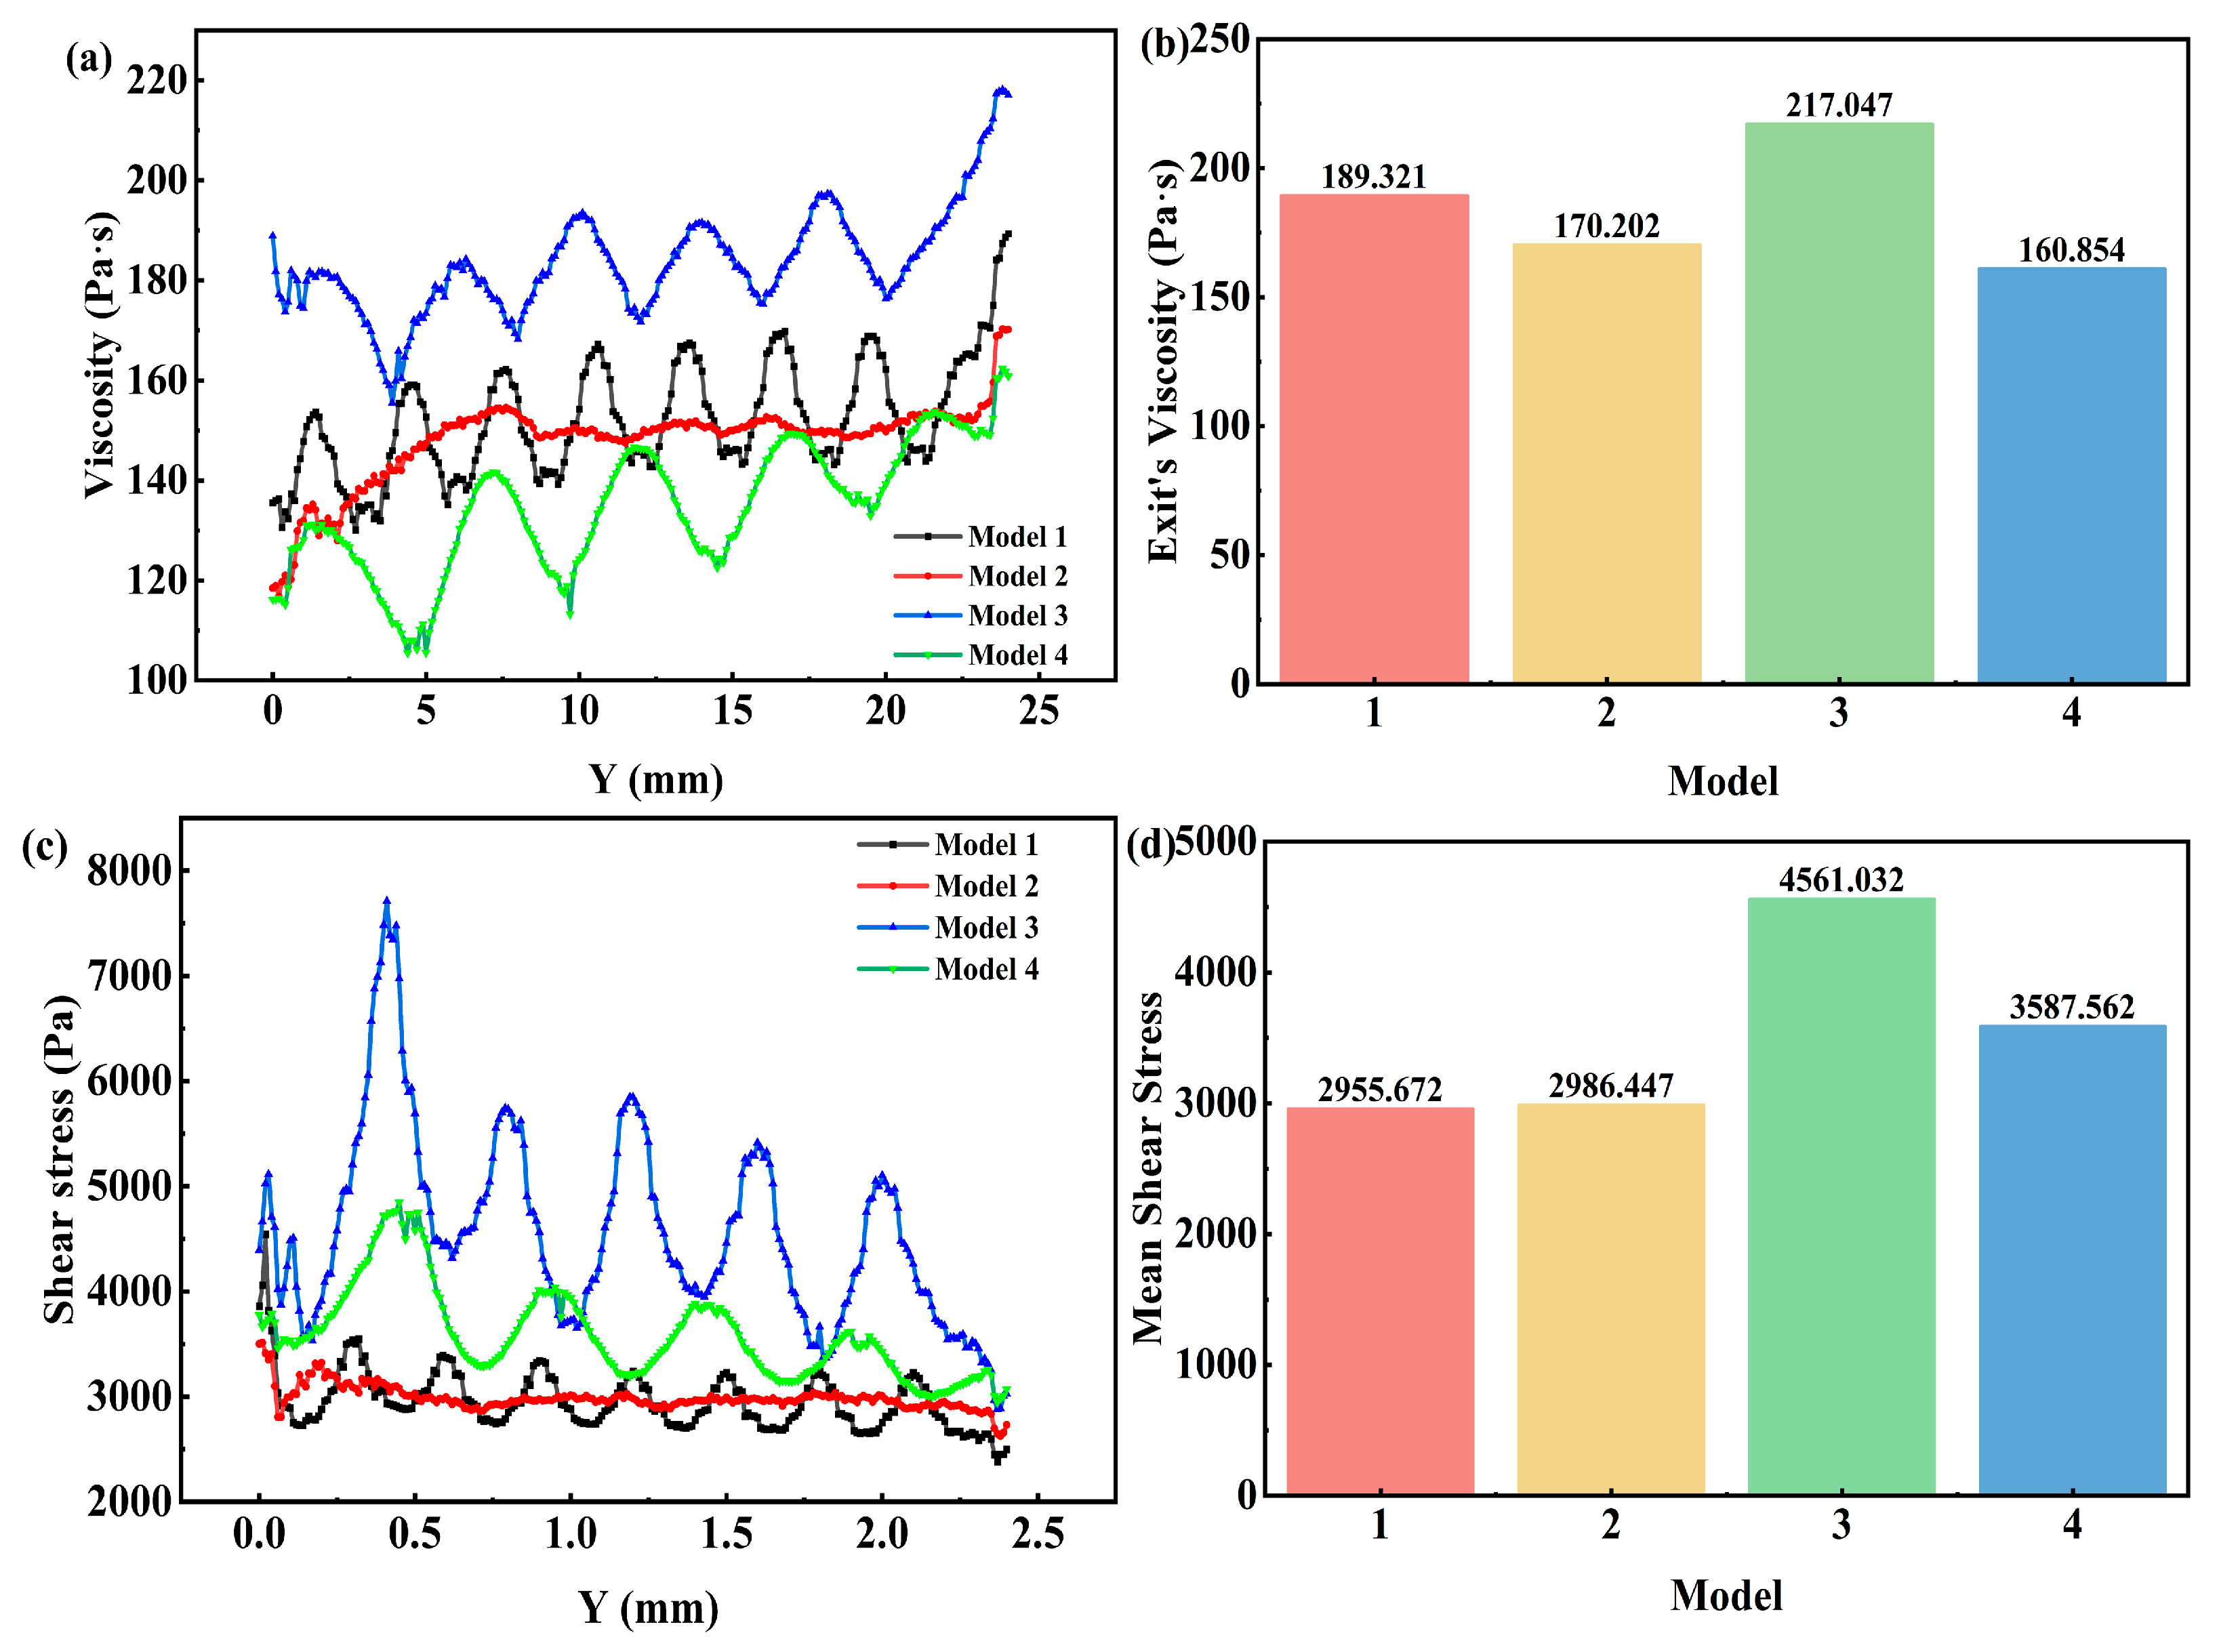
Shear capability is assessed using two metrics: Exit Viscosity Index (EVI) and Mean Shear Stress (MSS). Evaluation of EVI: Determine the mean particle viscosity at the outflow of the flow field. A reduced value is preferable. The calculation of the Mean Shear Stress (MSS) involves creating position slices along the extrusion direction, quantifying the shear stress values for each slice, and subsequently averaging these values to determine the overall average shear stress of the entire flow field. A greater value indicates superior quality. The viscosity study of IP particles in the four screw components is illustrated in Figure 13a,b. The EVI values are ordered from lowest to highest as follows: Model 2, Model 1, Model 3, and Model 4, which has the lowest value. The shear stress measurement of IP particles throughout the four screw components is illustrated in Figure 13c,d. The MSS value of Model 3 is the highest, however the MSS values of other new mixed components are inferior to that of Model 4. The toothed disk of Model 3 and the kneading block of Model 4 are both segmented structures, and the IP particles experience significant shear as they traverse the gap at the structural junction, aligning with the numerical performance. The two asymmetrical configurations of meshing and staggered arrangement enhance the shear effect; nevertheless, the non-working section in the staggered arrangement of Model 1 leads to insufficient local shear force, thereby impacting the viscosity performance. In comparison to Model 4, Model 3 exhibits a considerable enhancement in overall IP particle shear capability; however, the disparity in IP particle shear performance among the four component pairings is not pronounced. Of the three novel mixing components, Model 2 exhibits little curve fluctuation, consistent numerical values, and the highest shear capacity stability. In summary, achieving reduced outlet viscosity and increased shear stress to enhance the shear capacity of IP particles depends on the integration of meshing, staggered asymmetric configuration, and minimal clearance, while the establishment of an empty rod area should be circumvented.

4.5. Comprehensive Evaluation of Mixing Effect

This study aims to reflect the relative importance of various performance indicators, such as distribution, mixing, and shear ability, on the overall melt mixing effect. Therefore, a new comprehensive evaluation system is introduced to allocate relevant weights to the different indicators mentioned above, such as distribution ability, mixing ability, and shear ability. Weight allocation follows the principle of hierarchical importance: in the first-level indicators, the parameters MUD, EVI, and MSS related to the overall distribution ability and overall shear ability directly affect the macroscopic mixing efficiency, thus the maximum score is set to 2. In the second-level indicators, the sub-indicators RT, MRT, DIP, DIF, SSP, and SSF reflect local flow and mixing characteristics, with the maximum score set to 1. Currently, there is no universally accepted standard for the absolute importance weights of these indicators in screw mixing in the academic community. The aim of the study is focused on relative comparison rather than absolute scoring. The main goal of this study is not to assign an absolute “score” to the mixing effect of screw elements, but to systematically compare the relative performance of different screw structures. The IP mixing impact was assessed based on the indicators presented in Figure 14a.
Figure 14 illustrates the thorough assessment of the mixing impact of four novel mixing component structures on IP particles and their corresponding enhancement rates. The mixing effect of the four particle types on IP is ranked as follows: Model 2, Model 1, Model 4, and Model 3, from best to worst. For IP particles, the comprehensive evaluation of Model 2 is 9.531, compared to 8.758 for Model 4, representing an increase of 8.825%, the highest rate of improvement and the most effective mixing outcome. The thorough assessment of Model 1 is 9.305, reflecting a 6.253% gain, and it also demonstrates a favorable mixing impact. The overall evaluation of Model 3 is 8.100, reflecting a drop of 7.506%, which is considerably inferior to that of Model 4, indicating a markedly inadequate mixing effect. In conclusion, regarding the mixing efficacy of the four molds on standard pitch, Model 2 exhibits the superior mixing performance.

5. Conclusions

This paper optimized and enhanced the most prevalent mixing components in parallel twin-screw extruders using the PTA technology and spinnable pitch as raw materials. Three novel mixing screw components were designed, and a method for evaluating mixing efficacy was established based on the Polyflow statistics module. The mixing effects of the three new components were subsequently compared and analyzed. The configuration and structural attributes of the mixing components in the parallel twin-screw extruder significantly influence the mixing efficacy of spinnable pitch, with simulation outcomes reflecting consistent effects across many parameters of spinnable pitch. Regarding component configuration, the meshing arrangement is superior to the staggered arrangement due to the absence of a non-working section. This results in a uniform and stable flow of material particles, enhancing the overall stability of the shear effect. Additionally, the presence of minimal spatial gaps strengthens the local shear capacity. In the structural design of a singular component, an equitable distribution of the conveying structure, along with the proportion and placement of the obstruction structure, is essential to ensure the unobstructed transportation of material particles while moderately impeding their flow. This approach, coupled with the maintenance of a uniform and symmetrical spatial distribution of the spiral groove, can enhance the distribution of material particles. Furthermore, the uniformity of mixing can be augmented by establishing sufficient horizontal exchange channels for material particles and reinforcing horizontal exchange.
The flow mixing simulation results indicate that Model 2 of the slotted-thread mixing element, featuring six slots and a slot angle of 30°, exhibits the superior mixing performance within the current model library. The construction considers the movement, blockage, and lateral exchange of IP particles, while the distribution of spiral slots is uniform and symmetrical, demonstrating effective mixing capability for IP particle distribution. Furthermore, the configuration of the two components eliminates the necessity for an unoccupied rod area, resulting in a homogeneous and stable flow of IP particles and overall shear. In comparison to the kneading block SK45 (Model 4), the mixing efficacy on IP has enhanced by 8.825%.

Supplementary Materials

The following supporting information can be downloaded at: https://www.mdpi.com/article/10.3390/modelling6040140/s1, Figure S1: Schematic illustration of the screw geometry and computational fluid domain mesh; Figure S2: Velocity distribution cloud diagrams of the flow field under different screw rotational speeds: (a) inlet XZ section; (b) extrusion direction XY section; (c) outlet XZ section; Figure S3: Statistical analysis of the flow velocity in the extrusion direction: (a) curve representing the average distribution of flow velocity in the extrusion direction; (b) analysis of the flow velocity values in the extrusion direction; Figure S4: Contours of shear rate distribution on the XY-plane under various screw speeds; Figure S5: Statistical analysis of shear rate values along the extrusion direction: (a) mean distribution curve of shear rate along the extrusion direction; (b) numerical analysis of shear rate along the extrusion direction; Figure S6: Viscosity distribution contour plots on the XY cross-section at different screw speeds: (a) 315 °C; (b) 325 °C; (c) 335 °C; (d) 345 °C; (e) 355 °C; Figure S7: Statistical analysis diagram of viscosity along the extrusion direction: (a) 315 °C; (b) 325 °C; (c) 335 °C; (d) 345 °C; (e) 355 °C; (f) influence of process conditions on viscosity values; Figure S8: Pressure distribution contour plots on the XY cross-section at different screw speeds: (a) 315 °C; (b) 325 °C; (c) 335 °C; (d) 345 °C; (e) 355 °C; Figure S9: Statistical analysis diagram of pressure along the extrusion direction: (a) 315 °C; (b) 325 °C; (c) 335 °C; (d) 345 °C; (e) 355 °C; (f) influence of process conditions on pressure values; Figure S10: Shear stress distribution contour plots on the XY cross-section under different screw speeds: (a) 315 °C; (b) 325 °C; (c) 335 °C; (d) 345 °C; (e) 355 °C; Figure S11: Statistical analysis diagram of shear stress along the extrusion direction: (a) 315 °C; (b) 325 °C; (c) 335 °C; (d) 345 °C; (e) 355 °C; (f) influence of process conditions on shear stress values; Figure S12: Softening point curves: (a) Softening point curves obtained from five tests; (b) First derivatives of the five softening point curves; Figure S13: Temperature–viscosity curves: (a) Temperature–viscosity curves obtained at different shear rates; (b) Fitted temperature–viscosity curves at different shear rates; Figure S14: Result of the numerical fitting of the IP rheological model; Figure S15: Detailed dimension drawings of the four screw elements; Figure S16: Schematic diagram of the arrangement of the four models.

Author Contributions

Conceptualization, Z.S. and K.Q.; data curation, W.P. and Z.S.; formal analysis, W.P., Z.S. and W.J.; investigation, Z.S., G.Z. and B.Z.; methodology, Z.S., H.C. and K.Q.; supervision, H.C. and K.Q.; validation, Z.S. and W.J.; visualization, W.P. and Z.S.; writing—original draft, W.P., Z.S. and K.Q.; writing—review and editing, W.P., Z.S. and W.J.; funding acquisition, K.Q. All authors have read and agreed to the published version of the manuscript.

Funding

This research received no external funding.

Data Availability Statement

Data are contained within this article.

Conflicts of Interest

Author Bo Zhu was employed by the company Shandong Huilu Carbon Materials Technology Co., Ltd. The remaining authors declare that the research was conducted in the absence of any commercial or financial relationships that could be construed as a potential conflict of interest.

References

  1. Yan, C.; Yan, J.; Zhang, Z.; Yu, D.; Wang, S.; Jiang, X.; Ai, C.; Leng, Z. Screw extrusion process used in the polymer modified asphalt field: A review. J. Clean. Prod. 2024, 448, 141592. [Google Scholar] [CrossRef]
  2. Gaspar-Cunha, A.; Covas, J.A.; Sikora, J. Optimization of Polymer Processing: A Review (Part I—Extrusion). Materials 2022, 15, 384. [Google Scholar] [CrossRef]
  3. Lewandowski, A.; Wilczyński, K.J.; Nastaj, A.; Wilczyński, K. A composite model for an intermeshing counter-rotating twin-screw extruder and its experimental verification. Polym. Eng. Sci. 2015, 55, 2838–2848. [Google Scholar] [CrossRef]
  4. Lin, B.; Thümen, A.; Heim, H.; Scheel, G.; Sundararaj, U. Nylon 66/Clay Nanocomposite Structure Development in a Twin Screw Extruder. Polym. Eng. Sci. 2009, 49, 824–834. [Google Scholar] [CrossRef]
  5. Lewandowski, A.; Wilczyński, K. Modeling of twin screw extrusion of polymeric materials. Polymers 2022, 14, 274. [Google Scholar] [CrossRef] [PubMed]
  6. Dong, S.; Li, J.; Zhang, S.; Li, N.; Li, B.; Zhang, Q.; Ge, L. Excellent microwave absorption of lightweight PAN-based carbon nanofibers prepared by electrospinning. Colloids Surf. A Physicochem. Eng. Asp. 2022, 651, 129670. [Google Scholar] [CrossRef]
  7. Kang, D.J.; Pal, K.; Bang, D.S.; Kim, J.K. Synergistic Effect on Crystalline Structure of Polyvinylidene Fluoride Nanocomposites with Multiwalled Carbon Nanotube Loading by a Twin Screw Extruder. J. Appl. Polym. Sci. 2011, 121, 226–233. [Google Scholar] [CrossRef]
  8. Laske, S.; Witschnigg, A.; Selvasankar, R.K.; Holzer, C. Measuring the residence time distribution in a twin screw extruder with the use of NIR-spectroscopy. J. Appl. Polym. Sci. 2014, 131, 39919. [Google Scholar] [CrossRef]
  9. Naser, M.A.; Moeaz, W.A.; El-Wakad, M.T.; Abdo, M.S. Design a Single Screw Extruder for Polymer-Based Tissue Engineering. Biomed. Eng. Appl. Basis Commun. 2024, 36, 2450015. [Google Scholar] [CrossRef]
  10. Eitzlmayr, A.; Khinast, J. Co-rotating twin-screw extruders: Detailed analysis of conveying elements based on smoothed particle hydrodynamics. Part 2: Mixing. Chem. Eng. Sci. 2015, 134, 880–886. [Google Scholar] [CrossRef]
  11. Ohara, M.; Sasai, Y.; Umemoto, S.; Obata, Y.; Sugiyama, T.; Tanifuji, S.-I.; Kihara, S.-I.; Taki, K. Experimental and numerical simulation study of devolatilization in a self-wiping corotating parallel twin-screw extruder. Polymers 2020, 12, 2728. [Google Scholar] [CrossRef]
  12. Bravo, V.L.; Hrymak, A.N.; Wright, J.D. Numerical simulation of pressure and velocity profiles in kneading elements of a co-rotating twin screw extruder. Polym. Eng. Sci. 2000, 40, 525–541. [Google Scholar] [CrossRef]
  13. Ishikawa, T.; Amano, T.; Kihara, S.; Funatsu, K. Flow patterns and mixing mechanisms in the screw mixing element of a co-rotating twin-screw extruder. Polym. Eng. Sci. 2002, 42, 925–939. [Google Scholar] [CrossRef]
  14. Russell, K. How to Configure Your Twin-Screw Extruder-Part 2. Plast. Technol. 2023, 69, 24–26+28. [Google Scholar]
  15. Potente, H.; Schultheis, S.M. Investigations of the Residence Time and the Longitudinal Mixing Behavior in Counter-rotating Twin Screw Extruders. Int. Polym. Process. 1989, 4, 255–261. [Google Scholar] [CrossRef]
  16. Oberlehner, J.; Cassagnau, P.; Michel, A. Local residence time distribution in a twin screw extruder. Chem. Eng. Sci. 1994, 49, 3897–3907. [Google Scholar] [CrossRef]
  17. Kaushal, A.; Singh, V. Analysis of mechanical, thermal, electrical and EMI shielding properties of graphite/carbon fiber reinforced polypropylene composites prepared via a twin screw extruder. J. Appl. Polym. Sci. 2021, 139, 51444. [Google Scholar] [CrossRef]
  18. Brzoskowski, R.; Kubota, K.; Chung, K.; White, J.L.; Weissert, F.C.; Nakajima, N.; Min, K. Experimental and Theoretical Study of the Flow Characteristics of Rubber Compounds in an Extruder Screw. Int. Polym. Process. 1987, 2, 130–136. [Google Scholar] [CrossRef]
  19. Charasseangpaisarn, T.; Wiwatwarrapan, C.; Thunyakitpisal, P.; Srimaneepong, V. Development of poly(methyl methacrylate)/poly(lactic acid) blend as sustainable biomaterial for dental applications. Sci. Rep. 2023, 13, 16904. [Google Scholar] [CrossRef]
  20. Ren, J.; Zhao, J.; Liu, X. The application of genetic algorithm for the design of screw in twin-screw extruder. World J. Eng. 2017, 14, 451–458. [Google Scholar] [CrossRef]
  21. Robinson, M.; Cleary, P.W. Flow and mixing performance in helical ribbon mixers. Chem. Eng. Sci. 2012, 84, 382–398. [Google Scholar] [CrossRef]
  22. Hu, D.D.; Chen, J.N. Simulation of particle trajectories and statistical analysis in twin-screw extruders. Funct. Graded Mater. Vii 2003, 423, 753–757. [Google Scholar]
  23. Hwang, W.R.; Kwon, T.H. Dynamical modeling of chaos single-screw extruder and its three-dimensional numerical analysis. Polym. Eng. Sci. 2000, 40, 702–714. [Google Scholar] [CrossRef]
  24. Kadyirov, A.; Gataullin, R.; Karaeva, J. Numerical simulation of polymer solutions in a single-screw extruder. Appl. Sci. 2019, 9, 5423. [Google Scholar] [CrossRef]
  25. Acur, E.; Vlachopoulos, J. Numerical simulation of a single-screw plasticating extruder. Polym. Eng. Sci. 1982, 22, 1084–1094. [Google Scholar] [CrossRef]
  26. Yang, H.; Manas-Zloczower, I. Flow field analysis of the kneading disc region in a co-rotating twin screw extruder. Polym. Eng. Sci. 1992, 32, 1411–1417. [Google Scholar] [CrossRef]
  27. Fard, A.S.; Anderson, P.D. Simulation of distributive mixing inside mixing elements of co-rotating twin-screw extruders. Comput. Fluids 2013, 87, 79–91. [Google Scholar] [CrossRef]
  28. Qi, D.; Li, S.; Zhao, C.; Xie, W.; Li, A. Structural optimization of multi-pipe earth to air heat exchanger in greenhouse. Geothermics 2022, 98, 102288. [Google Scholar] [CrossRef]
  29. Bai, H.; Qin, W.; Jia, S.; Ren, L.; An, Y.; Bao, J. A New Type of 3D Printing Molding Equipment: Overall Structural Design and the Numerical Simulation for the Flow Field Characteristics of its Screw Module. Int. J. Precis. Eng. Manuf. 2021, 22, 1639–1656. [Google Scholar] [CrossRef]
  30. Lv, X.; Hao, X.; Ou, R.; Liu, T.; Guo, C.; Wang, Q.; Yi, X.; Sun, L. Rheological Properties of Wood-Plastic Composites by 3D Numerical Simulations: Different Components. Forests 2021, 12, 417. [Google Scholar] [CrossRef]
  31. Ren, R.; Huijun, H.; Chenxi, C. Preparation method of pitch based carbon fiber and its industrialization research. Appl. Chem. Ind. 2018, 47, 2254–2259. [Google Scholar]
Figure 1. Various types of screw elements: (a) Conveying elements SS24, (b) Shear elements SK45, (c) Mixing elements.
Modelling 06 00140 g001
Figure 2. Mixing element geometry model: (a) Staggered-pin mixing element (Model 1), (b) Slotted-thread mixing element (Model 2), (c) gear-disc mixing element (Model 3), (d) kneading block SK45 (Model 4).
Modelling 06 00140 g002
Figure 3. Grid Independence Verification Statistics: (a) Twin-screw model used for grid independence verification, (b) Screw mesh independence verification by shear rate, (c) Screw mesh independence verification by pressure, (d) Fluid mesh independence verification by shear rate, (e) Fluid mesh independence verification by pressure.
Modelling 06 00140 g003
Figure 4. Fluid region meshing: (a) Fluid model, where different gray shades represent the structural details of the twin-screw fluid domain; (b) Fluid model network partitioning, where yellow lines denote mesh boundaries and different color regions represent distinct mesh partitions for computational convenience.
Modelling 06 00140 g004
Figure 5. Velocity field distribution at the exit section of four kinds of screw elements: (a) Model 1, (b) Model 2, (c) Model 3, (d) Model 4.
Modelling 06 00140 g005
Figure 6. Distribution of the mixing index at the outlet cross–section for four types of screw elements: (a) Model 1, (b) Model 2, (c) Model 3, (d) Model 4.
Modelling 06 00140 g006
Figure 7. Mean mixing index distribution along the extrusion direction (y-axis). Y (mm) represents the axial distance from the inlet plane.
Modelling 06 00140 g007
Figure 8. RT analysis of four types of screw elements: (a) RT cumulative probability and probability density of IP particles, (b) RT numerical statistics of IP particles.
Modelling 06 00140 g008
Figure 9. DI analysis of IP particles: (a) Numerical distribution of DIP, (b) Numerical statistics of DIP, (c) Numerical distribution of DIF, (d) Numerical statistics of DIF.
Modelling 06 00140 g009
Figure 10. Particle distribution of four types of screw elements at the initial particle departure time: (a) Model 1, (b) Model 2, (c) Model 3, (d) Model 4. Red particles enter from the left inlet, and blue particles enter from the right inlet.
Modelling 06 00140 g010
Figure 11. SS index analysis of IP particles: (a) Numerical distribution of SSP, (b) Numerical statistics of SSP, (c) Numerical distribution of SSF, (d) Numerical statistics of SSF.
Modelling 06 00140 g011
Figure 12. MUD analysis of four types of screw elements: (a) Numerical distribution of IP particle MUD, (b) Numerical statistics of IP particle MUD.
Modelling 06 00140 g012
Figure 13. Shear capacity analysis of IP particles: (a) Axial numerical distribution of viscosity, (b) Numerical statistics of EVI, (c) Axial numerical distribution of shear stress, (d) Numerical statistics of MSS.
Modelling 06 00140 g013
Figure 14. Comprehensive evaluation of the mixing effect of four new mixing element structures on IP: (a) Comprehensive evaluation of indicators, (b) Evaluation score and improvement rate.
Modelling 06 00140 g014
Table 1. Material Particle Residence Time Statistical Analysis Table.
Model Namets/st99/sRT/sMRT/s
Model 11.14024.89423.7543.681
Model 21.13514.71513.5802.818
Model 30.87433.73632.8624.040
Model 40.74916.56115.8122.358
Disclaimer/Publisher’s Note: The statements, opinions and data contained in all publications are solely those of the individual author(s) and contributor(s) and not of MDPI and/or the editor(s). MDPI and/or the editor(s) disclaim responsibility for any injury to people or property resulting from any ideas, methods, instructions or products referred to in the content.