Abstract
Natural fiber composites are widely used in a several industrial applications due to their outstanding biodegradability and recyclability. Thermal compression molding is a rapid and easy method to fabricate composite sheets. To better understand the manufacturing process and evaluate the mechanical properties of hemp woven fabrics reinforced thermoplastic composite at elevated temperatures, a detailed investigation is required. In this study, composite sheets were initially fabricated using hemp fiber fabrics (taffeta and serge 2×1) and polypropylene sheets by the thermal compression molding process. Mechanical tests (uniaxial, shear, and biaxial) were carried out at temperatures ranging from 20 to 160 C in order to estimate the mechanical properties of composite sheets. Non-linear behavior was observed during the loading due to the unbalanced weaving pattern of hemp fabric. The biaxial behavior of the composite was estimated using a theoretical method for fabric strength prediction taking into account the interaction effect between the yarns. The experimental results demonstrate that, at high temperature, the polymer softens and the fiber reinforcements dismantle which resulting in a decrease in the mechanical properties of the composite. Two analytical models (Ha & Springer and thermal expansion coefficient) were also proposed to estimate the thermo-mechanical properties of natural fiber composites subjected to various temperatures.
1. Introduction
Synthetic composite materials are widely used in various applications due to their high specific strength, high specific modulus, and long durability compared to conventional materials. On the other hand, synthetic fiber composites have certain drawbacks, like high cost, non-biodegradability, limited recyclability, etc. [,,]. Natural fiber composites are substituting synthetic fiber composites in several applications due to their low density, low cost, better specific mechanical properties, low energy consumption, less health risk in tooling, renewability, recyclability, and biodegradability []. However, they have some drawbacks, such as moisture absorption, low durability, high variability of properties, water ageing effect, etc. []. Several studies were carried out in the past to explore the feasibility of different natural fiber composites in different applications [,,,,,,,,].
Hemp is an annual plant and the production of hemp plant is increasing steadily every year. Recently, the demand of the natural fibers has increased, and the hemp fibers are cheap compared to other popular natural fibers. Furthermore, hemp fiber straw is produced in a process called ’total line’ where the random non-aligned technical fibers were produced together. Due to this, the raw material is readily available and it is attractive for automotive or aerospace industry where the production speed is very essential [,,]. One of the major concerns in the utilization of natural fiber thermoplastic composites is the effect of temperature on the mechanical properties. Therefore, it is significant to analyse temperature effect on the mechanical behavior of the composite [].
Several studies were performed to estimate the mechanical behavior of natural fiber thermoplastic composites under different temperature conditions. Tajvidi et al. [] studied the mechanical performance of hemp short fiber polypropylene composites at different temperature made by injection-molding. It was found that the flexural and tensile properties is highly depending on the temperature. Ren et al. [] investigated the mechanical and thermal properties of high-density polyethylene composites reinforced with bamboo pulp fibers manufactured by twin-screw extruder and a decrease in the mechanical properties were found as the temperature increases. Tajvidi [] studied the static and dynamic mechanical properties of kenaf fiber–wood flour/polypropylene hybrid composite and a decline in the mechanical behavior was also observed as the temperature increases. Similarly, Dhakal et al. [] studied the influence of temperature and impact velocity on the impact damage of jute fiber reinforced unsaturated polyester composite. The results show that the temperature and impact velocity have a high influence on the energy absorption, impact, and post-impact damage characteristics. At lower temperature, high strength was retained, and, as the temperature increases, the strength decreases. Suresh Kumar et al. [] investigated the residual flexural strength of hemp/epoxy, basalt/epoxy, and hybrid (hemp-basalt)/epoxy composite laminates at different temperature under low velocity impact damage, and it was observed that impact strength, residual flexural strength decreases as the temperature elevated. Lower impact resistance was found at low temperature and it was concluded that increase in the temperature lead to the low mechanical properties. Amaro et al. [] studied the temperature effect on glass/epoxy laminates subjected to multi-impacts and noticed that the number of impacts to failure highly depends on the temperature. Sorrentino et al. [] studied the effect of temperature on static and impact properties of thermoplastic composites based on poly(ethylene 2, 6-naphthalate PEN) with carbon, Twaron, Vectran, basalt fibers. It was observed that flexural behavior and impact resistance was affected by the temperature. Wang et al. [] studied the low velocity impact behavior of woven carbon fabric/polyphenylene sulfide (CF/PPS) laminates at different temperature and it was noted that the increase in the temperature lead to low stiffness, energy based damage degree and delamination area. The failure mechanism transformed to ductile from brittle as the temperature increases. The majority of these studies show that the influence of temperature on the mechanical properties of thermoplastic composite sheets is an important factor to consider. Despite the fact that there have been a few studies on short hemp fiber based thermoplastics in the past, the potential of hemp fiber woven fabrics composites has never been investigated in detail. Furthermore, a detailed analysis is required to better understand the thermal-compression molding manufacturing process and to analyse the mechanical properties of hemp fabrics thermoplastic polymer composite degrade at elevated temperatures.
The main goal of this study is to investigate the effect of different temperature conditions on the mechanical properties of hemp woven fabrics/polypropylene (PP) composites. Firstly, the composite sheets will be fabricated using hemp fiber woven fabrics (taffeta and serge 2×1) and polypropylene sheets by the compression molding manufacturing process. Specimens will be cut into desired dimensions for uniaxial, shear, and biaxial tensile tests. The tests will be performed under 20, 55, 90, 125, 160 C temperature conditions using the mechanical test setups installed inside the environmental chamber. Force versus displacement curve for each case will be obtained and mechanical properties will be estimated. Two analytical models (Ha & Springer and thermal expansion coefficient) will be presented to predict the thermo-mechanical properties of natural fiber composites subjected to various temperatures, and predicted results will be compared with experimental results.
2. Experimental Analysis
In this section, the raw materials and composite sheet specimens manufacturing process were presented and tested. Uniaxial, in-plane shear, and biaxial tensile tests were performed to investigate the mechanical properties of the composite at different temperature conditions. Firstly, the elastic tensile modulus and in-plane shear modulus of taffeta hemp fabric reinforcement (plain weave) and serge 2×1 hemp fabric reinforcement (twill weave) were measured at temperatures ranging from 20 to 160 C. Secondly, the ultimate tensile strength and failure strains are estimated. Thirdly, as the hemp fabric are unbalanced, the biaxial tensile tests were performed to analyse and identify the biaxial behavior of the composite sheets.
2.1. Material and Composite Specimens Manufacturing
Pure hemp fabrics were supplied by a French local manufacturer in the form of continuous fabric. The fabric is composed of numerous continuous yarns produced by grinding, mechanical carding and spinning of textile hemp stem (length of 4/5 m). Taffeta fabrics (plain weave) and serge 2×1 fabrics (twill weave) with an areal density of 290 g/m and 380 g/m, respectively, were utilized to fabricate the composites. Thin polypropylene (PP) sheet with a density of 0.91 g/cm, melt flow index of 3.2 (230 C/2.16 kg) and thickness 0.8 mm is used in view of its high strength and malleability. Hemp fiber woven fabrics / PP composite sheets were manufactured by conventional thermal compression molding process by the following four steps (Figure 1) according to the thermal curve processing cycle shown in Figure 2.
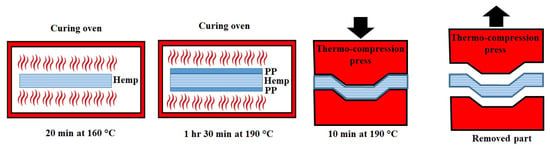
Figure 1.
Conventional thermal compression moulding process of woven fabrics thermoplastic composite.
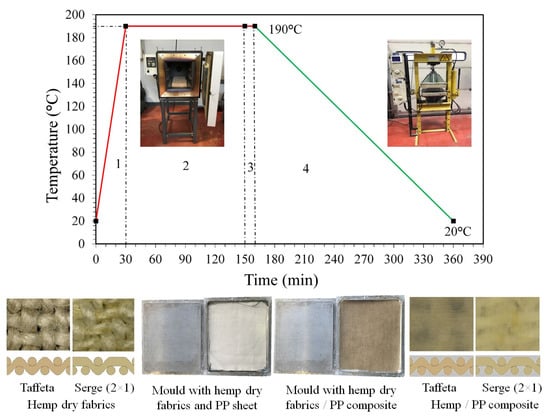
Figure 2.
Thermal curve processing cycle of woven fabrics thermoplastic composite fabrication.
- STEP 1: Dry hemp woven fabrics were cut into require dimensions and dried inside the oven for 30 min at a temperature of 160 C in order to avoid moisture content which may cause air bubbles in composites. Hemp fabrics were stacked between two polypropylene sheets in the desired orientation.
- STEP 2: Closed mold was placed in the oven for 150 min at a temperature of 190 C which allows the polypropylene sheets to melt and ensure a uniform matrix distribution.
- STEP 3: Mechanical press was pre-heated during 120 min at a temperature of 190 C. The composite sheets with one layer woven fabric (taffeta or serge) and two polypropylene sheets matrix were hot pressed under 6 bars during 10 min.
- STEP 4: The mold was allowed to cool at 0.95 C/min and the composite sheets were removed from the mold. The final composite sheets have a width of 200 mm and a length of 200 mm. The thickness was estimated as 1.6 and 1.7 mm for taffeta and serge (2×1), respectively.
The mechanical properties of dry hemp woven fabrics and hemp woven fabrics/PP composites are presented in Table 1.

Table 1.
Characteristics of dry hemp woven fabrics and hemp woven fabrics/PP composites.
2.2. Thermo-Mechanical Tests
For uniaxial tensile with 0/90 fiber orientation and for in-plane tensile shear tests with ±45 fiber orientation, the bidirectional composite sheet specimens were prepared with a gauge length of 150 mm and width 25 mm. For bi-axial tensile tests, cruciform shapes were prepared with an arm width of 30 mm and a total specimen gauge length of 60 mm. Uniaxial tensile and tensile shear test specimens were prepared according to ASTM D638, whereas the biaxial tensile test specimens were prepared according to ISO 16842 standards. All the tests were performed under static load using INSTRON 4484 mechanical machine with environmental chamber. The specimens were fixed in the machine’s jaw, and, after the required temperature equilibrium was achieved, the displacement was applied at a rate of V = 3 mm/min. During the tests, the force versus displacement response until the failure were recorded.
2.2.1. Uniaxial Tensile Test
The schematic of specimen dimensions, composite specimen, and the machine with environmental chamber for uniaxial tensile test are shown in Figure 3. Polypropylene matrix is a semi-crystalline thermoplastic polymer with a glass transition temperature below 0 C. Natural hemp fiber polypropylene composites show temperature dependent behavior due to the viscoelastic nature []. The rheological behavior of the polypropylene will start contributing to the mechanical behavior. In polypropylene material, the atoms were bonded together, and, as the temperature increases, the bond length increases and the force that holds the atoms decreases. As the matrix starts damaging, the interface between fibers and matrix fails and eventually the fibers start breaking. As the temperature increment, the strength of the composite materials decreases as the matrix fails earlier. The stress versus strain for taffeta (warp and weft) and serge 2×1 (warp and weft) woven fabric under different temperature conditions were measured after the specimen reached temperature equilibrium state. Five specimens were tested at each temperature condition, and the tensile properties of taffeta, serge 2×1 fabric composites in the warp, and weft directions are estimated and presented in Table 2.
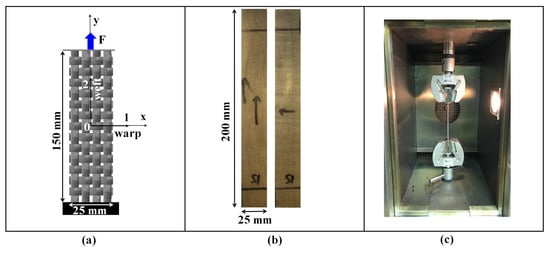
Figure 3.
Uniaxial tensile test setup: (a) schematic of specimen dimensions, (b) composite specimen and (c) machine with environmental chamber.
Table 2.
Uniaxial tensile properties of hemp woven fabric composite at different temperature conditions.
The result of the temperature effect on the tensile stress-strain relationship is shown in Figure 4. At lower test temperature, the creep deformation is expected to be smaller. It is evident that, the mechanical properties of composites are strongly dependent on the test temperature. The effect of the temperature on Young’s modulus (E), ultimate tensile strength (), and failure strain () was investigated individually in warp and weft directions. The mechanical properties under temperature consideration in the warp and weft direction are nearly similar, but not quite the same. Until 90 C, the hemp fiber dominated the stress-strain responses with a linear longitudinal tension. Similarly, the polymer matrix dominated the stress-strain responses with non-linear transverse tension, transverse compression, and shear.
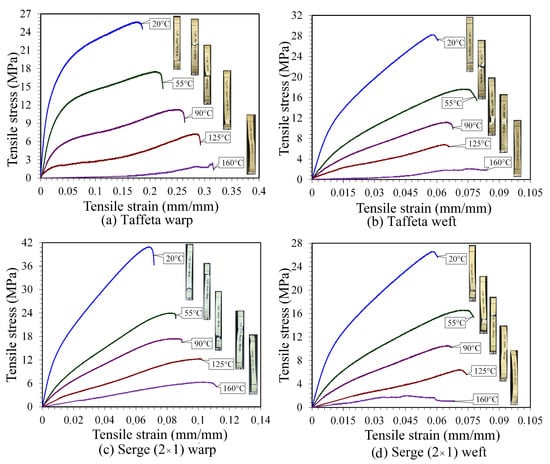
Figure 4.
Tensile stress versus strain response of hemp woven fabrics composite at different temperature conditions: (a) taffeta warp, (b) taffeta weft, (c) serge 2×1 warp and (d) serge 2×1 weft.
The tensile modulus of taffeta in warp direction has 66% decrease as the temperature increases from ambient temperature to 55 C (1143 to 571 MPa) whereas in the weft direction, it is decreased 72%. The ultimate tensile strength decreases from 25 to 2 MPa for taffeta warp direction and from 28 to 2 MPa for taffeta weft direction as the temperature increases from 20 to 160 C. The tensile failure strain increases from 18 to 31% for taffeta warp composite and from 6 to 8% for taffeta weft composite as the temperature increases from ambient temperature to 160 C. Similar kind of responses were noted in the case of serge 2×1 woven composite material in the warp and weft directions.
Ultimate failure was defined as the maximum load with the specimen could support (matrix cracking, delamination, fiber damage). The strength is defined as the stress corresponding to this maximum load. The elastic modulus is obtained from the initial slope of the curve in the range of 0.1–0.5% strain. From the stress-strain curve, it is observed that, initially, a linear behavior was observed due to the elastic loading of the hemp yarns. As the test progress, a non-linear behavior was noted and the stiffness of the material started reducing. Later, the curve becomes a straight line due to the elastic deformation of polypropylene, and the ductility of the PP is enhanced at high temperature. Finally, cracks developed between the hemp yarn and PP matrix, which lead to the failure.
2.2.2. In-Plane Tensile Shear Test
The dimensions of composite specimen and the tensile machine with environmental chamber for the tensile shear test are shown in Figure 5. The main purpose of in-plane shear test to estimate the maximum shear stress, shear modulus, and shear strain failure. It is very essential to estimate these parameters for the better designing of composite parts and the shear failure can cause huge damage to large structures. Tensile shear method is a simple technique to study the shear properties of the composite. The tensile shear test exhibits similar behavior likewise in a tensile test as expected. It is very difficult to measure the in-plane and transverse shear properties. Some of the methods for measuring the in-plane shear modulus are discussed in this study. When a composite plate [±45] is subjected to axial tensile stress =F(t)/, then the stresses in the principal material coordinates direction (warp 1, weft 2) developed in each of the −45 and +45 of plate composite lamina are given as (c = and s = ) (Equations (1) and (2)):
with
where (, ) are the elastic Young’s modulus of composite in the warp and weft directions, is the in-plane shear elastic modulus, and is the Poisson’s ratio. For a special case with = ±45, the shear stress can be obtained as .
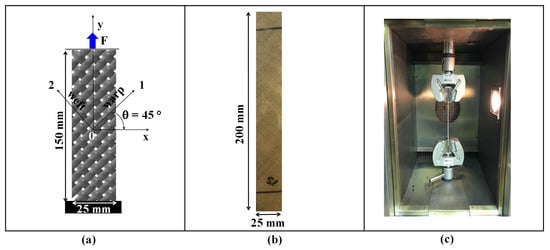
Figure 5.
In-plane shear test setup: (a) schematic of specimen dimensions, (b) composite specimen and (c) machine with environmental chamber.
From the linear elastic behavior of the composite materials, the shear response is uncoupled from the normal response, and the in-plane shear modulus can be determined directly from a tensile test on a laminate. The shear strain (Equation (3)) can be found by transformation of the measured axial and transverse strains (, ):
As the composite is thermo-compressed and has very small sliding between fabric and matrix, the axial strain values in tensile shear can be considered as very small compared to transverse strain . Shear stress modulus in terms of effective properties of laminate can be rearranged in the following manner to express the shear stress as (Equation (4)):
The tensile shear stress versus strain curve is plotted for taffeta and serge 2×1 composites at different temperature conditions (Figure 6). The shear modulus is obtained from the initial slope of the curve in the range of 0.1–0.5%. The shear modulus of taffeta composite has 85% decrease as the temperature increases from ambient temperature to 55 C (417 to 166 MPa). And as the temperature increment, the shear modulus decreases to 72 to 4 MPa for 90 to 160 C. Similar responses were observed in the case of serge 2×1 woven composites.
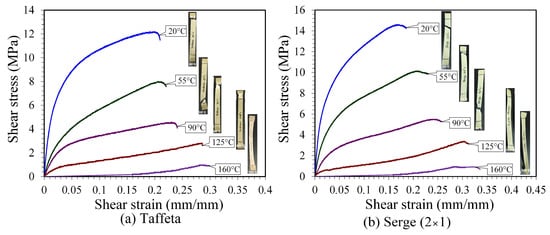
Figure 6.
Shear stress versus shear strain response of hemp woven fabrics composite at different temperature conditions: (a) taffeta and (b) serge 2×1.
The in-plane tensile test on composite [±45] specimen provides an acceptable method for the measurement of in-plane shear modulus. However, one should be careful while interpreting the ultimate shear strength and strain. It should be noted that the composite laminate [±45] subject to a biaxial state of stress and not a pure shear. The normal stresses act along the shear planes causing the onset of mixed mode fracture. It is recommended in ISO 14129 standard that the shear strength can be taken as the peak load at or before 5% strain. The ultimate shear strength decreases from 12 to 0.9MPa for taffeta woven composite as the temperature increases from ambient temperature to 160 C. In addition, the shear failure strain increases from 20 to 29% as the temperature increases. Similar responses were recorded in the case of serge 2×1 woven composite sheets (Table 3).
Table 3.
Tensile shear properties of hemp woven fabrics composite at different temperature conditions.
2.2.3. Biaxial-Tensile Test
Biaxial tensile test of composite laminate allows the investigation of the mechanical behavior of materials under complex loading conditions. Due to the anisotropic behavior of hemp fiber woven fabric reinforcement, it is essential to study the biaxial tensile behavior of the composite. To apply biaxial loads using a tensile machine on cruciform specimens, a specific device is required. Development of a test device and associated experimental procedure for evaluating the strength of composite laminates under an in-plane biaxial tensile stress state is presented in Figure 7. Compression force was applied from the top jaw of the tensile machine, which allows the composite to deform in four directions. The system is in equilibrium, and the force applied at the single point will be shared by the composites in four directions equally. Due to this, an analytical model is proposed to calculate the biaxial stress versus strain and to evaluate the stress due to the interaction between the warp and weft directions.
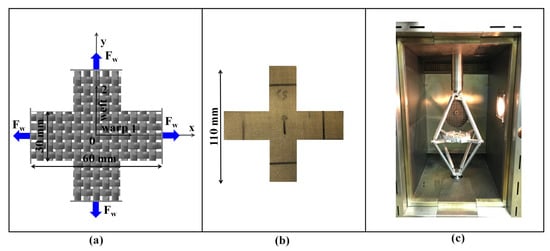
Figure 7.
Biaxial tensile test setup: (a) schematic of specimen dimensions, (b) composite specimen and (c) machine with environmental chamber.
The biaxial-tensile system provided only the vertical force , and it is necessary to calculate the force in the horizontal direction (warp direction) or in the weft direction analytically. The horizontal displacement (Equation (5)) in the warp or weft direction at each loading time with respect to the imposed vertical displacement is a function of the arm’s length l= 225 mm as:
The total force is the sum of the forces or in each arm as the system is working in equilibrium. The applied force (Equation (6) in warp or weft direction versus the applied force and the vertical displacement is calculated as:
The longitudinal stress versus strain (Equation (7)) was calculated from the obtained horizontal force versus displacement using the conventional equation as:
with and is the initial cross-sectional area.
Biaxial tensile force versus crosshead displacement for taffeta and serge 2×1 woven fabric were calculated from the experimental applied force using Equation (6) (Figure 8). The maximum biaxial tensile force of taffeta woven fabric composite has 50% decrease as the temperature increases from ambient temperature to 55 C (3461 to 2096 N). As the temperature increases, the maximum biaxial tensile force decreases to 1443, 754 and 80 N for 90, 125, and 160 C, respectively. Similarly, the maximum biaxial tensile force of serge 2×1 woven fabric composite has 40% decrease as the temperature increases from ambient temperature to 55 C. As the temperature increases, the maximum biaxial tensile force decreases to 1780, 1051, and 105N for 90, 125, and 160 C, respectively. Biaxial stress versus strain curves calculated for taffeta and serge 2×1 composites were presented in Figure 9.
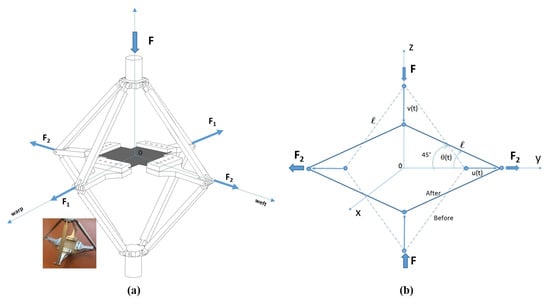
Figure 8.
Schematic representation of biaxial tensile test: (a) applied force and force distribution and (b) free body diagram before and after the test.
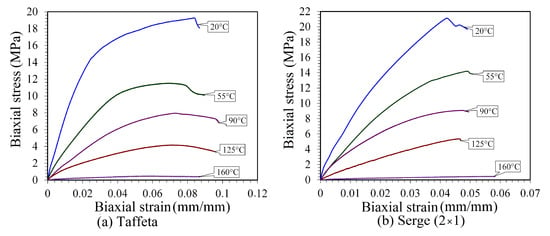
Figure 9.
Biaxial stress versus strain response of hemp woven fabrics composite at different temperature conditions: (a) taffeta and (b) serge 2×1.
A biaxial woven fabric is an assembly of fiber bundles weaved perpendicularly interlaced with each other in a two-dimensional format. Therefore, fabric strength is the resultant of the fiber strength taking into account the interactions between the warps and the weft fiber. This subsection aimed to propose a theoretical approach for fabric strength prediction based on the results achieved by previous uniaxial tensile studies. The elastic stress versus strain in the warp and weft directions in biaxial-tensile test can be written as (Equation (8)):
From Equation (8), the difference in the stress due to interaction coefficients and .
Table 4 shows that the biaxial coefficients in the warp and weft directions are very different and depend on the temperature. As the fabrics are unbalanced, it is noted that the coefficients are very different. As the temperature increases, the interaction friction coefficient between the warp and the weft fibers increase. It is also noted that these coefficients depending on the type of weave of the reinforcements of the composites and on the density of the fibers in each direction.
Table 4.
Interaction coefficients in biaxial tensile test at different temperature conditions.
A comparison of uniaxial and biaxial tensile stress versus strain curve for 20 C for taffeta and serge 2×1 woven fabric composite were plotted (Figure 10). The variation in the curve due to the friction-interaction and the weaving type between the fibers is evident. The decrease in the mechanical properties was mainly due to the softening of resin in the composite, which happens during the glass transition period. As the temperature increases, the matrix start melting and interfacial bonding becomes low. As a result, partially separated micro-spaces between fiber and matrix will be formed, which lead to stress propagation []. Moreover, the increase in the temperature creates more viscosity that allows high deformation. Elevation in the temperature increases the ductility of the composite, which results in the reduction of strength and modulus. Necking failure is observed in the low temperature and composites starts elongating as the temperature increment []. Generally, the exposure of thermoplastic composite to high temperature increases the distortion, softens the matrix, and causes thermal degradation, which increases the chance of composite damage.
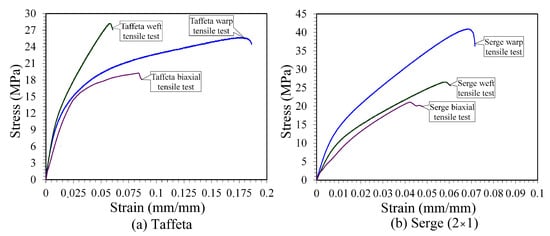
Figure 10.
Comparison between uniaxial and biaxial stress versus strain curve at 20 C: (a) taffeta and (b) serge 2×1.
3. Thermo-Mechanical Modeling of Hemp Fabrics Thermoplastic Composite Properties
In this section, the thermo-mechanical properties of hemp fabrics thermoplastic composite were modeled using Ha & Springer model and thermal expansion coefficient CTE model.
3.1. Modeling Using Ha & Springer Model
An approximate non-linear expression which shows the change in mechanical properties with respect to temperature was proposed by Ha & Springer [] as (Equation (9)):
where X(T) is the material property (elastic modulus, strength, failure strain) at the absolute service temperature T, is the material property at the ambient temperature , is the absolute temperature at which the material property is very low, and n is a material coefficient. The tensile elastic modulus E(T), the tensile strength , the in-plane shear modulus , and the in-plane shear strength (Equation (10)) can be predicted by knowing the experimental data for each property from the experiment as:
where , , , and are, respectively, the tensile modulus, tensile strength, shear modulus, and shear strength at ambient temperature.
The parameters and n were determined by correlating with the temperature dependency curves obtained from the experimental data. The challenge is to determine the predicted elastic properties that gives the minimum error for the given experiment dataset using the Least Squares method (Equation (11)):
The temperature at which the material properties are negligible is estimated as = 180 C for the hemp fiber fabric composite. The predicted properties using Ha & Springer model are noted in Table 5 and Table 6. It was observed that the Ha & Springer model was able to predict the modulus and strength of tensile, shear test. As it can be seen, the model describes well the measured data. The comparison curve between predicted and experimental results at different temperature of tensile modulus , tensile strength , the in-plane shear modulus , and shear strength are presented in Figure 11, Figure 12 and Figure 13.
Table 5.
Predicted tensile properties using Ha & Springer model at different temperature conditions.
Table 6.
Predicted shear properties using Ha & Springer model at different temperature conditions.
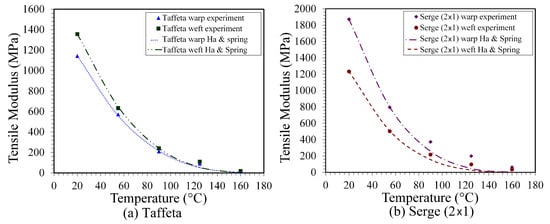
Figure 11.
Experimental and predicted tensile modulus versus temperature E(T): (a) taffeta and (b) serge 2×1.
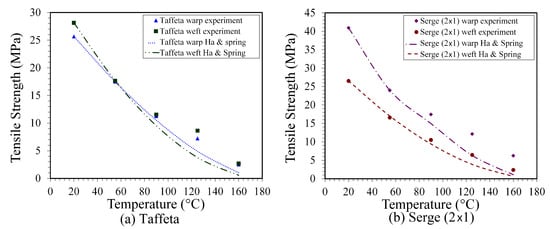
Figure 12.
Experimental and and predicted tensile strength versus temperature : (a) taffeta and (b) serge 2×1.
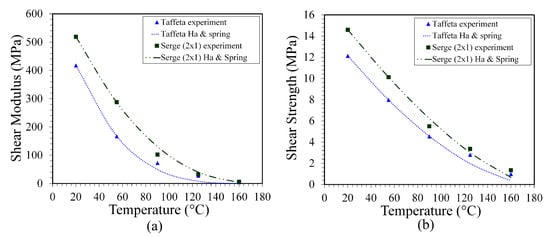
Figure 13.
Experimental and and predicted: (a) in-plane shear modulus versus temperature , (b) shear strength versus temperature .
3.2. Modeling Using Thermal Expansion Coefficient Approach CTE
The effect of temperature will expand or contract the materials and the change in temperature T will produce a thermal strain. Linear thermal expansion coefficient CTE of composite reinforced fabrics is mostly influenced by the thermal and elastic properties of constituents and the orientation of the fibers. At higher temperature, the CTE coefficients change significantly and induced micro-stress resulting from the differentials between the matrix and the fibers coefficients. For quasi-homogeneous multiphase material subject to tensile test at high temperature, the ultimate strength (Equation (12)) is obtained by using the thermo-elastic energy principle (CTE) as:
where is the linear thermal expansion coefficient; is the ultimate tensile strength at ambient temperature, and is the elastic tensile modulus at ambient temperature (Table 2).
In addition to that, the mechanical properties of the materials can be predicted by knowing the linear thermal expansion coefficient CTE at each temperature. The thermal expansion coefficients of the lamina in local coordinates (warp 1 or weft 2) will therefore be determined experimentally. An experimental setup was created to measure the coefficient of thermal expansion (Figure 14). The specimens were placed in the curing oven and temperature was incremented from 20 to 160 C. Photos were captured at regular intervals using the camera and temperature on the specimens was measured using an infrared thermometer. It is easy to measure the displacement of the specimen at different temperature with the images and the strain can be calculated from this displacement. Micro-strain and temperature changes were calculated. The slope of the curve, i.e., the coefficient of thermal expansion for hemp fiber woven fabrics/PP composite is approximately calculated which is close to the polypropylene thermal expansion. The predicted properties, coefficients for modeling using CTE approach and comparison with Ha & Springer model predicted properties were illustrated in Table 7. It is noted that the experimental and predicted ultimate tensile strength has good agreement. As the predicted curve is linear, there is a slight difference in the properties. At 20 C and 160 C, it gives very good correlation. The experimental and predicted tensile strength versus temperature is plotted in Figure 15. The comparison of experimental and predicted tensile strength by CTE model and Ha & Spring model versus temperature are also plotted in Figure 16.
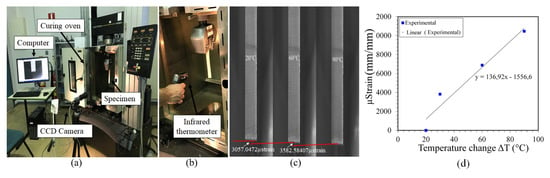
Figure 14.
(a) Thermal expansion experiment setup, (b) infrared thermometer, (c) specimen at different temperature and (d) micro-strain versus temperature change in weft direction of taffeta composite.
Table 7.
Predicted ultimate tensile strength: comparison between CTE and Ha & Spring at different temperature conditions.
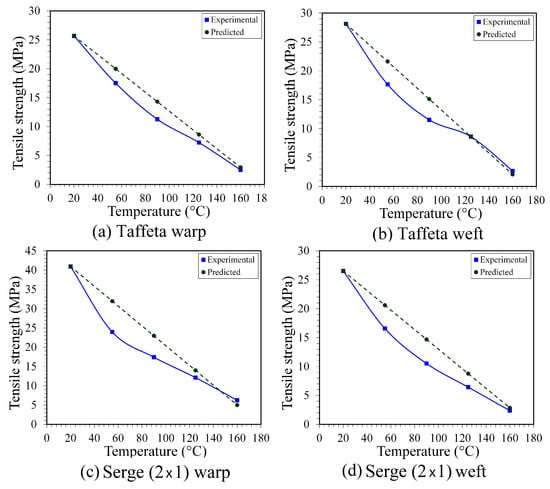
Figure 15.
Experimental and predicted tensile strength values versus temperature: (a) taffeta warp, (b) taffeta weft, (c) serge 2×1 warp and (d) serge 2×1 weft.
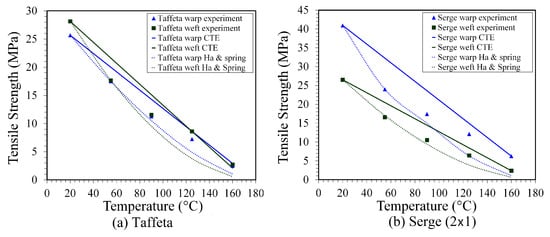
Figure 16.
Comparison of experimental and predicted tensile strength by CTE model and Ha & Spring model versus temperature: (a) taffeta and (b) serge 2×1.
4. Conclusions
In this study, the mechanical behavior of hemp fiber woven fabrics/polypropylene composites was studied under different temperature conditions. Composite specimens reinforced by taffeta and serge 2×1 woven fabrics were fabricated by the compression molding manufacturing process. Mechanical tests (uniaxial, in-plain shear, and biaxial) were performed under temperature ranging from 20 to 160 C and mechanical properties were estimated. Due to the unbalanced weaving pattern of hemp fabric, non-linear behavior was observed during loading. The biaxial behavior of the composite was calculated using a theoretical method taking into account the yarn interaction for predicting fabric strength. The experimental findings show that, at high temperatures, the polymer softens and the fiber reinforcements dismantle, resulting of a reduction in the composite’s mechanical properties. To estimate the thermo-mechanical properties of natural fiber composites subjected to various temperatures, two analytical models (Ha & Springer and thermal expansion coefficient) were also proposed.
Author Contributions
Conceptualization, S.A. and A.C.; Methodology, S.A. and A.C.; Validation, S.A., A.C. and G.M.; Investigation, S.A. and G.M.; Writing—Original Draft, S.A.; Writing—Reviewing and Editing, A.C. and G.M. All authors have read and agreed to the published version of the manuscript.
Funding
This research was supported by the University Technology of Troyes and Grand Est Region France - European Regional Development Fund (FEDER).
Institutional Review Board Statement
Not applicable.
Informed Consent Statement
Not applicable.
Data Availability Statement
Not applicable.
Acknowledgments
The authors would like to thank the anonymous reviewers for their useful comments that have improved the final version of this manuscript.
Conflicts of Interest
The authors declare no conflict of interest.
References
- Satyanarayana, K.G.; Arizaga, G.G.; Wypych, F. Biodegradable composites based on lignocellulosic fibers—An overview. Prog. Polym. Sci. 2009, 34, 982–1021. [Google Scholar] [CrossRef]
- Wambua, P.; Ivens, J.; Verpoest, I. Natural fibres: Can they replace glass in fibre reinforced plastics? Compos. Sci. Technol. 2003, 63, 1259–1264. [Google Scholar] [CrossRef]
- Ashori, A. Wood–plastic composites as promising green-composites for automotive industries! Bioresour. Technol. 2008, 99, 4661–4667. [Google Scholar] [CrossRef] [PubMed]
- Pickering, K.L.; Efendy, M.A.; Le, T.M. A review of recent developments in natural fibre composites and their mechanical performance. Compos. Part A Appl. Sci. Manuf. 2016, 83, 98–112. [Google Scholar] [CrossRef]
- Malkapuram, R.; Kumar, V.; Negi, Y.S. Recent development in natural fiber reinforced polypropylene composites. J. Reinf. Plast. Compos. 2009, 28, 1169–1189. [Google Scholar] [CrossRef]
- Cristaldi, G.; Latteri, A.; Recca, G.; Cicala, G. Composites based on natural fibre fabrics. Woven Fabr. Eng. 2010, 17, 317–342. [Google Scholar]
- Khalili, P.; Tshai, K.; Kong, I. Natural fiber reinforced expandable graphite filled composites: Evaluation of the flame retardancy, thermal and mechanical performances. Compos. Part A Appl. Sci. Manuf. 2017, 100, 194–205. [Google Scholar] [CrossRef]
- Khalili, P.; Liu, X.; Tshai, K.Y.; Rudd, C.; Yi, X. Development of fire retardancy of natural fiber composite encouraged by a synergy between zinc borate and ammonium polyphosphate. Compos. Part B Eng. 2019, 159, 165–172. [Google Scholar] [CrossRef]
- Khalili, P.; Blinzler, B.; Kádár, R.; Bisschop, R.; Försth, M.; Blomqvist, P. Flammability, smoke, mechanical behaviours and morphology of flame retarded natural fibre/Elium® composite. Materials 2019, 12, 2648. [Google Scholar] [CrossRef]
- Khalili, P.; Liu, X.; Zhao, Z.; Blinzler, B. Fully biodegradable composites: Thermal, flammability, moisture absorption and mechanical properties of natural fibre-reinforced composites with nano-hydroxyapatite. Materials 2019, 12, 1145. [Google Scholar] [CrossRef]
- Khalili, P.; Blinzler, B.; Kádár, R.; Blomqvist, P.; Sandinge, A.; Bisschop, R.; Liu, X. Ramie fabric Elium® composites with flame retardant coating: Flammability, smoke, viscoelastic and mechanical properties. Compos. Part A: Appl. Sci. Manuf. 2020, 137, 105986. [Google Scholar] [CrossRef]
- Yan, L. Effect of alkali treatment on vibration characteristics and mechanical properties of natural fabric reinforced composites. J. Reinf. Plast. Compos. 2012, 31, 887–896. [Google Scholar] [CrossRef]
- Porras, A.; Maranon, A.; Ashcroft, I. Thermo-mechanical characterization of Manicaria Saccifera natural fabric reinforced poly-lactic acid composite lamina. Compos. Part A Appl. Sci. Manuf. 2016, 81, 105–110. [Google Scholar] [CrossRef]
- Pisupati, A.; Bonnaud, L.; Deléglise-Lagardère, M.; Park, C.H. Influence of Environmental Conditions on the Mechanical Properties of Flax Fiber Reinforced Thermoset Composites. Appl. Compos. Mater. 2021, 1–17. [Google Scholar] [CrossRef]
- Pickering, K. Properties and Performance of Natural-Fibre Composites; Elsevier: Amsterdam, The Netherlands, 2008. [Google Scholar]
- Carus, M.; Karst, S.; Kauffmann, A.; Hobson, J.; Bertucelli, S. The European Hemp Industry: Cultivation, processing and applications for fibres, shivs and seeds. Eur. Ind. Hemp Assoc. 2013, 65, 1–9. [Google Scholar]
- Antony, S.; Cherouat, A.; Montay, G. Experimental, analytical and numerical analysis to investigate the tensile behaviour of hemp fibre yarns. Compos. Struct. 2018, 202, 482–490. [Google Scholar] [CrossRef]
- Thwe, M.M.; Liao, K. Effects of environmental aging on the mechanical properties of bamboo–glass fiber reinforced polymer matrix hybrid composites. Compos. Part A Appl. Sci. Manuf. 2002, 33, 43–52. [Google Scholar] [CrossRef]
- Tajvidi, M.; Motie, N.; Rassam, G.; Falk, R.H.; Felton, C. Mechanical performance of hemp fiber polypropylene composites at different operating temperatures. J. Reinf. Plast. Compos. 2010, 29, 664–674. [Google Scholar] [CrossRef]
- Ren, W.; Zhang, D.; Wang, G.; Cheng, H. Mechanical and thermal properties of bamboo pulp fiber reinforced polyethylene composites. BioResources 2014, 9, 4117–4127. [Google Scholar] [CrossRef]
- Tajvidi, M. Static and dynamic mechanical properties of a kenaf fiber–wood flour/polypropylene hybrid composite. J. Appl. Polym. Sci. 2005, 98, 665–672. [Google Scholar] [CrossRef]
- Dhakal, H.; Arumugam, V.; Aswinraj, A.; Santulli, C.; Zhang, Z.; Lopez-Arraiza, A. Influence of temperature and impact velocity on the impact response of jute/UP composites. Polym. Test. 2014, 35, 10–19. [Google Scholar] [CrossRef]
- Kumar, C.S.; Arumugam, V.; Dhakal, H.N.; John, R. Effect of temperature and hybridisation on the low velocity impact behavior of hemp-basalt/epoxy composites. Compos. Struct. 2015, 125, 407–416. [Google Scholar] [CrossRef]
- Amaro, A.; Reis, P.; Neto, M. Experimental study of temperature effects on composite laminates subjected to multi-impacts. Compos. Part B Eng. 2016, 98, 23–29. [Google Scholar] [CrossRef]
- Sorrentino, L.; de Vasconcellos, D.S.; D’Auria, M.; Sarasini, F.; Tirillò, J. Effect of temperature on static and low velocity impact properties of thermoplastic composites. Compos. Part B Eng. 2017, 113, 100–110. [Google Scholar] [CrossRef]
- Wang, Y.; Zhang, J.; Fang, G.; Zhang, J.; Zhou, Z.; Wang, S. Influence of temperature on the impact behavior of woven-ply carbon fiber reinforced thermoplastic composites. Compos. Struct. 2018, 185, 435–445. [Google Scholar] [CrossRef]
- Bathgate, R.; Wang, C.; Pang, F. Effects of temperature on the creep behaviour of woven and stitched composites. Compos. Struct. 1997, 38, 435–445. [Google Scholar] [CrossRef]
- Yang, H.S.; Kim, H.J.; Park, H.J.; Lee, B.J.; Hwang, T.S. Effect of compatibilizing agents on rice-husk flour reinforced polypropylene composites. Compos. Struct. 2007, 77, 45–55. [Google Scholar] [CrossRef]
- Bajracharya, R.M.; Manalo, A.C.; Karunasena, W.; Lau, K.t. Effect of elevated temperature on the tensile properties of recycled mixed plastic waste. In Proceedings of the 23rd Australasian Conference on the Mechanics of Structures and Materials (ACMSM23), Southern Cross University, Byron Bay, Australia, 9–12 December 2014; Volume 1, pp. 281–286. [Google Scholar]
- Ha, S.K.; Springer, G.S. Nonlinear mechanical properties of a thermoset matrix composite at elevated temperatures. J. Compos. Mater. 1989, 23, 1130–1158. [Google Scholar] [CrossRef]
Publisher’s Note: MDPI stays neutral with regard to jurisdictional claims in published maps and institutional affiliations. |
© 2021 by the authors. Licensee MDPI, Basel, Switzerland. This article is an open access article distributed under the terms and conditions of the Creative Commons Attribution (CC BY) license (https://creativecommons.org/licenses/by/4.0/).