1. Introduction
Recent advancements in transportation technologies, including autonomous vehicles (AVs) (or driverless cars), are undergoing rapid development. Nowadays, vehicles with driver assistance features that provide semi-autonomous functions are widely available in the market [
1]. As these technologies continue to improve, the market share of AVs is expected to grow. However, the speed of transition depends on innovations by the private sector, public acceptance, investment in infrastructure for AVs, and government regulations [
2].
According to Litman [
3], complete penetration of AVs in the existing transportation system will take a 30-year planning horizon. Additionally, the effects of AVs on car ownership and car travel demand are still unclear [
4]. There are multiple possible scenarios in which AVs could influence the transportation system, especially in urban areas. If more AVs are part of car-sharing programs or shared autonomous taxis, parking demand may reduce. By contrast, the car ownership level would increase if more AVs are privately owned [
4]. Although AVs offer advanced safety benefits, there are still concerns related to safety while riding AVs [
5]. Thus, users’ willingness to ride AVs in the future will dictate the future travel demand and market penetration.
AVs could drastically change the structure of future cities and regions [
6]. Captive riders such as elderly drivers and children may shift from public transportation systems to private modes with an increase in privately owned AVs. With no driving duties while traveling in AVs, the convenience of car travel is expected to improve, resulting in greater suburban sprawl because of the reduced time–cost of driving [
4]. Subsequently, the increasing suburban sprawl could also cause the under-utilization of public transportation facilities, resulting in higher traffic and congestion due to the use of private vehicles [
4]. By contrast, AVs are also expected to enhance mobility as an option for captive riders. However, the travel demand in the future will vary based on users’ willingness to ride AVs, making it necessary to estimate the potential demand of AVs to better plan the required strategies and infrastructure.
While several studies have examined users’ willingness to adopt AVs, much of the existing literature focuses on general attitudes, societal impacts, or the influences of demographic factors. However, the current study uniquely extends the theory of planned behavior (TPB) by considering additional influencing factors specific to AV adoption, such as users’ familiarity with AV technology, their perception of policies restricting AVs, and the anticipated influence of widespread AV adoption. The current research thus provides a more refined understanding of the psychological and regulatory factors influencing AV adoption.
The manuscript is organized as follows.
Section 2 includes a review of the relevant literature, focusing on key theories and models to assess AV adoption, and the current state of research on AV adoption.
Section 3 describes the methodology used in this study, including data collection, survey design, and model specifications.
Section 4 presents the models from the analysis, while
Section 5 discusses the results. Finally, in
Section 6, conclusions are included alongside key findings and potential avenues for future research on the adoption of autonomous vehicles.
2. Literature Review
The adoption and acceptance of AVs has been a significant topic of research in recent years. Various studies have explored different factors that influence users’ willingness to adopt and ride AVs. These factors range from technology familiarity to demographic characteristics, social influences, and the perceived safety of AVs. This section provides a review of relevant studies and theories that have shaped the understanding of users’ perceptions and adoption of AVs.
2.1. Uncertainties Related to Future Adoption of AVs
The future demand for AVs could vary depending on multiple factors, such as market penetration of technology and users’ perception of AV adoption. Thus, before identifying the potential influence of AVs, it is necessary to determine users’ perception of AV adoption and estimate the anticipated changes in travel demand. Several researchers in the past tried to study users’ willingness to adopt AVs or ride AVs in the future [
7,
8,
9]. There are also studies on users’ willingness to pay for AV technologies [
9] and users’ purchase intentions [
7]. Studies were also conducted on users’ willingness to adopt AVs based on their peer network and values [
8]. Further, AVs would also allow captive riders to travel in private vehicles rather than relying on public transportation modes. Thus, a user perception survey would also provide information about preferences, which can be used to analyze influencing latent factors such as the perception of policies restricting AVs and the anticipated effects of widespread AVs [
10].
To gain a comprehensive understanding of the factors shaping the future demand for AVs, it is essential to explore theoretical models that inform user acceptance and adoption [
11]. The technology acceptance model (TAM) emphasizes perceived ease of use and perceived usefulness as key determinants of technology adoption [
12,
13]. This model has been widely applied in various studies examining the adoption of new technologies, including AVs. The TPB extends this by considering not only attitudes toward the technology but also the influences of subjective norms (social pressure) and perceived behavioral control (the ease or difficulty of performing a behavior) [
14,
15,
16]. These elements together form a comprehensive framework for understanding the psychological and social factors that influence users’ willingness to accept and adopt AVs.
Additionally, the unified theory of acceptance and use of technology (UTAUT) integrates key elements from various acceptance models to explain the adoption and use intentions of new technologies [
17,
18]. The UTAUT combines the constructs from the TAM and TPB and adds factors such as performance expectancy, effort expectancy, social influences, and facilitating conditions, providing a more complete explanation of technology adoption [
19]. This framework has been extensively used in studies on the social acceptance of AVs [
20].
Building on these well-established models, this study aligns closely with the TPB, but with an extension. It explores how users’ familiarity with AV technologies, their perception of policies restricting AV use, and the anticipated effects of widespread AVs influence their intention to adopt them. While the TPB has been widely applied to understand the factors influencing adoption, this study contributes to the literature by incorporating the perception of regulatory policies and technological readiness as additional determinants of AV adoption.
2.2. Survey-Based Studies on AV Adoption
In the past, the perception of users toward AV adoption as well as the potential positive and negative influences of AVs were assessed using questionnaire survey methods [
21,
22,
23,
24,
25,
26,
27,
28,
29]. Simpson and Mishra [
21] used a discrete choice modeling approach to predict the adoption rate of automated trucks. Spurlock et al. [
22] predicted the adoption of shared, electrified, and automated vehicles. Acheampong and Cugurullo [
23] developed frameworks to predict AV adoption, focusing on public transportation, sharing, and ownership trends. Liu et al. [
24] studied factors influencing willingness to pay for self-driving vehicles, particularly demographic and psychological influences. Jiang et al. [
25] analyzed the ownership behavior of AVs in Japan using a mixed logit model. Lee et al. [
26] found that ownership perception plays a key role in AV adoption, especially in shared contexts. Nordhoff et al. [
27] explored the global acceptance of driverless AVs through a cross-national study. El Zarwi et al. [
28] developed a discrete choice framework for forecasting the adoption of new transportation services. Talebian and Mishra [
29] applied the diffusion of innovations theory to predict the adoption of connected AVs.
The majority of studies used the stated preference survey technique [
21,
22,
23,
24,
25,
26,
27,
29]. However, there are studies based on revealed preference surveys [
28] to obtain the adoption of new transportation services. As fully AVs are not available in the existing market in the present analysis, the stated preference survey technique would provide a better idea of users’ perceptions of various aspects related to AVs.
The existing literature indicates that users’ willingness to adopt AVs has been widely investigated by researchers in recent years [
9]. Existing studies show that individuals’ social network, social influences, and prior knowledge of AVs influence their perception [
7,
17]. Further, a person’s ideology and creative thinking also influence their propensity to adopt an unconventional lifestyle and try newly developed things [
30]. The present literature identifies users’ perception of the potential influence of AVs and users’ willingness to ride AVs, including numerous survey-based techniques. For analyzing survey data, many modeling techniques were used in the past, including multinomial logit or probit model [
31,
32,
33], mixed or mixed-mixed logit models [
25,
26,
31,
34], confirmatory factor analysis [
23,
35], nested logit model [
36], and structural equation modeling (SEM) [
8,
26,
37,
38]. The SEM technique was preferred over other modeling techniques when analyzing survey data because it helped to better capture users’ perception of AV adoption considering level 3 to level 5 AVs [
31,
32,
34,
35,
36].
2.3. Factors Influencing Users’ Perception of AVs
The penetration of AVs in the existing transportation scenario is expected to vary according to the pace at which the automobile industry manufactures AVs, users’ willingness to ride AVs, and the availability of the required infrastructure. If privately owned, AVs will dominate and ultimately hike travel demand. By contrast, the travel demand may be reduced if users prefer to adopt shared AVs or non-automated vehicles. Although users learn about technologies and advancements in the automobile industry from several sources, such as social media, news articles, and research reports, their perception of riding AVs may vary depending on their nature and views towards technology and safety. In addition, personal characteristics such as gender and education level influence users’ likelihood of adopting new technologies [
39].
2.4. Study Hypothesis and Objectives
For practitioners, it is necessary to identify the potential demand and users’ willingness to adopt emerging technologies and determine the effect of policies restricting technologies due to safety concerns. Thus, the survey-based study identifies the influence of users’ perception of policies restricting AVs, the potential effects of widespread AVs, and their familiarity with AV technology on their willingness to ride AVs. The first three hypotheses (H1, H2, and H3) were formed to test the correlation between latent variables.
H1. Respondents’ familiarity with AVs and their perception of policies restricting the use of AVs are correlated.
H2. Respondents’ familiarity with AVs and their perception of anticipated effects of widespread AVs are correlated.
This hypothesis tests users’ familiarity with new technologies and influences their perception of how such technologies will impact society (e.g., traffic patterns, safety, and public mobility).
H3. Respondents’ perception of the anticipated effects of widespread AVs and policies restricting the use of AVs are correlated.
This hypothesis tests the regulatory challenges that arise with the adoption of AVs [
35,
37]. Policymakers’ perspectives on safety and technological readiness influence how users perceive the potential societal impacts of AV adoption.
Studies to identify the factors influencing users’ willingness to ride AVs have been explored by multiple researchers in the past, using stated preference survey techniques [
40,
41,
42]. Personal characteristics such as gender and education level could influence users’ perceptions of various aspects of AVs, which were not explored in previous studies. Thus, three hypotheses (H4, H5, and H6) were formed, as listed next, to test the effects of personal characteristics on different aspects of AVs.
H4. Respondents’ personal characteristics influence their perception of policies restricting the use of AVs.
This hypothesis tests the role of personal factors (e.g., age, education, and socioeconomic status) in shaping attitudes toward new technologies and their regulation [
34].
H5. Respondents’ personal characteristics influence their perception of the anticipated effects of widespread AVs.
This hypothesis tests the role of individual characteristics that significantly influence the perception of technological impacts on society [
34,
36].
H6. Respondents’ personal characteristics influence their familiarity with AVs.
This hypothesis tests how demographic factors and exposure to technology influence familiarity with innovations like AVs [
36].
Studies in the past identified how users’ perceptions of different aspects of AVs influence their adoption [
35,
37,
38]. In this study, to determine the effects of users’ perceptions of three aspects related to AVs (familiarity, policies restricting use of AVs, and widespread adoption of AVs) on their willingness to ride them, three hypotheses (H7, H8, and H9) were formed, as listed next. The hypotheses provide information on the effects of users’ attitudes toward different aspects of AVs on their decision making.
H7. Respondents’ perception of policies restricting the use of AVs and how it influences their willingness to ride AVs.
H8. Respondents’ perception of the anticipated effects of widespread AVs and how it influences their willingness to ride AVs.
H9. Respondents’ familiarity with AV technology and how it influences their willingness to ride AVs.
Theoretically, users bring all of their experiences, emotions, feelings, and expectations while attempting to adopt new technology [
40]. Thus, the effects of users’ perceptions of various aspects related to a new technology (AV technology in the present case) could vary their decision to adopt the new technology. The perception of different factors would also explain future variation in users’ acceptance and travel demand. With this motive, this manuscript investigates the effects of users’ perception of policies restricting AVs, the anticipated effects of widespread AVs, and their familiarity with AV technology on their willingness to ride AVs. The study provides valuable insights to policymakers for developing strategies and helps to identify the effect of policies on users’ willingness to ride AVs. The findings also assist the automobile manufacturers in prioritizing and focusing on technical advancements that will increase the acceptance and penetration of AVs into the market. The primary objectives of this study, therefore, are to model the effects of users’ perception of policies related to AVs, widespread AVs, and their familiarity with AVs on their willingness to ride AVs and to determine the effects of personal characteristics on users’ perceptions of various aspects related to AVs.
3. Methodology
3.1. Data Collection
The data required to investigate users’ willingness to ride AVs were obtained from the Pew Research Center [
41]. The database contains stated preference survey data of 4135 American respondents collected using a designed questionnaire from 1 May 2017 to 15 May 2017. The concept of AVs/driverless vehicles was explained to the respondents as “vehicles that can operate on their own without a human driver” [
41]. The data were collected by the Pew Research Center after sending mails. They received online responses across the United States from different regions.
The survey utilized a mix of Likert scale questions and other response formats to gauge respondents’ preferences and attitudes toward AVs. Although there were no distinct sections in the survey, related questions were grouped together based on the theme. For example, questions related to AV safety were presented together, as were questions about familiarity with AVs, and other related topics. This arrangement aimed to ensure a logical flow of responses and provide clear insights into different aspects of AV perception. The unanswered responses (outliers) for different questions within the database obtained from the Pew Research Center website were eliminated before analyzing and developing the models.
Although the data used in this study were over seven years old, they remain valuable due to the large sample size and comprehensive questionnaire, offering important insights about the population. The basic intent and questions about technology have not changed significantly. The data were collected during the preliminary stages of AV penetration, a time when public perceptions were shaped by optimism about rapid adoption. This context adds value to the current state-of-the-art by providing a snapshot of users’ perception during a pivotal moment in AV development, helping to understand how attitudes have evolved or could evolve over time.
3.2. Data Processing
As stated previously, the survey response data was first processed to identify and remove the samples with null or unanswered responses. The remaining 2323 samples were considered for modeling to reduce bias. Further, the categories of different factors were re-coded in order from negative perception or minimum values to positive perception or maximum values. The reason for reordering the dataset was to make the data more meaningful to the modeling software, which provides regression weights for each relationship. To avoid multicollinearity, a correlation analysis was performed considering all of the variables, and all of the included variables were found to be not highly correlated at a threshold of 0.5 [
42].
The questions were coded in short forms based on the latent class or group, such as perceptions of the effects of widespread AVs, policies restricting the use of AVs, personal factors such as education level and gender, and familiarity of the respondent with AVs.
3.3. Modeling Approach
From the processed data obtained using the questionnaire survey, followed by a detailed review of descriptive statistics (discussed in
Section 3.1), ten questions were identified to determine the attitude of respondents toward AVs. A linear regression or logistical regression model only provides information about the effect of various factors (questions) on the willingness to ride AVs. However, these models do not explain the effect of different categories of independent variables on latent variables. Thus, to identify the weights of users’ perceptions of various aspects related to AVs on their willingness to ride AVs, the questions were divided into five categories, as mentioned in
Table 1. As all five categories were pre-defined, the latent variables for various categories were generated using confirmatory factor analysis instead of explanatory factor analysis, which provides categories based on the data. Also, the exploratory analysis may provide categories that are not logically meaningful. For all of the questions included to develop the latent variables, the questions that did not significantly influence the latent variables were removed using the backward elimination technique, and three different models were developed using the developed latent variables.
Initially, confirmatory factor analysis was carried out to identify the correlation between latent variables describing the perception of policies restricting the use of AVs, the anticipated effects of widespread AVs, and the familiarity of a person with AVs (Model 1). For developing Model 2 and Model 3, the SEM technique was adopted.
The SEM technique represents the relationships between different latent variables. A latent variable is primarily observed using explanatory variables from the dataset and is used to indicate a causal relationship. Traditional SEMs involve continuous observed variables, continuous latent variables, and the linear relationships among them. The linear SEM takes the following form:
where
,
, and
are error terms with constant variance.
Equations (1) and (2) are measurement models that relate to observed variables and with their latent parts and . is a matrix of parameters influencing mean and covariance of latent variables. , , and are the matrices including regression coefficients.
Based on the factors obtained using confirmatory factor analysis, an SEM was developed (Model 2) to identify how personal characteristics influence the latent variables used in Model 1. Model 3 was developed to identify the effects of the latent variables used in Model 1 on users’ willingness to ride AVs in the future. IBM SPSS Amos software Version 26 [
43] was used for developing the SEM and performing confirmatory factor analysis as it provides flexibility to model the relationships in a pictorial representation and gives output in the form of scaled or unscaled results.
4. Analysis
4.1. Descriptive Statistics
Descriptive statistics were computed to obtain information about the number of samples in various categories and are summarized in
Table 1.
The descriptive statistics shown in
Table 1 indicated that, while capturing a person’s attitude toward riding AVs, 52.9% respondents showed a positive attitude toward their adoption. The primary reason for a positive attitude was that AVs would provide a new experience. More than 25% of respondents indicated a positive attitude toward riding AVs due to better safety, liberty to do other things while driving, and less stressful travel while riding AVs. By contrast, 47.1% of respondents preferred not to ride AVs in the future, and most of them were concerned due to trust or control-related issues and safety concerns related to AVs.
The question to determine the attitude of respondents toward AVs was included in the survey as a single sentence response question. Based on the responses received, the most frequent responses were further provided in the dataset in the form of coded variables, as shown in the last question of
Table 1. Although the data provided information about users’ willingness to ride AVs, the factors contributing to their positive or negative attitude toward AVs were not clear from the descriptive statistics. While considering respondents’ familiarity with AVs, almost 43.4% of respondents had heard about AVs, and 26.9% of respondents showed a positive attitude toward AVs. However, 52.9% of respondents were willing to ride AVs in the future.
Similarly, in the case of the response toward policies restricting the use of AVs, the majority of respondents (82%) favored regulations to restrict them in dedicated lanes. In the case of restricting them to travel in certain areas, such as schools, 61.9% of respondents supported the regulation. Thus, it could be clearly witnessed that although the majority of people (more than 61.9%) opposed the regulations required for AVs, still 47.1% of respondents were not willing to ride AVs in the future.
The perceptions of respondents also varied in the case of the anticipated effects of widespread AVs, as 81.7% of respondents indicated that elderly and disabled people would live more independently. However, very few respondents (28.5%) thought that AVs would reduce traffic in major cities. Thus, it was not clear from the descriptive statistics which factors primarily influence users’ willingness to ride AVs. Based on the literature, it could also vary depending on their familiarity with the safety features and technology and their personal characteristics. Researchers in the past modeled users’ willingness to ride AVs [
7,
22,
23,
31,
34,
35,
38]. Still, none of the studies modeled the effects of users’ perception of policies restricting the use of AVs, the effects of widespread AVs, and their familiarity with AVs on their willingness to ride AVs. In addition, the effects of respondents’ personal characteristics on their perceptions of various aspects of AVs were not explored in the past.
4.2. Model Development
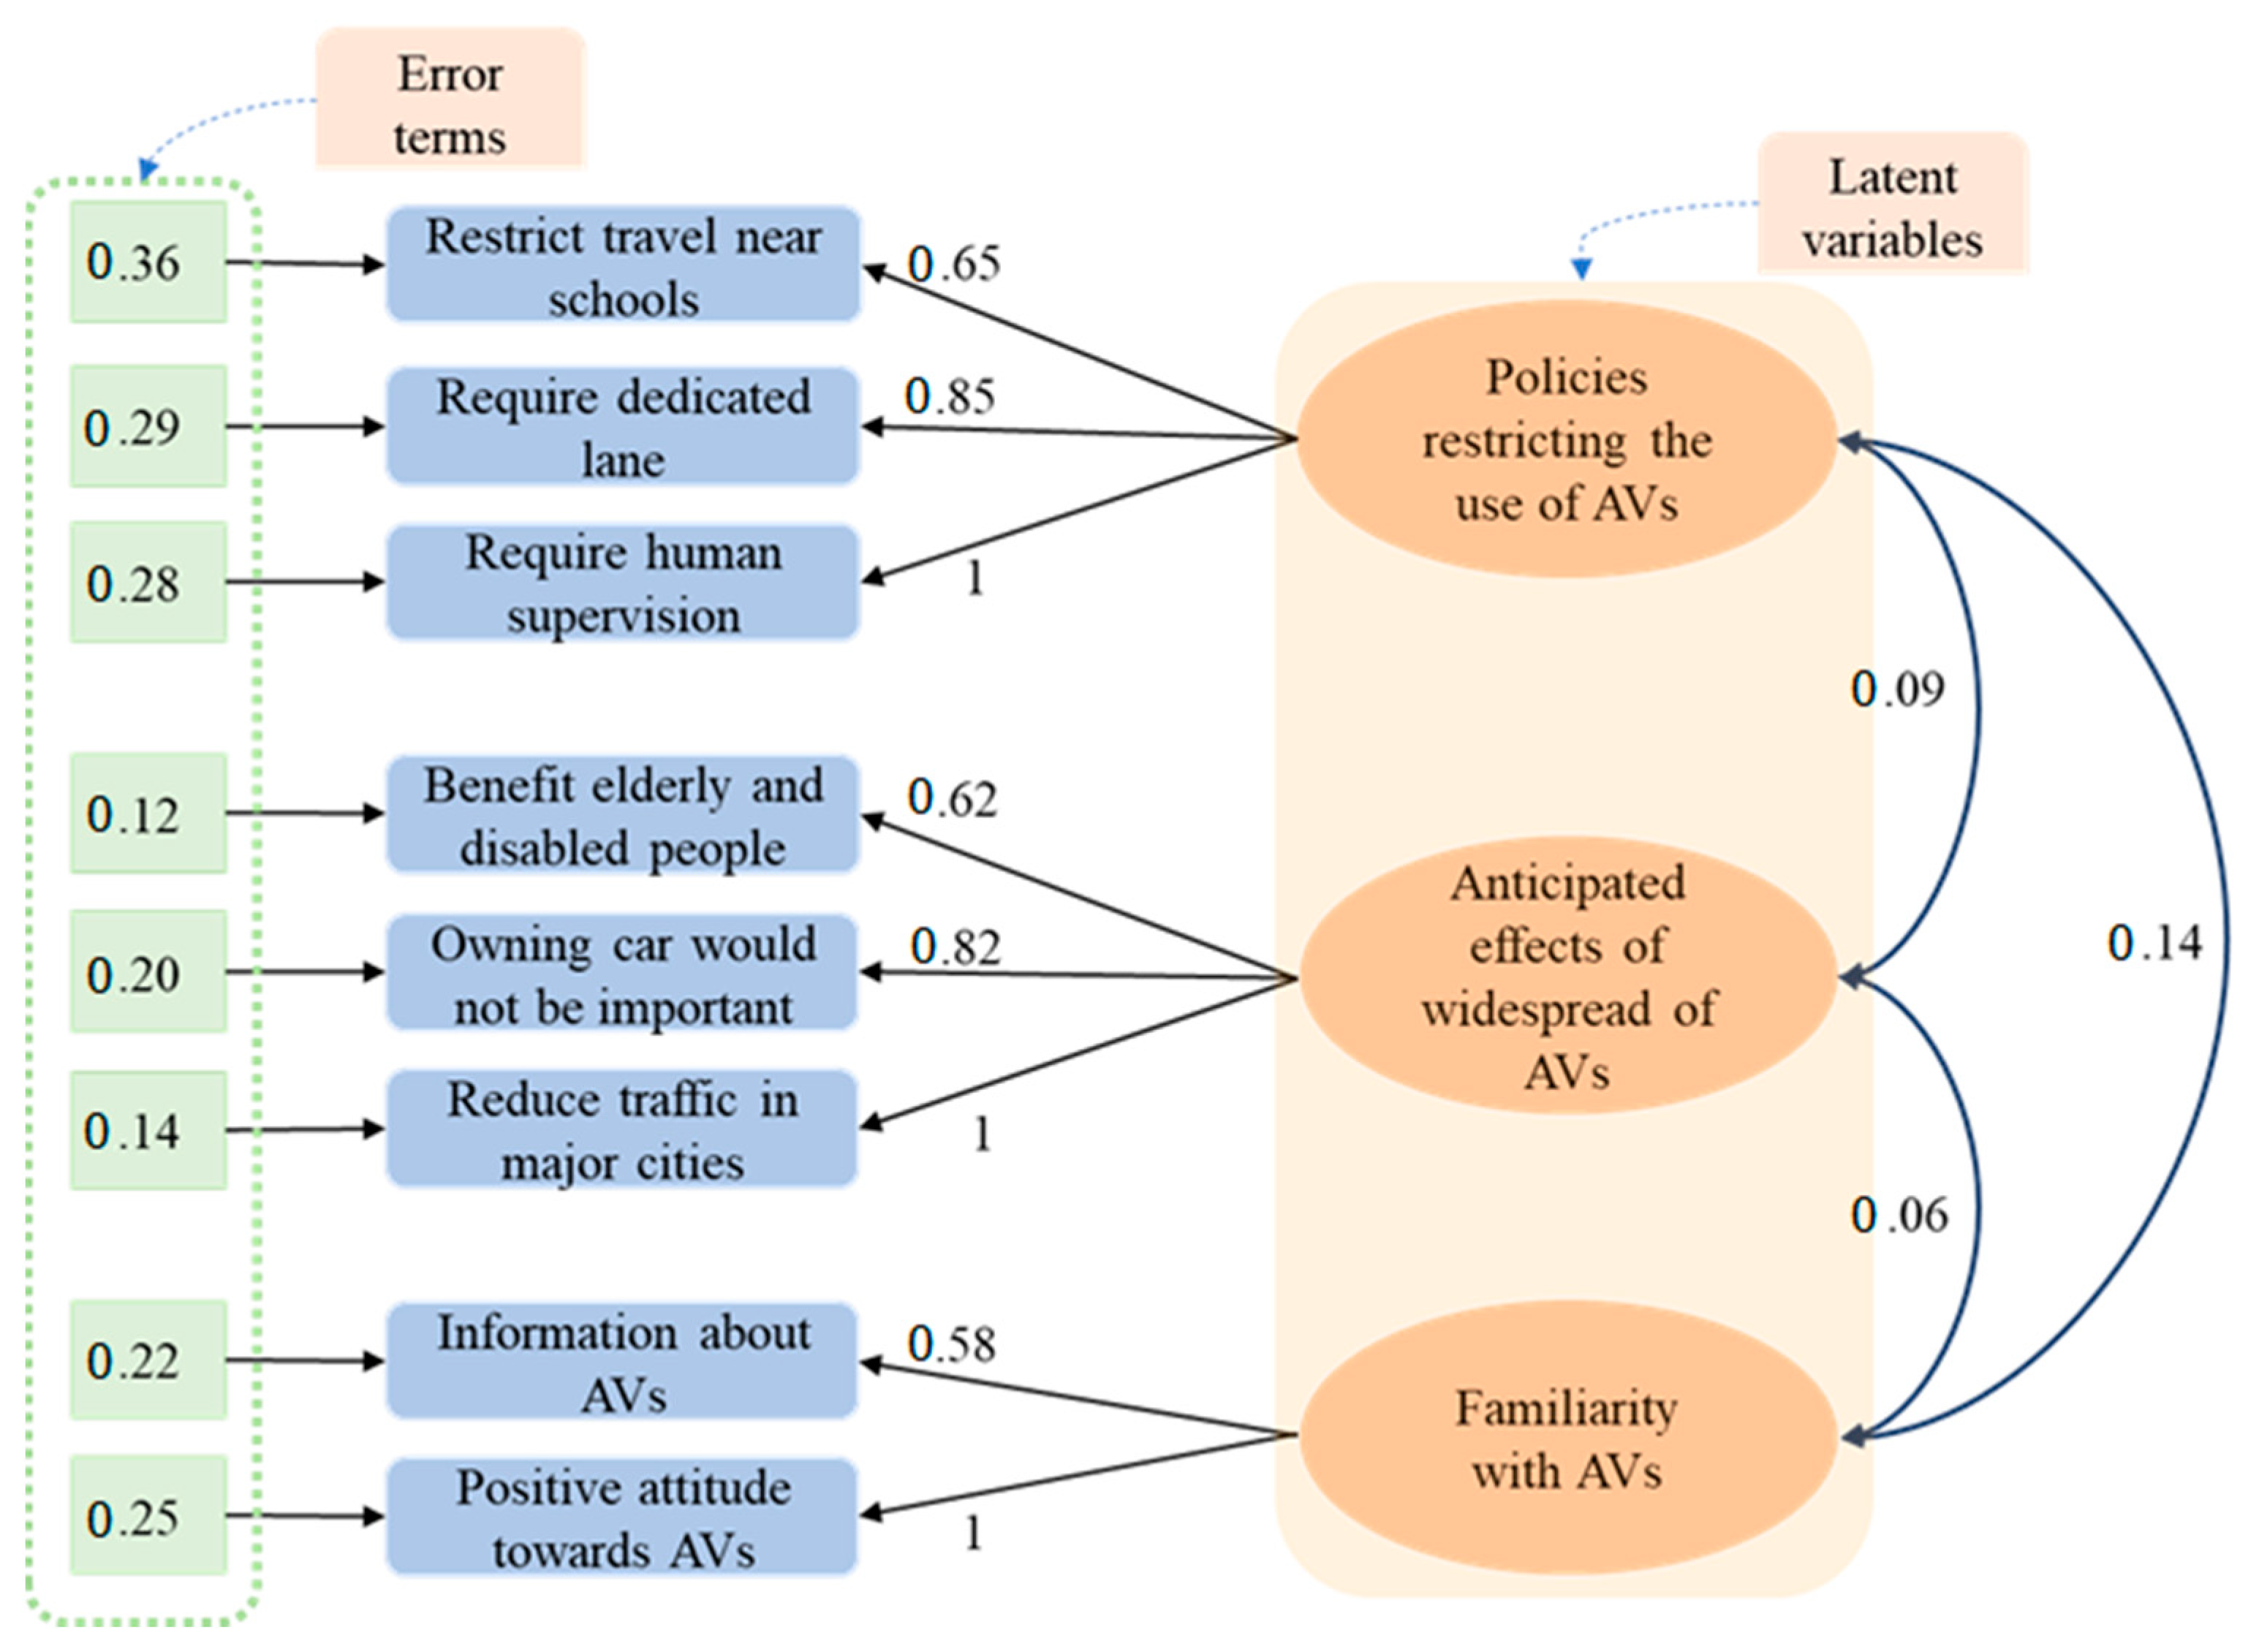
The confirmatory factor analysis model to determine the correlations between various latent variables and identify the effects of explanatory variables on the latent variables is shown in
Figure 1.
Figure 1 shows that all of the variables considered for developing the latent variables accounted for more than 58% of the variation in the latent variables. All of the relationships shown in
Figure 1 were statistically significant at more than a 95% confidence level. The correlations between all latent variables were less than 0.14, indicating that they were uncorrelated. Thus, the three hypotheses (H1, H2, and H3) that the latent variables have a mutual correlation were rejected, as the latent variables were uncorrelated, and the effect of each latent variable on users’ willingness to ride AVs could be modeled considering the three latent variables.
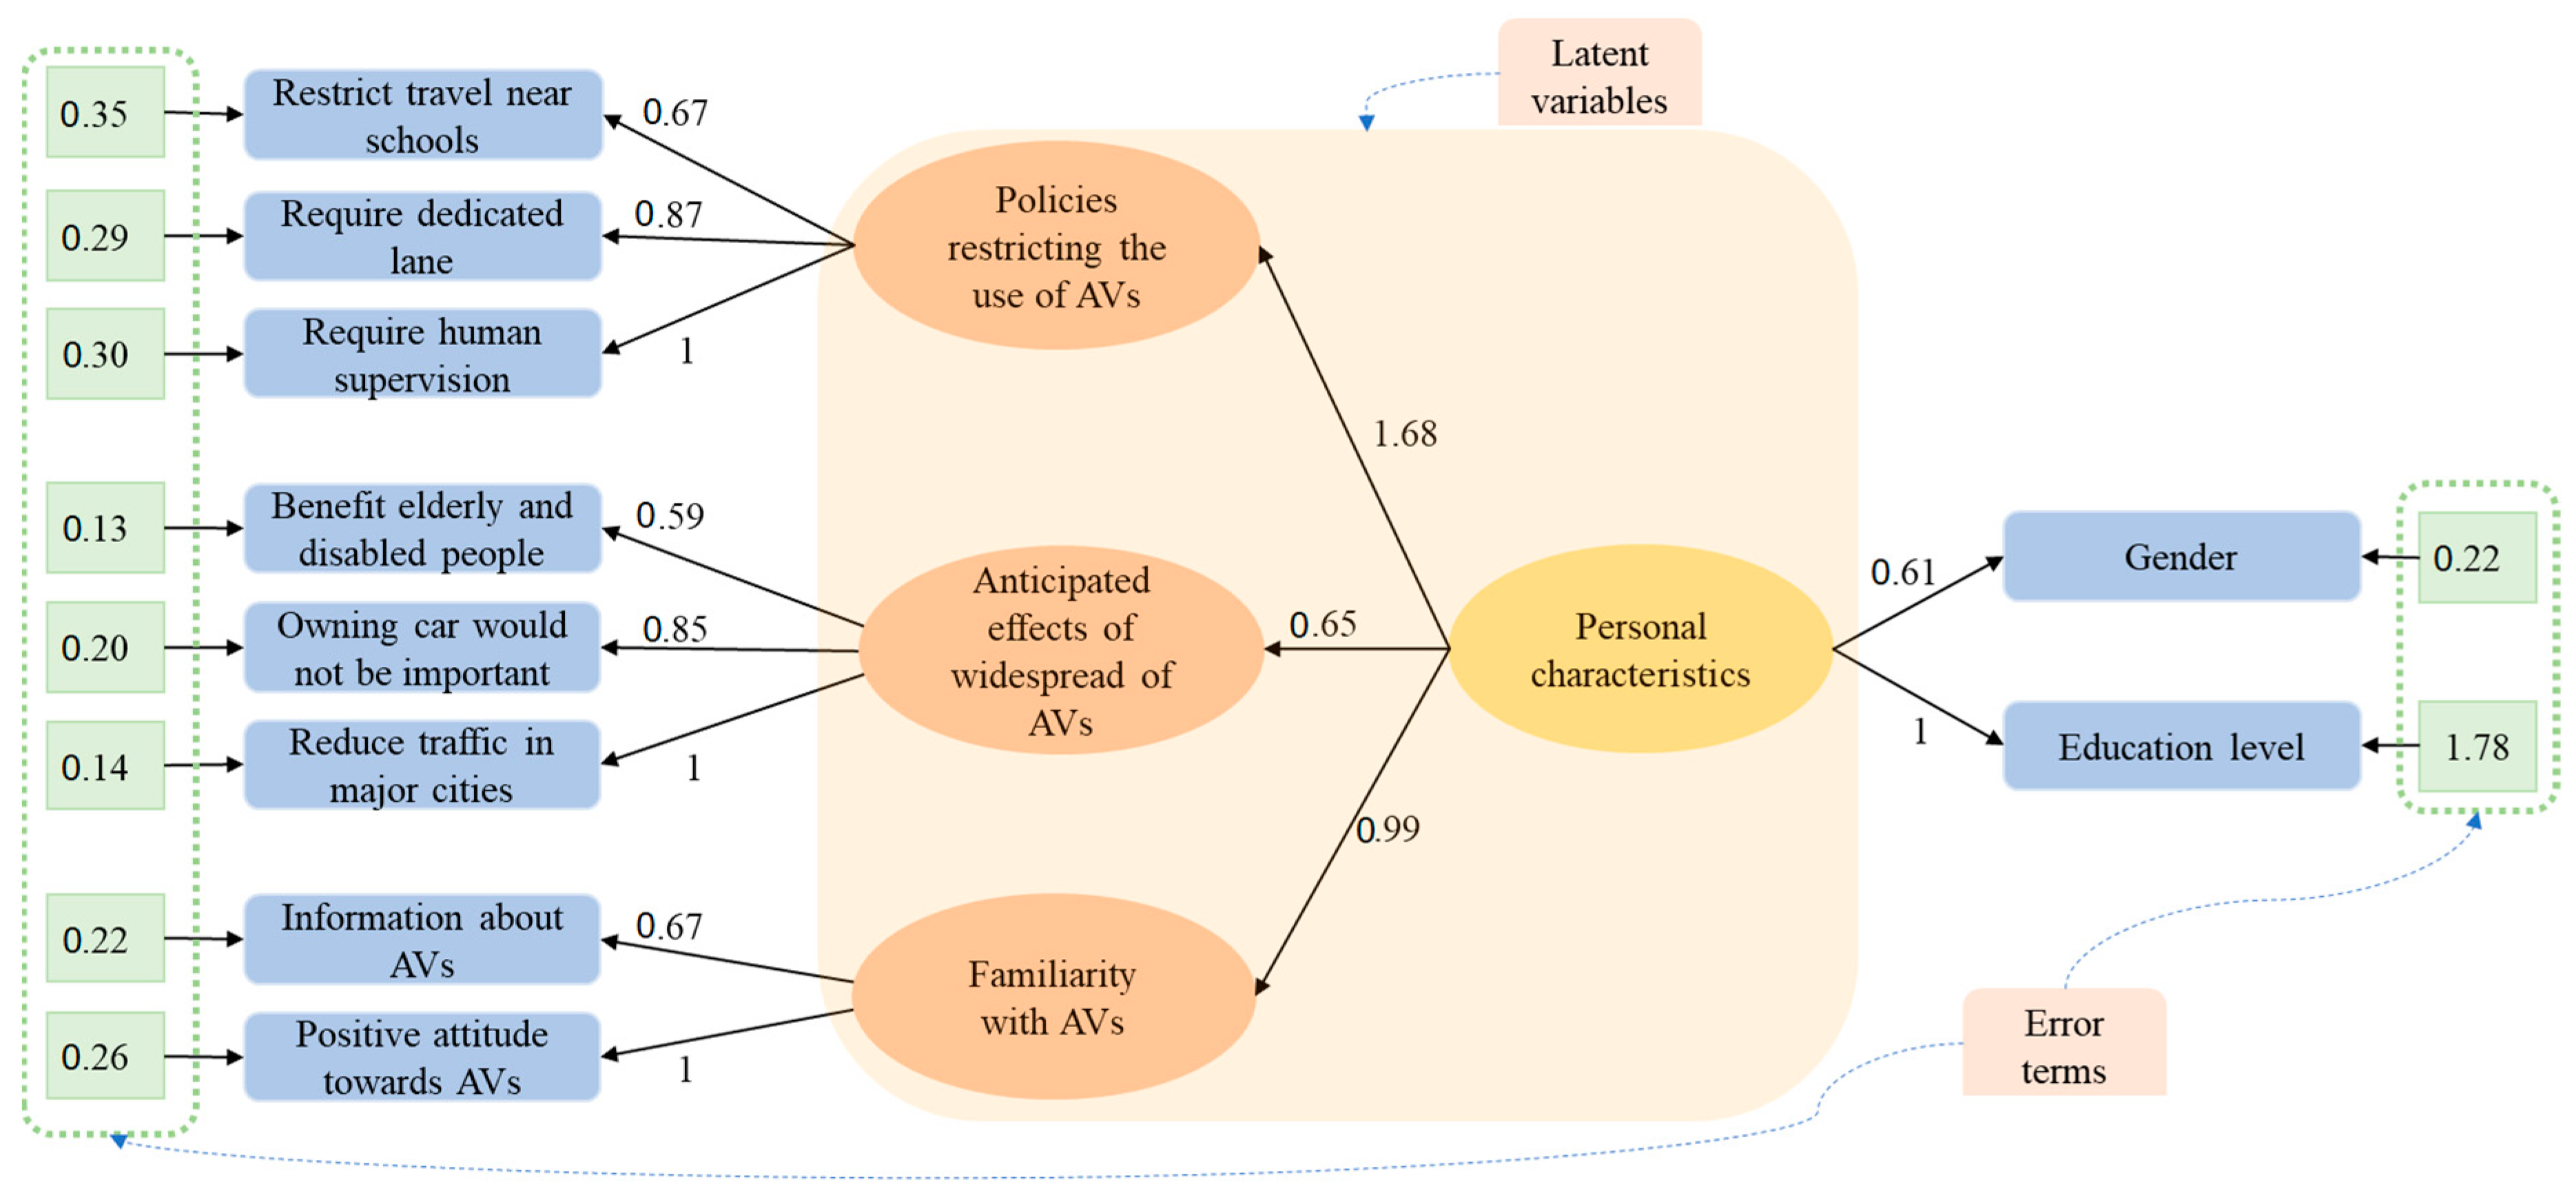
The SEM (Model 2) to identify the effect of users’ personal characteristics on their familiarity with AVs, their perception of policies restricting AVs, and the influence of widespread AVs is shown in
Figure 2.
The SEM in
Figure 2 indicates that personal characteristics such as gender and education level of a person positively influenced their perception of the positive effects of widespread AVs. The effect of personal characteristics on users’ familiarity with AVs was also positive, indicating that respondents with higher education levels were more familiar with AVs. The personal characteristics also indicated a positive attitude toward policies restricting the use of AVs. In other words, female respondents and highly educated people had more positive attitudes toward policies restricting the use of AVs, showing their more precautionary behavior. Further, a unit increase in the response of personal characteristics increased users’ perceptions of the required precautionary measures, widespread AVs, and familiarity with AVs by factors of 1.68, 0.65, and 1, respectively.
Amongst the three factors considered to develop a latent variable for the perception of policies restricting the use of AVs, the requirement of human supervision was the primary policy about which users were concerned. Personal characteristics were also expected to influence users’ positive perception of the effects of widespread AVs. All of the variables in the model were statistically significant at more than a 95% confidence level, as shown in
Table 2.
Table 2 also summarizes the relationships between the latent variables and explanatory variables, which were also statistically significant. The three hypotheses, H4, H5, and H6, were accepted at more than a 95% confidence level, and it was found that personal characteristics positively influenced the three latent variables shown in
Figure 2.
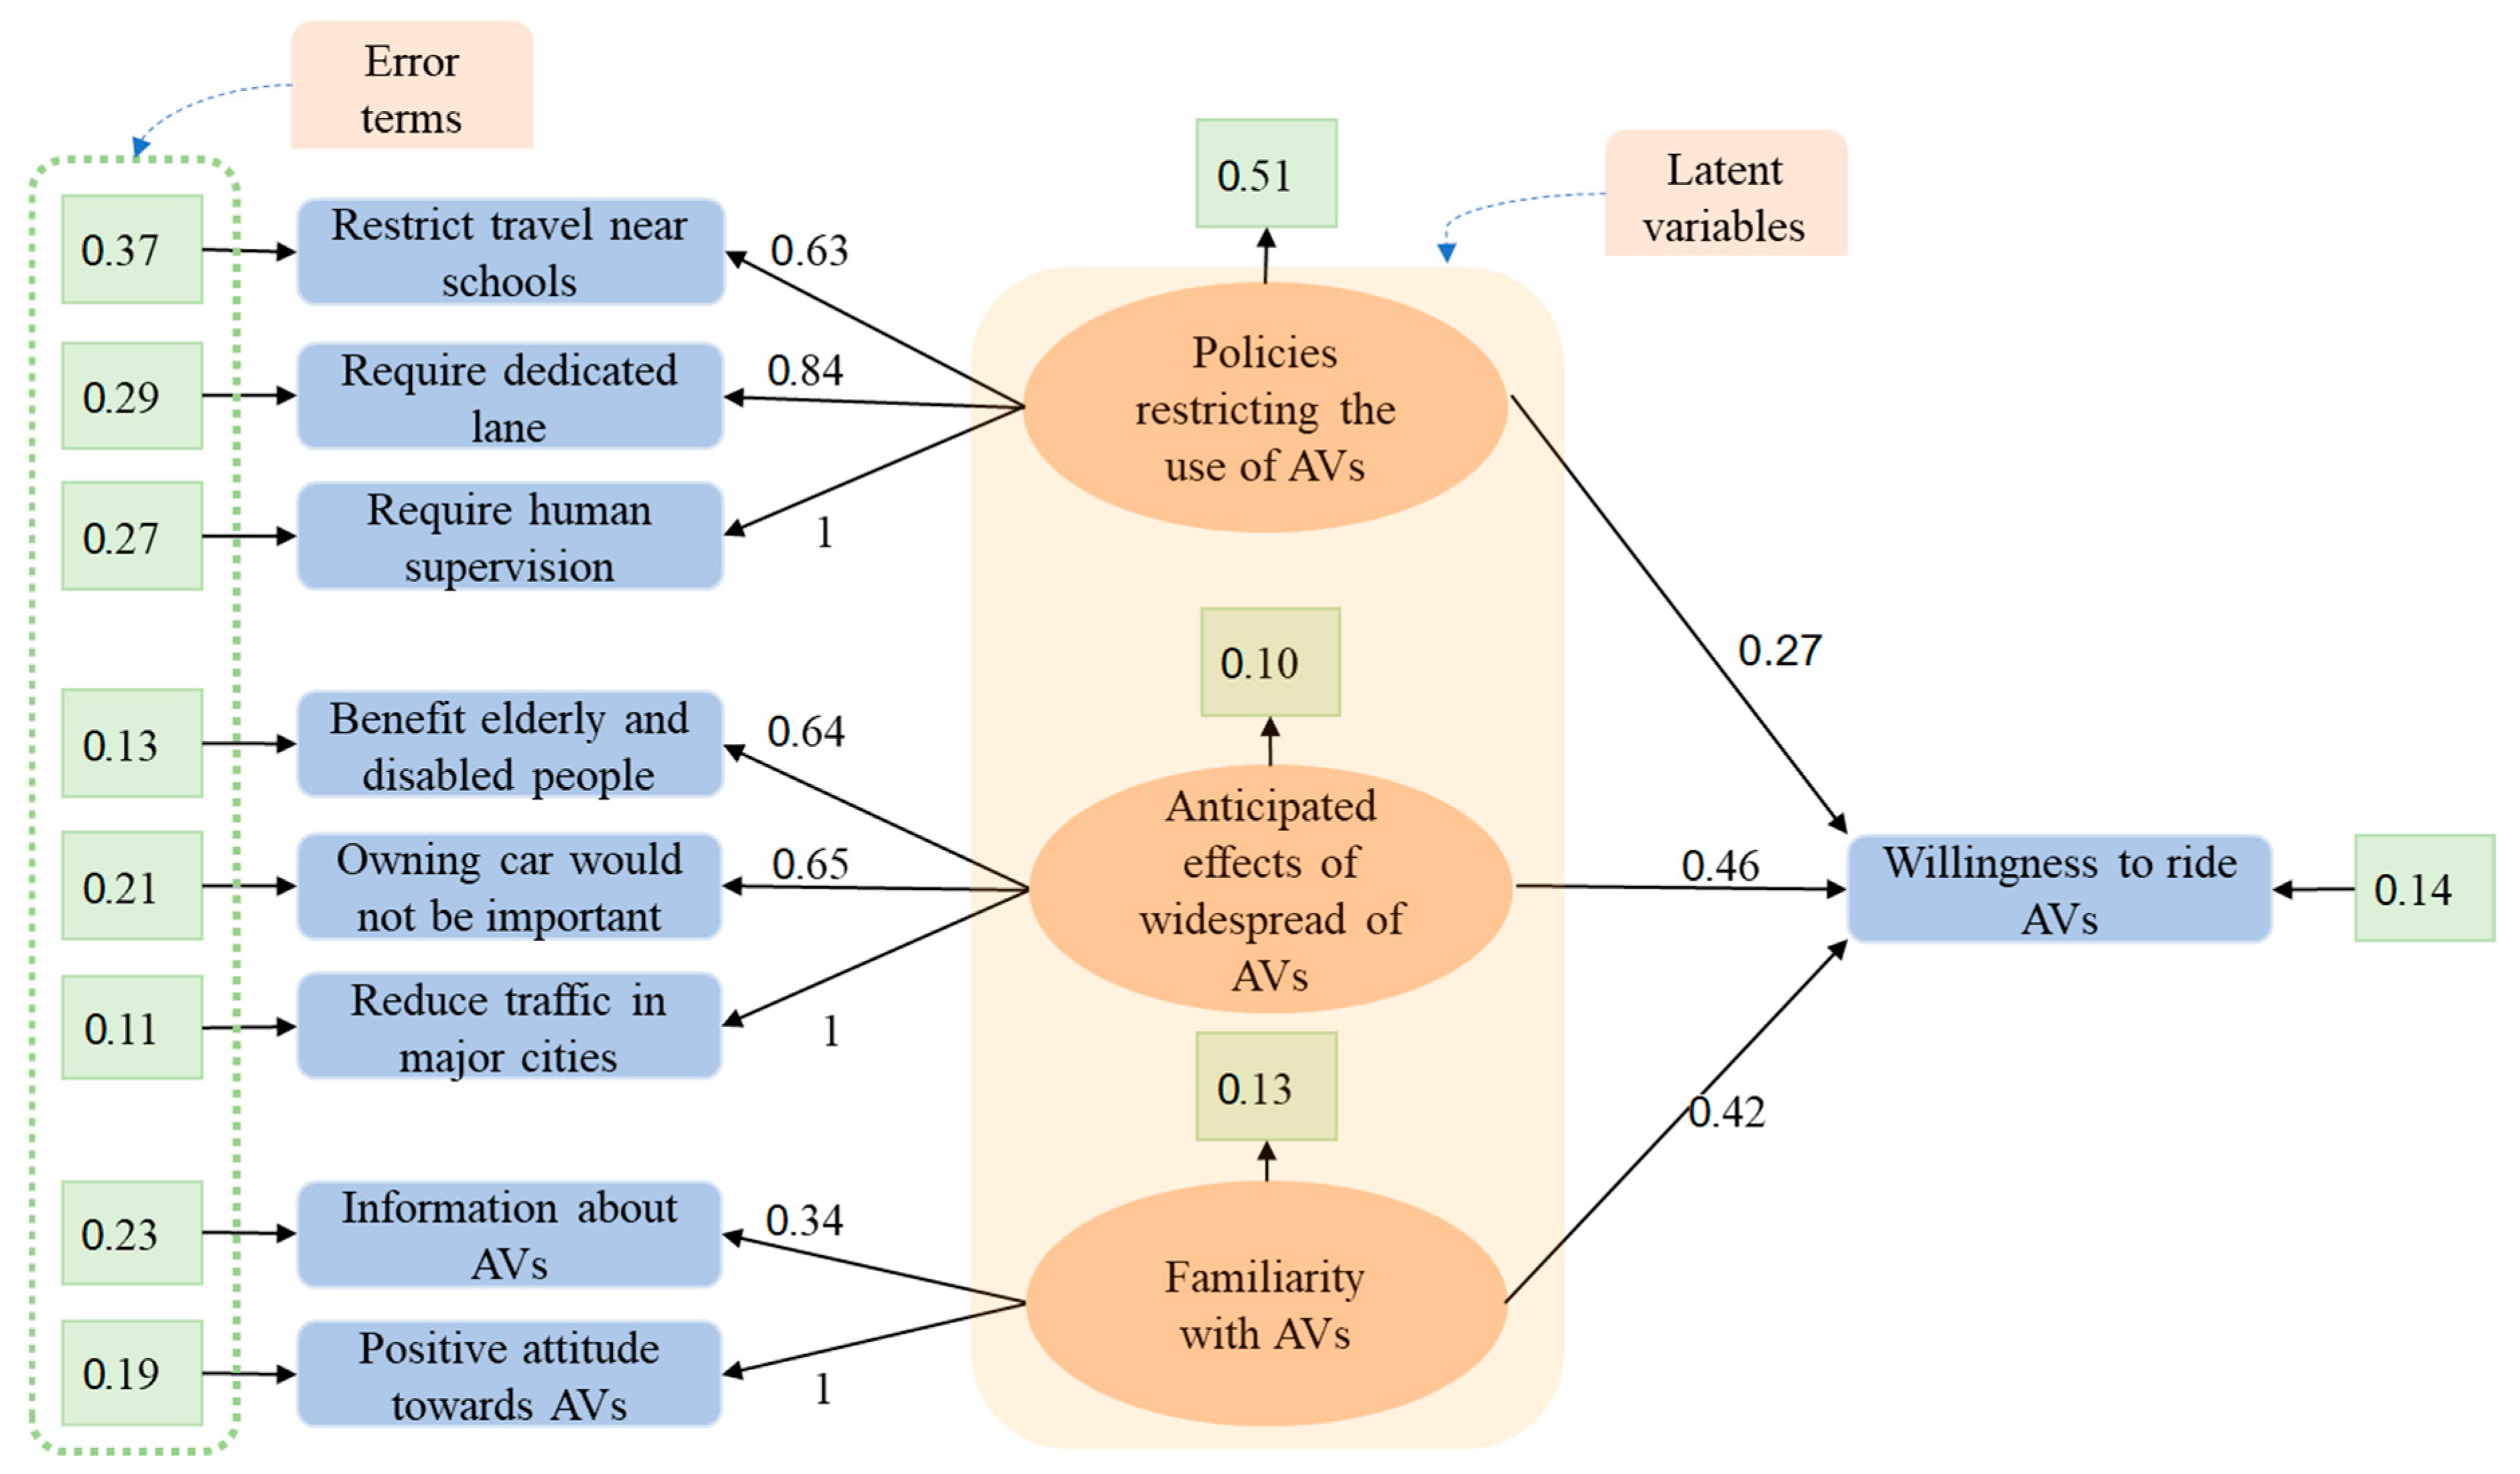
The SEM (Model 3) to identify the effect of each latent variable on the willingness to ride AVs is shown in
Figure 3.
The SEM shown in
Figure 3 indicates that users’ perception of policies restricting AVs, the anticipated effects of widespread AVs, and familiarity with AVs positively influenced their willingness to ride AVs. Amongst the three latent variables, the respondents’ perception of the effects of widespread AVs had a higher influence on their willingness to ride AVs, with a factor of 0.46. Similarly, users with more information about AVs and a positive attitude toward AVs were likely to ride AVs. The respondents in favor of policies restricting AVs were still willing to ride them, which could be to get the experience of driving in an AV. The hypotheses (H7, H8, and H9) that users’ perception of policies restricting AVs, potential conditions in the case of widespread AVs, and their familiarity positively influence their willingness to ride AVs were accepted, and the values of the relationship were found to be positive and statistically significant at more than a 95% confidence level.
The statistical significance of the developed models and the coefficients of the relationships between various variables used in Model 1 (confirmatory factor analysis to determine how different variables are associated in categories), Model 2 (effect of personal characteristics on respondents’ perception of policies restricting AVs), and Model 3 (effect of each latent variable on users’ willingness to ride AVs) are summarized in
Table 2.
The models shown in
Table 2 indicated that all of the parameters included in Models 1, 2, and 3 were statistically significant at more than a 95% confidence level. Further, the factors related to policies restricting AVs were highly influenced by personal characteristics such as gender and education level, indicating the more precautionary behavior of females and highly educated persons. Goodness-of-fit tests were performed to identify the prediction accuracy and to compare model accuracy and the results of those tests are presented in
Table 3.
The Chi-square (χ
2) test was performed to identify a statistically significant difference between the base and constrained model. The results were statistically significant at more than a 99% confidence level, indicating the model with parameters was significantly different from the base model without any parameters, and the included latent variables in the model increased the prediction accuracy. Further, the Akaike information criterion (AIC), which is used to predict the errors and relative quality of a statistical model for a particular dataset [
44], was found to vary among the three models. The Bayesian information criterion (BIC), a criterion for model selection amongst multiple models [
44], also varied like the AIC values. In general, models with lower AIC and BIC values are preferred in the case of model selection amongst multiple alternatives. As all three models tested different hypotheses, the AIC and BIC values could not be compared directly for picking the best model. However, Model 1 had the minimum AIC and BIC values compared to the other two models, indicating a better fit among all three models. The root mean square of residual error (RMR) in SEM is the square root of the difference between the residuals of the sample covariance matrix and the hypothetical model [
45]. The lower the value of RMR, the better the model fit. In the present case, the RMR values were found to be less than 0.11, which was acceptable.
The goodness-of-fit index (GFI) and adjusted goodness-of-fit index (AGFI) are used to measure the discrepancy between the sample covariance matrix and the estimated covariance matrix, and they also provide an idea about the difference of fitted model compared to the base model [
46,
47]. The fit provides weighted values of coefficient of determination ranging from 0 (poor fit) to 1 (perfect fit). The values of GFI and AGFI ranged from 0.71 to 0.60. Although the GFI and AGFI values were below the ideal range, studies also pointed out that parameters have a positive relationship with sample size and are biased by the sample size [
48]. Thus, there is scope for improvement of the model by considering a larger sample size, which is included in the limitations of this research.
5. Results
The direct response, as shown in
Table 1, indicated that respondents’ positive attitudes toward AVs were primarily due to their eagerness to experience traveling in an AV and the benefits that AVs offer, such as better safety, liberty to do other tasks while traveling, and more convenience on longer trips. However, respondents also had negative attitudes toward AVs primarily due to control and trust-related issues and safety concerns related to AVs. The modeling results showed that the latent variable explaining users’ perception of the anticipated effects of widespread AVs had a higher effect on their willingness to ride AVs when compared to their perception of policies restricting the use of AVs. The respondents’ willingness to ride AVs was also influenced positively due to their familiarity with technology.
Although the majority of the users responded in favor of policies restricting the use of AVs, they were still willing to ride AVs, which could be due to other reasons, such as experiencing the new technology or liberty to do other things while driving. Similarly, female and more educated respondents were significantly more in favor of policies restricting the use of AVs, indicating their more conservative behavior toward safety requirements. The study findings show that although users favor policy requirements and are concerned primarily due to safety and trust-related issues with AVs, they are willing to ride AVs primarily to experience driverless vehicle rides and enjoy the liberty of doing other things. Thus, policymakers need to impose restrictions due to safety concerns related to AVs, which would provide a sense of safety to users and increase the willingness to ride AVs rather than discourage users from riding them. By contrast, automobile manufacturers need to be concerned about the safety, trust, and control-related issues of AVs and work on improving the safety features inside the vehicle to increase their market penetration.
User perceptions may vary with time due to the increasing penetration of advanced technologies in the market and changes in the level of user familiarity with technology. Data should be collected at regular intervals, based on technological advancements, to study their influence on the willingness to ride AVs over time. Despite the rapid evolution of AV technology since the data were collected in 2017, the core factors influencing users’ willingness to adopt AVs, such as perceptions of safety, trust in technology, and policy concerns, remain highly relevant. While newer data could offer insights into shifts in public perceptions, the 2017 survey data provide valuable baseline insights into early-stage attitudes toward AVs, making it useful for understanding long-term shifts in perception. However, it is acknowledged that advancements in AV technology and evolving societal attitudes may introduce some biases, which are considered in the analysis. Despite this, the findings still provide valuable insights, and future studies with updated data would help to validate the results in the context of recent developments.
6. Conclusions
Acceptance of any technology (AV technology in this study) by the end users plays a vital role in identifying the potential demand for technology and its future advancement. Users with varying personal characteristics, such as age, gender, and education level, have varying perceptions of AVs. Researchers in the past identified several factors influencing users’ willingness to ride AVs. However, the effects of users’ perceptions of different aspects related to AVs on their willingness to ride AVs were unexplored. Similarly, the effect of policies restricting AVs on users’ willingness to ride AVs was also unexplored. In this manuscript, the effects of factors such as respondents’ perception of policies restricting AVs, their views toward the anticipated effects of AVs, and familiarity with AV technology on their willingness to ride AVs are modeled using confirmatory factor analysis and SEM.
The stated preference survey response data was collected and categorized based on the context in which they were presented to users. The categories (latent variables) were formed using the evidence from past literature. The survey data were filtered to remove the null or unanswered samples, and the final dataset with ten questions was used for the modeling. The data for each variable was reordered to make them more meaningful to the analysis software. Further, latent variables were developed using confirmatory factor analysis, and the relationships between various latent variables were modeled to identify the correlations between different latent variables. The latent variables developed were respondents’ familiarity with AVs, their perception of policies restricting the use of AVs, and anticipated effects of widespread AVs. As all latent variables were not correlated with each other, the effects of personal characteristics on each latent variable were identified using SEM. Finally, the effects of the latent variables on users’ willingness to ride AVs were identified using SEM.
The data showed almost equal positive and negative responses toward the willingness to ride AVs. According to the survey responses, 52.9% of respondents were willing to ride AVs in the future, especially to experience the ride, and several benefits of AVs such as better safety, liberty to do other things while riding, and convenience on long journeys. However, safety and control or trust issues are still the primary concerns of users who prefer not to ride AVs in the future. Recent studies [
5,
49,
50] analyzing real-world crash data of vehicles with smart features highlighted various safety benefits of AVs in different crash scenarios. Similarly, a simulation-based study showed that safety is expected to improve significantly as AV penetration increases [
51]. Given the projected safety improvements, users’ perception of AVs is likely to shift over time, potentially reducing trust and control concerns, which could lead to greater willingness to ride AVs.
From the model results, it was found that users’ familiarity with technology and perception of policies restricting AVs are the primary factors influencing their willingness to ride AVs. The respondents who favored policies to restrict AVs in certain areas are still willing to ride AVs, possibly to experience riding in an AV or have a less stressful trip. In addition, the respondents who were more familiar with AVs and had a positive attitude toward AV technology were more willing to ride AVs. The results also showed several relationships among users’ perceptions of different positive and negative aspects related to AVs. The study also highlighted the effect of factors influencing users’ perception of their willingness to ride AVs. Although the effects of relationships between variables were determined using SEM, the effects of individual factors were not explored in the study. Further, the effects of socioeconomic and demographic characteristics on users’ willingness to ride AVs also demand future research.
One of the limitations of this study is the reliance on stated preference data, which may be influenced by hypothetical bias. To address this, future studies could combine stated preference data with revealed preference data to provide a more accurate representation of actual behavior. Researchers in the past also used mixed logit models and random parameter logit models to identify the effect of users’ perception on their willingness to ride AVs. A similar approach could be explored in future studies to examine the influences of various latent variables related to different aspects of AVs on users’ willingness to ride AVs. In addition, the model developed in this study could be integrated with forecasting techniques to project the potential growth in parking and traffic demand in the future.


