Article

Extending WSN Lifetime via Optimized Mobile Sink Trajectories: Linear Programming and Cuckoo Search Approaches with Overhearing-Aware Energy Models

by
Ghada Turki Al-Mamari
1,*,
Fatma Bouabdallah
2 and
Asma Cherif
1,3
1
Department of Information Technology, Faculty of Computing and Information Technology, King Abdulaziz University, Jeddah 21589, Saudi Arabia
2
School of Engineering, Computing and Mathematics, University of Plymouth, Plymouth PL4 8AA, UK
3
Center of Excellence in Smart Environment Research, King Abdulaziz University, Jeddah 21589, Saudi Arabia
*
Author to whom correspondence should be addressed.
Submission received: 5 May 2025 / Revised: 31 August 2025 / Accepted: 4 September 2025 / Published: 14 September 2025

Abstract

Maximizing the lifetimes of Wireless Sensor Networks (WSNs) is a prominent area of research. The energy hole problem is a major cause of network shutdown, where nodes within the Sink coverage deplete their energy faster due to the high energy cost of forwarding data from distant nodes to the Sink. Several research works have proposed solutions to address this issue, including the use of a mobile Sink to balance energy consumption throughout the network. However, most Sink mobility models overlook the energy consumption caused by overhearing, which is a critical factor in WSNs. In this paper, we introduce Linear Programming (LP) and Cuckoo Search (CS) metaheuristic optimization-based solutions to maximize the lifetime of WSNs by determining the optimal Sink sojourn points and associated durations. The proposed approaches consider the energy consumption levels of both reception and transmission, in addition to accounting for overhearing as an additional source of energy consumption. This allows for a comparison between the LP and CS solutions in terms of their effectiveness. To further enhance our solution, we apply the Travel Salesman Problem (TSP) to find the shortest path between the Sink sojourn points. By incorporating the TSP, we can optimize the routing path for the mobile Sink, thereby minimizing energy consumption and maximizing network lifetime. Test results demonstrate that the LP solution provides more accurate Sink sojourn times and locations, while the CS solution is faster, particularly for large WSNs. Moreover, our findings indicate that overlooking overhearing leads to a 48% decrease in WSN lifetime, making it essential to consider this factor if one is to achieve realistic results.

1. Introduction

Wireless Sensor Networks (WSNs) are becoming more and more ubiquitous, especially when combined with the Internet of Things (IoT). They are used to collect and sense data in many fields. Usually, they are deployed in harsh environments to facilitate data collection and smarter decision making in applications such as military field scenarios [1], healthcare systems [2], and environment monitoring; an example is monitoring the condition and ripeness of date palms in agricultural oases [3]. WSNs generally comprise two types of nodes; the Sink node leads and collects data from many wireless sensor nodes, which are scattered in the target field to serve a given use case.
However, wireless sensor nodes rely on batteries, making them difficult to replace or recharge once they are deployed. Consequently, it is essential to maximize the network lifetime through the efficient use of the nodes’ initial energy, specifically those nodes that are placed near the Sink. These nodes deplete their energy budget first (as illustrated by the red batteries in Figure 1), since they relay distant nodes’ data to the Sink (s) while the other nodes still retain a good amount of their energy (as illustrated by the yellow and green batteries in Figure 1). This problem is known as the energy hole problem, as a hole is created around the Sink [4] (see Figure 1). When sensor nodes within the Sink coverage deplete their energy, the Sink becomes unreachable, making the overall network useless and unable to deliver the sensed data to the Sink for further processing.
Numerous approaches have been proposed to overcome this problem [5], including the strategic deployment of relay nodes between the Sink and sensor nodes to reduce transmission distances, thereby significantly minimizing energy consumption [6]. Some approaches adaptively assign sensor nodes to different transmission power levels [7]. Others implement the non-uniform distribution of initial energy [8], deploy unequal clustering techniques [9,10], or leverage mobile Sink technology [11].
Among adaptive power control solutions, the sensors two or three hops away from the Sink can send data to the Sink directly in order to balance the energy consumed by sensors, thereby bypassing the sensors closest to the Sink. Consequently, the nodes around the Sink are relieved of the relaying task, leading to improved WSN lifetime. Following this strategy, refs. [12,13] proposed protocols that allow sensor nodes to transmit data not only directly to the Sink but also through multiple intermediate hops or paths. This multi-path, multi-hop approach has the effect of more evenly balancing the communications load across the network. Experiments have shown that the employment of multiple paths and hops improved the network lifetime by several orders of magnitude in comparison with single direct transmission or nominal transmission-range models.
For non-uniform initial energy budget distribution approaches, the nearest sensors to the Sink provide more energy budget than other nodes; consequently, they do not drain their energy very quickly. However, the lifetime of these sensors still constrains the whole network, as they relay all data to the Sink. An example of such solutions is the approach suggested in [8]. Here, the authors proposed an algorithm that recognizes the critical region in the WSN which is most likely to suffer from the energy hole problem. The model then finds the required initial sensor energies that best balance the WSN’s energy consumption and lifetime.
In a third approach, many researchers have highlighted the employment of unequal clustering methods to alleviate the energy hole problem and improve the overall energy distribution of WSNs. Smaller clusters are formed near the Sink, while larger clusters are formed in the more distant parts. This configuration reduces the relaying burden on nodes nearby the Sink, thereby saving their energy and extending the lifetime of the network. For instance, ref. [14] used metaheuristic algorithms to dynamically create unequal clusters that were optimized based on their distance to the Sink and residual energy parameters. The results showed improved energy efficiency and lifetime compared to equal-size clustering methods. In the same direction, ref. [15] proposed a hybrid method combining fuzzy logic and Q-learning to adaptively design unequal clusters and learn to select Cluster Heads and routes. Through multi-hop routing and the adaptation of cluster size, their protocol was able to appropriately balance energy consumption across the network, resulting in expanded WSN lifetime.
Finally, a fourth class of solutions assumes that the Sink can move to visit all the sensor nodes. Accordingly, the energy consumption is balanced between nodes, as they drain their energy uniformly and smoothly.
It is worth pointing out that most of the proposed Sink mobility models consider data transmission and reception as the main sources of energy consumption. This ignores the impact of overhearing, which is an important energy consumption source in WSNs [16,17]. Overhearing is often ignored because it adds considerable complexity to the energy model. However, it has a huge impact on WSNs’ energy; hence, ignoring it may totally distort the solution. To fill this research gap and build a more realistic solution, this research considers overhearing as one of the main energy consumption sources.
In this research, we maximize the WSN’s lifetime by exploiting Sink mobility. We define the appropriate routing flow among sensor nodes that balances the energy consumption. The main contributions of this research are as follows:
  • Formalizing a new energy model that considers overhearing as one of the main sources of energy consumption.
  • Solving the maximization problem using Linear Programming while considering the new energy model and assessing the impact of overhearing on the WSN lifetime.
  • Solving the optimization problem using an enhanced swarm-intelligence-based solution.
  • Evaluating and comparing both models in terms of the achieved WSN lifetime and execution time.
  • Finding the Sink’s shortest path to cover all the sojourn points for both models using the Traveling Salesman Problem (TSP) algorithm.
The remainder of this paper is structured as follows: Section 2 provides a comprehensive review of research related to Sink mobility. Section 3 elaborates on the primary constraints within WSN environments, details the network topology implemented, and clearly defines the problem addressed. Section 4 presents a rigorous mathematical formulation of our WSN model. In Section 5 and Section 6, we thoroughly analyze the Linear Programming and Artificial Intelligence solutions along with their respective experimental results. Section 7 offers an in-depth comparative analysis of these two methodological approaches. Section 8 demonstrates the application of the TSP algorithm to determine the optimal path traversing all identified sojourn points. Finally, Section 9 summarizes our findings and discusses potential directions for future research.

2. Related Work

In this section, we present a comprehensive review of the existing Sink mobility models. Our analysis begins with an examination of LP-based approaches, followed by a detailed discussion of AI-driven methodologies.

2.1. LP-Based Sink Mobility Models

Many researchers have investigated the maximization of WSN lifetime through the strategic deployment of a single mobile Sink for data collection from distributed sensor nodes.
Yun et al. [18] proposed a distributed algorithm to maximize the WSN lifetime. They formulated three main constraints (see Section 3) and solved the problem as a linear minimization of the consumed energy. These three constraints are used (i) to limit the total energy consumption for every node, (ii) to guarantee the flow conservation law among sensor nodes, and (iii) to ensure the total amount of traffic delivered to the Sink. Upon establishing these constraints, the authors split the relaxed problem into sub-problems by employing the fractional knapsack problem to devise distributed algorithms for determining whether a node can transmit data to the single mobile Sink or buffer it. Notably, the distributive nature of the proposed algorithms is highly required in WSNs, as it enables each sensor to make forwarding decisions independently without requiring additional packet exchanges between nodes. Moreover, by calculating the average WSN lifetime achieved by this algorithm and comparing it to the optimal WSN lifetime value, they proved that their algorithm is efficient and converges to the optimal value.
In [19], Wang et al. investigated the WSN lifetime optimization through the use of either a mobile relay (a mobile sensor node with unlimited energy) or a mobile Sink. They studied the trade-offs associated with these two approaches. The authors demonstrated that, when deploying both a mobile Sink and a mobile relay node simultaneously, optimal network lifetime is achieved when the mobile relay maintains a two-hop distance from the Sink. This configuration necessitates that, whenever the Sink changes position, it must select a new aggregation node to disseminate the Sink’s updated location to all other nodes in the network. Their findings concluded that the concurrent deployment of both a mobile relay and a mobile Sink maximizes the network life. The suggested solution is efficient, as it fits large-scale networks with a high node density. However, using two mobile entities incurs more communication and computation overhead for building a new route.
Xie L. et al. [20] proposed an optimization model for the movement of Wireless Charging Vehicles (WCVs) in sensor networks. In their approach, a WCV performs the dual function of data collection and node recharging throughout the WSN. The authors proposed a comprehensive travel path for a WCV that simultaneously minimizes energy consumption, facilitates efficient data collection from all nodes, and implements a balanced recharging strategy. They defined a new constraint to ensure that the total traveling time for the WCV is less than its allocated vacation time. Moreover, they defined another energy criterion constraint, ensuring that each sensor node’s energy, initially at E m a x , must be fully recharged to E m a x before the end of the WCV tour. After deriving these constraints, the authors demonstrated that the time-dependent solution is equivalent to the space-dependent solution. Therefore, finding a near-optimal solution requires discretizing the path into a finite number of segments, and subsequently assigning a logical point to each one. If the segment is not sufficiently small, it is further discretized until reaching a gap within ( 1 ϵ ) between the upper and lower bounds. Finally, the authors demonstrated that their suggested algorithm finds the threshold between collecting data and recharging the sensors, which allows the WSN to operate continuously.
In [21], the authors proposed a lifetime maximization model for WSNs called WSNDID, which ensures intruder detection. The model was formulated as a Mixed-Integer Linear Programming (MILP) problem that considers sensor deployment, scheduling, data routing, mobile Sink planning, and detection timing. Due to MILP complexity, a Lagrangean heuristic was applied to reduce computational load while maintaining near-optimal solutions, making it suitable for real-world applications such as border surveillance. The model was evaluated on a grid-structured WSN with sensors positioned at grid corners and Sinks located at cell centers. The authors performed path planning using the relaxed MILP and tested it across six different network sizes. They compared the performance against the Gurobi solver by measuring detection rate, network lifetime, and computational efficiency. They demonstrated that WSNDID achieved higher detection rates and longer lifetime as the network size increases, while Gurobi’s performance declined. This shows that the proposed model is more efficient and scalable, although computational costs remain high because of the mixed-integer nature of the problem.
El-Fouly et al. [22] proposed a comprehensive framework that addresses the critical challenges faced by WSNs with mobile Sink deployment. Their approach significantly enhances energy efficiency by considering various environmental parameters while simultaneously guaranteeing timely data transmission. They tackled three main problems: planning the best path for the mobile Sink, selecting Cluster Heads, and finding the best routing strategy. These problems were modeled using 0/1 Integer Linear Programming (ILP), with objective functions and constraints that consider energy use, environmental risks, and delay. Some of the constraints help avoid dangerous areas, give priority to sensitive zones, and choose reliable nodes that save energy. Since solving ILP for large networks can be very complex, they used swarm intelligence methods to obtain practical solutions. Upon comparative analysis with six state-of-the-art algorithms, their framework demonstrated superior performance in multiple critical metrics: energy conservation, data delivery reliability, and adaptive response to environmental challenges.

2.2. AI-Based Sink Mobility Models

While linear optimization models address certain aspects of the energy hole problem, the emergence of artificial intelligence techniques has opened new avenues for innovative solutions.
In [23], Zhu C. et al. proposed a WSN scheme that is inspired by the honeycomb system. They split the network into hexagons, then assigned a partition ID and a direction value for each one. Sensor nodes are also identified by an integrated addressing value that contains (i) the partition ID, (ii) the direction value, and (iii) the node ID. The node sends its data to the Sink partition through its direction value. Three strategies are defined for the Sink movement strategy: (i) the random movement (RM), (ii) the data volume-based greedy movement (DGM), and the energy-based greedy movement (EGM). The authors simulated the three proposed strategies and evaluated their performance against multiple metrics: average energy consumption, maintenance overhead, packet collection ratio, and packet loss rate. The testing results showed that the Honeycomb Structure with DGM (HSDG-DGM) outperformed the alternative approaches.
Zhang H. et al. [24] proposed a strategy for collecting data using ant colony optimization. A new method is proposed for selecting rendezvous nodes based on entropy weighting of several indicators, such as relative residual energy and node density. The algorithm enables the identification of the most suitable access path to the mobile Sink while minimizing energy consumption in the WSN and tolerating some delay to compensate for energy usage. The simulation results showed that the suggested model balances the energy consumption between sensed nodes. However, the main shortcoming is that the algorithm minimizes the residual energy of the whole network rather than maximizing the WSN’s lifetime.
Jong G. J [25] proposed another AI-based model termed QHBM for maximizing the WSN lifetime. This approach was inspired by the intelligent migration patterns and collective behavior of honey bee colonies in nature. In this biologically inspired QHBM model, the central Sink node functions as the queen bee. Each cluster within the network topology is governed by a designated Cluster Head (CH). If the energy of the CH reaches a given threshold, it is replaced with a new CH with higher residual energy. The CH nodes play the role of bee scouts, predestined to lead the Sink to come over. The authors demonstrated that the QHBM architecture alleviates the routing overhead as the Sink communicates only with the CH nodes. Consequently, only CHs need the updated location of the Sink. Moreover, the solution provides a balanced energy consumption model, since it relies on a scanning step in which the Sink searches for the CH nodes with the highest residual energy to visit.
Ref. [26] focused on reducing sensor energy consumption in IoT networks to improve the network lifespan. A hybrid metaheuristic approach combining the Whale Optimization Algorithm (WOA) with Simulated Annealing (SA) is proposed to optimize energy consumption through strategic Cluster Head (CH) selection within the IoT network architecture. Multiple performance metrics, such as load, temperature, residual energy, number of alive nodes, and a cost function, were used to choose the optimal CH in the IoT network clusters. The proposed hybrid methodology is subsequently evaluated against several established optimization techniques, including the Adaptive Gravitational Search algorithm, the Artificial Bee Colony algorithm, the Genetic Algorithm, and the standard Whale Optimization Algorithm. The results demonstrated the superiority of the proposed hybrid approach over existing methods.
In [27], the authors addressed the hot spot problem in WSNs through the development of the EPMS algorithm, which integrated PSO and mobile Sink technology to form energy-efficient clusters. Initially, PSO divides the network into distinct regions by calculating each region’s gravitational center. Cluster Heads are subsequently designated based on their proximity to the calculated centroid and their corresponding residual energy. Then, the PSO algorithm iteratively optimizes the cluster formation while preserving optimal candidate solutions. The mobile Sink subsequently calculates the mean residual energy metric for each cluster to determine its optimal traversal trajectory. The authors evaluated EPMS against LEACH and TTDD, demonstrating superior energy efficiency metrics and enhanced data delivery ratios, attributable to the algorithm’s adaptive CH selection mechanism and optimized Sink mobility patterns. However, the iterative computation of mean residual energy parameters by the Sink node introduced significant computational overhead, particularly in large-scale WSNs.
Ref. [28] proposed a Deep Reinforcement Learning Framework for lifetime maximization in Wireless Sensor Networks (HGFF), which integrated heterogeneous graph neural networks (GNNs) with Deep Reinforcement Learning (DRL) to maximize WSN lifetime. The WSN is formalized as a heterogeneous graph structure. GNNs learn node representations by aggregating neighbor data and capturing hierarchical features, with a multi-head attention mechanism enabling Sink nodes to selectively prioritize relevant sensor information. A greedy policy framework was trained to iteratively select optimal Sink positions and construct energy-efficient movement paths. The HGFF framework underwent rigorous evaluation across ten distinct network configurations encompassing both static and dynamic WSN deployment scenarios, and was benchmarked against established heuristic algorithms and state-of-the-art DRL-based methodologies. Experimental results consistently showed that HGFF outperforms existing approaches in terms of both network lifetime and computational efficiency metrics, thereby validating its applicability and efficiency for real-world WSN deployments.
In [29], the authors proposed a new protocol called ExAq-MSPP to improve energy efficiency in WSNs. The researchers implemented an enhanced Aquila Optimization Algorithm incorporating chaotic mapping functions to facilitate optimal trajectory determination for the mobile Sink node. Initially, sensor nodes are strategically deployed utilizing Voronoi diagrams to ensure uniform spatial coverage across the monitoring region. Subsequently, network clusters are established through an enhanced variant of the LEACH protocol that designates Cluster Heads based on residual energy parameters and communication cost metrics. The mobile Sink moves around the network following an optimized route that reduces propagation delay, conserves energy, and facilitates efficient data collection. Simulations showed that ExAq-MSPP consistently outperforms contemporary methodologies across multiple performance metrics, including end-to-end latency, energy consumption efficiency, network longevity, and data throughput.

2.3. Non-LP/AI Sink Mobility Models

Nusaiba N. et al. [30] proposed an enhanced version of the LEACH protocol incorporating a mobile Sink instead of a conventional static approach. In the original LEACH version, the sensor nodes are randomly distributed, with CH selection executed locally by each node based on statistical parameters. CHs are systematically reappointed at each round to balance energy. In certain instances, the newly designated CH is too close to its predecessor, thereby accelerating energy depletion. To address this topological inefficiency, the authors delegated CH selection authority to the mobile Sink node, implementing a centralized decision-making architecture. The mobile Sink traverses along the vertical Y-axis, with its positional coordinates recalculated at each transmission cycle based on the geographical distribution of CHs and their respective data transmission volumes. The protocol efficiency was evaluated using multiple parameters, including alive nodes, dead nodes, energy dissipated, residual energy, throughput, and latency. Extensive MATLAB simulations conducted on a network configuration comprising 100 sensor nodes demonstrated a quantitative improvement of 5% improvement in alive nodes and 64% in residual energy compared to the standard LEACH protocol, indicating enhanced performance. However, the methodology exhibited several limitations. First, the experimental validation was tested on a single network size, which limits the statistical reliability of the results. Secondly, the 5% improvement in alive nodes represents a marginal enhancement that may not be statistically significant. Lastly, the simulation framework neglects the overhearing phenomena, potentially compromising the accuracy of the comparative analysis.
Abu Taleb et al. [31] proposed a mobility model that aims to improve data collection in WSNs with a mobile Sink. Their architectural model employs a bipartite graph approach to partition the sensor node population into two mutually exclusive subsets. The Sink initiates its trajectory by visiting one of the sets using a breadth-first traversal approach that depends on the Euclidean distance between nodes. After completing the first subset, the mobile Sink moves to the second subset, maintaining identical traversal methodology. During the visit, the Sink can also collect data from neighboring nodes that belong to the other subset, which reduces buffer overflow and data delays. The model was evaluated using NS-2 simulator and compared against three other models. The results showed that the proposed model achieves better performance in terms of delay, delivery ratio, and throughput, especially in medium-sized networks and with moderate Sink speed.
Mohapatra et al. [32] proposed a routing protocol specifically designed for Wireless Sensor Networks (WSNs) with mobile Sinks. Their approach aims to address several critical challenges in such networks, including hot spot formation, increased transmission delay, and non-uniform energy consumption in the vicinity of the Sink node. Their protocol builds a virtual ring architecture consisting of one-hop or two-hop neighbor nodes around the mobile Sink. This ring serves as a mechanism to disseminate the Sink’s location to CHs, thereby reducing the control overhead usually associated with Sink mobility. The Sink itself moves based on a greedy geographic strategy that favors regions with high-priority data. The protocol also includes a dynamic CH selection method that considers the remaining energy and the distance to the Sink. Additionally, the ring can be reconfigured if some nodes run out of energy or when the Sink moves to a new position. Simulations demonstrated that the proposed protocol outperformed other established protocols such as LBDD and Mob M-LEACH, particularly in throughput, energy efficiency, and end-to-end delay metrics.

2.4. Discussion

WSNs face many challenges in energy efficiency that directly impact network lifetime and operational sustainability. The energy hole problem remains a critical limitation in static Sink deployments. To address this challenge, mobile Sink strategies have emerged as promising solutions, offering more balanced energy consumption across the network. However, the effectiveness of these mobile Sink approaches depends significantly on the underlying methodologies, trajectory planning algorithms, and energy consumption models employed. This section presents a comprehensive evaluation of existing mobile Sink strategies in WSNs, systematically comparing their methodological frameworks, performance characteristics, and practical limitations. By examining the state-of-the-art across LP-based, AI-based, and Non-LP/AI approaches, we identify critical research gaps and establish the foundation for our novel contribution that integrates overhearing-aware energy modeling with advanced optimization techniques.

2.4.1. Comparative Analysis

In this section, we present a comprehensive analysis of the existing literature on Sink mobility in WSNs, categorized into three primary approaches: LP-based, AI-based, and Non-LP/AI models. Each approach offers distinct advantages and limitations in addressing energy efficiency and extending network lifetime. The key features, advantages, limitations, consideration of overhearing, energy balancing, and/or lifetime maximization are summarized in Table 1, Table 2 and Table 3.
Table 1 presents the LP-based approaches for mobile Sink approaches. These methods formulate the network lifetime maximization as mathematical programming problems with constraints related to energy consumption, data flow, and routing. Although these LP-based approaches offer near-optimal solutions with theoretical guarantees, they often encounter scalability challenges in large-scale networks and fail to account for overhearing effects, which can significantly impact energy consumption in practical deployments.
Table 2 presents a detailed comparison of various AI-based approaches for mobile Sink optimization in WSNs. These methods leverage various metaheuristic algorithms and machine learning techniques to determine optimal Sink movement patterns and Cluster Head selection. AI-based approaches generally offer greater adaptability and flexibility compared to LP-based methods, particularly in dynamic environments. However, they predominantly focus on energy balancing rather than direct lifetime maximization and still overlook the critical factor of overhearing in their energy models.
Table 3 summarizes the diverse Non-LP/AI approaches that leverage alternative techniques such as graph-based methods for Sink mobility optimization. These techniques often employ clustering mechanisms like LEACH with modifications to accommodate mobile Sinks; while these approaches generally require less computational resources than the LP or AI-based methods, they exhibit limited scalability and have been predominantly tested only on small–medium-sized network configurations. Similar to other approaches, these approaches neglect critical effect of overhearing and prioritize energy balancing over lifetime maximization.

2.4.2. Critical Gaps in the Literature

Our comparative analysis reveals several significant research gaps in the existing literature:
  • Overhearing:
    Consistently overlooked in prior research, compromising the accuracy of energy consumption estimation models.
  • Optimal Mobile Sink Trajectory: Predominantly addressed through heuristic or partial solutions, leaving the determination of truly optimal trajectories largely unexplored.
  • Dynamic Adaptability: Significantly enhanced in AI-based models compared to LP or non-LP/AI approaches when responding to changing network conditions.
  • Environment and Scalability: Severely limited in LP approaches when applied to large networks, restricted to small-to-medium networks in non-LP/AI methods, and rarely accounting for environmental factors across all approaches.
  • Lifetime vs. Energy: Theoretically maximized in LP methods despite limited practical adaptability, while primarily focused on energy balancing rather than lifetime maximization in AI and non-LP/AI approaches.

2.4.3. Research Contribution

To address these critical gaps, we present a comprehensive energy model that achieves the following remedies:
  • Incorporates overhearing effects to significantly enhance energy consumption estimation accuracy.
  • Integrates both AI-based optimization techniques (Cuckoo Search algorithm) and Linear Programming approaches.
  • Dynamically optimizes routing paths and Sink positioning strategies across variable network scales.
  • Maximizes WSN lifetime through strategic energy balancing and consumption optimization.
  • Accounts for critical real-world environmental factors to ensure effective practical deployment (e.g., overhearing phenomena).
This two-pronged approach offers a strong tool for WSN energy optimization by integrating theoretical optimization (LP), adaptive AI, and real-world deployment (overhearing).

3. System Model

In this section, we examine the most widely acknowledged constraints identified in the reviewed literature and present our comprehensive system model.

3.1. Main Constraints of Sink Mobility Approach

In our comprehensive review of state-of-the-art solutions addressing Sink mobility and WSN lifetime maximization, we identified three fundamental conditions that are consistently applied across the literature when modeling network nodes (i.e., both Sink and sensor nodes).
First, we define two constraints for each sensor node, namely the energy constraint and the flow conservation law:
  • The energy constraint: this constraint states that the total energy consumed at each node by the data reception and transmission must not overextend its initial allocated energy.
  • The flow conservation law: every node should satisfy the equality between the total incoming flow rates added to the self-generated data rate and the sum of the resulting outgoing flow rates at any time.
As for the Sink, it has to satisfy the following constraint:
  • The total traffic received by the Sink in a given duration must equal the total of the data generated by all the sensor nodes in the same duration.

3.2. Assumptions and Network Topology

In our context, we employ LP to find the optimal Sink sojourn locations and durations that maximize the WSN lifetime, while ensuring each node’s cumulative energy consumption remains within its initial energy capacity. Most Sink mobility models only consider data transmission and reception as the main sources of energy consumption. However, in reality, WSNs experience additional sources of energy drains, particularly from phenomena such as overhearing and packet collision [16,33]. We propose an LP model that determines optimal Sink sojourn points and durations while maximizing network lifetime by incorporating the critical energy consumption component due to overhearing. Naturally, our model predicts shorter WSN lifetimes compared to solutions that ignore overhearing effects, but our priority is developing a model that reflects realistic WSN communication scenarios with maximum fidelity.
This research adopts the network model proposed by Wang et al. [34] as its foundational framework, wherein the authors formulate an LP model to maximize the mobile Sink’s sojourn duration while maintaining balanced energy consumption across the entire WSN grid. Our contribution extends this model by incorporating previously unaccounted energy consumption due to packet overhearing, a significant factor affecting the network lifetime. Building upon Wang et al.’s work, which provides a mathematical formulation for energy consumption in a square grid, we adopt the same regular grid structure to extend the model. In such a topology, each sensor node has a deterministic number of neighbors, enabling precise analytical calculation of energy dissipation due to overhearing during packet-forwarding operations.
Although deploying wireless sensor nodes in a regular grid represents an idealized configuration, this approach offers several significant methodological advantages. First, it establishes a rigorous foundation for our mathematical model, particularly regarding the quantification of overhearing energy consumption, which constitutes the primary contribution of this work. Second, the regular structure enables precise identification of energy consumption sources for each sensor, including neighbor count and overhearing-related energy losses—essential factors for developing a tractable analytical model.
It is worth noting that several real-world applications utilize strategically placed sensors in predefined regular patterns, such as grid layouts. This renders our assumption valid within specific operational contexts. In contrast, random topologies would require a primarily simulation-based methodology, as the varying number of neighbors across nodes would significantly complicate the creation of a universal mathematical model for energy consumption.
The proposed methodology is based on the following key assumptions:
  • The network consists of a bi-dimensional square grid with size N = L × L , where N represents the total number of static sensors.
  • The Sink can move among nodes in the grid to collect data, with negligible moving time compared to its sojourn time.
  • All sensors can communicate with the Sink during its sojourn time through either one-hop or multi-hop communication schemes.
  • The primary sources of energy consumption are data reception, transmission, and overhearing. Notably, the consideration of overhearing constitutes our main contribution.
  • All sensors are homogeneous, possessing identical data generation rates, power consumption rates, and transmission ranges.
  • Communication channels are error-free, symmetric, and bi-directional.
  • All sensors are equipped with the same limited initial energy and unlimited buffer size.
  • When the Sink is neither co-located with a sensor nor directly connected to it, communication between them occurs through the shortest path in the multi-hop scheme.
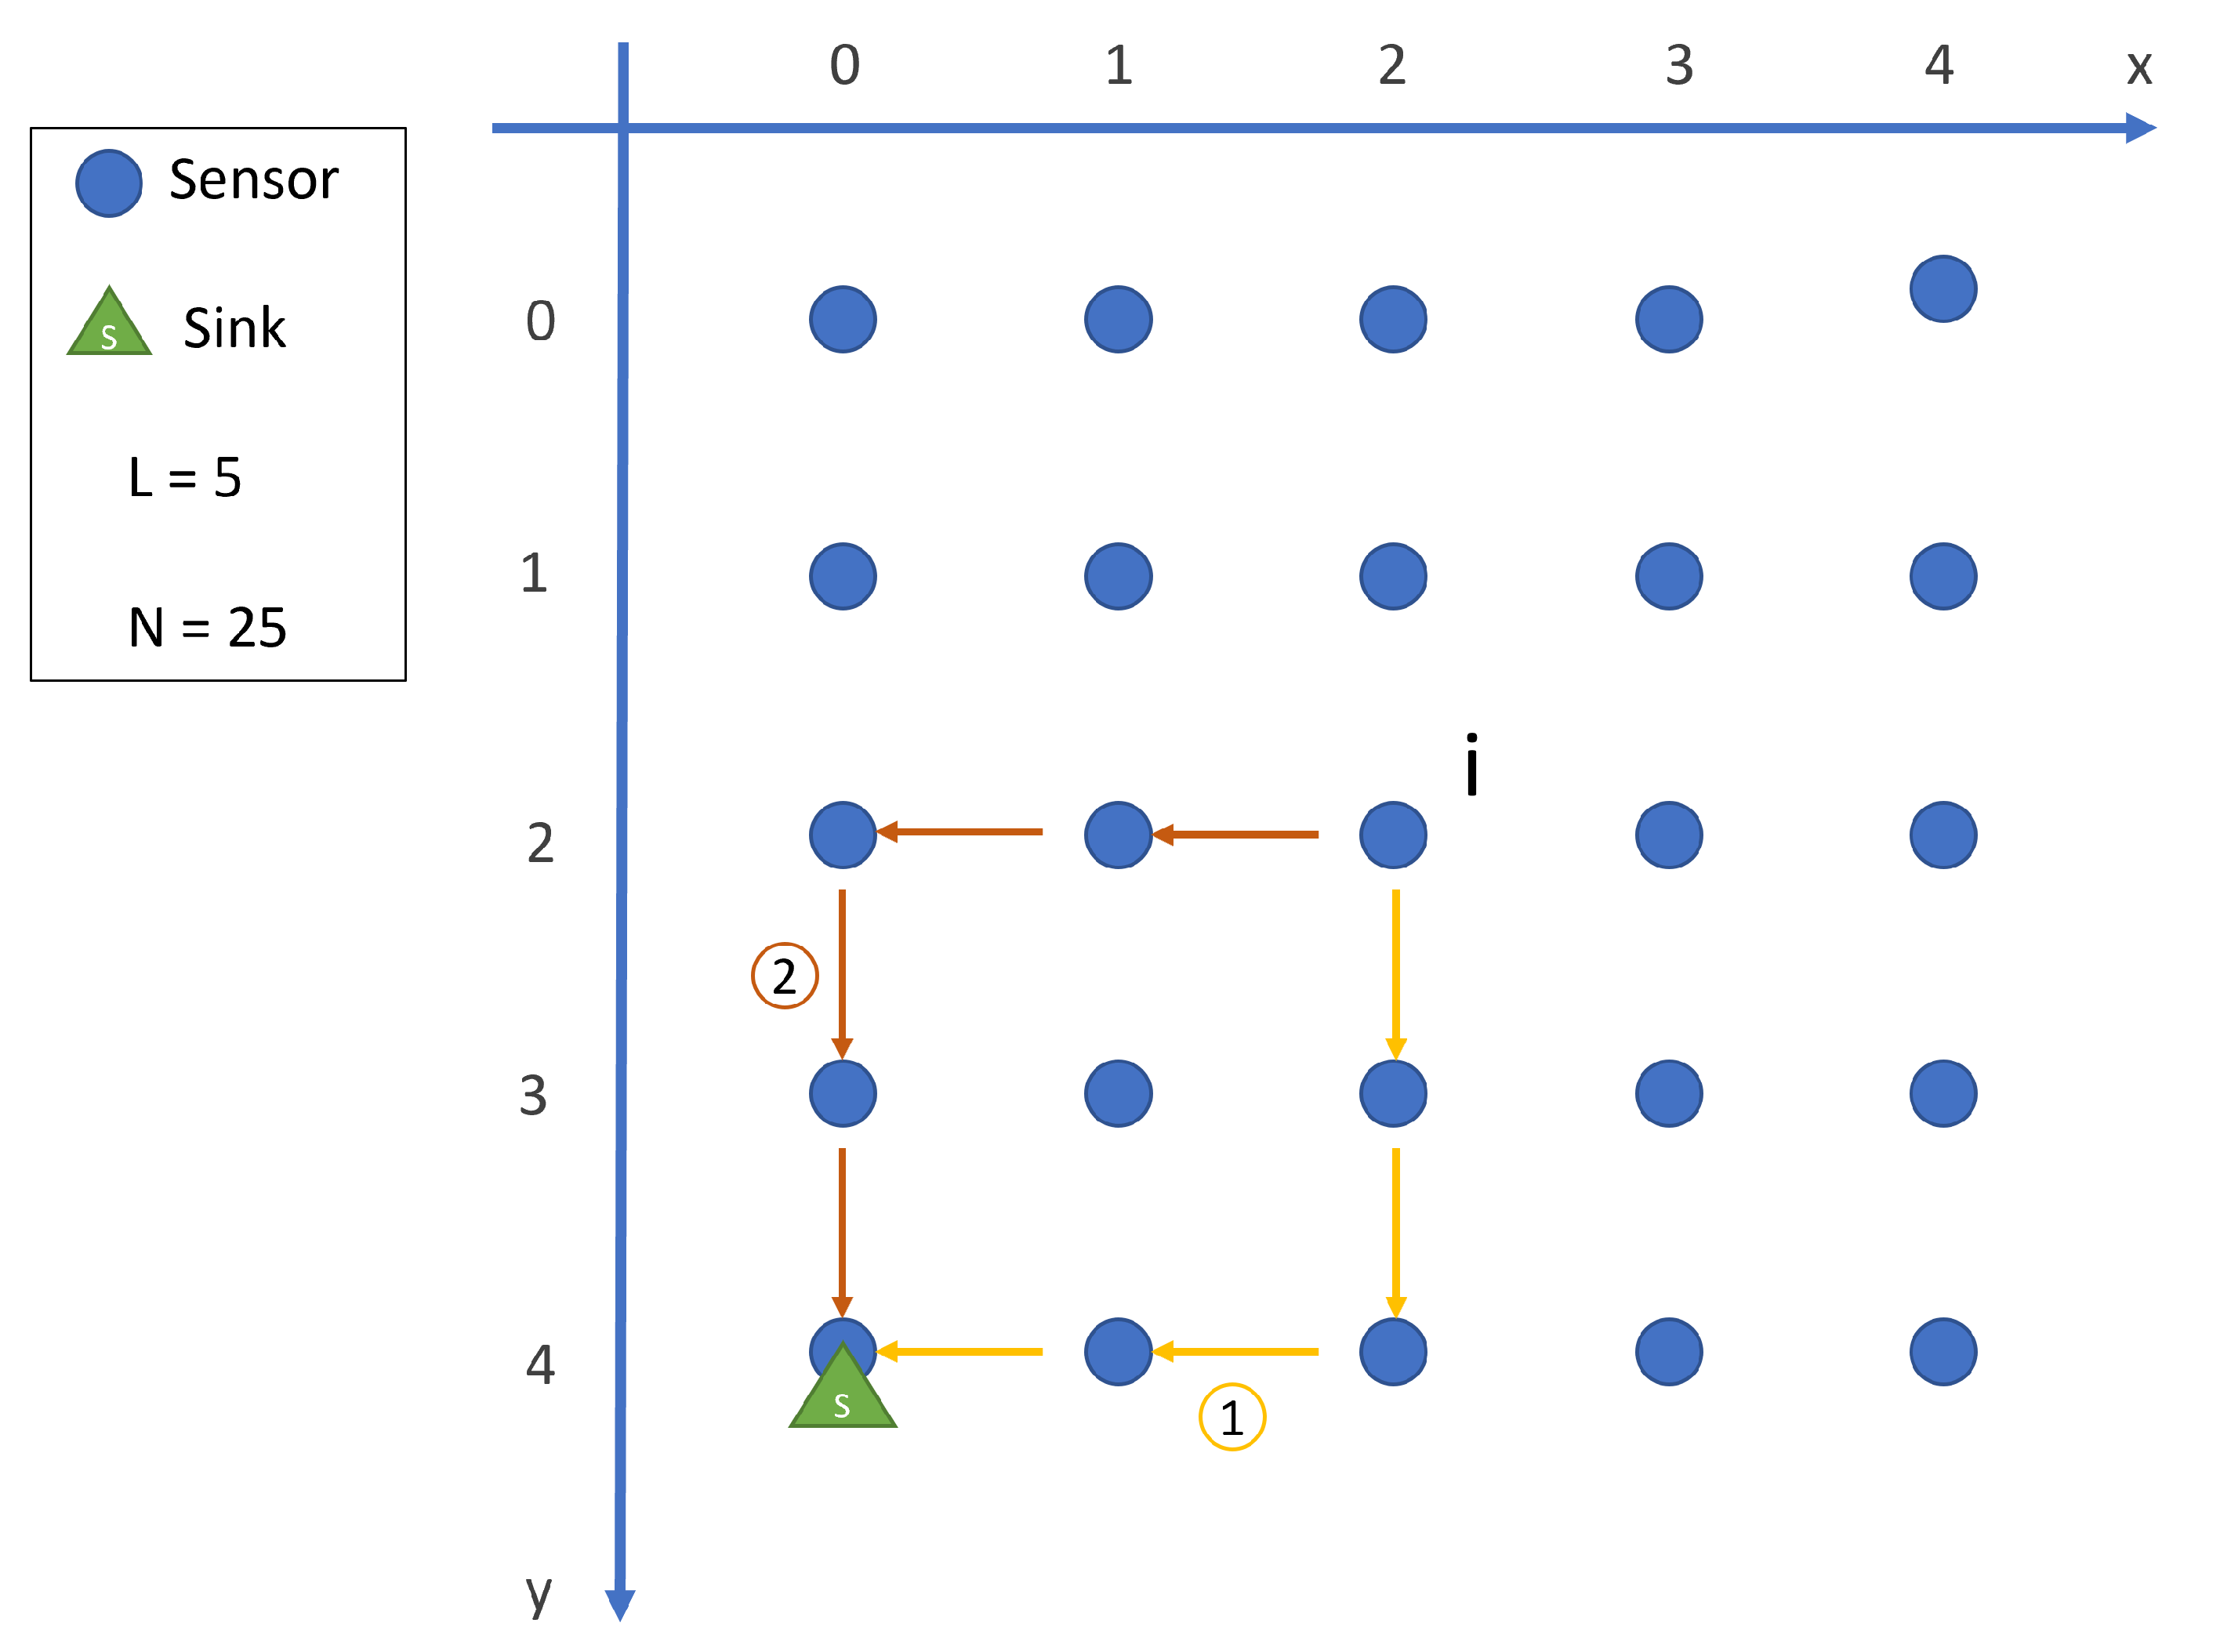
As shown in Figure 2, the WSN can be modeled as a square grid, where N is the set of sensor nodes that compose the network, and L is the grid’s edge length (measured in sensor units). Given the uniform distribution of sensors within this square grid configuration, each sensor (except those at the borders) maintains connections with four neighboring nodes. Regarding data generation, all sensor nodes generate the data packets at a fixed rate. In this study, we assume that the Sink potential sojourn locations coincide with the sensor nodes’ positions. Furthermore, we define the network lifetime as the period during which the Sink continuously traverses these sojourn locations until at least one sensor exhausts its initial energy supply.

3.3. Problem Description

Our research work aims to maximize WSN lifetime by determining the optimal Sink sojourn locations and their associated durations. Each candidate Sink sojourn point corresponds to a specific sensor node location, i N , where N is a grid of size L × L . The Sink sojourns at location k for a period of time denoted by t k . Consequently, the value of t k indicates both whether a given node is visited and the duration of the Sink’s sojourn at that location. When t k = 0 , the Sink does not visit that node; when t k > 0 , the Sink remains at sensor location i = k for t k time units.
The total lifetime of the Wireless Sensor Network, denoted as T, is the sum of all individual sojourn times across all feasible Sink points:
k N t k = T
It is important to note that this definition of T encompasses all feasible sojourn points, regardless of whether a particular sojourn time is zero or positive. The network lifetime thus accumulates the contributions from all potential Sink locations. The cumulative duration of the Sink’s sojourns across all points is constrained by each node’s initial energy capacity. In other words, the total energy consumed by each node during the Sink’s sojourning at all locations must not exceed its initial energy reserves. Furthermore, in our model, when a sensor is positioned on the same horizontal or vertical line as the Sink, only a single shortest path is considered for communication, despite the potential existence of multiple equidistant routes. Indeed, there are eight shortest paths between each node and the Sink. However, our model selectively considers only the two paths that form a rectangle with the sensor and Sink at opposite corners, as depicted in Figure 3.
For energy consumption calculations, we employ the widely adopted first-order radio model. To calculate the energy consumed by a receiver processing k 1 bits/s, we utilize the following equation:
p r = k 1 β
where β is the receiving energy consumption rate.
Second, for the k 2 bits/s transmission energy, we utilize the following equation:
p t = k 2 ( α 1 + α 2 d p )
where α 1 is the energy consumption rate for transmission and α 2 is the amplifier energy consumption rate, d is the distance, and p is the path loss (usually between 2 and 4). Based on empirical findings from real-life WSN energy model prototypes, the energy consumed during both transmission and reception phases remains constant and equivalent. We denote this constant energy quantity as e. Consequently, the total energy consumption from these communication processes can be calculated as follows:
p r + p t = k 1 β + k 2 ( α 1 + α 2 d p ) e ( k 1 + k 2 )

4. Mathematical Formulation

In this section, we list the parameters and variables employed in the formulation of our optimization problem:

4.1. Parameters

  • L: Number of sensors along each edge of the square grid.
  • N: Total number of sensors in the square grid ( L × L ).
  • e 0 : Initial energy (J) allocated to each node, from which energy is deducted during each operation.
  • e: Energy consumption rate (J/bit).
  • r: Sensor data generation rate (bits/s), constant across all sensors.
  • F i j k : Data transmission rate between nodes when the Sink is positioned at sojourn point k (bits/s).
  • S i : Set of neighboring nodes for node i.
  • C i k : Power consumption rate at sensor node i, while the Sink remains at sojourn point k (J/s).
  • O i : Overhearing rate between the sensor node and its neighbors.
  • O c o n d : Additional overhead for specific conditions or locations within the grid.

4.2. Decision Variables

  • t k : Sink sojourn duration (s) at node k.

4.3. Objective Function

  • Maximize T, representing the total WSN lifetime, defined as the sum of all Sink sojourn durations across all possible sojourn points (s).
Primarily, from the flow conservation law (previously established in Section 3) which stipulates that each node must maintain equilibrium between its total incoming flow rates plus self-generated data rate and the sum of its outgoing flow rates at all times, we can derive the following equation:
j : i S i F j i k + r = j S i F i j k
By integrating the aforementioned conservation along with overhearing considerations, the energy consumption for a node during the Sink’s sojourn at a specified location can be calculated from (2) as:
C i k = e ( j S i F i j k + j : i S i F j i k ) + ( e r × O i ) , i , k [ 0 , N 1 ] and i k e r + ( e r × O i ) , i , k [ 0 , N 1 ] and i = k

4.4. Linear Programming Formulation

As previously established, Linear Programming is used for optimization. In Equation (5), the main objective is to maximize T, representing the WSN lifetime, which equals the sum of all sojourn durations t k . It is noteworthy that the Sink sojourn duration t k at each possible location k [ 0 , N 1 ] is determined by the LP solution to the optimization problem formulated in Equation (5). The principal constraint, expressed in Equation (6), ensures that each sensor node’s energy consumption during lifetime T remains less than or equal to its initial energy allocation. Finally, constraint (7) stipulates that all t k values must be greater than or equal to zero, with a value of zero indicating that the Sink does not visit or sojourn at the corresponding location.
Max T = k = 0 N 1 t k
Subject to k = 0 N 1 c i k × t k e 0 , i [ 0 , N 1 ]
t k 0 , k [ 0 , N 1 ]
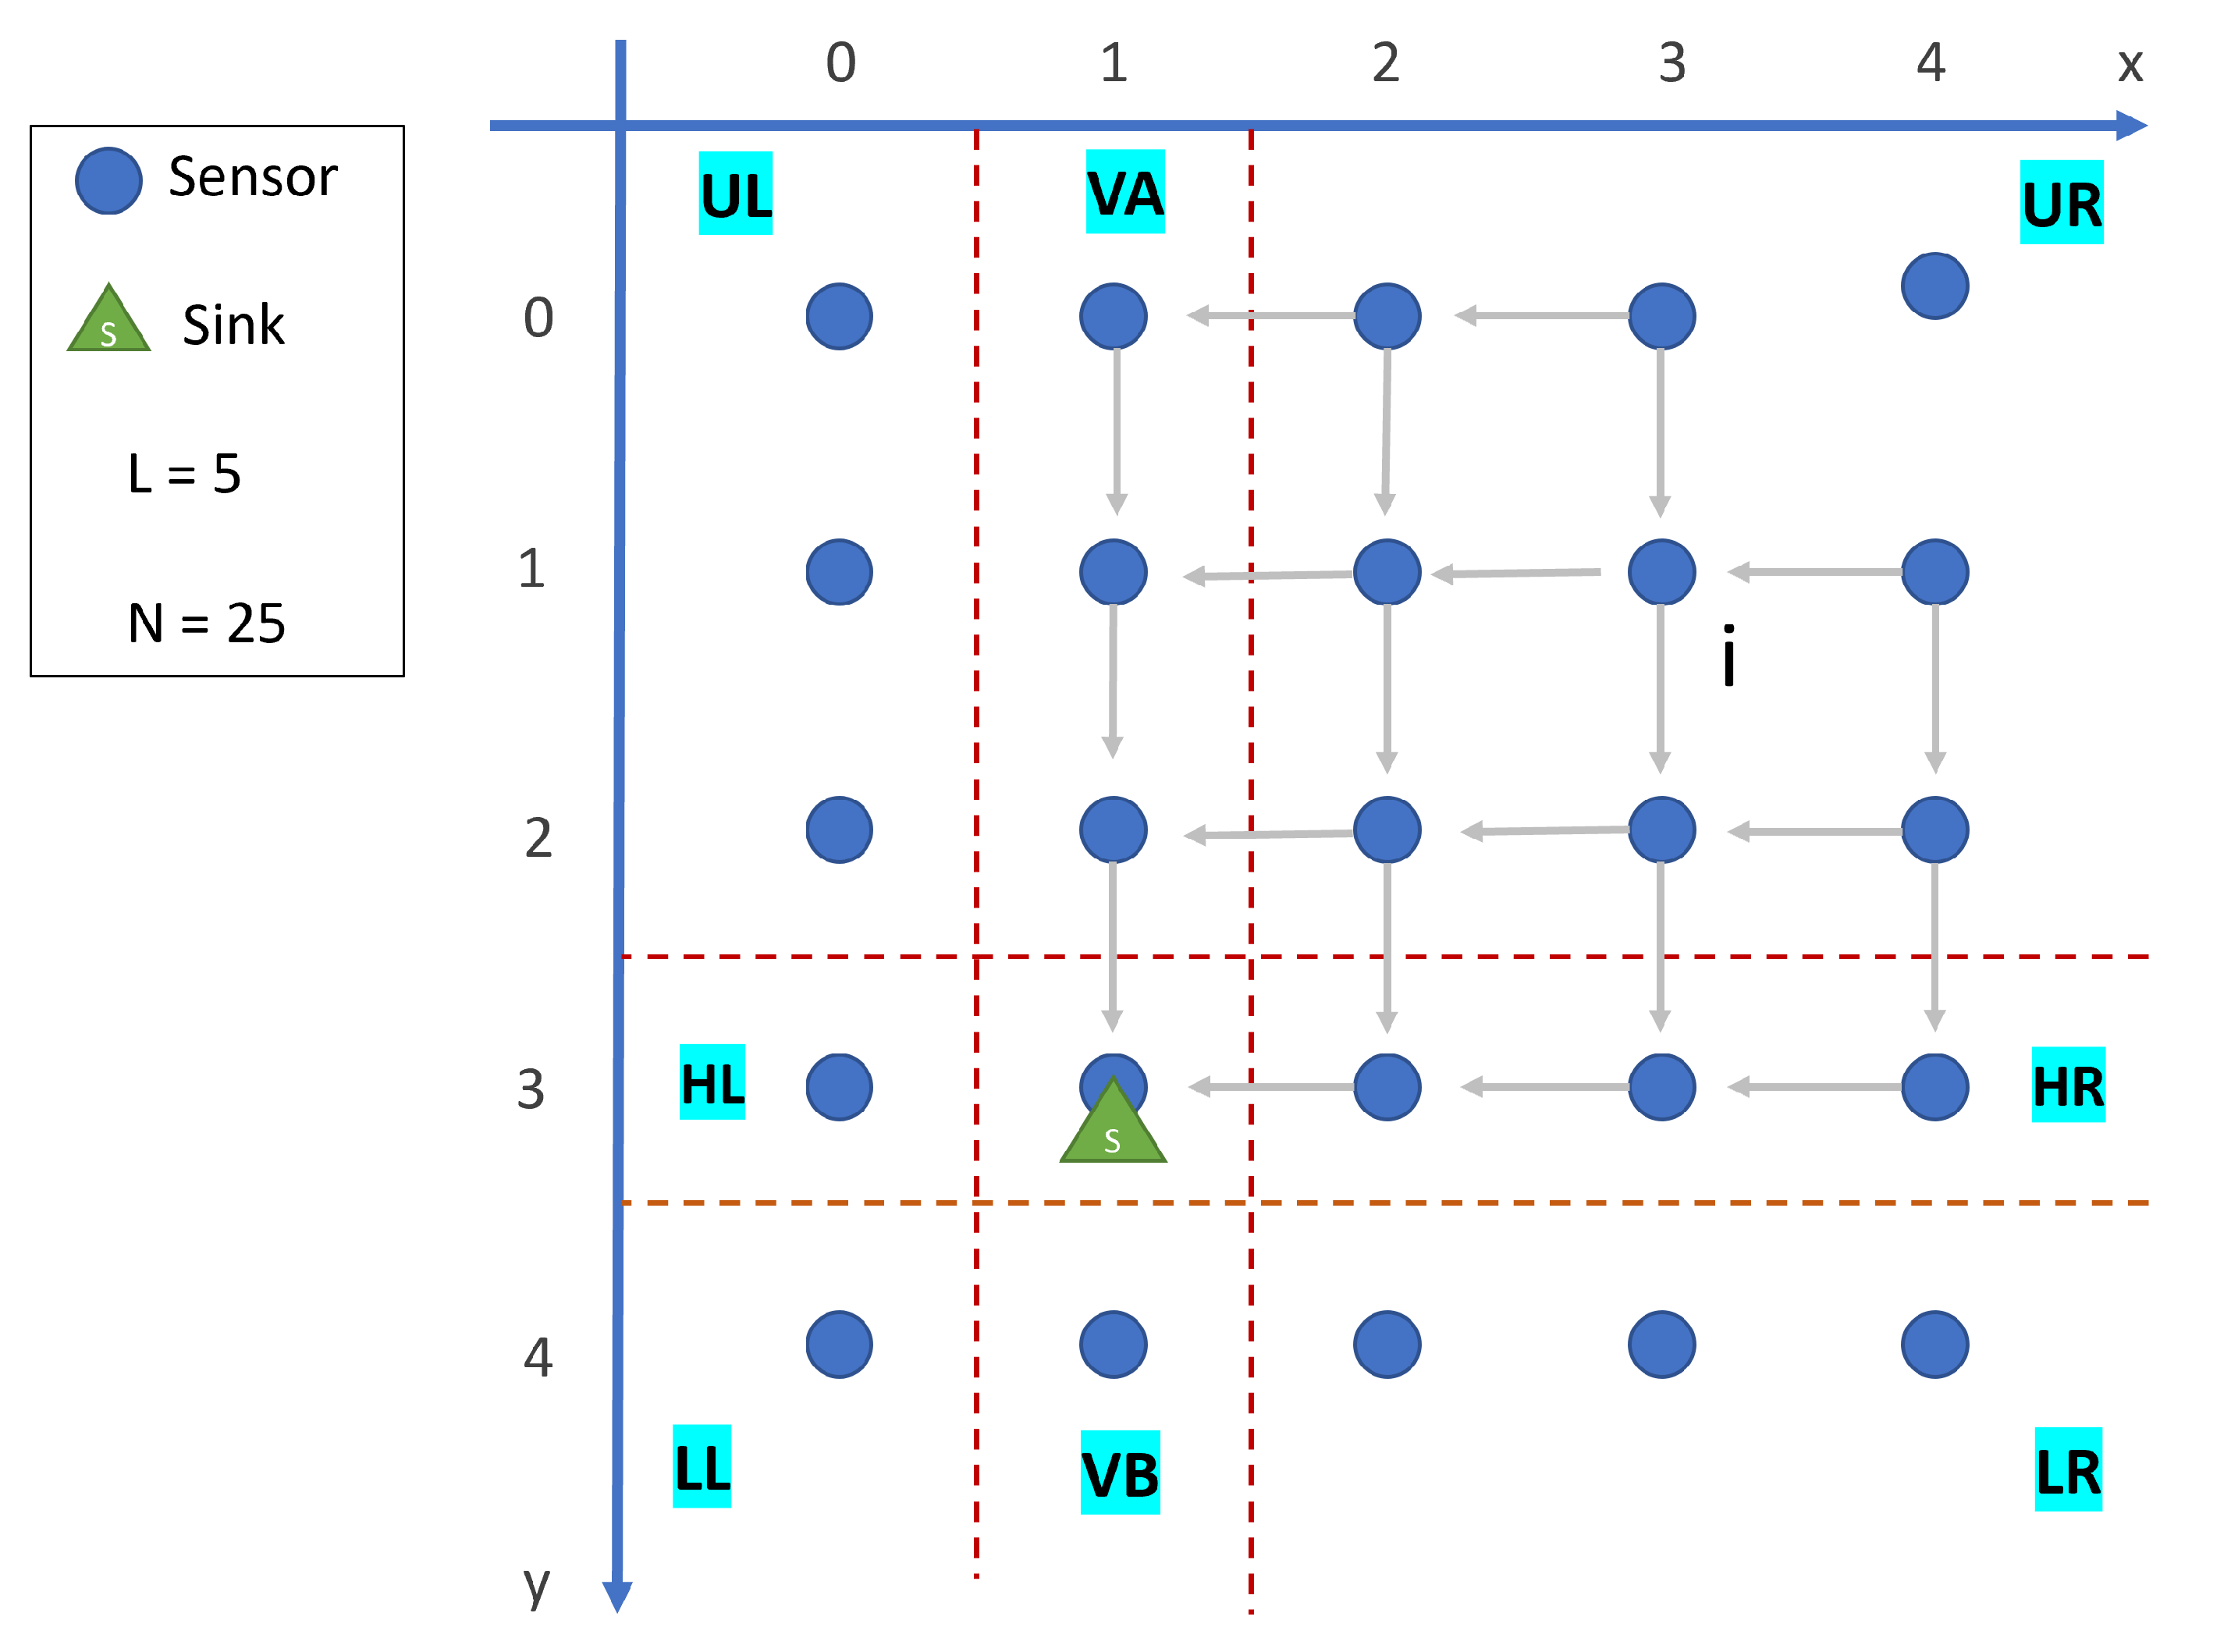
The main contribution of the base model [34] is the sub-areas-based energy model. As illustrated in Figure 4, a pair of intersecting horizontal and vertical dotted lines demarcates the sensors aligned with the row and column of the Sink’s position. This configuration generates eight distinct sub-regions: upper left (UL), upper right (UR), horizontal left (HL), horizontal right (HR), vertical above (VA), vertical below (VB), lower left (LL), and lower right (LR). The directional arrows indicate the data flow received and transmitted by sensor node i to the Sink via the two shortest paths, a concept previously elucidated in Section 3.3.
As a significant contribution of our research, the power consumption rate C i k is calculated for each sensor node according to its designated sub-area and precise spatial coordinates (column and row positions denoted as (x, y)) using the following formulations, which distinctively incorporate both the overhearing factor O i and conditional overhead  O c o n d :
O i = e r [ 1 2 ( L 1 ) + ( x + 1 ) ] + O c o n d , if i H L e r [ 1 2 ( L 1 ) + ( L x ) ] + O c o n d , , if i H R e r [ ( y + 1 ) + ( 1 2 ( L 1 ) ) ] + O c o n d , if i V A e r [ ( L y ) + 1 2 ( L 1 ) ] + O c o n d , if i V B e r [ 1 + ( 1 2 y ) + 1 2 ( x + 1 ) ] + O c o n d if i U L e r [ 2 + 1 2 ( L x ) ] + O c o n d , if i U R e r [ 1 2 ( L y ) + 1 + 1 2 ( x + 1 ) ] + O c o n d , if i L L e r [ 1 2 ( L y ) + 1 + 1 2 ( L x ) + 1 ) ] + O c o n d , if i L R ( ( L 2 1 ) + 1 ) , if i = k O c o n d = 1 2 ( x + 1 ) if i H L and y 0 1 2 ( x + 1 ) if i H L and y L 1 1 2 ( L x ) if i H R and y 0 1 2 ( L x ) if i H R and y L 1 1 2 ( y + 1 ) if i V A and x 0 1 2 ( y + 1 ) if i V A and x L 1 1 2 ( L y ) if i V B and x 0 1 2 ( L y ) if i V B and x L 1 1 2 ( x + 1 ) if i U L and y 0 1 2 ( y + 1 ) if i U L and x 0 ( 1 2 y ) + 1 if i U L and x + 1 x k y + 1 if i U L and x + 1 = x k 1 2 x if i U L and y + 1 y k x if i U L and y + 1 = y k 1 2 ( L x ) if i U R and y 0 1 2 ( L y ) if i U R and x L 1 1 2 y if i U R and x 1 x k y if i U R and x 1 = x k 1 2 ( L x ) if i U R and y + 1 y k ( L x ) if i U R and y + 1 = y k 1 2 ( L y ) if i L L and x 0 ( L y ) if i L L and x + 1 = x k 1 2 ( L y 1 ) + 1 if i L L and x + 1 x k 1 2 ( x + 1 ) if i L L and y 1 y k ( x + 1 ) if i L L and y 1 = y k 1 2 ( L y 1 ) if i L L and y L 1 1 2 ( L y ) if i L R and x + 1 L 1 1 2 ( L x ) s if i L R and y + 1 L 1 ( 1 2 ( L x 1 ) ) if i L R and y 1 y k ( L x 1 ) if i L R and y 1 = y k ( 1 2 ( L y 1 ) ) if i L R and x 1 x k ( L y 1 ) if i L R and x 1 = x k
Consequently, the power consumption rate at sensor node i during the Sink’s sojourn at location k is quantified using the following formulation:
C i k = e r [ ( x + 1 ) ( 1 + L ) 1 ] + ( e r × O i ) , if i H L e r [ ( L x ) ( 1 + L ) 1 ] + ( e r × O i ) , if i H R e r [ ( y + 1 ) ( 1 + L ) 1 ] + ( e r × O i ) , if i V A e r [ ( L y ) ( 1 + L ) 1 ] + ( e r × O i ) , if i V B e r ( 1 + x + y ) + ( e r × O i ) , if i U L e r ( L x + y ) + ( e r × O i ) , if i U R e r ( L + x y ) + ( e r × O i ) , if i L L e r ( 2 L x y 1 ) + ( e r × O i ) , if i L R e r [ ( x + 1 ) ( 1 + L ) 1 ] + ( e r × O i ) , if i H L e r + ( e r × O i ) , if i = k
where x k and y k are the ( x , y ) coordinate of the Sink sojourn point. This energy model is programmed in java, and the solution of the LP model has been implemented using Google OR-Tool version 9.5 [35].

5. LP-Based Analytical Result

Following our enhancement of the energy model presented by Wang et al. [34] through the incorporation of overhearing effects, we implemented and solved the LP model (both with and without overhearing considerations) across varying grid dimensions, with L ranging from 3 to 20. The comprehensive simulation parameters utilized in our analysis are enumerated in Table 4.

5.1. Achieved WSN Lifetime

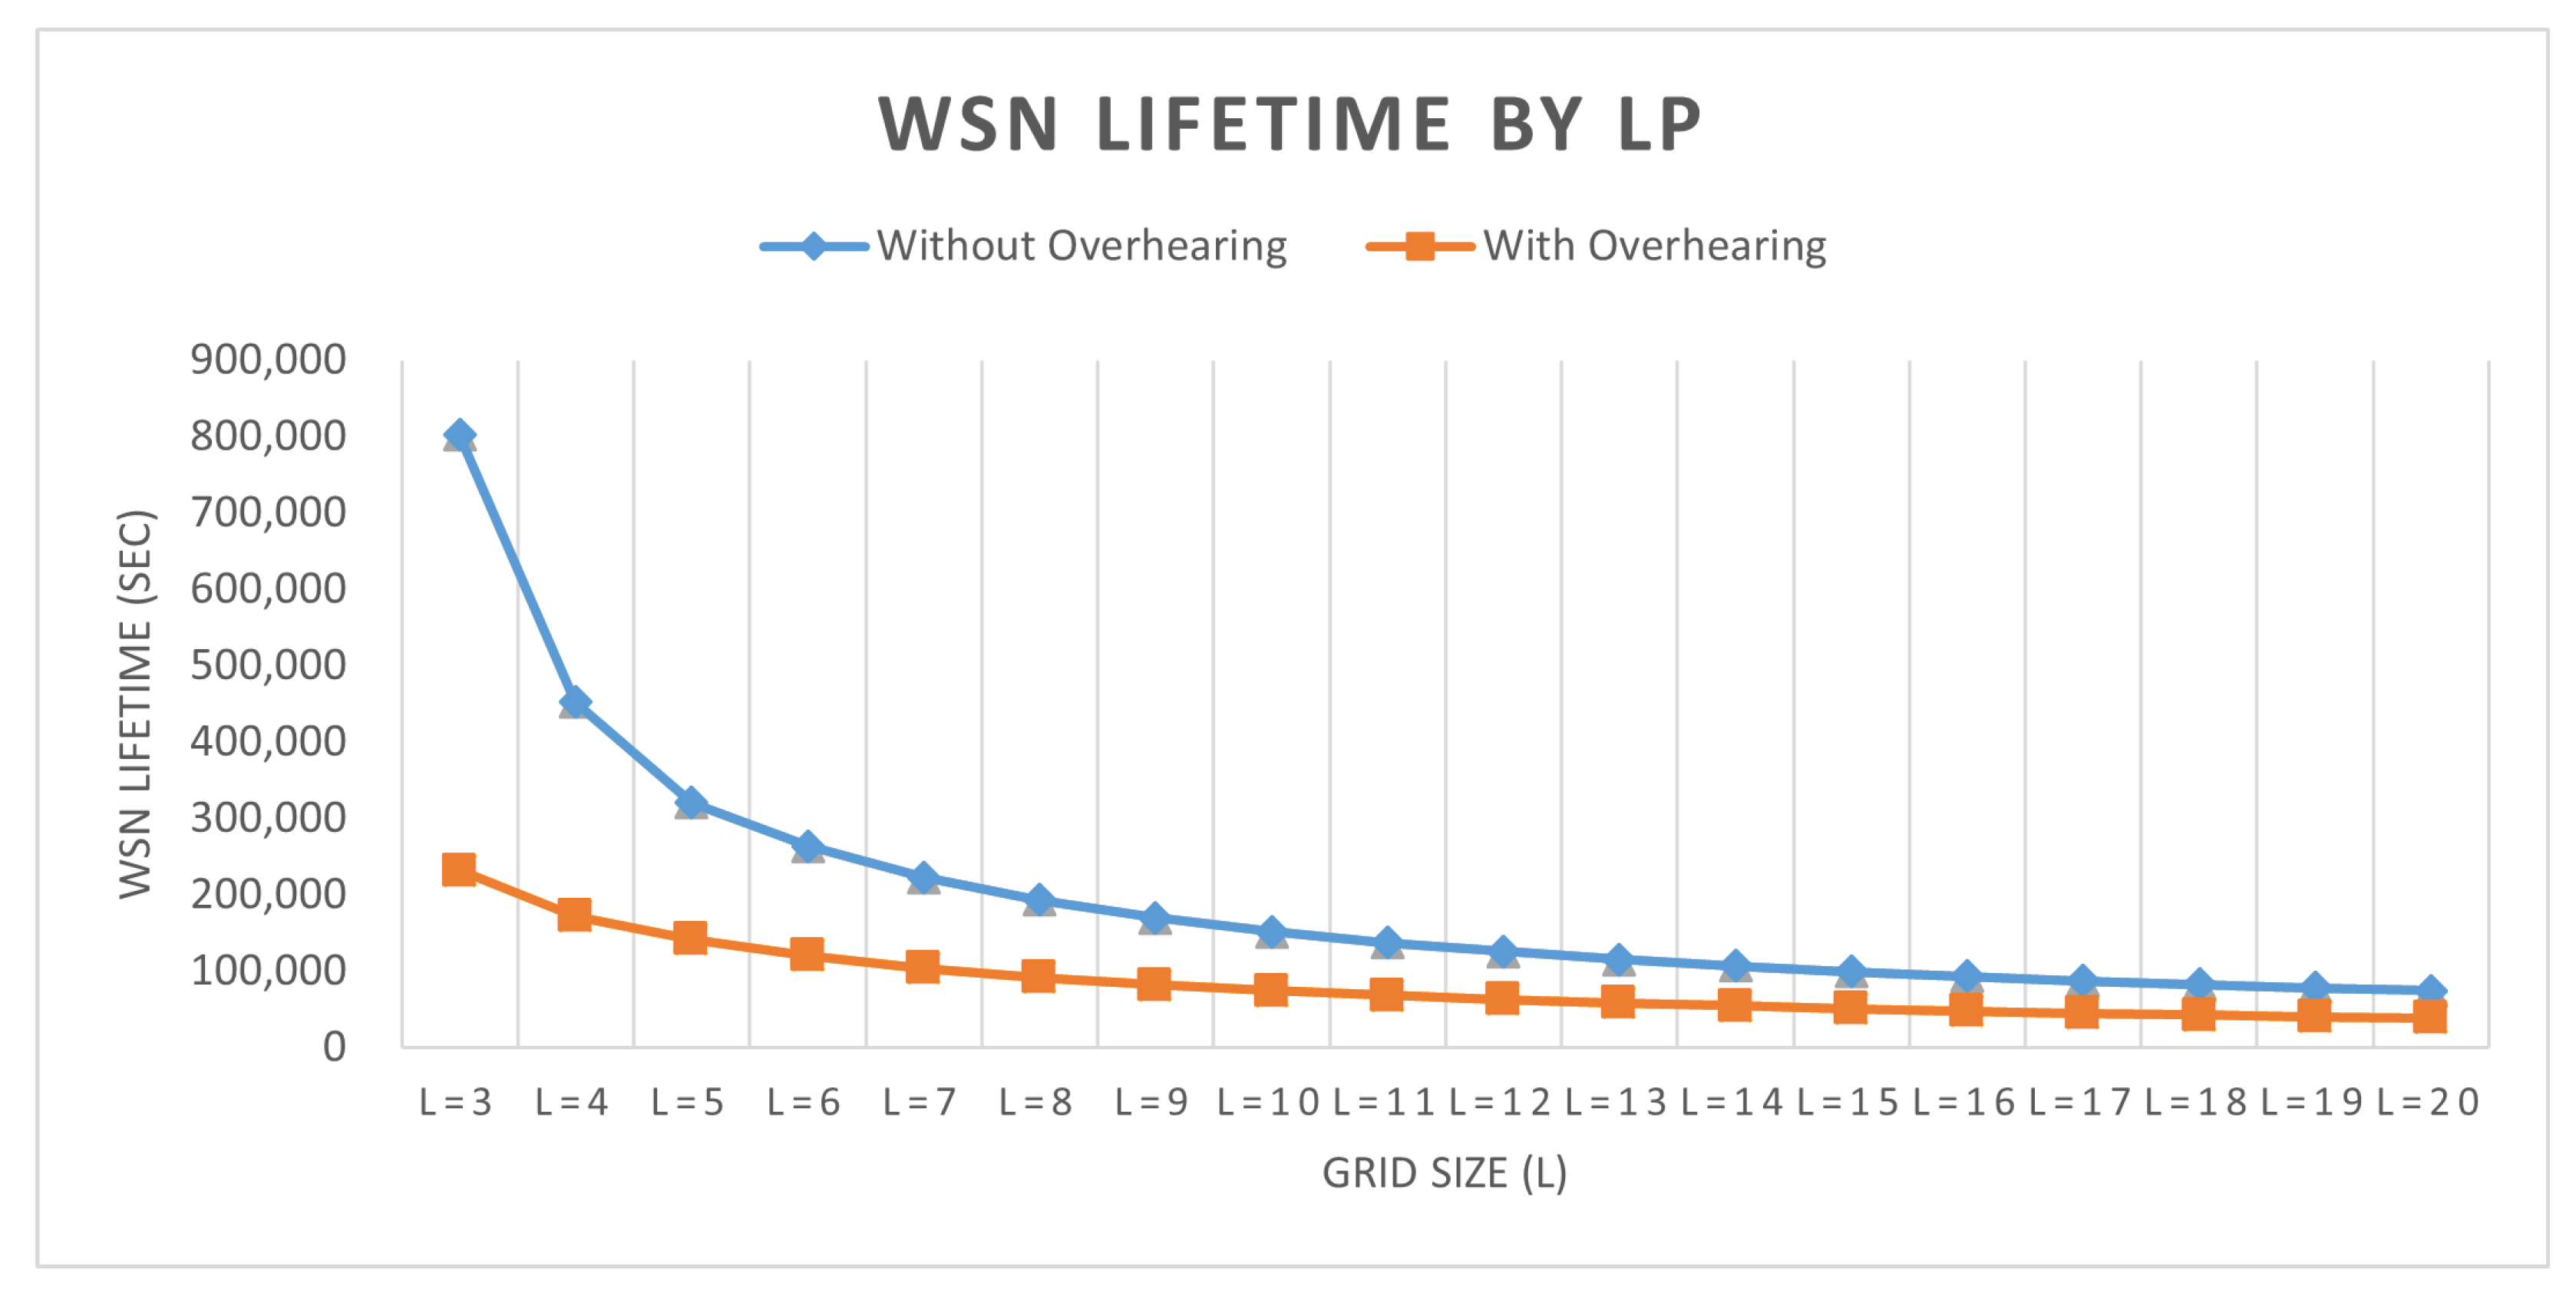
The initial comparative results are presented in Table 5: the first two columns specify the network dimensions, the third column indicates the maximum WSN lifetime achieved by the model proposed in [34], and the fourth column illustrates the maximum WSN lifetime attained through our enhanced model (incorporating overhearing effects). As expected, there is a substantial reduction in WSN lifetime when energy consumption of overhearing is considered. This reduction is quantified as a percentage in the last column of the table. We observe a minimum decrease of 48% in the network lifetime when accounting for overhearing, which demonstrates the significant inaccuracy introduced by omitting overhearing as a critical component of energy consumption in WSN models.
The data presented in Table 5 are visualized in Figure 5, which illustrates the network lifetime across various grid dimensions for both energy modeling approaches—with and without overhearing considerations. As shown in Figure 5, the impact of overhearing on the WSN lifetime decreases as network size increases. This is can be attributed to the constant ratio of overhearing energy consumption, whereas the ratio of energy consumed by data transmission escalates with increasing network dimensions. Consequently, the ratio of overhearing to the ratio of data transmission decreases as the network expands.

5.2. Sink’s Sojourn and Sensors’ Residual Energy Distribution

To provide a deeper explanation, we analyze the Sink’s sojourn distribution along with the sensors’ residual energy, providing a more comprehensive comparative assessment between the two energy models.
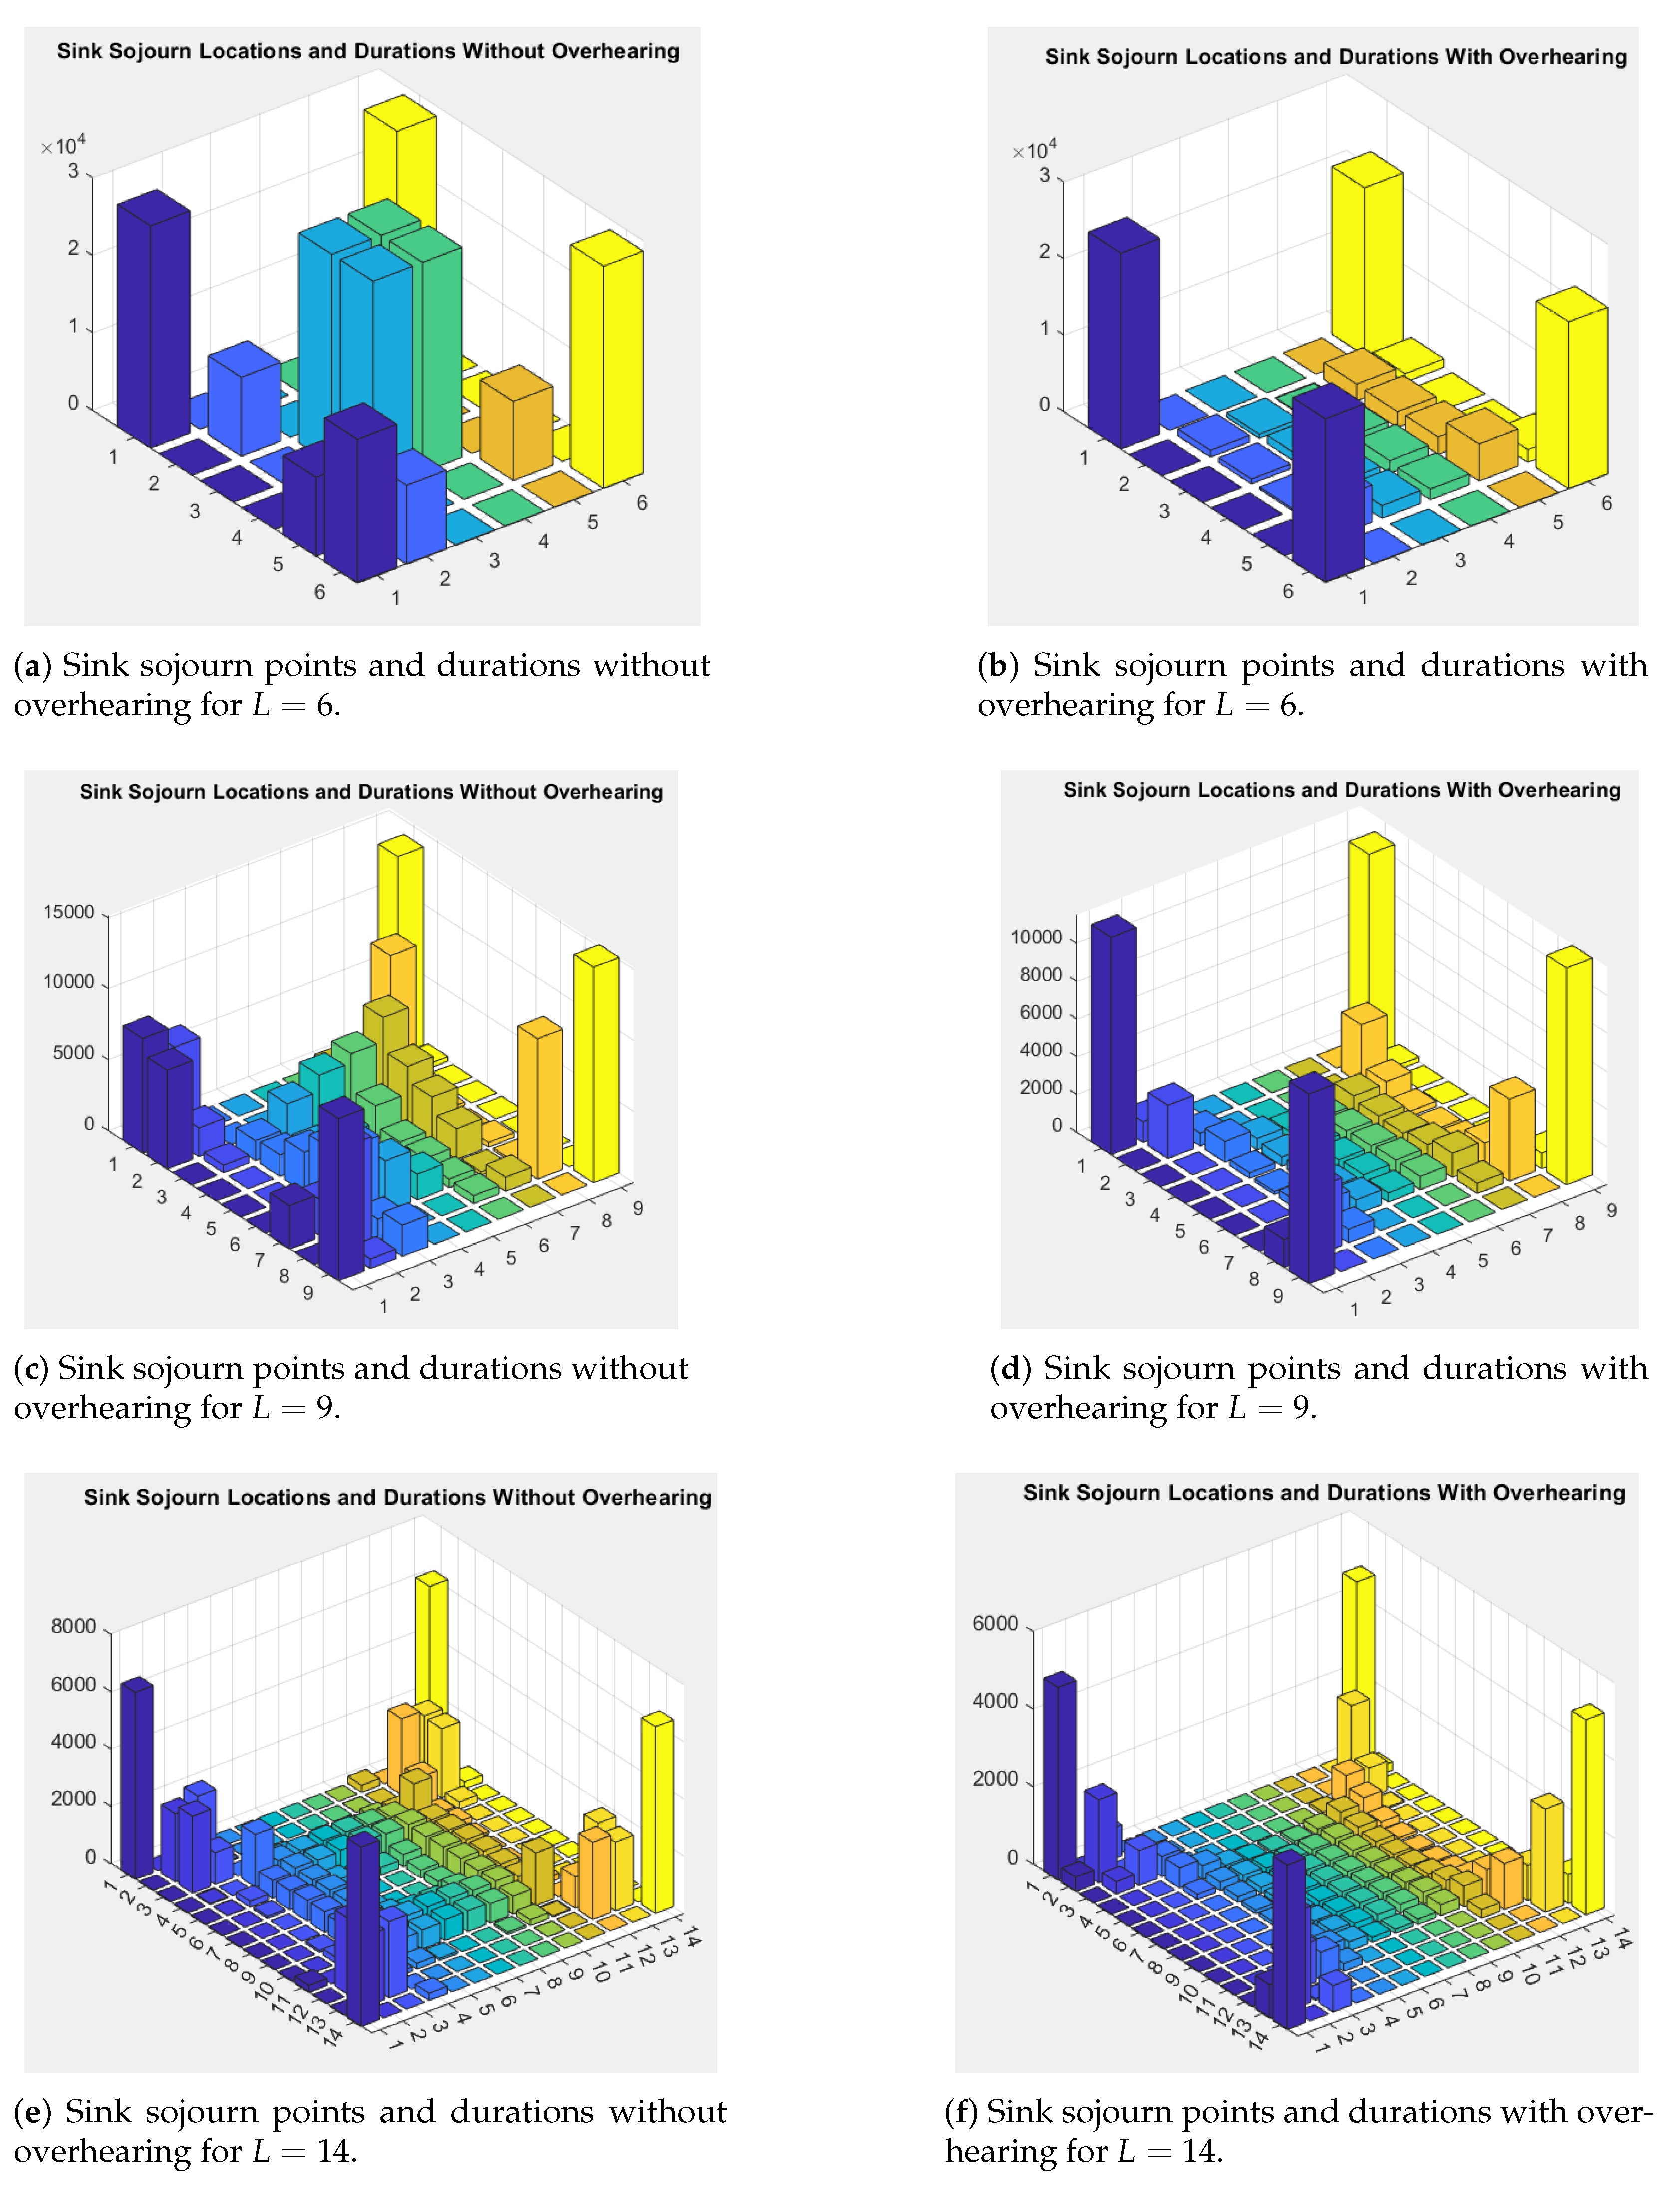
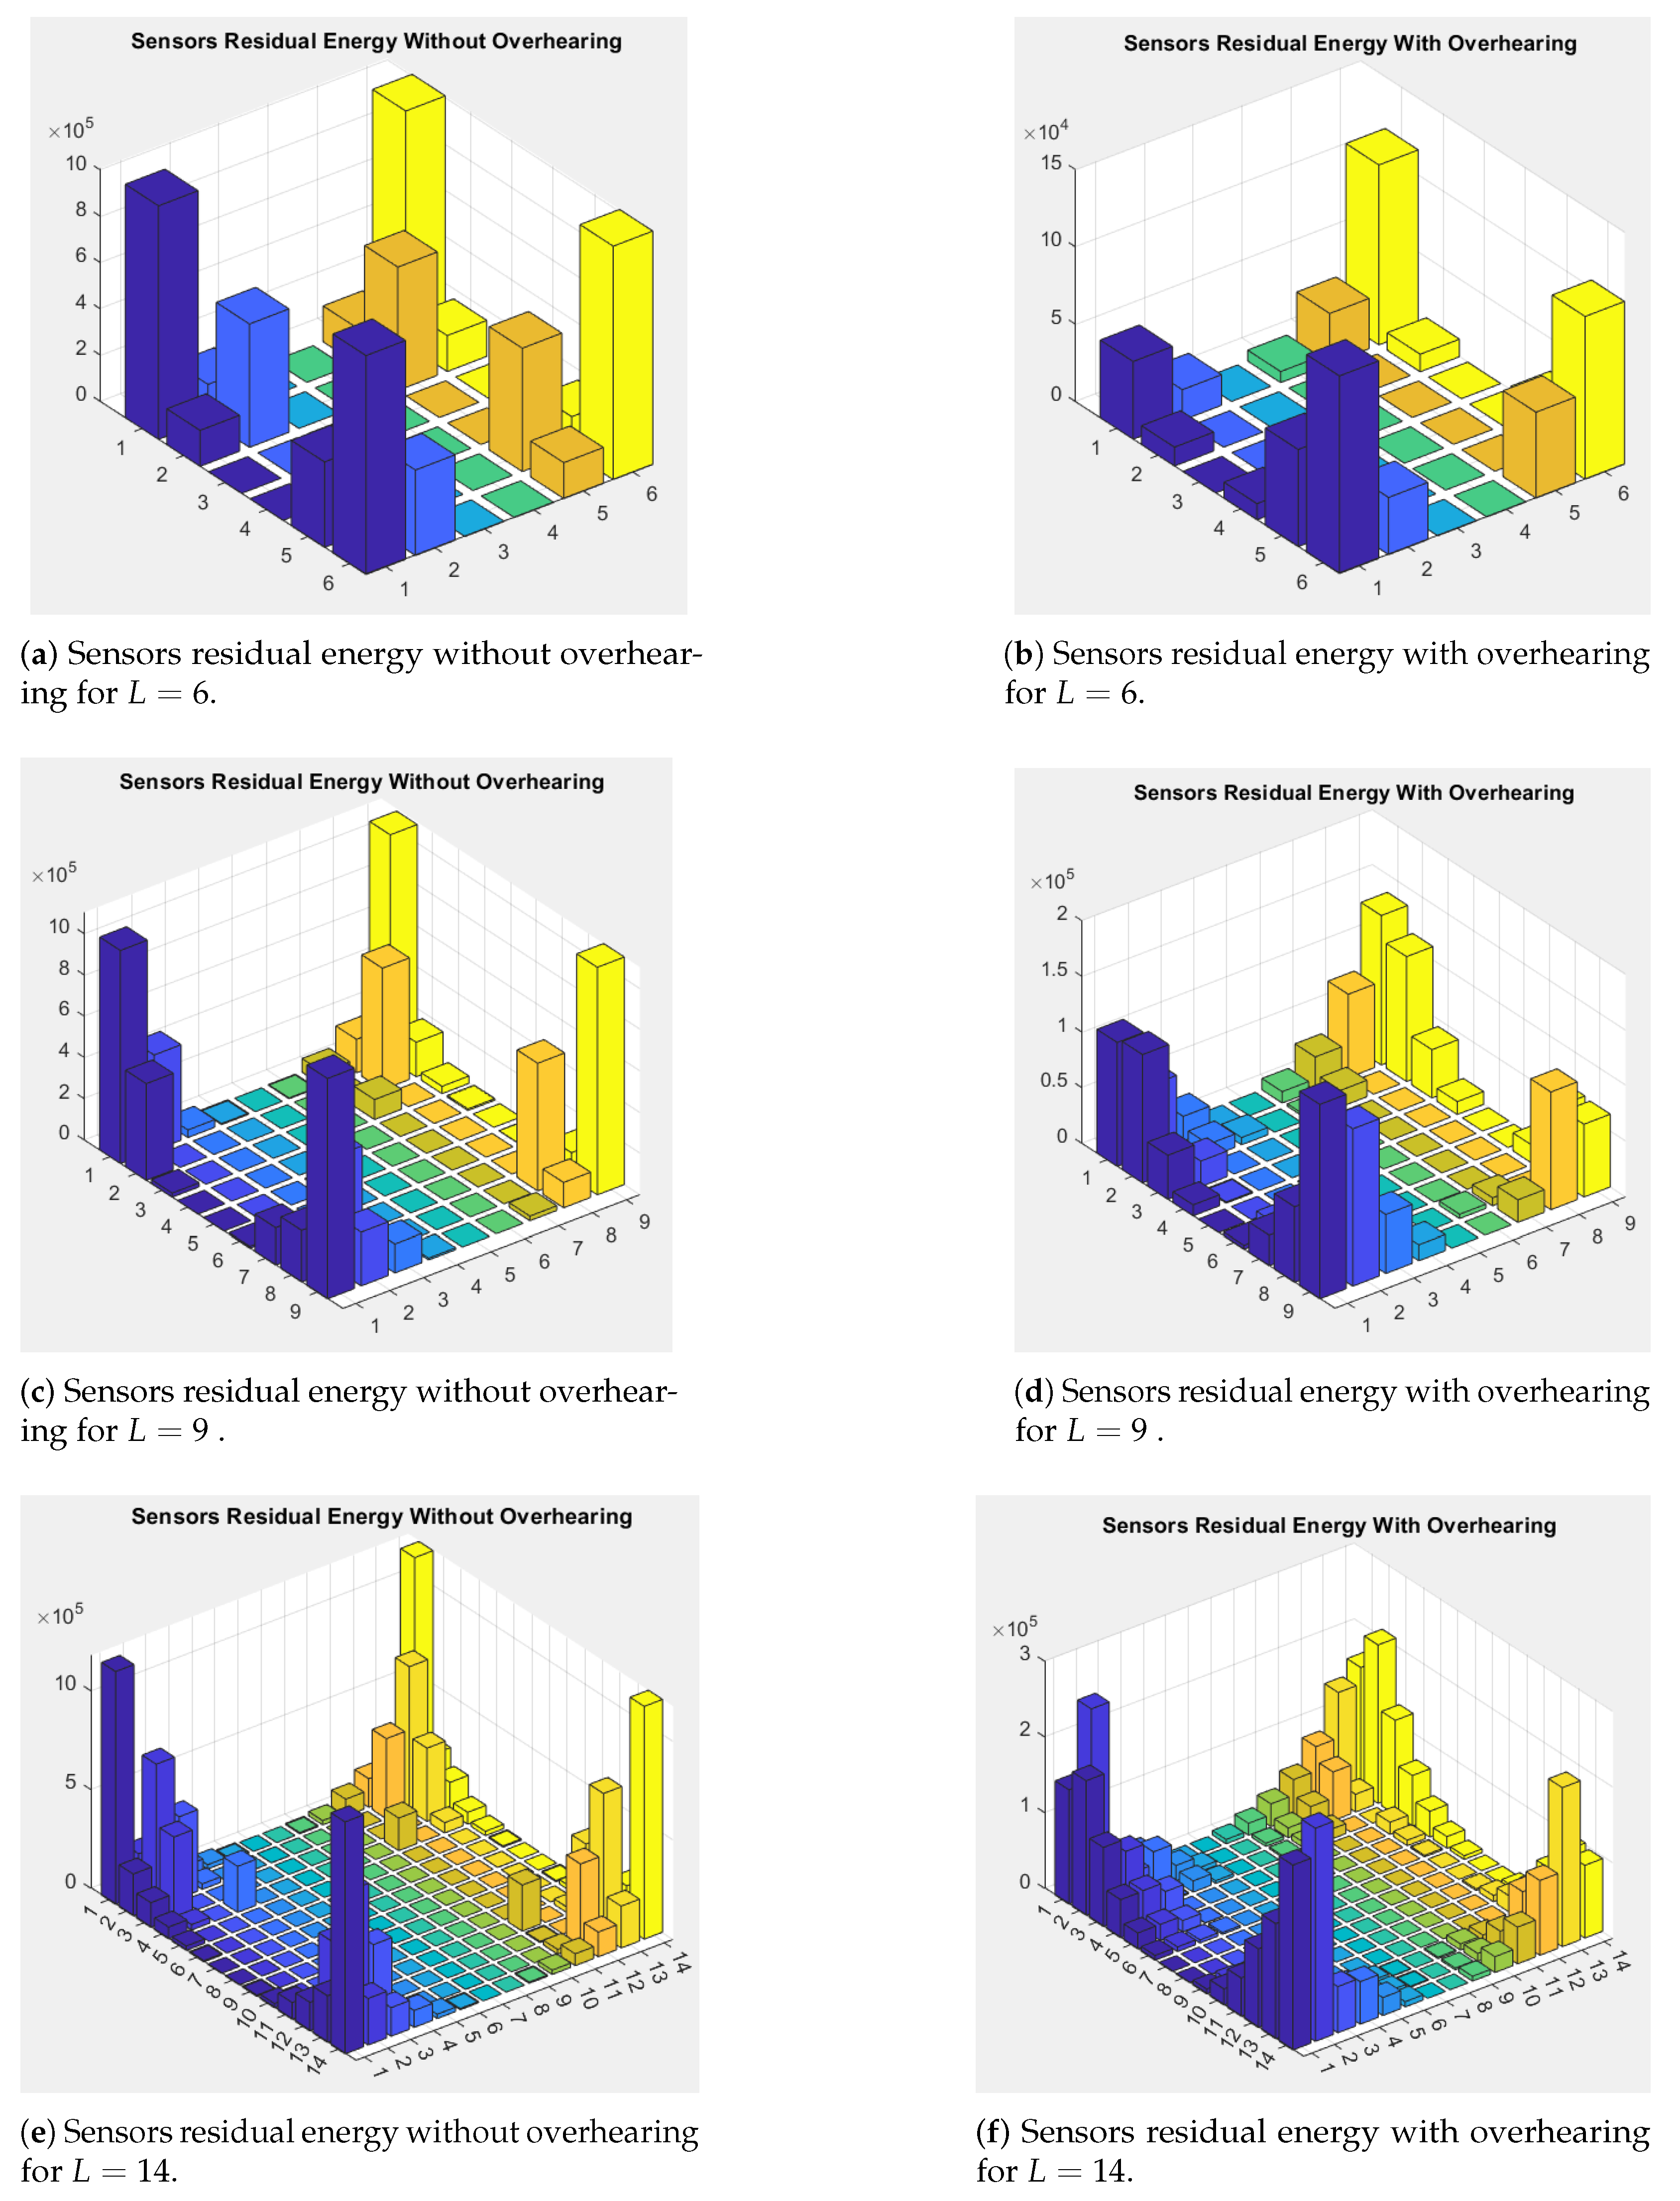
We conduct a comparative analysis of both models across three representative network dimensions: L = 6, 9, and 14. Examining first the Sink sojourn locations and their corresponding durations when L equals 6, we observe that both models exhibit identical behavioral patterns. Specifically, the Sink predominantly allocates its sojourn time at the four corner positions of the grid, as illustrated in Figure 6.
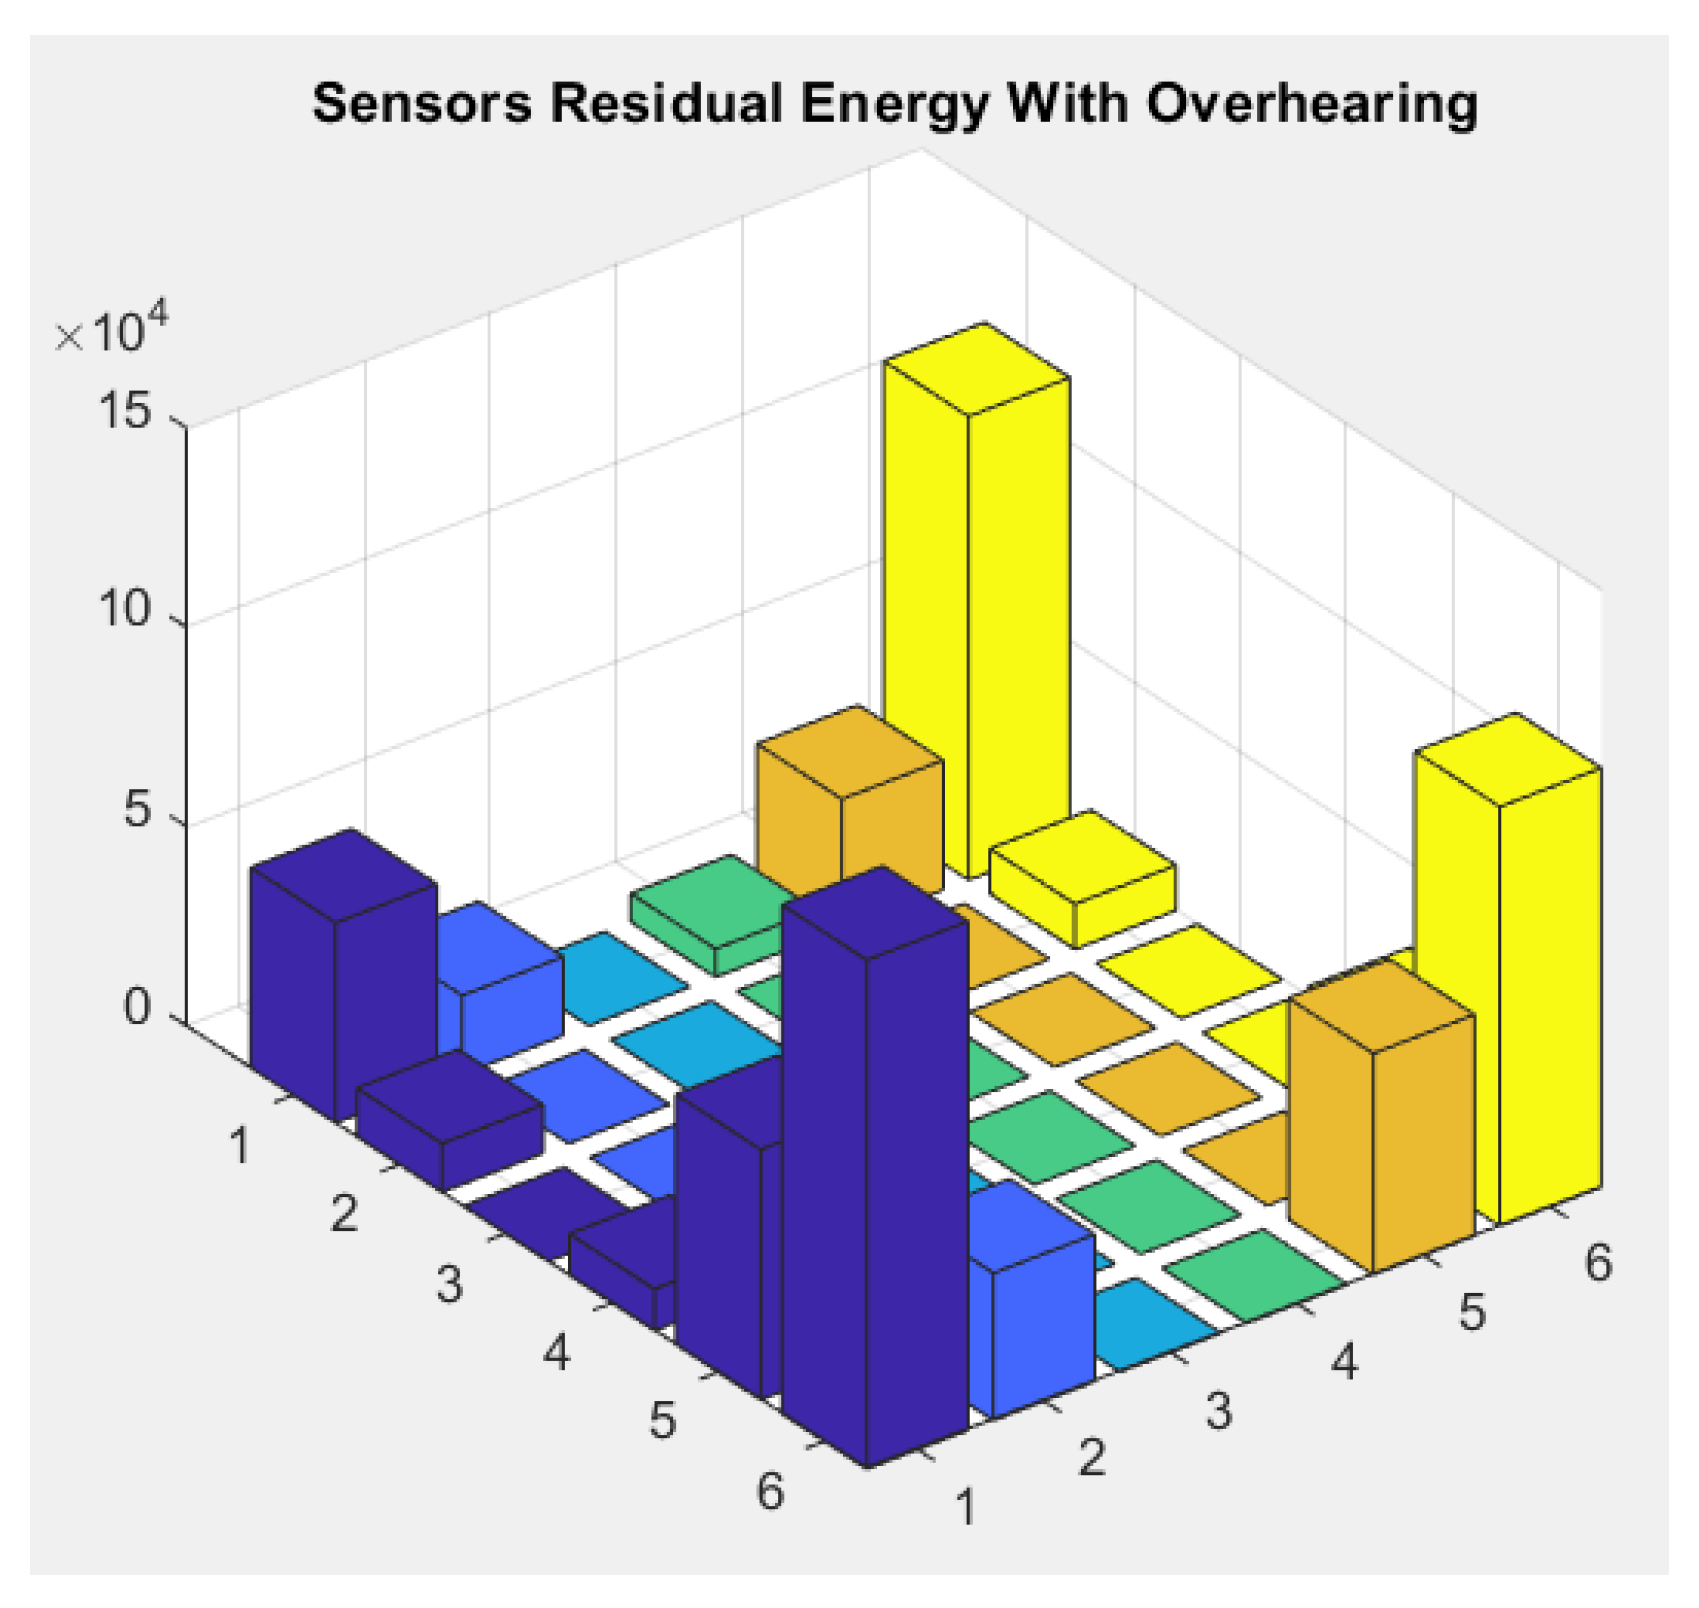
However, a slight difference between the two energy models in terms of Sink sojourn points and durations is observed. Indeed, in our proposed energy model that incorporates overhearing effects, as illustrated in Figure 6b,d,f, the Sink avoids the four central nodes; this is unlike the behavior observed in Figure 6a,c,e, which represents the energy model without overhearing considerations. This divergence can be attributed to the fact that, in the overhearing-aware model, these central nodes experience higher energy consumption in comparison with the peripheral nodes, as they are located at the grid’s center where they inevitably overhear transmissions from all surrounding sensors. Nonetheless, as demonstrated in Figure 6, although the Sink in the overhearing-inclusive energy model visits fewer nodes than its counterpart in the model without overhearing, both approaches strategically attempt to balance energy consumption by maximizing utilization of each sensor’s energy capacity. From a broader perspective, sensor nodes in the overhearing model have lower residual energy compared to those in the model without overhearing, as shown in Figure 7, owing to the additional energy consumption source introduced by overhearing. Table 6, Table 7, Table 8 and Table 9 show the detailed values of Sink sojourn points and their corresponding durations, alongside sensor residual energy for both models when L is set equal to 6.
By comparing the obtained results for different WSN sizes, we conclude that, irrespective of network size, both models—with and without overhearing considerations—exhibit consistent Sink sojourn patterns, as depicted in Figure 6. Moreover, considering overhearing as one of the sources of energy consumption impacts network performance, reducing the achievable lifetime by approximately 50%, thereby providing a more realistic scenario. Furthermore, our analysis reveals a direct correlation between network scale and energy efficiency: as WSN dimensions increase, sensor nodes experience higher energy consumption due to transmission across extended paths to reach the Sink, consequently resulting in diminished Sink sojourn durations and reduced overall network lifetime.

6. AI-Based Solution

The application of LP to complex optimization problems entails significant computational complexity, with the simplex algorithm exhibiting exponential complexity in worst-case scenarios and polynomial complexity in average cases. Notably, employing deterministic optimization methodologies for Wireless Sensor Network problems becomes progressively prohibitive in terms of both computational and physical resource requirements as the WSN grid dimension N increases [36,37].
Conversely, meta-heuristic algorithms have basic characteristics, which are intensification and diversification. The intensification process involves the selection of optimal solutions and subsequent generation of new candidates based on these exemplars. Diversification, in contrast, ensures comprehensive exploration of the search space [38].
Swarm intelligence algorithms effectively resolve optimization issues with remarkable efficiency. We adopt the Cuckoo Search (CS) algorithm due to its inherent utilization of Lévy flights, which enables efficient exploration of large and scalable search spaces. This capability is particularly well-suited for WSNs where expansive solution spaces and scalability represent key characteristics. Furthermore, compared to alternative metaheuristics, CS offers the significant advantage of requiring fewer parameters, making it simpler to fine-tune while maintaining competitive performance [39,40]. Numerous comparative studies [39,40,41,42] have consistently demonstrated CS’s superior performance relative to conventional algorithms. Notably, CS maintains its relevance and continues to evolve within the WSN domain. A recent investigation [43] introduced an enhanced CSO with opposition-based learning (ECSO-OBL) for addressing coverage optimization in WSNs. This research confirmed that while standard CS already facilitates effective global search through Lévy flights, the enhanced variant substantially improves local search capabilities and robustness when applied to multi-dimensional optimization problems, consequently yielding superior deployment and coverage schemes. Such ongoing development clearly establishes CS as a viable and efficient methodology for WSN optimization, justifying its adoption and implementation in contemporary applications.
In the subsequent section, we delineate our methodology for implementing the Cuckoo Search algorithm, which is strategically informed by the previously established LP solution, incorporating overhearing considerations.

6.1. Cuckoo Search Optimization

The CS algorithm was proposed in 2009 by Yang and Deb [44]. It is inspired by the behavior of Cuckoo birds’ reproduction strategy, wherein females lay their eggs in the nests of other birds, known as hosts, to take care of them. They might even remove the hosts’ eggs to increase the chance that their eggs would survive. If the host bird discovers the new eggs, it typically abandons or destroys the nest along with all eggs. Within this algorithmic framework, each potential solution is conceptualized as an egg, with optimization achieved through the systematic elimination of suboptimal solutions (those exhibiting inferior fitness values) from the search domain. The Lévy flight (LV) algorithm is used by the CS algorithm to find a new solution. It uses the Lévy distribution to calculate the random walk to the next solution. This movement mechanism draws inspiration from various biological flight patterns observed in insects and animals, including fruit flies [45,46,47,48]. CS leverages LV to balance the global and local random walks, making it more efficient than the symmetric random walk in other algorithms, such as the Genetic Algorithm (GA) [42]. Notably, the algorithm initializes with a randomly generated population of nests. New eggs (i.e., solutions) are generated at each iteration to replace poor eggs in accordance with their quality. The fitness value, which is calculated based on the primary objective function, is used to assess and verify the quality of the solution. Bad nests are eliminated at the end of each iteration.
The original CS algorithm proceeds according to the following sequence:
  • Initialize the population with a predetermined number of host nests.
  • Each cuckoo generates a single egg and deposits it in a randomly selected nest from the initialized population.
  • At each iteration, a new candidate nest is generated from a randomly selected nest using LV. If the new nest has a better egg value (fitness value) than the selected one, then it is replaced. Only nests containing superior eggs progress to the subsequent generation.
  • The nests are sorted according to their fitness value.
  • A discovery probability, denoted as p α [ 0 , 1 ] , represents the likelihood of host birds detecting foreign eggs. Consequently, a proportion of nests equivalent to p α is eliminated from consideration.
  • The final optimal solution is found upon reaching the maximum number of iterations or if a stop criterion is satisfied, whereupon the highest-quality nest is returned as the best solution.
Given an objective function with the formal notation f ( x ) , x = ( x 1 , , x d ) , where d denotes the dimensionality of the optimization problem, each potential solution is represented by a cuckoo egg. At iteration t, the number of nests is n, and the set of potential solutions is denoted by x i , ( i = 1 , 2 , , n ) .
In accordance with Equation (8), at iteration ( t + 1 ) , LV is used to create a new solution from a randomly selected one ( x i t ) at iteration ( t ) .
x i ( t + 1 ) = x i ( t ) + α L e v y ( λ )
where the step size is represented by α , and the Lévy distribution used to determine the symmetric step size is L e v y ( λ ) .
The operational sequence of the Cuckoo Search algorithm is systematically presented as pseudocode in Algorithm 1, implemented with the control parameters presented in the following section.
Algorithm 1  Original CS algorithm.
  1:
Objective function f ( x ) , where x = ( x 1 , x 2 , , x d ) .
  2:
Generate an initial population of n nests x i , where i = 1 , 2 , , n .
  3:
Set t 0 and define M as the maximum number of iterations.
  4:
while  t < M  or stop criterion not met. do
  5:
    Randomly select a cuckoo x i using Lévy flight.
  6:
    Evaluate its fitness: F i = f ( x i ) .
  7:
    Randomly select another nest x j from the population.
  8:
    Evaluate its fitness: F j = f ( x j ) .
  9:
    if  F i > F j  then
10:
      Replace x j with x i .
11:
    end if
12:
    Abandon a proportion p α of the worst nests and generate new ones.
13:
    Retain the best solutions and sort the population.
14:
    Update the best solution found so far.
15:
end while

Parameters

  • x = ( x 1 , x 2 , , x d ) : Candidate solution vector (nest).
  • d: Dimensionality of the optimization problem (number of decision variables per nest; where d N , since not all potential sojourn points necessarily receive positive sojourn durations, indicating that the Sink may not visit all candidate locations).
  • t: Iteration index.
  • M: Maximum number of iterations.
  • C: Population counter for tracking solution generation.
  • S: Population size (number of nests).
  • F ( x ) : Fitness evaluation function = k = 0 N 1 t k (representing total WSN lifetime).
  • P a : Discovery probability (fraction of abandoned nests).
  • x i t : Solution vector i at iteration t.

6.2. Proposed Improved Cuckoo Search

First, the meta-heuristic solution requires a suitable initialization step even though it is time- and space-efficient. Each sojourn time, t k , in the energy hole problem needs to be initialized randomly at the first population. We discovered that starting from extremely small values k = 0 N 1 t k = 0 is time-consuming. Especially, for checking the constraint enforcement for each sensor i, it needs to calculate the k = 0 N 1 C i k × t k and store it for each sensor, i, which has high complexity. We propose a better starting point for the CS method by loosening the problem restriction; this allows us to define an upper bound for some of the sojourn durations and to optimize the swarm intelligence approach.
In what follows, we present the improved CS algorithm and take readers step-by-step through the model formulation.

6.2.1. Improved Cuckoo Search Solution’s Structure

In order to address the WSN energy hole problem, we transfer it to the CS structure as follows:
  • Each nest has a full solution as a matrix of t k , which is the Sink sojourn point and duration t k in WSN.
  • The fitness function of each solution, f ( x ) = k = 0 N 1 t k , is the objective function, which is maximizing the WSN lifetime, ( T ) .

6.2.2. Enhanced Initialization Phase

We improve the method used to create the initial population. In the no-overhearing energy model, the maximum t k is related to the case where the Sink co-located with the node i where the C i k = ( e r ) is the minimum. Thus, we were able to determine the max bound of the total k = 0 N 1 t k by e 0 e r . Accordingly,
since k = 0 N 1 C i k × t k e 0 and C i k e r ( i , k ) , we conclude that e r × k = 0 N 1 t k e 0
Thus,
k = 0 N 1 t k e 0 e r
To find the possible maximum value of k = 0 N 1 t k for the model considering the overhearing, we refer to our proposed energy model with overhearing and found that the minimum value of C i k is found when the x and y are equal to zero and i U L . Accordingly, the minimum C i k = e r + ( e r × 3 2 ) . So, the maximum possible t k is as follows
since k = 0 N 1 C i k × t k e 0 and C i k ( e r + ( e r × 3 2 ) ) ( i , k ) , we conclude that e r × k = 0 N 1 t k e 0
Thus,
k = 0 N 1 t k e 0 e r + ( e r × 3 2 )
We choose to create the first population from a single initial nest and use the random walk of the LV for the remaining solutions in order to make further improvements.
Additionally, to create this initial nest, we employed sampling technique to obtain random values of t k from the highest k = 0 N 1 t k = e 0 e r + ( e r × 3 2 ) , referring to Equation (10). For this, the largest k = 0 N 1 t k value is divided at random and uniformly distributed among N values, where their sum is equal to e 0 e r + ( e r × 3 2 ) .
Inspired from the deterministic solution, we choose to randomly set 50% of t k equal to zero in order to obtain a more realistic outcome.
As a result, in order to obtain a solution x i , the inequality specified in Equation (6) must be satisfied. If it is not, then an LV which employs only a single nest is used to generate a new solution x i + 1 .

6.2.3. Generating First Population

Using the LV which takes only one nest, the previous initial solution is passed to generate a predefined number of nests to form the first population. The enforcement of the energy constraint (in Equation (6)) is checked for each newly created cuckoo.

6.2.4. Search Process

It is noteworthy that, in order to find the first single nest faster, we begin by minimizing the sampled solution. Then, utilizing LV, we produce the initial population by maximization to construct a solution with a longer total duration. After that, starting with the initial population, the search iterates until reaching the last iteration. At the last iteration, the best solution is found and returned as the optimum solution.
Our improved CS steps are summarized as pseudo-code in Algorithm 2.

6.3. Analytical Results

Since the CS uses by default a random Sink sojourn pattern as a starting solution, we further improve the initialization step by considering two sojourn points’ distribution patterns. The first one is the cross pattern (CS-C). It is inspired by the linear solution, where the Sink sojourns mostly at the corners and at the center. As for the second pattern, it is based on a random distribution (CS-R). In this pattern, we also inspired by the linear solution to deduce the ratio of sojourn points. In linear solution, this ratio varies between 30% and 60%. In our testing, we set this ratio to 50%. We tested the previously mentioned initialization patterns with different network sizes L, L being in [3, 20] with the same simulation parameters used in the LP testing (see Table 4). Moreover, for the CS’s own parameters, we set p α = 0.25 as suggested in [44], while the number of the first generation is set to 10. Since CS is a meta-heuristic algorithm, we run all the testing scenarios 10 times. Furthermore, we compare the two initialization patterns CS-C and CS-R in terms of the achieved WSN lifetime (summation of t k ), the execution time, the distribution of t k , and finally the sensors’ residual energy.
Algorithm 2 Improved Cuckoo Search (CS) algorithm.
Input:
  • N: number of sensor nodes ( L × L ).
  • M: maximum number of iterations.
  • S: population size.
  • p a : abandon probability.
Output:
  • Maximum WSN lifetime (result of fitness function).
  • Best Sink sojourn points and duration (as a matrix).
  1:
Define the objective function F ( x ) , where x = ( x 1 , x 2 , , x d ) .
  2:
Initialize:
  3:
Generate an initial single nest x i .
  4:
The t k values of this nest are initialized by sampling to maximize k = 0 N 1 t k .
  5:
Set iteration counter t 0 .
  6:
Set population counter c 0 .
  7:
Create initial population of size S.
  8:
while the nest x i does not satisfy constraints (energy constraint) do
  9:
   Generate a new nest x i + 1 using Lévy flight based on x i with a decrement step.
10:
end while
11:
while c < S or x i does not satisfy constraints do
12:
   Generate a new nest x i + 1 using Lévy flight based on x i with an increment step.
13:
   Update c c + 1 .
14:
end while
15:
while  t < M  do
16:
   Generate a cuckoo solution x i using Lévy flight.
17:
   Evaluate its fitness F i = f ( x i ) .
18:
   Randomly select a nest x j from the population.
19:
   Evaluate its fitness F j = f ( x j ) .
20:
   if  F i > F j  then
21:
     Replace x j x i .
22:
   end if
23:
   Abandon fraction p a of the worst nests and generate new ones.
24:
   Sort population based on the fitness function F and retain best solutions.
25:
   Identify and update global best solution (with the maximum F).
26:
   Update iteration counter t t + 1 .
27:
end while
28:
Return the best solution found (best Sink sojourn points and duration, as a matrix).
29:
Post-process results and visualize outputs.

6.3.1. Achieved WSN Lifetime

First, the t k sojourn duration in all sojourn points are listed in Table 10. To better illustrate the result, we provide a bar graph to show the difference between CS-R and CS-C Figure 8 indicates both models give nearly similar results. Thus, the initialization patterns have no impact on the WSN lifetime.

6.3.2. Execution Time

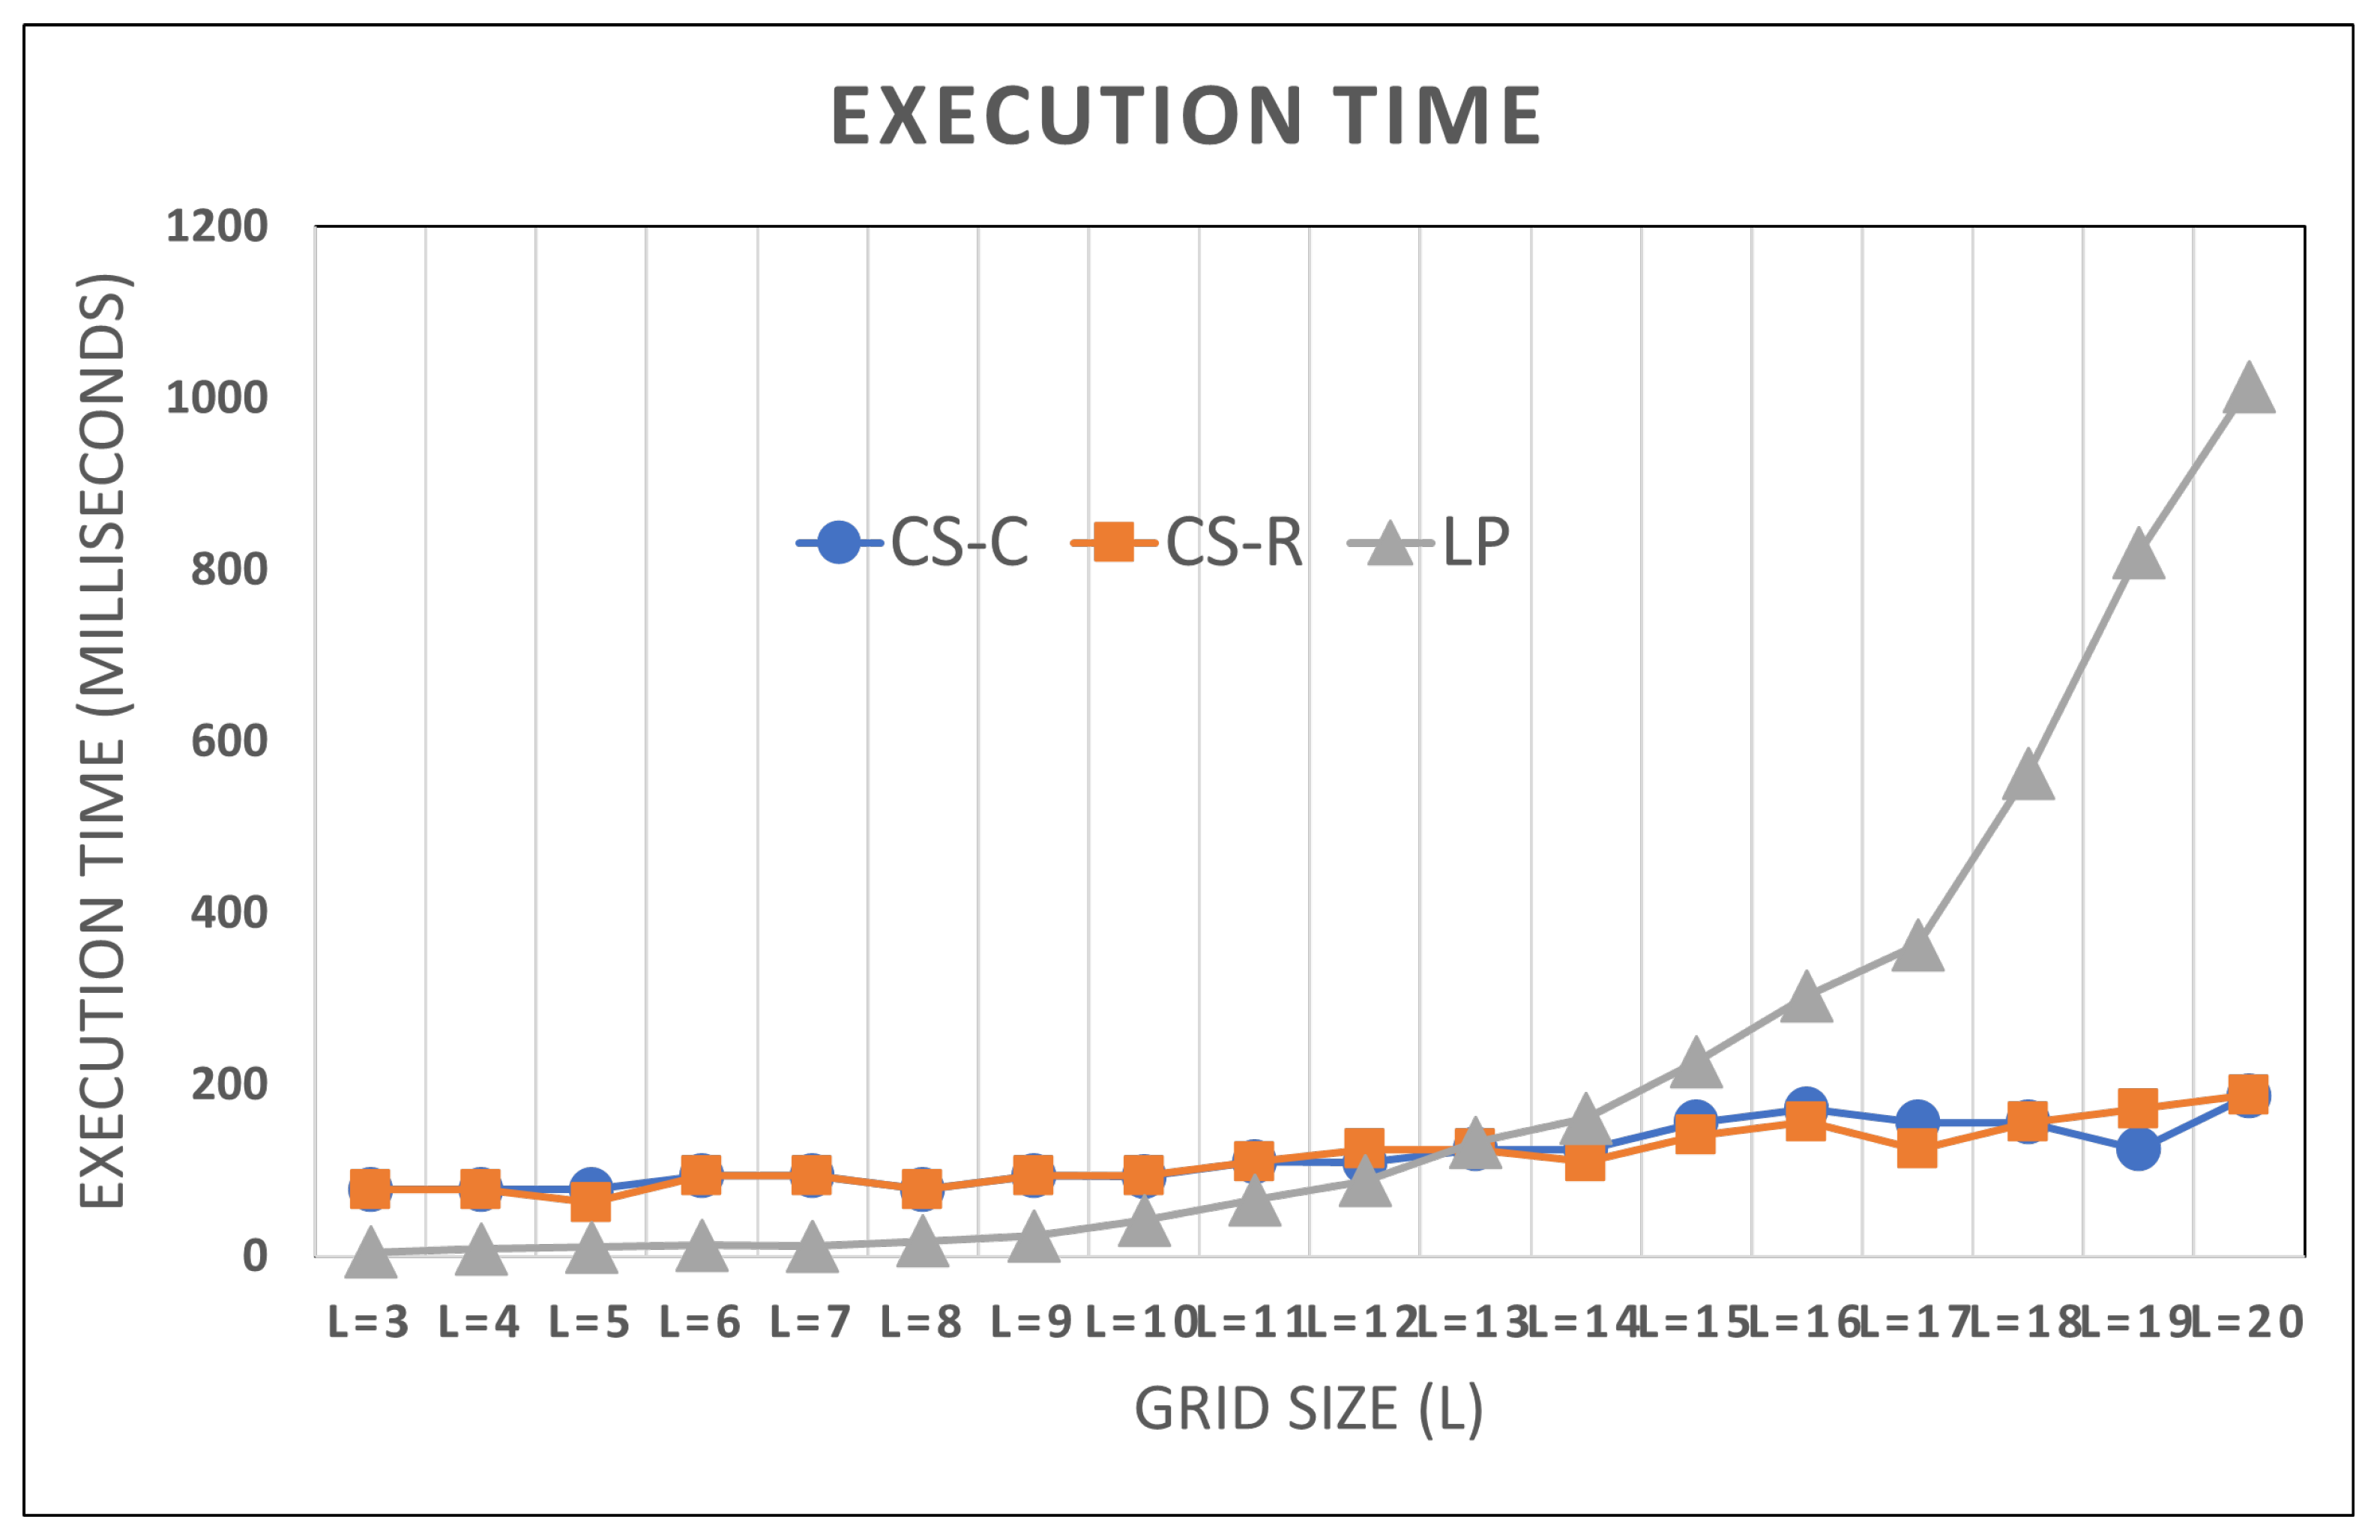
To gain more insights into the performances achieved by CS-C and CS-R, we calculate the execution time for both patterns. The results are listed in Table 11 and depicted in Figure 9, which indicate that the CS-R pattern is either faster or has equal performance to the CS-C pattern. Indeed, CS-C outperforms CS-R only twice (L = 12 and L = 19). Accordingly, we can conclude that CS-R is slightly better than CS-C in terms of execution time. This is because, in CS-R, the ratio of sojourn points to the grid sensor nodes is greater than that of CS-C, giving more chances to CS-R to find the approximated optimal solution faster.

6.3.3. Sink’s Sojourn and Sensors’ Residual Energy Distribution

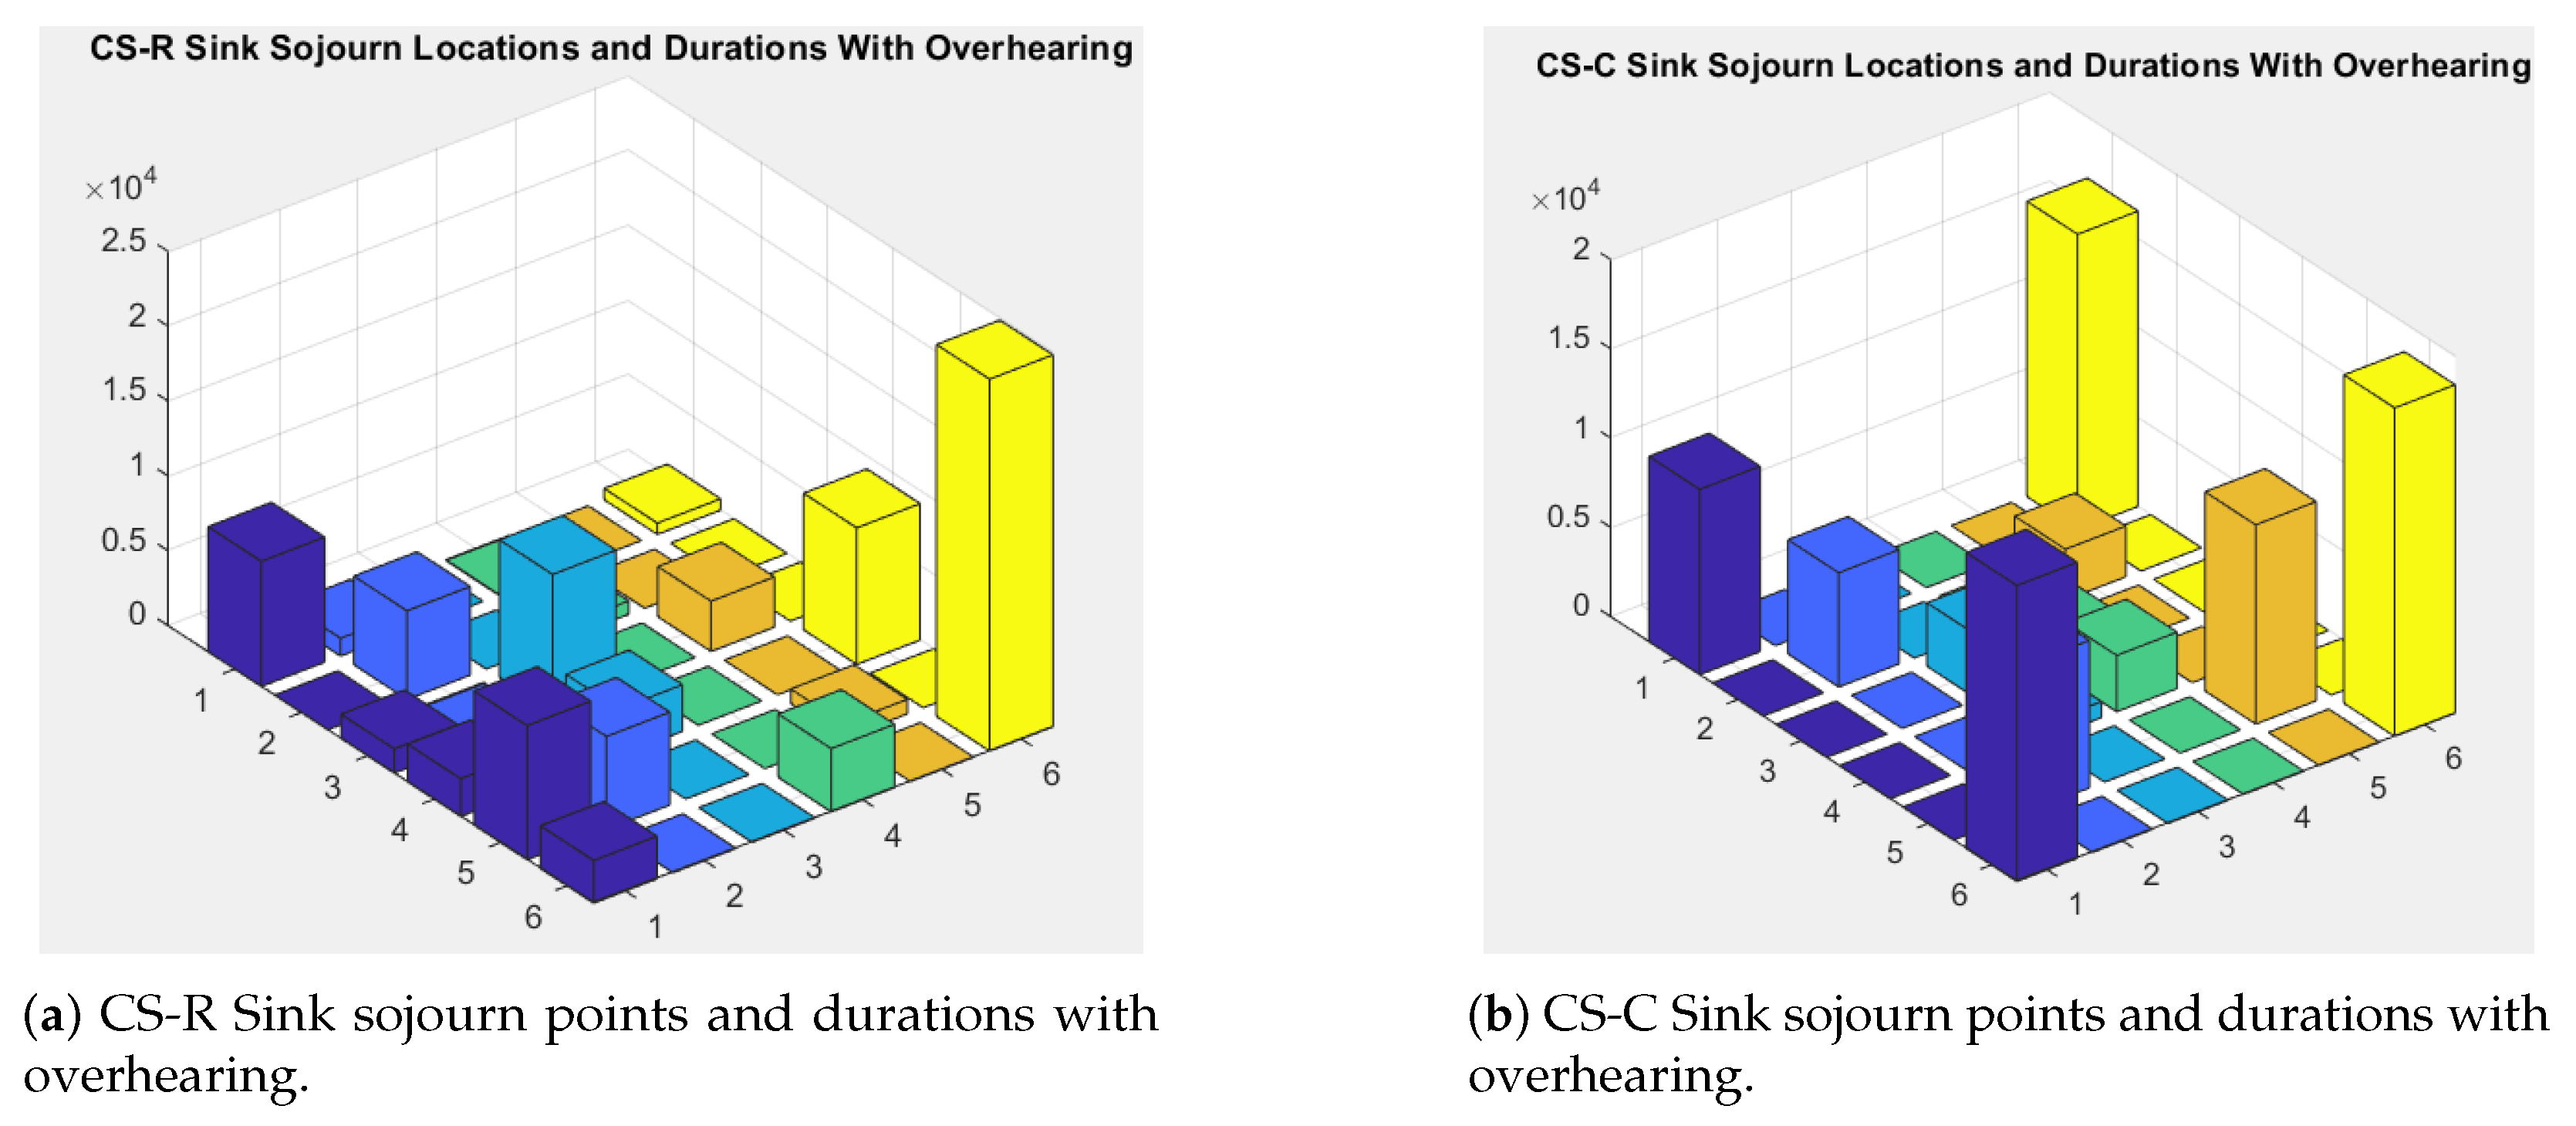
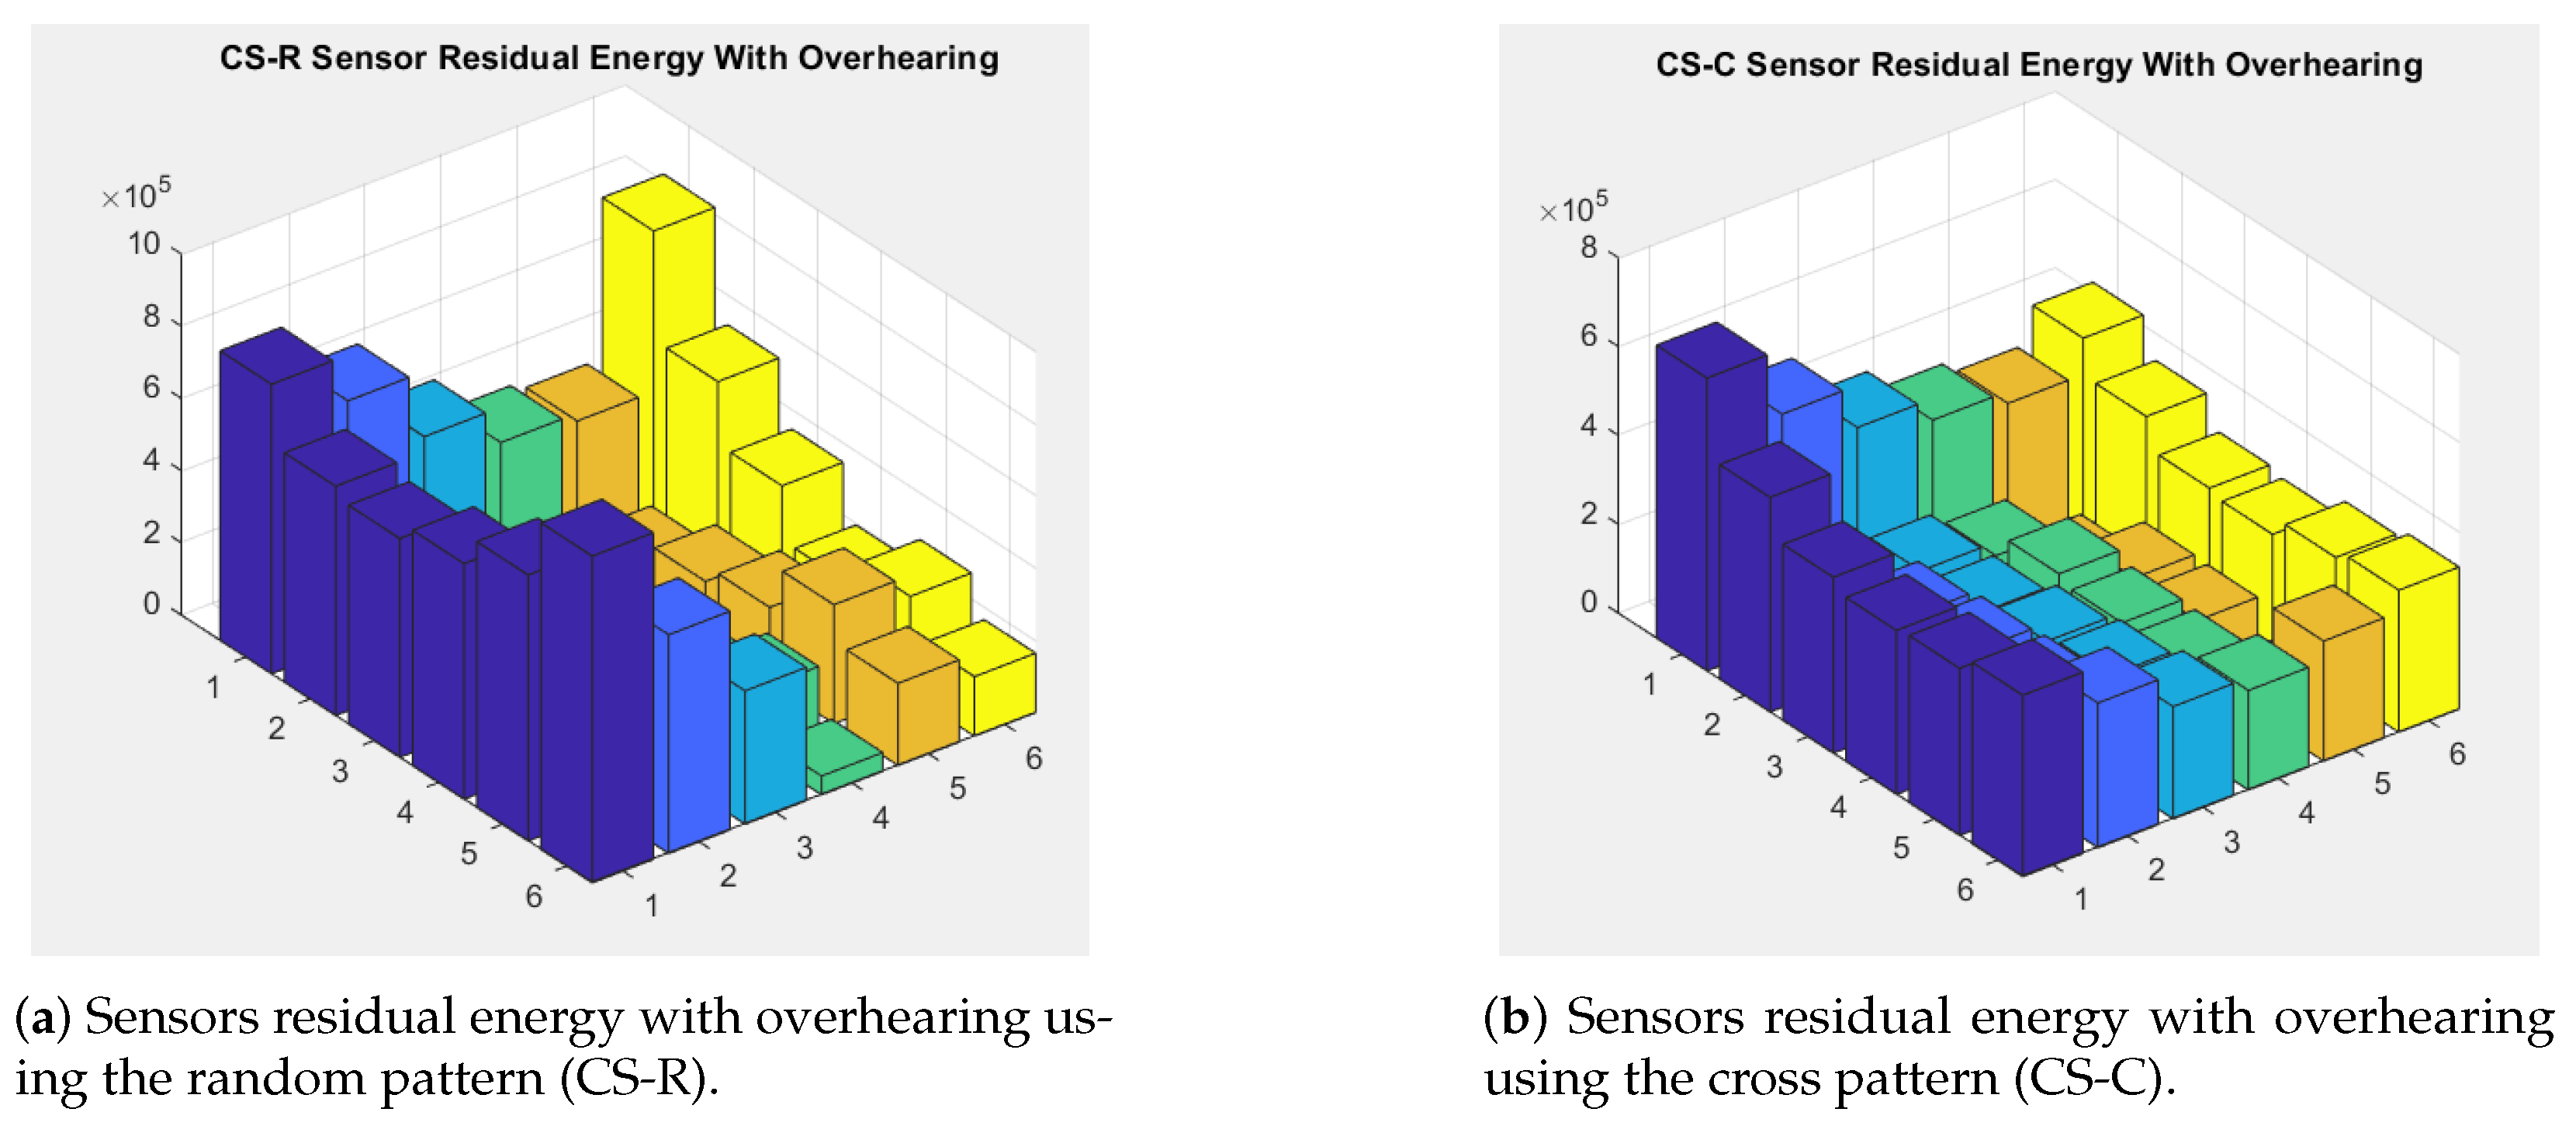
To visualize the distribution of the t k and the residual energy, we consider for example the grid size L = 6 , and show the results in Figure 10 and Figure 11 for both CS-C and CS-R with overhearing. Note that, the same results are detailed in Table 12, Table 13, Table 14 and Table 15. Since CS-C places the Sink in the corners and the center, thus it gives a better energy consumption at each sensor node.

7. Comparative Analysis

In this section, we present a comparative analysis between the Linear Programming and Cuckoo Search optimization approaches. Initially, both proposed methodologies are applied to identical WSN configurations to ensure valid comparison. Subsequently, we evaluate their relative performances across multiple critical metrics: computational efficiency (execution time), network longevity (achieved lifetime), and energy utilization efficiency (sensors’ residual energy distribution).

7.1. Execution Time

Figure 12 shows the execution times of both solutions (LP and CS). The results indicate that LP outperforms the CS-R and CS-C models when the WSN edge length, L, is less than 14. However, from L = 14 , CS-R and CS-C are much faster than LP when L increases. This is due to the high complexity required to calculate the linearity with the multi-constraints objective function [49], since the number of constraints increases with L.

7.2. Achieved WSN Lifetime

Moreover, the achieved WSN lifetime differs between the two solutions since the LP is a deterministic while CS is non-deterministic. Thus, the LP gives optimal results, while CS gives approximated results. Figure 13 illustrates the difference between these two solutions in terms of the achieved network lifetime.

7.3. Sensors Residual Energy

To represent the efficiency of the proposed model in finding the sojourn Sink points and durations that efficiently exploit the sensors’ energy, we provide 2D bar graphs of the sensors’ residual energy for both solutions (LP and CS). From Figure 14, Figure 15 and Figure 16 we can see that since LP provides the optimal solution, it achieves a better distribution.

8. Optimal Sink Trajectory Planning Using TSP-Based Mobility Optimization

In this section, we highlight the theoretical relationship between our problem and the well-known Traveling Salesman Problem (TSP), which is a fundamental optimization task in operations research and computer science. The TSP has been extensively studied for decades and provides a natural formulation for minimizing the cost of visiting a set of locations exactly once. The TSP has been the subject of rigorous investigation for decades, offering a natural mathematical framework for minimizing traversal costs when visiting a predetermined set of locations exactly once. By establishing this foundational connection, we not only contextualize our research within an established optimization framework but also enhance our analytical approach through the incorporation of realistic Sink mobility considerations between consecutive sojourn points.
To optimize our solution methodology, we incorporate the TSP, a classical combinatorial optimization paradigm utilized to determine the route through a specified set of locations which has the minimum cost, returning to the origin with minimal total distance traversed [50]. Within our application context, we employ the TSP framework to compute the optimal trajectory for Sink movement across designated sojourn locations. While our current modeling assumptions stipulate that Sink transit duration is negligible relative to sojourn intervals, the integration of TSP principles becomes particularly significant when considering realistic mobility constraints. In scenarios where transit time is non-negligible, identifying the shortest path becomes critical for optimizing the Sink’s movement efficiency, thereby maximizing the effective operational time of the network.
It is essential to clarify that the incorporation of TSP methodology in this investigation does not constitute our primary scientific contribution, but rather serves as a complementary analytical component that enhances our evaluation framework and demonstrates the operational viability of our proposed models in practical implementations. In realistic deployment scenarios, the assumption of random Sink movement between sojourn locations would be fundamentally impractical, inevitably resulting in superfluous travel distances and consequent resource inefficiency. Although our preceding analysis operates under the simplifying assumption that Sink transit time is negligible, determining an efficient trajectory remains critically important in contexts where mobility-related temporal factors cannot be disregarded. Consequently, we employ the TSP formulation to ensure that the Sink traverses the minimal-length path connecting all designated sojourn locations, thereby eliminating suboptimal routing patterns and maximizing system performance.
In particular, we solve the TSP using the polynomial-time approximation algorithm, Christofides [51,52], within the OR-tools framework [35]. The Christofides algorithm is widely recognized for its efficiency in producing near-optimal solutions with a guaranteed performance ratio, which makes it well-suited for modeling realistic Sink trajectories. This allows us to validate that the proposed models are not only effective in theory but can also be extended to practical deployments where Sink trajectory optimization is required.
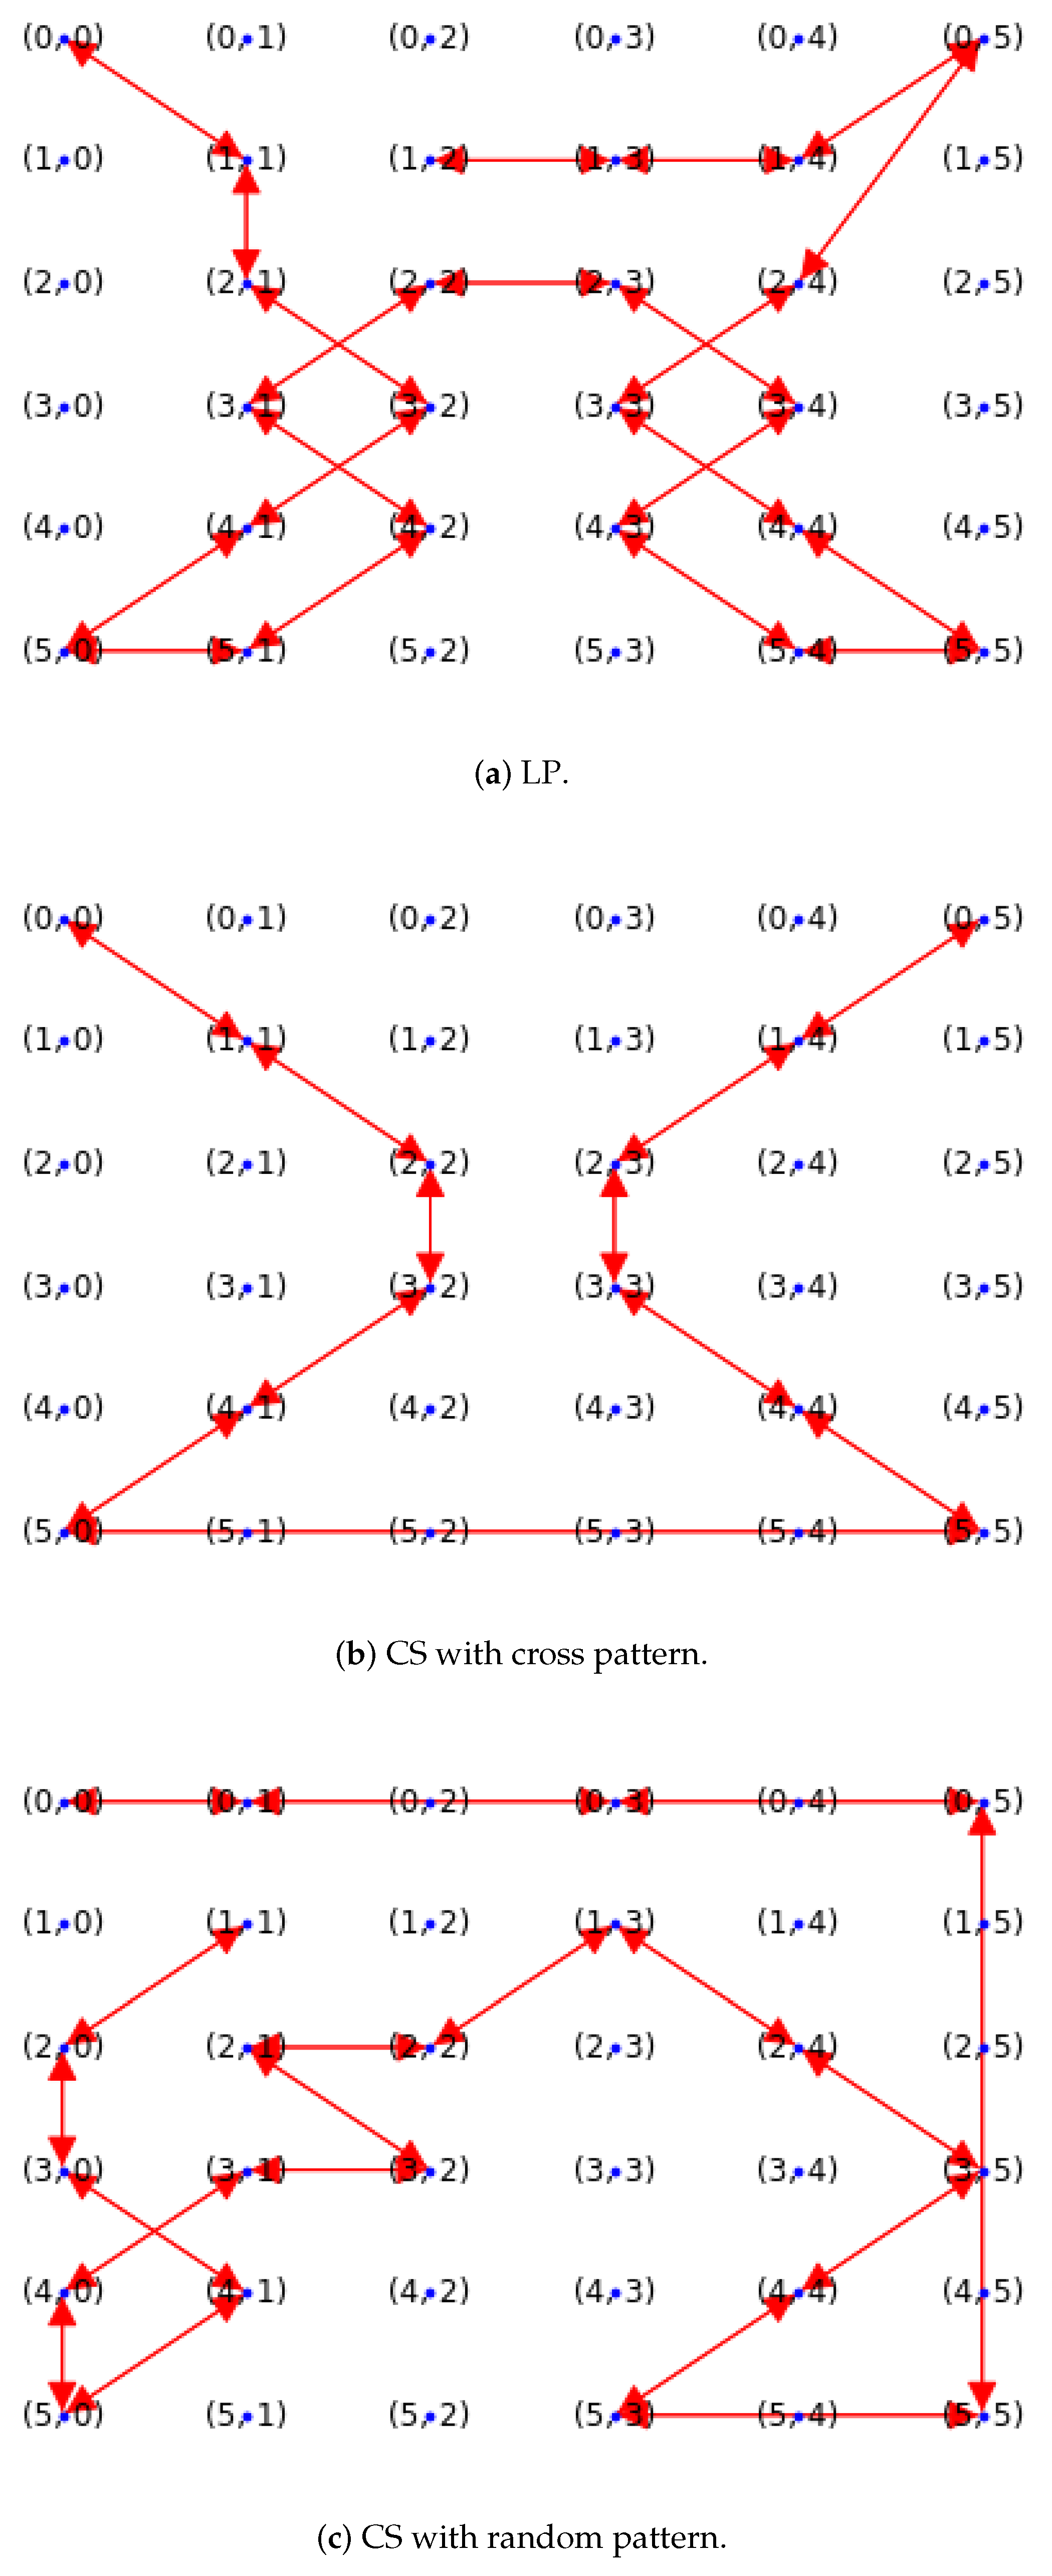
Table 16 and Table 17 present the optimized routes computed for both energy models across two representative network configurations ( L = 6 and L = 9 ), along with the corresponding total distance for each trajectory. Comparative analysis reveals that the CS with random initialization (CS-R) consistently produces the shortest traversal distance among all three optimization approaches (LP, CS with corners initialization (CS-C), and CS-R), primarily due to its characteristic cross-diagonal routing pattern between grid corners. This routing efficiency makes the CS-R approach particularly advantageous in deployment scenarios where Sink mobility constraints and distance minimization represent critical operational parameters. To facilitate a visual comparison of movement trajectories across all three methodologies, Figure 17 provides a graphical representation of the TSP-optimized routes for each approach, implemented with the overhearing-inclusive energy model at network dimension L = 6 (corresponding to the detailed Sink sojourn locations and durations previously presented) (See Figure 17).

9. Conclusions

In this article, we present an improved LP solution to maximize the lifetime of a Wireless Sensor Network (WSN) by considering overhearing as a significant factor in energy consumption, in addition to data transmission and reception. Our main contribution lies in using LP and Cuckoo Search (CS) algorithms to determine the optimal Sink sojourn points and sojourn durations, which directly prolong the network lifetime. We tailored the original CS algorithm to suit our model’s requirements. In addition to the randomly distributed CS solution (CS-R), we introduced a new Sink sojourn distribution pattern called the cross pattern (CS-C), inspired by the LP solution, to further enhance network performance.
Our findings indicate that the LP solution consistently achieves the optimal Sink sojourn points and durations, providing the longest possible WSN lifetime through deterministic calculations. However, due to its high computational complexity, the Cuckoo Search (CS) algorithm is preferable for large WSN sizes (L > 14) because of its faster execution time. This work serves as a first step to quantify the impact of overhearing, confirming that overlooking overhearing can reduce the network lifetime by almost half (48%). Since our model aims to determine the optimal Sink sojourn points, we used the Traveling Salesman Problem (TSP) to determine the shortest path for the Sink to traverse these points efficiently.
The current study is limited to a regular network grid, which may not generalize directly to other grid topologies. Future work will extend the research by generalizing the model to accommodate other grid shapes as well as random topologies, making the approach more widely applicable. It will also focus on developing techniques to actively mitigate overhearing without ignoring it, based on the observed significant impact of overhearing. Additional research directions include integrating wireless energy harvesting to allow nodes to recharge, exploring the optimal Sink trajectory to evenly distribute energy among nodes and reduce overall consumption, and investigating the use of other AI-based algorithms that may yield better performance and solutions. By combining these strategies, the network lifetime is expected to be significantly enhanced, resulting in WSNs that are more energy-efficient, resilient, and long-lasting.

Author Contributions

Conceptualization, G.T.A.-M., F.B. and A.C.; Formal analysis, G.T.A.-M., F.B. and A.C.; Investigation, G.T.A.-M.; Methodology, F.B. and A.C.; Resources, F.B. and A.C.; Software, G.T.A.-M.; Supervision, F.B. and A.C.; Validation, G.T.A.-M., F.B. and A.C.; Visualization, G.T.A.-M.; Writing—original draft, G.T.A.-M.; Writing—review and editing, F.B. and A.C. All authors have read and agreed to the published version of the manuscript.

Funding

This research work was funded by Institutional Fund Projects under grant no. (IFPIP:1564-612-1443). The authors gratefully acknowledge technical and financial support provided by the Ministry of Education and King Abdulaziz University, Deanship of Scientific Research, Jeddah, Saudi Arabia.

Data Availability Statement

This study does not involve any datasets for publication. The algorithms proposed are fully described within the article, and therefore no additional data are required.

Acknowledgments

I thank Allah for giving me the strength and ability to complete this work. I am very grateful to my supervisor, Fatma Bouabdallah, for her support, encouragement, and helpful advice during this study. I also sincerely thank my co-supervisor, Asma Cherif, for her guidance, patience, and continuous help. I truly appreciate all the time and effort she gave me.

Conflicts of Interest

The authors declare no conflicts of interest.

References

  1. Allakonda, M.; Anjareddy, G.; Shanthi, B.; Kuntala, R.; Venkata Balamurali Krishna, K.; Reddy, P.N. Enhancing Military Surveillance Through WSN-Machine Learning Fusion for Anomaly Detection and Threat Identification. In Proceedings of the Third International Conference on Cognitive and Intelligent Computing (ICCIC 2023), Hyderabad, India, 8–9 December 2023; Springer: Berlin/Heidelberg, Germany, 2023; pp. 587–596. [Google Scholar]
  2. Vinoth Kumar, P.; Jayanthi, R.; Sivaranjani, S.; Pradeep, S. Clustering Technique Based on ARSH-FATI for Data Transmission in WSN-IoT Healthcare System. In Proceedings of the 2025 International Conference on Multi-Agent Systems for Collaborative Intelligence (ICMSCI), Erode, India, 20–22 January 2025. [Google Scholar] [CrossRef]
  3. Mohamed, B.; Abdellatif, E. Fog-Enabled IoT Robotic System for Efficient Date Palm Monitoring in Moroccan Oases. IoT 2025, 6, 16. [Google Scholar] [CrossRef]
  4. Sharmin, N.; Karmaker, A.; Lambert, W.L.; Alam, M.S.; Shawkat, M.S.A. Minimizing the energy hole problem in wireless sensor networks: A wedge merging approach. Sensors 2020, 20, 277. [Google Scholar] [CrossRef]
  5. Shafique, T.; Gantassi, R.; Soliman, A.H.; Amjad, A.; Hui, Z.Q.; Choi, Y. A review of Energy Hole mitigating techniques in multi-hop many to one communication and its significance in IoT oriented Smart City infrastructure. IEEE Access 2023, 11, 121340–121367. [Google Scholar] [CrossRef]
  6. D’Andreagiovanni, F.; Nardin, A. Towards the fast and robust optimal design of wireless body area networks. Appl. Soft Comput. 2015, 37, 971–982. [Google Scholar] [CrossRef]
  7. Hung, C.W.; Zhuang, Y.D.; Lee, C.H.; Wang, C.C.; Yang, H.H. Transmission power control in wireless sensor networks using fuzzy adaptive data rate. Sensors 2022, 22, 9963. [Google Scholar] [CrossRef]
  8. Asadollahi, H.; Zandi, S.; Asharioun, H. Maximizing Network Lifetime in Many-to-One Wireless Sensor Networks (WSNs). Wirel. Pers. Commun. 2022, 123, 2971–2983. [Google Scholar] [CrossRef]
  9. Joon, R.; Tomar, P.; Kumar, G.; Balusamy, B.; Nayyar, A. Unequal clustering energy hole avoidance (UCEHA) algorithm in cognitive radio wireless sensor networks (CRWSNs). Wirel. Netw. 2025, 31, 735–757. [Google Scholar] [CrossRef]
  10. Yadav, A.; Kumar, S.; Vijendra, S. Network Life Time Analysis of WSNs Using Particle Swarm Optimization. Procedia Comput. Sci. 2018, 132, 805–815, International Conference on Computational Intelligence and Data Science. [Google Scholar] [CrossRef]
  11. Wu, X.; Chen, Z.; Zhong, Y.; Zhu, H.; Zhang, P. End-to-end data collection strategy using mobile Sink in wireless sensor networks. Int. J. Distrib. Sens. Netw. 2022, 18, 15501329221077932. [Google Scholar] [CrossRef]
  12. Sridhar, M.; Pankajavalli, P. Adaptive data aggregation scheme with optimal hop selection using optimized distributed Voronoi-based cooperation with energy-aware dual-path geographic routing protocol. Wirel. Pers. Commun. 2023, 130, 2215–2230. [Google Scholar] [CrossRef]
  13. Fu, X.; Yang, Y.; Postolache, O. Sustainable multipath routing protocol for multi-Sink wireless sensor networks in harsh environments. IEEE Trans. Sustain. Comput. 2020, 6, 168–181. [Google Scholar] [CrossRef]
  14. Alsolai, H.; Maashi, M.; Saeed, M.K.; Mohamed, A.; Assiri, M.; Abdelbagi, S.; Drar, S.; Abdelmageed, A.A. Leveraging metaheuristic unequal clustering for hotspot elimination in energy-aware wireless sensor networks. Sensors 2023, 23, 2636. [Google Scholar] [CrossRef]
  15. Wang, Z.; Duan, J. An Unequal Clustering and Multi-Hop Routing Protocol Based on Fuzzy Logic and Q-Learning in WSNs. Entropy 2025, 27, 118. [Google Scholar] [CrossRef]
  16. Sherazi, H.H.R.; Grieco, L.A.; Boggia, G. A comprehensive review on energy harvesting MAC protocols in WSNs: Challenges and tradeoffs. Ad Hoc Netw. 2018, 71, 117–134. [Google Scholar] [CrossRef]
  17. Amengu, A.A.; Abdulai, J.D.; Katsriku, F.A.; Adu-Manu, K.S. SMAC-Based WSN Protocol-Current State of the Art, Challenges, and Future Directions. J. Comput. Netw. Commun. 2022, 2022, 6707413. [Google Scholar] [CrossRef]
  18. Yun, Y.; Xia, Y.; Behdani, B.; Smith, J.C. Distributed Algorithm for Lifetime Maximization in a Delay-Tolerant Wireless Sensor Network with a Mobile Sink. IEEE Trans. Mob. Comput. 2013, 12, 1920–1930. [Google Scholar] [CrossRef]
  19. Wang, Y.C.; Chen, K.C. Efficient Path Planning for a Mobile Sink to Reliably Gather Data from Sensors with Diverse Sensing Rates and Limited Buffers. IEEE Trans. Mob. Comput. 2019, 18, 1527–1540. [Google Scholar] [CrossRef]
  20. Xie, L.; Shi, Y.; Hou, Y.T.; Lou, W.; Sherali, H.D.; Zhou, H.; Midkiff, S.F. A Mobile Platform for Wireless Charging and Data Collection in Sensor Networks. IEEE J. Sel. Areas Commun. 2015, 33, 1521–1533. [Google Scholar] [CrossRef]
  21. Çorapsız, M.F. Lifetime maximization of wireless sensor networks while ensuring intruder detection. Soft Comput. 2024, 28, 4197–4215. [Google Scholar] [CrossRef]
  22. El-Fouly, F.H.; Altamimi, A.B.; Ramadan, R.A. Energy and environment-aware path planning in wireless sensor networks with mobile Sink. Sensors 2022, 22, 9789. [Google Scholar] [CrossRef] [PubMed]
  23. Zhu, C.; Han, G.; Zhang, H. A honeycomb structure based data gathering scheme with a mobile Sink for wireless sensor networks. Peer -Peer Netw. Appl. 2017, 10, 484–499. [Google Scholar] [CrossRef]
  24. Zhang, H.; Li, Z.; Shu, W.; Chou, J. Ant colony optimization algorithm based on mobile Sink data collection in industrial wireless sensor networks. EURASIP J. Wirel. Commun. Netw. 2019, 2019, 152. [Google Scholar] [CrossRef]
  25. Jong, G.J.; Aripriharta; Hendrick; Horng, G.J. A Novel Queen Honey Bee Migration (QHBM) Algorithm for Sink Repositioning in Wireless Sensor Network. Wirel. Pers. Commun. 2017, 95, 3209–3232. [Google Scholar] [CrossRef]
  26. Iwendi, C.; Maddikunta, P.K.R.; Gadekallu, T.R.; Lakshmanna, K.; Bashir, A.K.; Piran, M.J. A metaheuristic optimization approach for energy efficiency in the IoT networks. Softw. Pract. Exp. 2021, 51, 2558–2571. [Google Scholar] [CrossRef]
  27. Dash, L.; Pattanayak, B.K.; Laha, S.R.; Pattnaik, S. Enhanced network lifetime with EPMS: An energy-aware PSO based routing algorithm with mobile Sink support for hot spot mitigation in WSNs. Int. J. Intell. Syst. Appl. Eng. 2023, 11, 18–26. [Google Scholar]
  28. Han, X.; Mu, X.; Zhong, J. HGFF: A Deep Reinforcement Learning Framework for Lifetime Maximization in Wireless Sensor Networks. IEEE Trans. Artif. Intell. 2024, 6, 859–873. [Google Scholar] [CrossRef]
  29. Sangeetha, S.; Victoire, T.; Premkumar, M.; Sowmya, R. ExAq-MSPP: An Energy-Efficient Mobile Sink Path Planning Using Extended Aquila Optimization Algorithm. Int. J. Comput. Intell. Syst. 2024, 17, 1–21. [Google Scholar] [CrossRef]
  30. Al-Salahat, N.N.; Eljaafreh, Y.G. Maximizing the Lifetime of Wireless Sensor Networks with Mobile Sink. J. Commun. 2023, 18, 613–620. [Google Scholar] [CrossRef]
  31. Abu Taleb, A.; Abu Al-Haija, Q.; Odeh, A. Efficient mobile Sink routing in wireless sensor networks using bipartite graphs. Future Internet 2023, 15, 182. [Google Scholar] [CrossRef]
  32. Mohapatra, S.; Behera, P.K.; Sahoo, P.K.; Ojha, M.K.; Swarup, C.; Singh, K.U.; Pandey, S.K.; Kumar, A.; Goswami, A. Modified ring routing protocol for mobile Sinks in a dynamic sensor network in smart monitoring applications. Electronics 2023, 12, 281. [Google Scholar] [CrossRef]
  33. Ye, W.; Heidemann, J.; Estrin, D. An energy-efficient MAC protocol for wireless sensor networks. In Proceedings of the Proceedings. Twenty-First Annual Joint Conference of the IEEE Computer and Communications Societies, New York, NY, USA, 23–27 June 2002; IEEE: Piscataway, NJ, USA, 2002; Volume 3, pp. 1567–1576. [Google Scholar]
  34. Wang, Z.M.; Basagni, S.; Melachrinoudis, E.; Petrioli, C. Exploiting Sink Mobility for Maximizing Sensor Networks Lifetime. In Proceedings of the 38th Annual Hawaii International Conference on System Sciences, Big Island, HI, USA, 6 January 2005; p. 287a, ISSN 1530-1605. [Google Scholar] [CrossRef]
  35. Google OR-Tools. 2008. Available online: https://developers.google.com/optimization (accessed on 19 July 2008).
  36. Mohammed, L.A.; Hasan, A.M.; Hamza, E.K. Optimizing Energy Efficiency in Wireless Sensor Networks Using Dijkstra’s Algorithm. Instrum. Mes. Metrol. 2024, 23, 307. [Google Scholar] [CrossRef]
  37. Houssein, E.H.; Saad, M.R.; Djenouri, Y.; Hu, G.; Ali, A.A.; Shaban, H. Metaheuristic algorithms and their applications in wireless sensor networks: Review, open issues, and challenges. Clust. Comput. 2024, 27, 13643–13673. [Google Scholar] [CrossRef]
  38. Yang, X.S. Harmony Search as a Metaheuristic Algorithm. In Music-Inspired Harmony Search Algorithm: Theory and Applications; Geem, Z.W., Ed.; Studies in Computational Intelligence; Springer: Berlin/Heidelberg, Germany, 2009; pp. 1–14. [Google Scholar] [CrossRef]
  39. Civicioglu, P.; Besdok, E. A conceptual comparison of the Cuckoo-search, particle swarm optimization, differential evolution and artificial bee colony algorithms. Artif. Intell. Rev. 2013, 39, 315–346. [Google Scholar] [CrossRef]
  40. Wang, T.; Meskin, M.; Grinberg, I. Comparison between particle swarm optimization and Cuckoo Search method for optimization in unbalanced active distribution system. In Proceedings of the 2017 IEEE International Conference on Smart Energy Grid Engineering (SEGE), Oshawa, ON, Canada, 14–17 August 2017; pp. 14–19. [Google Scholar] [CrossRef]
  41. Gandomi, A.H.; Yang, X.S.; Alavi, A.H. Cuckoo search algorithm: A metaheuristic approach to solve structural optimization problems. Eng. Comput. 2013, 29, 17–35. [Google Scholar] [CrossRef]
  42. Abdel-Basset, M.; Hessin, A.N.; Abdel-Fatah, L. A comprehensive study of cuckoo-inspired algorithms. Neural Comput. Appl. 2018, 29, 345–361. [Google Scholar] [CrossRef]
  43. Reddy, M.R.; Chandra, M.L.R.; Dilli, R. Enhanced Cuckoo Search Optimization with Opposition-Based Learning for the Optimal Placement of Sensor Nodes and Enhanced Network Coverage in Wireless Sensor Networks. Appl. Sci. 2025, 15, 8575. [Google Scholar] [CrossRef]
  44. Yang, X.S.; Deb, S. Cuckoo Search via Lévy flights. In Proceedings of the 2009 World Congress on Nature Biologically Inspired Computing (NaBIC), Coimbatore, India, 9–11 December 2009; pp. 210–214. [Google Scholar] [CrossRef]
  45. Bonabeau, E.; Dorigo, M.; Theraulaz, G.; Theraulaz, G. Swarm Intelligence: From Natural to Artificial Systems; Oxford University Press: Oxford, UK, 1999; Number 1. [Google Scholar]
  46. Blum, C.; Roli, A. Metaheuristics in combinatorial optimization: Overview and conceptual comparison. ACM Comput. Surv. (CSUR) 2003, 35, 268–308. [Google Scholar] [CrossRef]
  47. Yang, X.S. Nature-Inspired Metaheuristic Algorithms; Luniver Press: Frome, UK, 2010. [Google Scholar]
  48. Adekanmbi, O.; Green, P. Conceptual comparison of population based metaheuristics for engineering problems. Sci. World J. 2015, 2015, 936106. [Google Scholar] [CrossRef] [PubMed]
  49. RinnooyKan, A.; Telgen, J. The complexity of linear programming. Stat. Neerl. 1981, 35, 91–107. [Google Scholar] [CrossRef]
  50. Reinelt, G. The Traveling Salesman: Computational Solutions for TSP Applications; Springer: Berlin/Heidelberg, Germany, 2003; Volume 840. [Google Scholar]
  51. Christofides, N. Worst-Case Analysis of a New Heuristic for the Travelling Salesman Problem; Technical Report; Carnegie-Mellon University, Management Sciences Research Group: Pittsburgh, PA, USA, 1976. [Google Scholar]
  52. Andrews, J.; Sethian, J. Fast marching methods for the continuous traveling salesman problem. Proc. Natl. Acad. Sci. USA 2007, 104, 1118–1123. [Google Scholar] [CrossRef] [PubMed]
Figure 1. The energy hole problem in WSNs.
Iot 06 00054 g001
Figure 2. WSN model.
Iot 06 00054 g002
Figure 3. The two considered paths between a sensor node i and the Sink s.
Iot 06 00054 g003
Figure 4. Divided subareas and data flows received and transmitted at node i. The dotted lines indicate the boundaries of the subareas, while the arrows represent the data transmission directions.
Iot 06 00054 g004
Figure 5. Different WSN lifetimes with and without overhearing by LP.
Iot 06 00054 g005
Figure 6. Sink sojourn points and durations (in second) using LP for different grid sizes. (a,b) L = 6 , (c,d) L = 9 , (e,f) L = 14 (without and with overhearing, respectively).
Iot 06 00054 g006
Figure 7. Sensors residual energy (in joule) using LP for different grid sizes. (a,b) L = 6 , (c,d) L = 9 , (e,f) L = 14 (without and with overhearing, respectively).
Iot 06 00054 g007
Figure 8. WSN lifetimes achieved by the two CS (CS-C and CS-R) models with overhearing.
Iot 06 00054 g008
Figure 9. Execution time of the CS algorithm for the two patterns (CS-C and CS-R) models with overhearing.
Iot 06 00054 g009
Figure 10. Sojourn points and durations (in second) with overhearing using Cuckoo Search with the two initialization patterns. (a) CS-R, (b) CS-C.
Iot 06 00054 g010
Figure 11. Residual energy (in joule) using Cuckoo Search with the two initialization patterns. (a) CS-R, (b) CS-C.
Iot 06 00054 g011
Figure 12. Comparison of execution time between LP and CS (with overhearing).
Iot 06 00054 g012
Figure 13. Comparison of achieved WSN lifetime between LP and CS (with overhearing).
Iot 06 00054 g013
Figure 14. LP sensors’ residual energy with overhearing.
Iot 06 00054 g014
Figure 15. CS-C sensors’ residual energy with overhearing.
Iot 06 00054 g015
Figure 16. CS-R sensors’ residual energy with overhearing.
Iot 06 00054 g016
Figure 17. Shortest path with overhearing for grid size L = 6 .
Iot 06 00054 g017
Table 1. Comparison of LP-based Sink mobility models in WSN lifetime optimization.
ReferenceApproachKey FeaturesAdvantagesLimitationsOverhearingEnergy Balancing/Lifetime
Yun et al. [18]LP + fractional knapsackDistributed algorithm with energy, flow, and traffic constraintsNear-optimal lifetime, distributed decisionsSingle Sink, limited scalabilityNoLifetime
Wang et al. [19]LP + mobile relay and SinkTrade-off analysis, relay placementSuitable for dense large networksHigher communication and computation overheadNoLifetime
Xie et al. [20]LP + Wireless Charging Vehicle (WCV)Balanced data collection and rechargingContinuous operationPath discretization and complex timingNoLifetime and energy
WSNDID [21]MILP + Lagrangean heuristicScheduling, routing, intruder detectionHigh detection rate, scalableHigh computational costNoLifetime and detection
El-Fouly et al. [22]0/1 ILP + Swarm IntelligencePath planning, Cluster HeadsImproved energy saving and timely deliveryILP complexity, approximate solutionNoLifetime
Table 2. Comparison of AI-based Sink mobility models in WSN lifetime optimization.
ReferenceApproachKey FeaturesAdvantagesLimitationsOverhearingEnergy Balancing vs. Lifetime
Zhu C. et al. [23]Honeycomb + RM/DGM/EGMPartitioned nodes, movement strategiesReduces energy waste, DGM bestLimited dynamic adaptabilityNoEnergy balancing
Zhang H. et al. [24]Ant Colony + entropy weightingRendezvous node selection, energy balanceBalances node energyDoes not maximize network lifetimeNoEnergy balancing
Jong G. J [25]QHBM (bee-inspired)CHs as scouts, Sink follows CHReduces routing overheadRandom CH selectionNoEnergy balancing
Iwendi et al. [26]Hybrid WOA + SAOptimal CH selectionOutperforms other metaheuristic tasksMedium computational complexityNoEnergy balancing
Dash et al. [27]EPMS (PSO + Mobile Sink)Cluster formation + Sink path optimizationHigh energy efficiencyComputational overhead for large networksNoEnergy balancing
Han et al. [28]HGFF (GNN + DRL)Graph representation, greedy Sink policyOutperforms heuristics, practicalRequires training, complex for very large networksNoLifetime and energy
Sangeetha et al. [29]ExAq-MSPP (Aquila Optimization)Voronoi placement, optimized Sink pathEnergy efficient, reduces delay, improves throughputComputationally intensiveNoLifetime and energy
Table 3. Comparison of Non-LP/AI Sink mobility models in WSN lifetime optimization.
ReferenceApproachKey FeaturesAdvantagesLimitationsOverhearingEnergy Balancing vs. Lifetime
Nusaiba N. et al. [30]Enhanced LEACH + Mobile SinkSink selects CH based on geographic location and data loadImproves residual energy, slight increase in alive nodesSmall network, minor improvementNoEnergy balancing
Abu Taleb et al. [31]Bipartite graph + BFS traversalSink visits two disjoint sets iterativelyReduces buffer overflow and delayLimited to medium networksNoEnergy balancing
Mohapatra et al. [32]Virtual ring + greedy geographic Sink movementRing shares Sink location, dynamic CH selectionReduces overhead, improves throughput and energyReconfiguration needed if nodes die or Sink movesNoEnergy balancing
Table 4. Simulation parameters’ values.
ParameterValue
e 0 1,350,000 μ J
e0.62 μ J/bit
r1 bit/s
Table 5. Achieved WSN lifetime by LP with and without overhearing in different WSN sizes.
WSN SizeWSN Lifetime (s)Decrease in Percentage
L N = L 2 Without Overhearing With Overhearing
39802,207231,75171%
416451,917171,88862%
525320,054141,99956%
636263,601120,25654%
749222,869104,03153%
864193,12691,77352%
981169,49382,15352%
10100151,52974,41651%
11121137,21968,02850%
12144125,45162,68050%
13169115,28558,11450%
14196106,70754,17649%
1522599,42350,74249%
1625693,07547,72549%
1728987,36045,05048%
1832482,37042,65848%
1936177,97840,51048%
2040073,98638,56948%
Table 6. LP Sink sojourn points and durations without overhearing, L = 6.
25,562.38000021,909.61
0883.449548.372897.82198.0671100
0621.37491083.4691233.62520700
0281.40281324.8941626.3622700
04842.1911676.1291386.7984818.9321654.615
21,310.66000021,761.73
Table 7. LP Sink sojourn points and durations with overhearing, L = 6.
28,662.13 3.85 × 10 1 00028,662.13
010,155.870 6.17 × 10 12 10,155.87 1.04 × 10 11
0027,082.3327,082.33 9.84 × 10 12 0
0027,082.3327,082.33 3.52 × 10 12 0
10,155.8700010,155.870
18,506.2610,155.8700028,662.13
Table 8. LP sensors residual energy without overhearing, L = 6.
1,008,862 1.55 × 10 5 00155,3171,008,862
155,317533,11600533,116 1.55 × 10 5
000000
000000
369,403167,91000533,116155,317
945,896369,40300155,3171,008,862
Table 9. LP sensors residual energy with overhearing, L = 6.
50,199 1.98 × 10 4 0712932,501116,321
12,1930000 1.13 × 10 4
000000
10,41400000
62,786000028,915
127,71336,9750055,530105,229
Table 10. WSN lifetimes achieved by CS-C and CS-R with overhearing.
WSN SizeWSN Lifetime (s)
L N = L 2 CS-C CS-R
39210,974219,545
416150,958145,280
525119,392116,982
636100,24396,687
74976,03679,712
86472,69267,319
98163,21360,118
1010050,87653,057
1112149,57849,908
1214444,12745,621
1316939,40638,157
1419634,68536,575
1522533,55934,011
1625631,51635,496
1728928,85333,100
1832426,22028,600
1936124,24029,259
2040024,85125,945
Table 11. Execution time of CS-C AND CS-R with overhearing.
WSN SizeExecution Time (ms)
L N = L 2 CS-CCS-R
397878
4167878
5257863
6369494
7499494
8647878
9819494
101009394
11121110110
12144109125
13169125125
14196125110
15225156141
16256172157
17289156125
18324156156
19361125172
20400187188
Table 12. CS-C Sink sojourn points and durations with overhearing, L = 6.
10,377000016,539
063980028420
003555210000
00893315400
082590011,1570
16,575000018,395
Table 13. CS-R Sink sojourn points and durations with overhearing, L = 6.
835711860530755
05917089000
1617929211033590
252024193116009122
89656208009720
2849004232024,846
Table 14. CS-C sensors residual energy with overhearing, L = 6.
659,133512,992417,816369,595342,141423,985
483,226184,553187,643156,89759,030340,416
396,100240,853188,655208,816134,606271,644
369,115254,863214,567190,987131,476260,444
376,228260,031230,128187,52953,114300,831
408,338325,932252,761224,174270,365319,989
Table 15. CS-R sensors residual energy with overhearing, L = 6.
801,790674,567494,162396,622375,142820,061
635,307326,539204,84478,14998,269518,727
606,102348,65242,21727,057162,243345,890
652,494387,962207,11395,626206,146195,826
736,766501,756289,361174,622329,407271,329
904,800605,811369,22052,100227,572164,864
Table 16. TSP shortest path for the energy model without overhearing.
WSN SizeSink Mobility Model TypeRouteDistance (Number of Nodes)
L = 6LP 0 [ 0 , 0 ] 3 [ 1 , 0 ] 9 [ 3 , 2 ] 8 [ 3 , 1 ] 11 [ 4 , 1 ] 15 [ 5 , 0 ] 16 [ 5 , 1 ] 12 [ 4 , 2 ] 13 [ 4 , 3 ] 17 [ 5 , 5 ] 14 [ 4 , 4 ] 10 [ 3 , 3 ] 5 [ 1 , 5 ] 1 [ 0 , 4 ] 2 [ 0 , 5 ] 7 [ 2 , 3 ] 6 [ 2 , 2 ] 4 [ 1 , 1 ] 0 22
CS-C 0 [ 0 , 0 ] 2 [ 1 , 1 ] 4 [ 2 , 2 ] 6 [ 3 , 2 ] 8 [ 4 , 1 ] 10 [ 5 , 0 ] 11 [ 5 , 5 ] 9 [ 4 , 4 ] 7 [ 3 , 3 ] 5 [ 2 , 3 ] 3 [ 1 , 4 ] 1 [ 0 , 5 ] 0 20
CS-R 0 [ 0 , 0 ] 3 [ 1 , 2 ] 7 [ 2 , 1 ] 6 [ 2 , 0 ] 10 [ 3 , 0 ] 13 [ 4 , 0 ] 16 [ 5 , 0 ] 11 [ 3 , 1 ] 14 [ 4 , 2 ] 15 [ 4 , 3 ] 17 [ 5 , 3 ] 18 [ 5 , 5 ] 12 [ 3 , 3 ] 9 [ 2 , 4 ] 5 [ 1 , 5 ] 2 [ 0 , 5 ] 1 [ 0 , 4 ] 4 [ 1 , 4 ] 8 [ 2 , 2 ] 0 25
L = 9LP 0 [ 0 , 0 ] 1 [ 0 , 1 ] 6 [ 1 , 2 ] 12 [ 2 , 3 ] 20 [ 3 , 4 ] 25 [ 4 , 5 ] 32 [ 5 , 6 ] 33 [ 5 , 7 ] 40 [ 6 , 6 ] 50 [ 8 , 8 ] 47 [ 7 , 7 ] 41 [ 6 , 7 ] 46 [ 7 , 6 ] 45 [ 7 , 5 ] 39 [ 6 , 5 ] 30 [ 5 , 4 ] 24 [ 4 , 3 ] 19 [ 3 , 3 ] 13 [ 2 , 4 ] 7 [ 1 , 5 ] 2 [ 0 , 6 ] 8 [ 1 , 6 ] 9 [ 1 , 7 ] 3 [ 0 , 8 ] 10 [ 1 , 8 ] 17 [ 2 , 8 ] 16 [ 2 , 7 ] 22 [ 3 , 6 ] 14 [ 2 , 5 ] 15 [ 2 , 6 ] 21 [ 3 , 5 ] 26 [ 4 , 6 ] 31 [ 5 , 5 ] 38 [ 6 , 4 ] 37 [ 6 , 3 ] 44 [ 7 , 3 ] 36 [ 6 , 2 ] 43 [ 7 , 2 ] 35 [ 6 , 1 ] 48 [ 8 , 0 ] 49 [ 8 , 1 ] 42 [ 7 , 1 ] 34 [ 6 , 0 ] 27 [ 5 , 1 ] 28 [ 5 , 2 ] 29 [ 5 , 3 ] 23 [ 4 , 2 ] 18 [ 3 , 2 ] 11 [ 2 , 2 ] 5 [ 1 , 1 ] 4 [ 1 , 0 ] 0 53
CS-C 0 [ 0 , 0 ] 2 [ 1 , 1 ] 4 [ 2 , 2 ] 6 [ 3 , 3 ] 8 [ 4 , 4 ] 10 [ 5 , 5 ] 12 [ 6 , 6 ] 14 [ 7 , 7 ] 16 [ 8 , 8 ] 15 [ 8 , 0 ] 13 [ 7 , 1 ] 11 [ 6 , 2 ] 9 [ 5 , 3 ] 7 [ 3 , 5 ] 5 [ 2 , 6 ] 3 [ 1 , 7 ] 1 [ 0 , 8 ] 0 32
CS-R 0 [ 0 , 0 ] 5 [ 1 , 0 ] 12 [ 3 , 0 ] 13 [ 3 , 2 ] 14 [ 3 , 3 ] 15 [ 3 , 4 ] 19 [ 4 , 5 ] 16 [ 3 , 6 ] 20 [ 4 , 6 ] 25 [ 5 , 5 ] 18 [ 4 , 4 ] 24 [ 5 , 4 ] 28 [ 6 , 3 ] 23 [ 5 , 3 ] 31 [ 7 , 1 ] 35 [ 8 , 0 ] 26 [ 6 , 0 ] 22 [ 5 , 1 ] 27 [ 6 , 2 ] 32 [ 7 , 3 ] 36 [ 8 , 3 ] 37 [ 8 , 4 ] 33 [ 7 , 4 ] 29 [ 6 , 5 ] 34 [ 7 , 5 ] 38 [ 8 , 6 ] 39 [ 8 , 7 ] 40 [ 8 , 8 ] 30 [ 6 , 7 ] 21 [ 4 , 8 ] 17 [ 3 , 8 ] 4 [ 0 , 8 ] 3 [ 0 , 7 ] 7 [ 1 , 6 ] 2 [ 0 , 5 ] 1 [ 0 , 4 ] 11 [ 2 , 5 ] 10 [ 2 , 4 ] 9 [ 2 , 3 ] 8 [ 2 , 2 ] 6 [ 1 , 1 ] 0 50
Table 17. TSP shortest path for energy model with overhearing.
WSN SizeSink Mobility Model TypeRouteDistance (Number of Nodes)
L = 6LP 0 [ 0 , 0 ] 2 [ 1 , 1 ] 6 [ 2 , 1 ] 11 [ 3 , 2 ] 14 [ 4 , 1 ] 18 [ 5 , 0 ] 19 [ 5 , 1 ] 15 [ 4 , 2 ] 10 [ 3 , 1 ] 7 [ 2 , 2 ] 8 [ 2 , 3 ] 13 [ 3 , 4 ] 16 [ 4 , 3 ] 20 [ 5 , 4 ] 21 [ 5 , 5 ] 17 [ 4 , 4 ] 12 [ 3 , 3 ] 9 [ 2 , 4 ] 1 [ 0 , 5 ] 5 [ 1 , 4 ] 4 [ 1 , 3 ] 3 [ 1 , 2 ] 0 24
CS-C 0 [ 0 , 0 ] 2 [ 1 , 1 ] 4 [ 2 , 2 ] 6 [ 3 , 2 ] 8 [ 4 , 1 ] 10 [ 5 , 0 ] 11 [ 5 , 5 ] 9 [ 4 , 4 ] 7 [ 3 , 3 ] 5 [ 2 , 3 ] 3 [ 1 , 4 ] 1 [ 0 , 5 ] 0 20
CS-R 0 [ 0 , 0 ] 1 [ 0 , 1 ] 2 [ 0 , 3 ] 3 [ 0 , 5 ] 19 [ 5 , 5 ] 18 [ 5 , 3 ] 16 [ 4 , 4 ] 13 [ 3 , 5 ] 9 [ 2 , 4 ] 5 [ 1 , 3 ] 8 [ 2 , 2 ] 7 [ 2 , 1 ] 12 [ 3 , 2 ] 11 [ 3 , 1 ] 14 [ 4 , 0 ] 17 [ 5 , 0 ] 15 [ 4 , 1 ] 10 [ 3 , 0 ] 6 [ 2 , 0 ] 4 [ 1 , 1 ] 0 27
L = 9LP 0 [ 0 , 0 ] 3 [ 1 , 0 ] 6 [ 2 , 1 ] 13 [ 3 , 2 ] 18 [ 4 , 2 ] 23 [ 5 , 2 ] 24 [ 5 , 3 ] 28 [ 6 , 2 ] 34 [ 7 , 1 ] 41 [ 8 , 0 ] 42 [ 8 , 1 ] 35 [ 7 , 2 ] 36 [ 7 , 3 ] 29 [ 6 , 3 ] 37 [ 7 , 4 ] 30 [ 6 , 4 ] 38 [ 7 , 5 ] 32 [ 6 , 6 ] 39 [ 7 , 6 ] 43 [ 8 , 7 ] 44 [ 8 , 8 ] 40 [ 7 , 7 ] 33 [ 6 , 7 ] 27 [ 5 , 6 ] 21 [ 4 , 5 ] 20 [ 4 , 4 ] 19 [ 4 , 3 ] 25 [ 5 , 4 ] 31 [ 6 , 5 ] 26 [ 5 , 5 ] 22 [ 4 , 6 ] 16 [ 3 , 5 ] 17 [ 3 , 6 ] 12 [ 2 , 7 ] 5 [ 1 , 7 ] 2 [ 0 , 8 ] 1 [ 0 , 7 ] 11 [ 2 , 6 ] 10 [ 2 , 5 ] 9 [ 2 , 4 ] 8 [ 2 , 3 ] 15 [ 3 , 4 ] 14 [ 3 , 3 ] 7 [ 2 , 2 ] 4 [ 1 , 1 ] 0 46
CS-C 0 [ 0 , 0 ] 2 [ 1 , 1 ] 4 [ 2 , 2 ] 6 [ 3 , 3 ] 8 [ 4 , 4 ] 10 [ 5 , 5 ] 12 [ 6 , 6 ] 14 [ 7 , 7 ] 16 [ 8 , 8 ] 15 [ 8 , 0 ] 13 [ 7 , 1 ] 11 [ 6 , 2 ] 9 [ 5 , 3 ] 7 [ 3 , 5 ] 5 [ 2 , 6 ] 3 [ 1 , 7 ] 1 [ 0 , 8 ] 0 32
CS-R 0 [ 0 , 0 ] 1 [ 0 , 1 ] 2 [ 0 , 3 ] 7 [ 1 , 3 ] 13 [ 2 , 4 ] 12 [ 2 , 3 ] 16 [ 3 , 2 ] 22 [ 4 , 1 ] 23 [ 4 , 2 ] 17 [ 3 , 3 ] 24 [ 4 , 4 ] 18 [ 3 , 4 ] 8 [ 1 , 6 ] 3 [ 0 , 6 ] 9 [ 1 , 7 ] 4 [ 0 , 8 ] 10 [ 1 , 8 ] 14 [ 2 , 7 ] 20 [ 3 , 8 ] 19 [ 3 , 7 ] 30 [ 5 , 8 ] 35 [ 6 , 8 ] 40 [ 7 , 7 ] 46 [ 8 , 8 ] 45 [ 8 , 7 ] 44 [ 8 , 6 ] 29 [ 5 , 7 ] 25 [ 4 , 6 ] 28 [ 5 , 5 ] 34 [ 6 , 5 ] 39 [ 7 , 4 ] 33 [ 6 , 3 ] 27 [ 5 , 2 ] 32 [ 6 , 2 ] 38 [ 7 , 3 ] 43 [ 8 , 3 ] 37 [ 7 , 2 ] 42 [ 8 , 1 ] 41 [ 8 , 0 ] 36 [ 7 , 1 ] 31 [ 6 , 0 ] 26 [ 5 , 0 ] 21 [ 4 , 0 ] 15 [ 3 , 0 ] 11 [ 2 , 0 ] 5 [ 1 , 0 ] 6 [ 1 , 1 ] 0 52
Disclaimer/Publisher’s Note: The statements, opinions and data contained in all publications are solely those of the individual author(s) and contributor(s) and not of MDPI and/or the editor(s). MDPI and/or the editor(s) disclaim responsibility for any injury to people or property resulting from any ideas, methods, instructions or products referred to in the content.