


Abstract
We establish a general, device-oriented procedure to extract absolute pump-band metrics from room-temperature UV–Vis (ultraviolet–visible) absorbance—including the absorption coefficient α(λ), per-active-ion cross-section , the effective per-active-ion absorption cross section and derivative-based line-shape descriptors. As a representative case study, the procedure is applied to nanocrystalline Er3+/Ho3+:Y3Ga5O12 over the 350–700 nm spectral range. After baseline correction and line-shape inspection assisted by the numerical second derivative of the absorbance, we extract conservative peak positions and the full width at half maximum across the visible 4f–4f manifolds. At the technologically relevant pump wavelengths near 406 nm (Er-addressing) and 473 nm (Ho-addressing) bands, resulting absorption coefficients are α = 0.313 ± 0.047 cm−1 and α = 0.472 ± 0.071 cm−1, respectively. The corresponding per-active-ion
of (3.62 ± 0.54) × 10−22 cm2 and (5.46 ± 0.82) × 10−22 cm2, referenced to the measured optical path length L = 0.22 ± 0.03 mm (approximately 15% propagated relative uncertainty; explicit 1/L rescaling). Cross sections are reported per total active-ion density (Er3+ + Ho3+). The spectra exhibit Stark-type substructure only partially resolved at room temperature; the second derivative highlights hidden components, and we report quantitative descriptors (component count, mean spacing, curvature-weighted prominence, and pump detuning) that link line-shape structure to absolute pump response. These device-grade metrics enable rate-equation modelling (pump thresholds, detuning tolerance), optical design choices (path length, single/multi-pass or cavity coupling), and host-to-host benchmarking at 295 K. The procedure is general and applies to any rare-earth-doped material given an absorbance spectrum and path length.
1. Introduction
Rare-earth-doped garnets are model solid-state systems in which localized 4f electrons are strongly shielded by filled 5s/5p orbitals and therefore couple only weakly to the lattice [1]. The resulting intra-configurational 4f–4f transitions are comparatively narrow and chemically robust; their energies and widths encode crystal-field symmetry, the magnitude of Stark splitting, and electron–phonon coupling. In nanocrystalline Er3+/Ho3+:Y3Ga5O12 (yttrium gallium garnet, YGG), the trivalent rare earths substitute on the low-symmetry dodecahedral site of the garnet host, producing manifold structures where Kramers ions (Er3+) display Stark doublets and non-Kramers ions (Ho3+) split into singlets [2,3]. These Stark-split manifolds are only partially resolved at room temperature (RT, 295 K), due to inhomogeneous broadening and phonon coupling, but nonetheless play a crucial role in understanding optical transitions and energy transfer processes in devices [4].
In garnets like Y3Ga5O12, the low-symmetry dodecahedral site and relatively rigid lattice set the scale of Stark splitting and electron–phonon coupling, shaping both the visibility and width of 4f–4f bands at 295 K [5,6]. This host-field environment underpins the pump-band contrast we quantify at 406/473 nm and explains why band crowding differs across visible manifolds [5]. In Er3+/Ho3+:Y3Ga5O12, trivalent rare earths occupy the dodecahedral (Y) site of the garnet host [7,8]. Derivative-aided inspection using the numerical second derivative of the ultraviolet–visible (UV–Vis) absorbance spectrum is a suitable approach to reveal substructure without over-decomposition at 295 K [9,10,11,12].
Y3Ga5O12 is a cubic garnet where trivalent rare earths substitute at a low-symmetry dodecahedral site [13,14]. In the blue/blue-violet range the host is essentially transparent [15], enabling efficient 4f–4f pumping with compact diode/DPSS (diode pumped solid state) sources. This combination of site symmetry and low background provides a favourable stage for channel-specific pumping at 406 nm (Er-addressing) and 473 nm (Ho-addressing).
From an applications standpoint, the blue–violet (about 406 nm) and blue (about 473 nm) pump bands are particularly valuable because these spectral bands coincide with compact diode-laser wavelengths [16] and address distinct manifolds of Er3+ and Ho3+, enabling selective pumping, energy-transfer pathways, and up-conversion schemes [17]. Visible-band excitation of Ho3+ is technologically relevant, with blue/green/red stimulated emission demonstrated in oxide and oxyfluoride hosts [18]. Because the garnet host is essentially transparent in this spectral range, these pump bands allow efficient excitation with minimal background absorption. In Er3+/Ho3+:Y3Ga5O12, the approximately 406 and 473 nm pump bands address distinct manifolds, enabling channel-specific pumping as shown by prior excitation and photoluminescence studies [19], with analogous wavelength-choice trade-offs documented in other mixed-ion systems (for example, Er/Yb at 940 versus 976 nm and Tm/Ho at 790–805 nm) [20,21,22].
For materials selection and device design, qualitative band assignments are not sufficient: one requires absolute absorption metrics—the absorption coefficient α(λ) and the effective per-active-ion cross section , with λ the wavelength—along with conservative line-shape descriptors (peak energies and full width at half maximum (FWHM)). These quantities feed directly into rate-equation models and pump-threshold estimates, enable host-to-host benchmarking at fixed dopant density, and constrain energy-transfer efficiencies when combined with emission spectra. Reporting α(λ) and with propagated uncertainties and explicit 1/L rescaling ensures transferability across geometries and datasets. Accordingly, this study emphasizes absolute scaling of the absorption spectrum, a measured optical path, and derivative-aided inspection to inform line-shape analysis, including structure-aware descriptors—defined here as metrics responsive to component spacing and local curvature in the pump band—derived from numerical derivatives (component count Nc, mean spacing , curvature-weighted prominence K, and detuning measure Δ). To the best of our knowledge, this is the first time the 406/473 nm bands of Er3+/Ho3+:Y3Ga5O12 are placed on such an absolute, uncertainty-propagated footing at 295 K, bridging laboratory-grade metrology and device-level design inputs.
Co-doping Er3+/Ho3+ is also pursued for wide-range optical thermometry, where channel-specific pumping helps decouple pathways. While thermometry is not the focus of this study, we make explicit what is added relative to prior practice: a traceable, device-oriented basis at 295 K for the 406/473 nm bands, with absolute α(λ) and and the above noted structure-aware descriptors, so that pump choice and detuning tolerance are specified rather than assumed.
1.1. Physical and Mathematical Framework
In transmission geometry, the decadic absorbance and transmittance are related by
where and denote the transmitted and incident intensities, respectively. Using a measured optical path L, the absorption coefficient is
Dividing by the active-ion number density N yields the species-specific per-ion cross section :
When multiple species contribute within an unresolved band, we report the per-active-ion cross section referenced to the total active-ion density :
As distributes α(λ) over all active ions, provides a lower bound to the species-specific cross section when one ion dominates; if the dominant species has fraction xs = Ns/Ntot, then σs ≈ /xs.
For isolated lines in frequency ν, the integrated cross section relates to the oscillator strength f via
where is the refractive index, the electron charge, the electron mass, the speed of light, and an appropriate local-field factor. In this study, we use directly (independent of ); only conversions to local-field-corrected quantities (for example, absolute oscillator strengths) require a dispersion model and a specific local-field choice.
The same absorption data enter the dipole–dipole (Förster) spectral-overlap [23,24],
where is the spectral-overlap integral quantifying the wavelength-dependent overlap between the normalized donor emission and the acceptor molar absorptivity ; is the dipole–dipole orientation factor and is the donor quantum yield and R0 is the Förster radius (the donor–acceptor separation at which the energy-transfer efficiency is 50%).
For completeness, when emission spectra and lifetimes are available at the same temperature, the McCumber relation links emission and absorption cross sections under quasi-thermal equilibrium. We do not apply it here (absorption-only, co-doped sample at 295 K), but we report absolute and per-ion in a form directly compatible with subsequent McCumber-based consistency checks [25].
1.2. Kramers Versus Non-Kramers Ions and Stark Multiplicities
Time-reversal symmetry enforces Kramers degeneracy in systems with an odd number of electrons: each crystal-field level is at least doubly degenerate (a Kramers doublet) at zero magnetic field. In trivalent lanthanides, this maps onto the 4f electron count: ions with odd 4fⁿ (half-integer J) are Kramers ions and each level remains a doublet; ions with even 4fⁿ (integer J) are non-Kramers and their levels can split fully into singlets [26]. In practice, the extent of this splitting depends not only on the ion type but also on the symmetry of the crystal field and the degree of inhomogeneous broadening.
A multiplet of total angular momentum J splits under the garnet’s low-symmetry dodecahedral field into (2J + 1)/2 doublets for Kramers ions and up to (2J + 1) singlets for non-Kramers ions. In the co-doped YGG considered here, Er3+ (4f11; half-integer J) is Kramers, whereas Ho3+ (4f10; integer J) is non-Kramers. At room temperature, however, the expected number of components is often only partially observed, because inhomogeneous broadening (nano-scale disorder) and homogeneous phonon coupling merge weaker features. Cooling typically sharpens the lines and increases the number of resolvable Stark components [27]. The derivative-aided view used below is intended to highlight hidden components without over-decomposition, providing guidance for line-shape interpretation at 295 K [11,12].
1.3. Selective Pumping in Mixed-Ion Rare-Earth Systems: Why Wavelength Choice Matters
In co-doped hosts, selective pumping is often required to partition excitation pathways and avoid cross-excitation: one chooses spectral ranges where the target ion’s absorption dominates while the partner’s is weak. This is possible because 4f–4f manifold envelopes differ in energy and strength for different ions and hosts; picking the right pump minimizes spectral overlap and stabilizes device behaviour (gain competition, thermal load, parasitic transfer).
1.4. Implications for This Study
This is the first report to provide absolute, uncertainty-propagated for Er3+/Ho3+:Y3Ga5O12 at 295 K under diode-accessible blue/blue-violet pumping, bridging laboratory-grade metrology and device-level design inputs.
The methodology below turns such qualitative “pick the right range” guidance into device-grade, absolute numbers at 295 K: we place the 406/473 nm bands on an absolute footing (α, per-active-ion , with propagated uncertainty and explicit 1/L rescaling) and quantify structure-aware usability via second-derivative descriptors: the component count Nc, the mean component spacing , the curvature-weighted prominence K, and the pump-band detuning Δ. We also introduce two aggregate indices: a dimensionless selectivity S, and a curvature-overlap figure of merit (FOM). For context, IR (infrared) Ho3+ bands can be an order of magnitude stronger than visible 4f–4f lines (for example, Ho:YGG σabs ≈ (2.6–3.7) × 10−21 cm2 near 1.9 µm), underscoring why absolute visible at 406/473 nm are needed for quantitative pump design rather than heuristic extrapolation from IR data [28].
1.5. Scope and Contributions
In this paper, we present a general methodology to obtain absolute pump-band metrics and structure-aware descriptors from room-temperature absorbance and reanalyze a published, room-temperature UV–Vis absorbance spectrum of nanocrystalline Er3+/Ho3+:Y3Ga5O12 as a case study (the raw absorbance for this material was reported previously in Ref. [19]), applying a physically transparent pipeline—light median plus mean smoothing, rolling fifth-percentile baseline correction, derivative-aided feature detection, and bounded Gaussian fitting—to extract (i) absolute absorption metrics α(λ) and per-active-ion referenced to a measured pellet thickness of L = 0.22 ± 0.03 mm, with propagated uncertainty (about 15% dominated by δL/L) and explicit 1/L rescaling; (ii) a conservative catalogue of peak centres and FWHM across the visible 4f–4f manifolds; and (iii) quantitative derivative-based line-shape descriptors in the pump bands—Nc, , K, and Δ—along with two aggregate metrics: S and FOM (see Section 2.2 below for defining fprmulas). All α and values are reported per total active-ion density Ntot. Operationally, within the analysis settings in Section 2.2 and at 295 K, a higher FOM in the data used here is consistent with greater tolerance to small diode detuning at a fixed optical path and is intended only as a practical indicator for pump stability and path-length sizing.
We treat the technologically relevant pump channels at 406 nm (Er-selective) and 473 nm (Ho-selective), which coincide with widely available diode and DPSS laser lines, while the Y3Ga5O12 host remains essentially transparent in this spectral range. Because the spectrum is co-doped (composite) and the lines are broadened at 295 K, the second derivative is used to reveal subcomponents without over-decomposition rather than to assign ions unambiguously. Ion-selective excitation at 406/473 nm has been demonstrated independently [19]. The study is quantitative and transferable in scope: we report uncertainty-annotated pump-band cross sections and derivative-based descriptors at 295 K, with explicit 1/L rescaling and a reproducible processing workflow, aimed at informing pump-scheme design, detuning-tolerance appraisal, and host-to-host benchmarking. Low-temperature or singly doped follow-ups can refine Stark assignments without altering the pump-relevant descriptors established here. The methodology is general; Er/Ho:YGG is used as a case study. Unlike the FIR (fluorescence intensity ratio) thermometry focus in Ref. [19], the current study provides absolute pump-band metrics and derivative-based descriptors to support device-level modelling at 295 K.
2. Data, Method and Definitions
2.1. Samples and Prior Characterization
Structural and microstructural verification follow Ref. [19] (Soler et al., 2020) for the same nanocrystalline Y3Ga5O12 specimen co-doped with Er3+/Ho3+; no additional structural work was repeated here because the present contribution is an absolute scaling and line-shape analysis of the visible-band absorption recorded on that specimen. Er3+/Ho3+ co-doped Y3Ga5O12 (nominal Y2.8Er0.1Ho0.1Ga5O12) was prepared by a citrate sol–gel route and heat-treated as in Ref. [19]. We analyzed the room-temperature UV–Vis absorbance dataset acquired in that earlier study with the same specimen in straight-through transmission; its optical path length was mm and is adopted here for absolute scaling (consistent with the thickness range typically used for transmission measurements on garnet ceramics [29]; see Section 2.4). Details of reagents, thermal schedules, and phase/microstructure verification follow that previous work. No additional structural characterization was performed in the present study, as our analysis reprocesses the published transmission spectrum from the same specimen. Beyond absolute absorption (α, σ), we also quantified line-shape structure near the 406 and 473 nm pump bands using the second derivative of the absorbance. We reported component count, mean spacing, curvature-weighted prominence, and laser detuning, and we summarized structure versus absolute response through a dimensionless selectivity index and a curvature-overlap figure of merit. Formal definitions are given in Section 2.2 and used in Section 3 and Section 4.
The UV–Vis absorbance dataset analyzed here is the same as the one reported in Ref. [19] (see Section 3.2, Figure 2 in Ref. [19]). No new absorption measurements were performed. We re-processed that published dataset to obtain absolute α(λ) and per-active-ion , adopting the same specimen and optical path length L as in Ref. [19]. Full experimental details (instrument model, double-beam configuration and spectral-response correction) can be found [19] (Section 3.2).
2.2. Derivative-Based Spectral Descriptors
- Band choice and robustness
The 15 nm spread was chosen to encompass room-temperature Stark substructure and typical diode linewidth plus drift. Sensitivity tests with the spread of 10/20 nm change S by less than 0.03 and FOM by less than 5%; a parallel 25 nm spread test yields ΔS < 0.05 and ΔFOM < 8%, consistent with the stated robustness (Figure S1 in Supplementary Materials), which also includes the 25 nm spread case). Here, “structure-aware” denotes descriptors that respond to local curvature (K) and intra-band component spacing around the pump, quantifying subcomponent contrast and crowding. FOM combines this structure term with the absolute , where denotes the pump wavelength at the window center, to reflect both absorption magnitude and tolerance to detuning or drift. A single global prominence threshold—set from the spectrum-wide noise floor—was applied to both bands; 20% spread adjustments did not alter the qualitative rankings of Nc, K, or Figure S1 demonstrates that the derivative-based descriptors remain stable across 10–25 nm spread analysis (ΔS < 0.05, ΔFOM < 8%), confirming that the chosen 15 nm spread provides a robust, parameter-insensitive basis for the structure-aware metrics used throughout.
- Interpretation
FOM () combines absolute response and local structure density; larger increases absorption per pass, while larger K and wider indicate stronger curvature-weighted contrast and lower congestion near . Comparable FOM values across the bands reflect a trade-off between magnitude and structure-based robustness.
- Operational definition
Let A(λ) be the baseline-corrected absorbance and D2(λ) = d2A/dλ2 its numerical second derivative (central differences after light median plus mean smoothing; identical parameters for all analyses) [30]. For each pump band Wλ (15 nm spread around 406 or 473 nm bands), local maxima of −D2 above a fixed prominence threshold are taken as candidate subcomponent centres {λi} (sorted ascending). Zero crossings of −D2 delimit widths.
Component set and spacing are defined as
respectively.
Curvature-weighted prominence is defined as
with the local width estimated from the nearest zero crossings of −D2, increases with the number and sharpness of resolvable subcomponents (arbitrary units; same thresholding for both bands).
Pump detuning is defined as
Selectivity index (dimensionless) is defined as
so that larger S favours the 406 nm band; (1 − S) favours 473 nm band.
Curvature-overlap FOM which links structure to absolute response is defined as
Here is reported per total active-ion density, and is the corresponding 15 nm spread. FOM scales as 1/L via σeff, whereas S is L-invariant.
For reproducibility, the same smoothing, prominence threshold and 15 nm half-width spread is applied to both bands; derivatives use the baseline-corrected A(λ). We report on Nc, , Δ, K, S, and FOM. Uncertainties in propagate into FOM. S is dominated by relative uncertainty in K406 and K473.
2.3. UV–Vis Spectrum and Pre-Processing
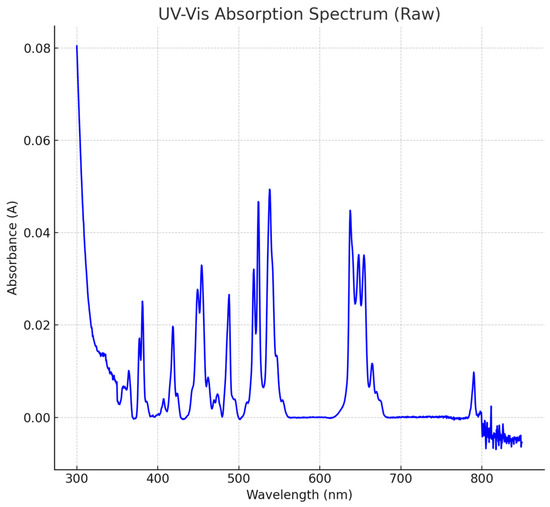
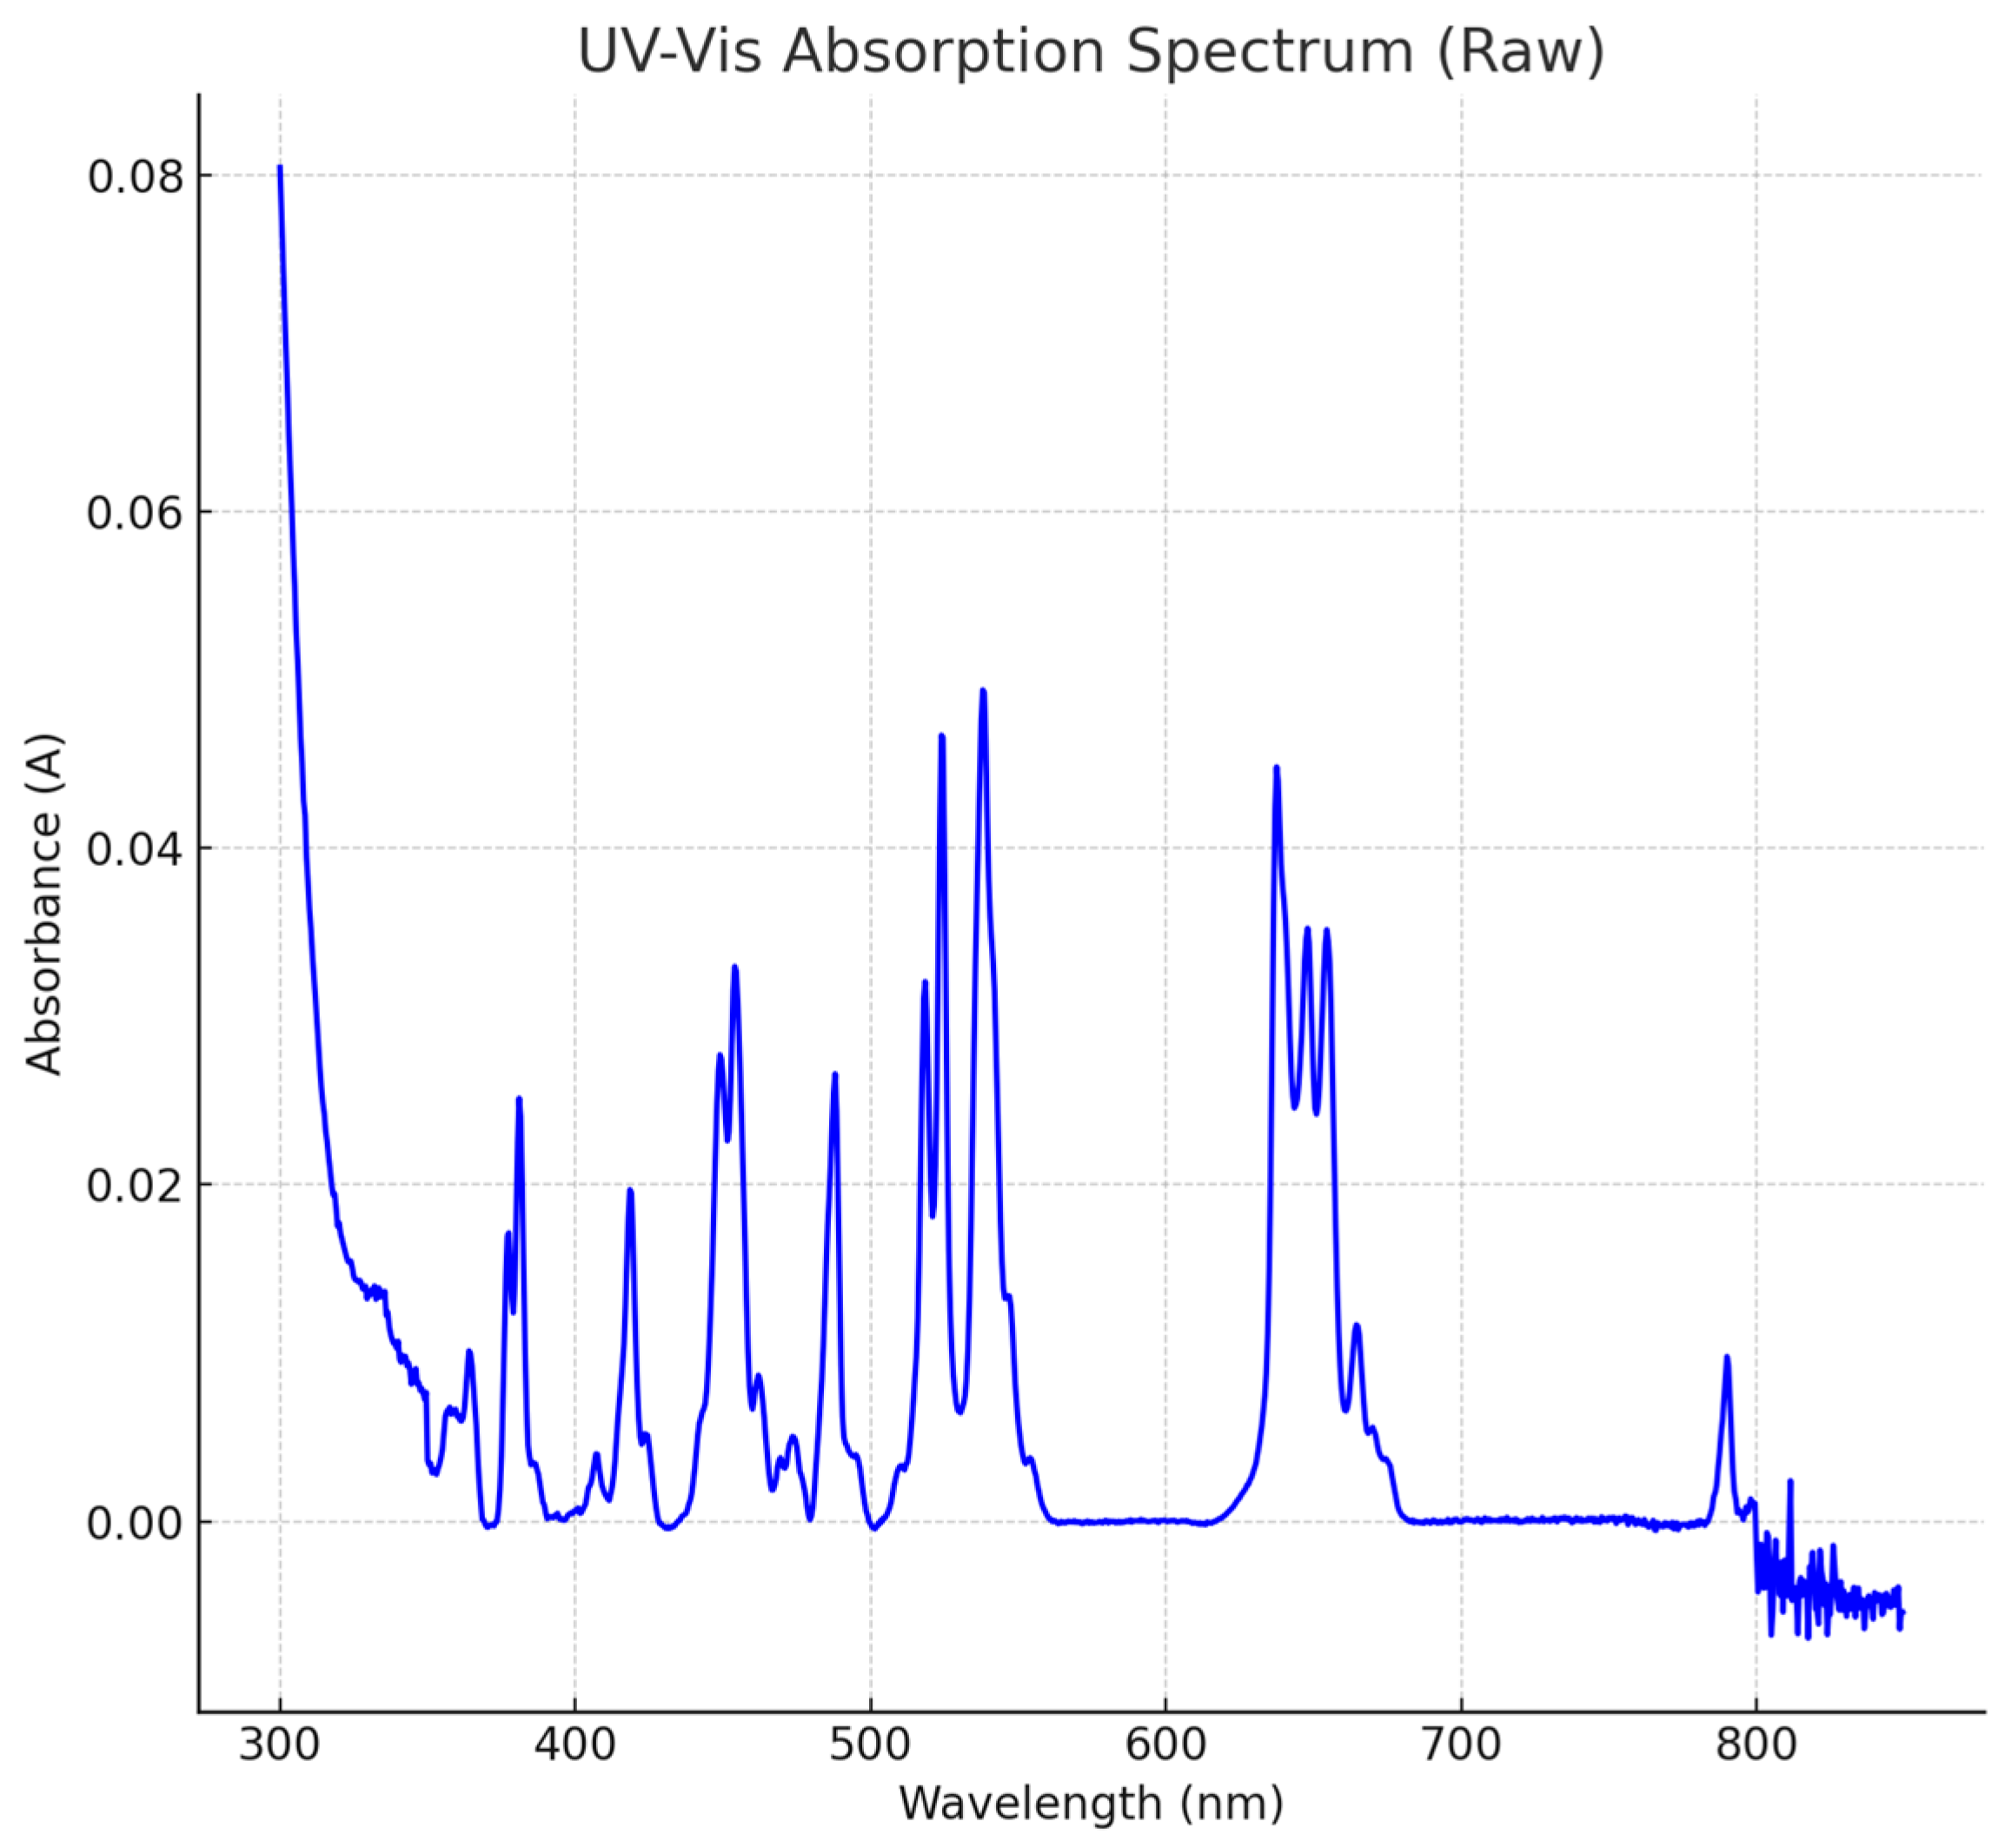
We reprocessed the UV–Vis absorbance dataset of Ref. [19] to obtain absolute α(λ) and per-active-ion and to extract derivative-based line-shape descriptors, adopting the same specimen and optical path length L = 0.22 ± 0.03 mm as in Ref. [19]. Full instrumental and acquisition details are given in Ref. [19]. We analyze that published room-temperature absorbance spectrum (about 350–700 nm) as the input to the processing pipeline used here. Figure 1 shows the raw absorbance used as the starting dataset; rescaling details are provided in Section 2.4.
Figure 1.
Raw room-temperature absorbance A(λ) of nanocrystalline Er3+/Ho3+:Y3Ga5O12. No baseline correction or smoothing has been applied.
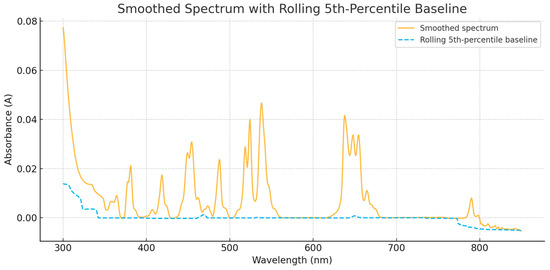
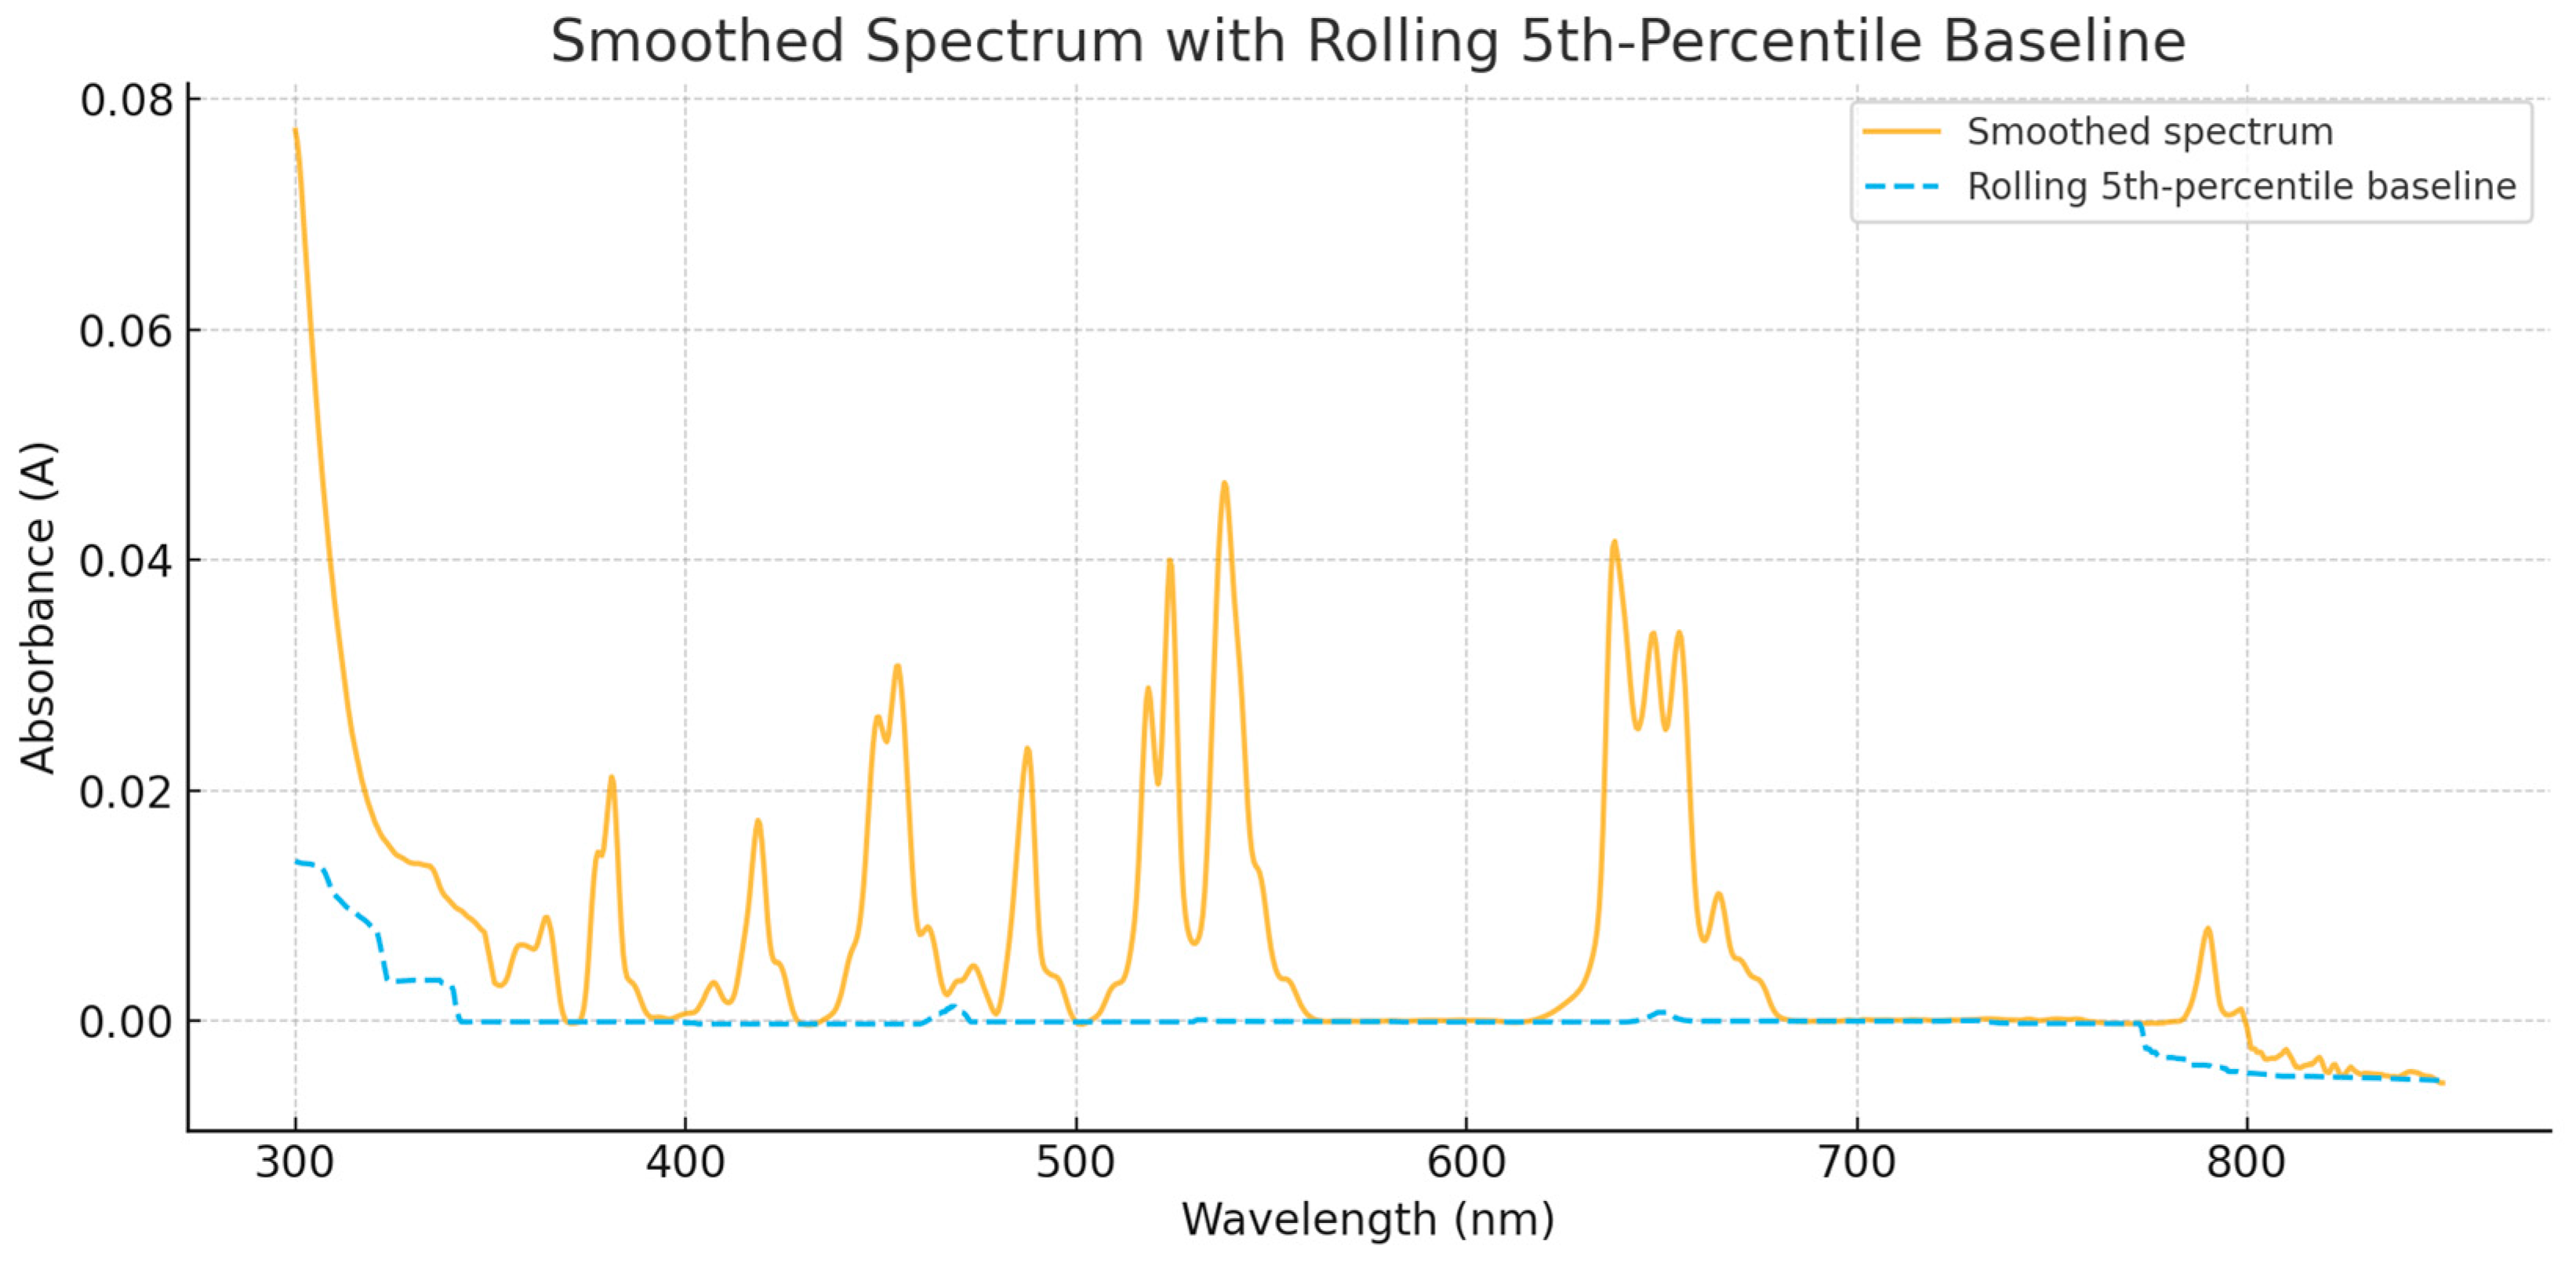
The slowly varying diffuse-scattering background was removed by subtracting a rolling fifth-percentile baseline. To stabilize numerical derivatives while avoiding artificial line narrowing, we applied two light smoothing steps in sequence: a short-band median (to suppress impulsive spikes) followed by a short moving average (to reduce residual high-frequency noise). Band lengths were intentionally kept minimal. The resulting working spectrum is the baseline-corrected, somewhat smoothed ; Figure 2 shows the smoothed trace together with the rolling baseline, whose difference defines the working spectrum. A raw-versus-working overlay (Figure S2) shows no resolvable shifts in peak centres and no measurable change in FWHM at the plotting resolution here.
Figure 2.
Somewhat smoothed absorbance (solid yellow curve) along with the rolling 5th-percentile baseline (dashed blue line). Subtracting this baseline defines the working (baseline-corrected) spectrum, which underpins the absolute and reported using mm from Ref. [19].
For line-shape analysis, derivative-aided peak finding and bounded Gaussian fits were used (see Section 2.2), yielding conservative peak centres and FWHM across the visible 4f–4f manifolds. Although and at the pump wavelengths can be obtained directly from the raw absorbance, smoothing and baseline correction were applied to (i) suppress high-frequency noise for reliable derivative analysis, (ii) enforce a physically meaningful zero-absorption reference, and (iii) ensure reproducible peak positions and widths.
- Robustness and quantitative choices
Replacing the rolling baseline with a spline baseline yields at 406/473 nm within the stated ~15% uncertainty (dominated by the thickness term ), indicating that conclusions are insensitive to the baseline model. For quantitative extraction at 406/473 nm, we used a 15 nm analysis spread, which balances local signal-to-noise and line-shape fidelity while avoiding neighbouring manifolds; using 10–20 nm spread gives indistinguishable peak centres within plotting resolution (Figure S2 (Supplementary Material)). At normal incidence no Fabry–Pérot fringes are resolved; any residual slowly varying contributions are captured by the rolling baseline, and Fresnel-related corrections are expected at the few-percent level, i.e., within the stated uncertainty. Index-dispersion effects may somewhat perturb absolute , but remain small compared with the stated uncertainty and do not affect relative peak positions or widths.
2.4. Absolute Quantities, Measured Path, and Rescaling
- Thickness metrology
The optical path length used here is that of the same specimen whose UV–Vis spectrum was reported in Ref. [19]: mm. We adopt the same value and uncertainty for the present reprocessing; the fractional thickness term dominates the overall error budget.
- Absolute scaling
Absolute coefficients follow from Equation (2) and the effective per-active-ion cross section from Equation (4), with Ntot the total (Er3+ + Ho3+) number density from stoichiometry (Table 1). All reported absolute values refer to the considered path length; for other geometries, quantities rescale linearly with :
Table 1.
Constants used for absolute scaling (stoichiometry, density, measured L). See text more for details.
- Uncertainty propagation
Relative uncertainties were propagated in quadrature:
In the case under study, δL/L ≈ 0.14 dominates, leading to about 15% overall relative uncertainty in α and σ; this uncertainty is reported throughout (see Tables 1–4).
3. Results
3.1. Spectrum Overview at 295 K
The room-temperature absorbance A(λ) of the co-doped Er3+/Ho3+:Y3Ga5O12 sample spans about 350–700 nm (see Figure 1 for the raw spectrum and Figure 2 for the smoothed spectrum t along with the rolling baseline used for subtraction). The working dataset for all quantitative analysis is the baseline-corrected, somewhat smoothed absorbance spectrum (Section 2.3), which preserves weak 4f–4f features while suppressing high-frequency noise and low-frequency background. An overlay (Figure S2) shows no resolvable peak shift or measurable narrowing at the plotting resolution.
3.2. Pump-Band Absorption Metrics (Absolute)
The 15 nm spread choice is robust: varying within 10/20 nm spread keeps within 0.03 and FOM within 5%; an additional 25 nm spread test gives and FOM < 8% (Figure S1).
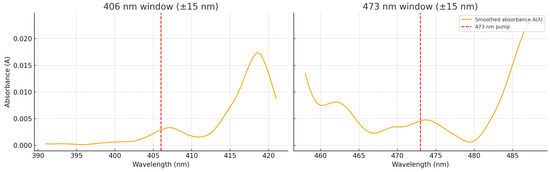
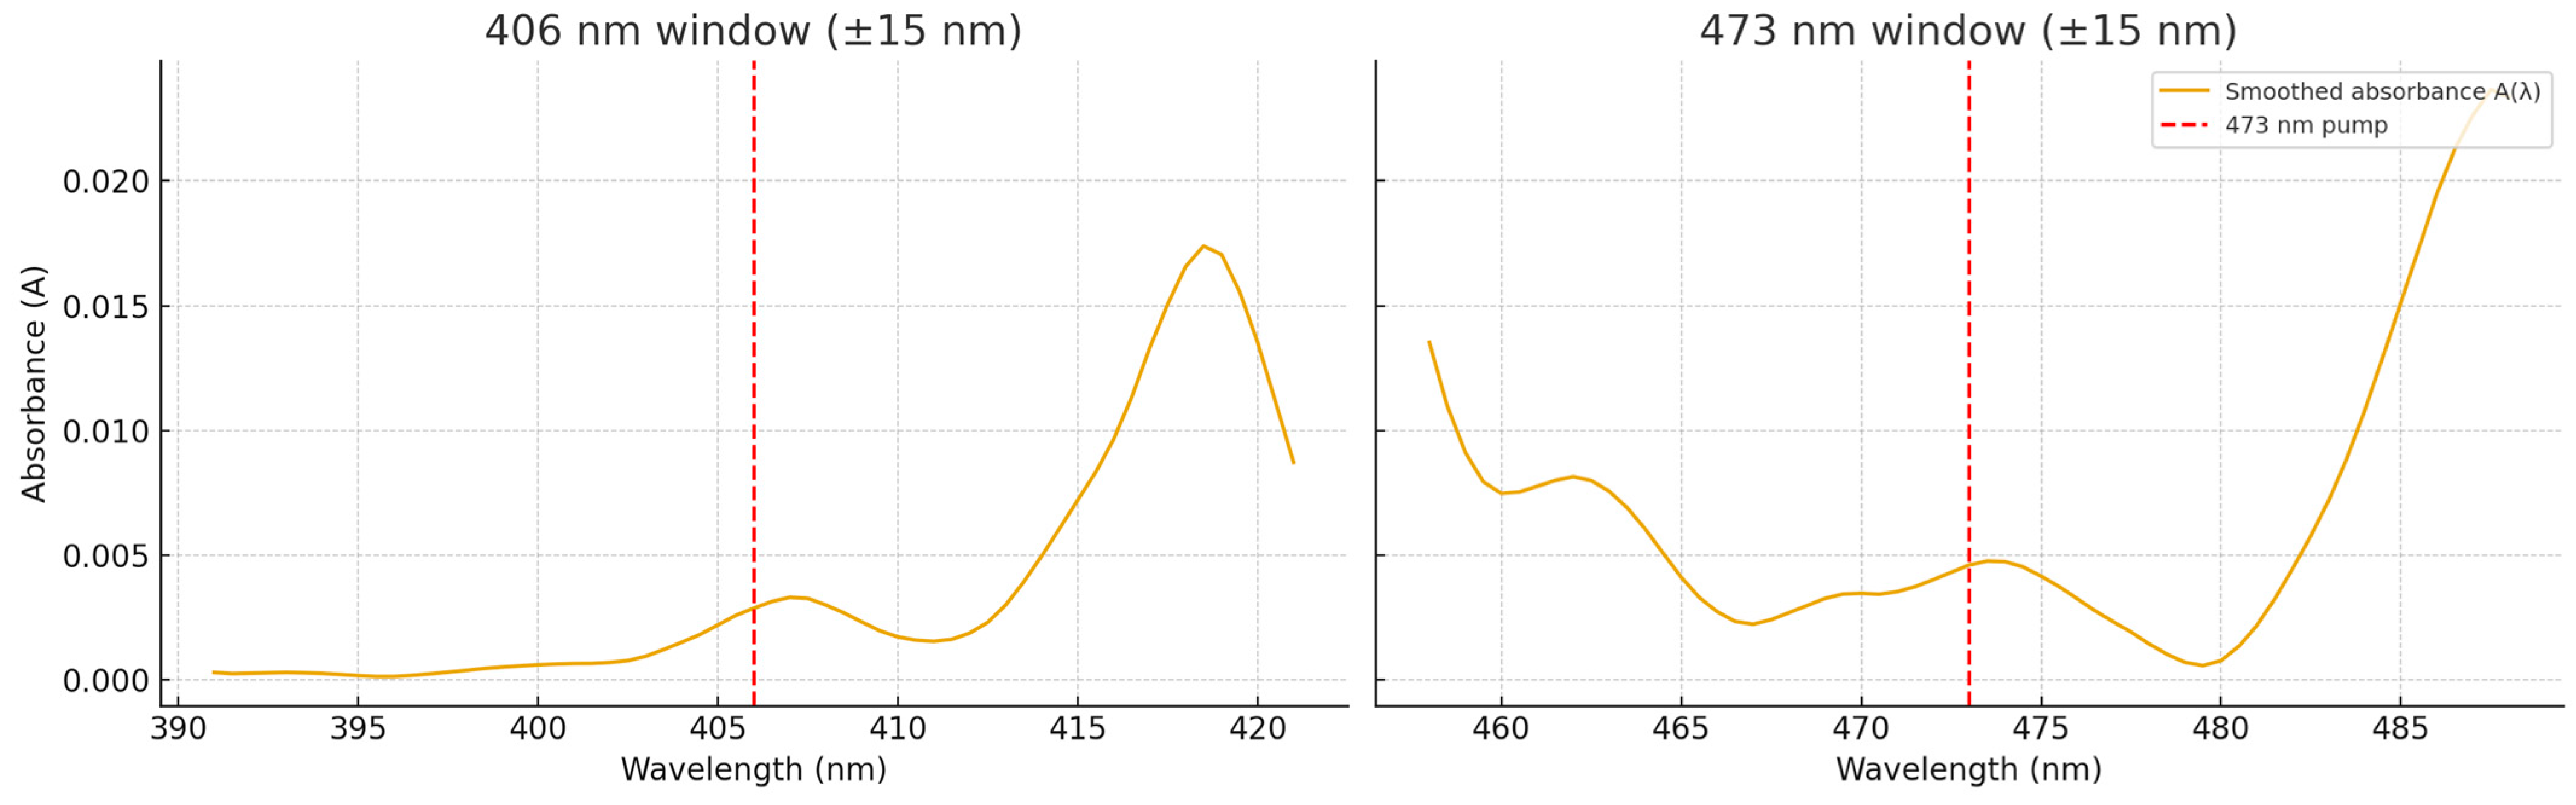
Absolute coefficients at the technologically relevant pumps follow from Equations (2)–(4) using the measured optical path L = 0.22 ± 0.03 mm. At 406 nm (approximately 3.054 eV) the smoothed absorbance is A = 0.00299, yielding α = 0.313 ± 0.047 cm−1 and = (3.62 ± 0.54) × 10−22 cm2; at 473 nm (approximately 2.622 eV) A = 0.00451, giving α = 0.472 ± 0.071 cm−1 and σeff = (5.46 ± 0.82) × 10−22 cm2. Uncertainties (about 15%) are dominated by δL/L ≈ 0.14 and propagate according to Section 2.4. Values for other geometries rescale with 1/L (see Equation (12)). Figure 3 shows absorbance zooms (within 15 nm spread) around each pump. The raw view resolves only the broad envelopes; the unresolved substructure motivates the derivative analysis below. Table 2 summarizes the metrics concisely. Sensitivity tests with 10, 20, and 25 nm spread leave the qualitative rankings of and FOM unchanged (Figure S1). The retrieved visible-band values (a few of 10−22 cm2) are consistent with 4f–4f transitions in garnet hosts at 295 K, i.e., in the expected weak-line regime.
Figure 3.
Smoothed absorbance in 15 nm spread around the pump wavelengths for (left) 406 nm and (right) 473 nm. The raw spectra resolve only the broad envelopes, whereas the somewhat smoothed working spectrum (solid gold curve) makes the local substructure more evident. Vertical dashed red line marks the nominal pump wavelengths. For comparison between raw and working spectra, see Figure S2 (Supplementary Materials).
Table 2.
Pump-band absorption metrics at 406 and 473 nm bands. See text for details.
3.3. Peak Catalogue Across 350–700 nm
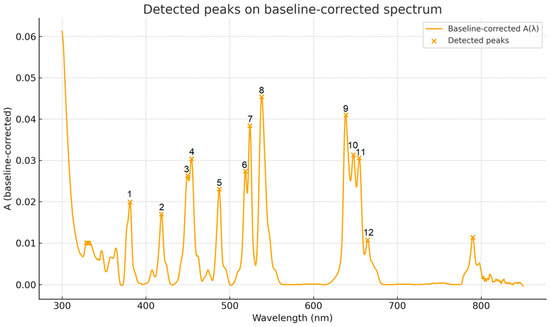
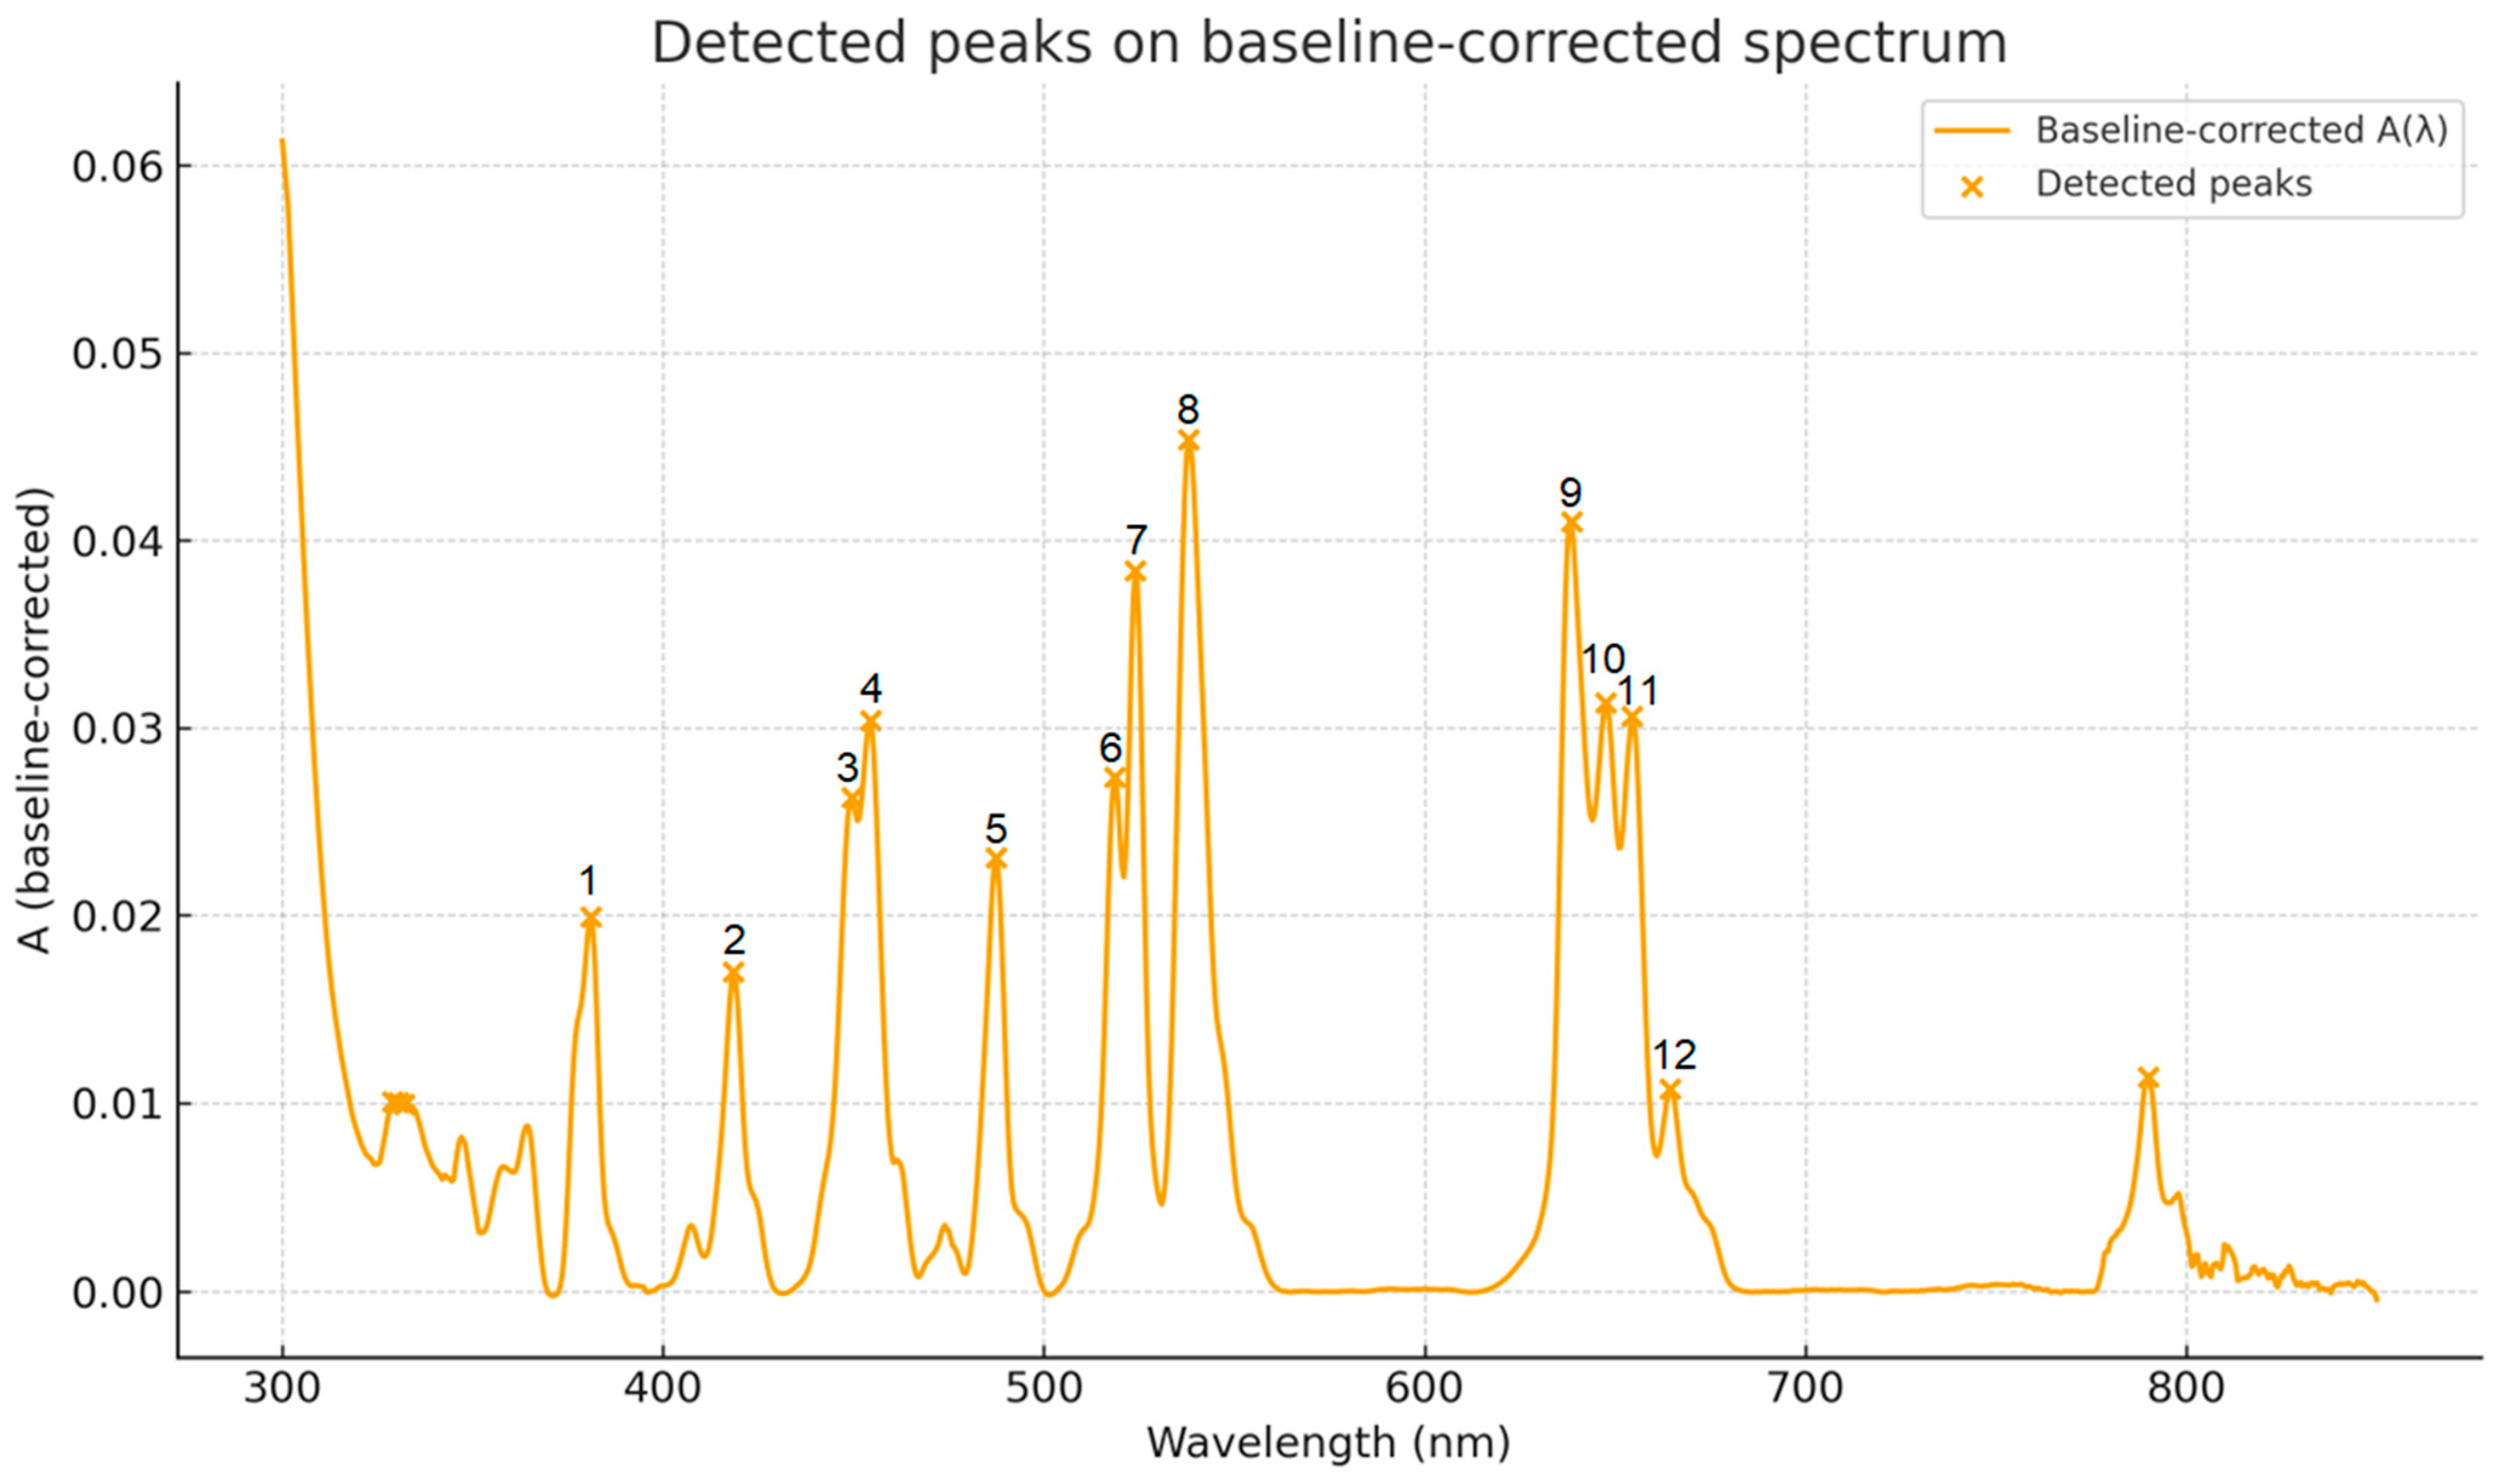
Local maxima on the baseline-corrected spectrum were identified using the detection procedure described in Section 2.2, and those maxima were used as robust seeds for the bounded multi-Gaussian fits. We adopt a fixed prominence threshold to avoid over-decomposition at 295 K. Figure 4 overlays the detected maxima on the working spectrum; the top twelve peaks (centers and estimated FWHM) are listed in Table 3. Because the spectrum originates from a co-doped sample and the lines are broadened at room temperature, assignments remain conservative; the catalogue is intended as a reproducible baseline for later refinement (for example, at low temperature).
Figure 4.
Working absorbance spectrum, A(λ) (baseline-corrected, somewhat smoothed) at 295 K with detected local maxima. The twelve most prominent peaks within 350–700 nm (marked 1 to 12) are indicated and listed in Table 3 along with their centres and full widths at half maximum.
Table 3.
Peak catalogue (top twelve maxima between 350 and 700 nm) extracted from the working spectrum (baseline-corrected, somewhat smoothed) from Figure 4. The full widths at half maximum (FWHMs) estimated from bounded Gaussian fits. A single, conservative global prominence threshold—common to both pump bands—was used; varying the threshold by 20% did not change the qualitative rankings (see Section 2.2).
3.4. Second-Derivative Analysis and Quantitative Descriptors
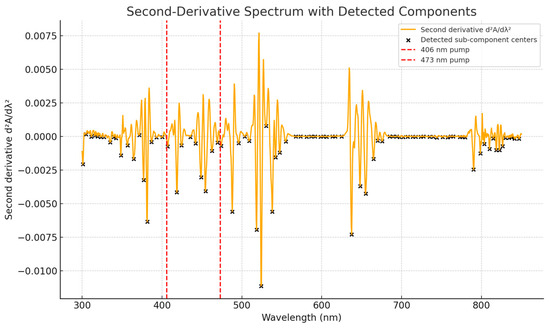
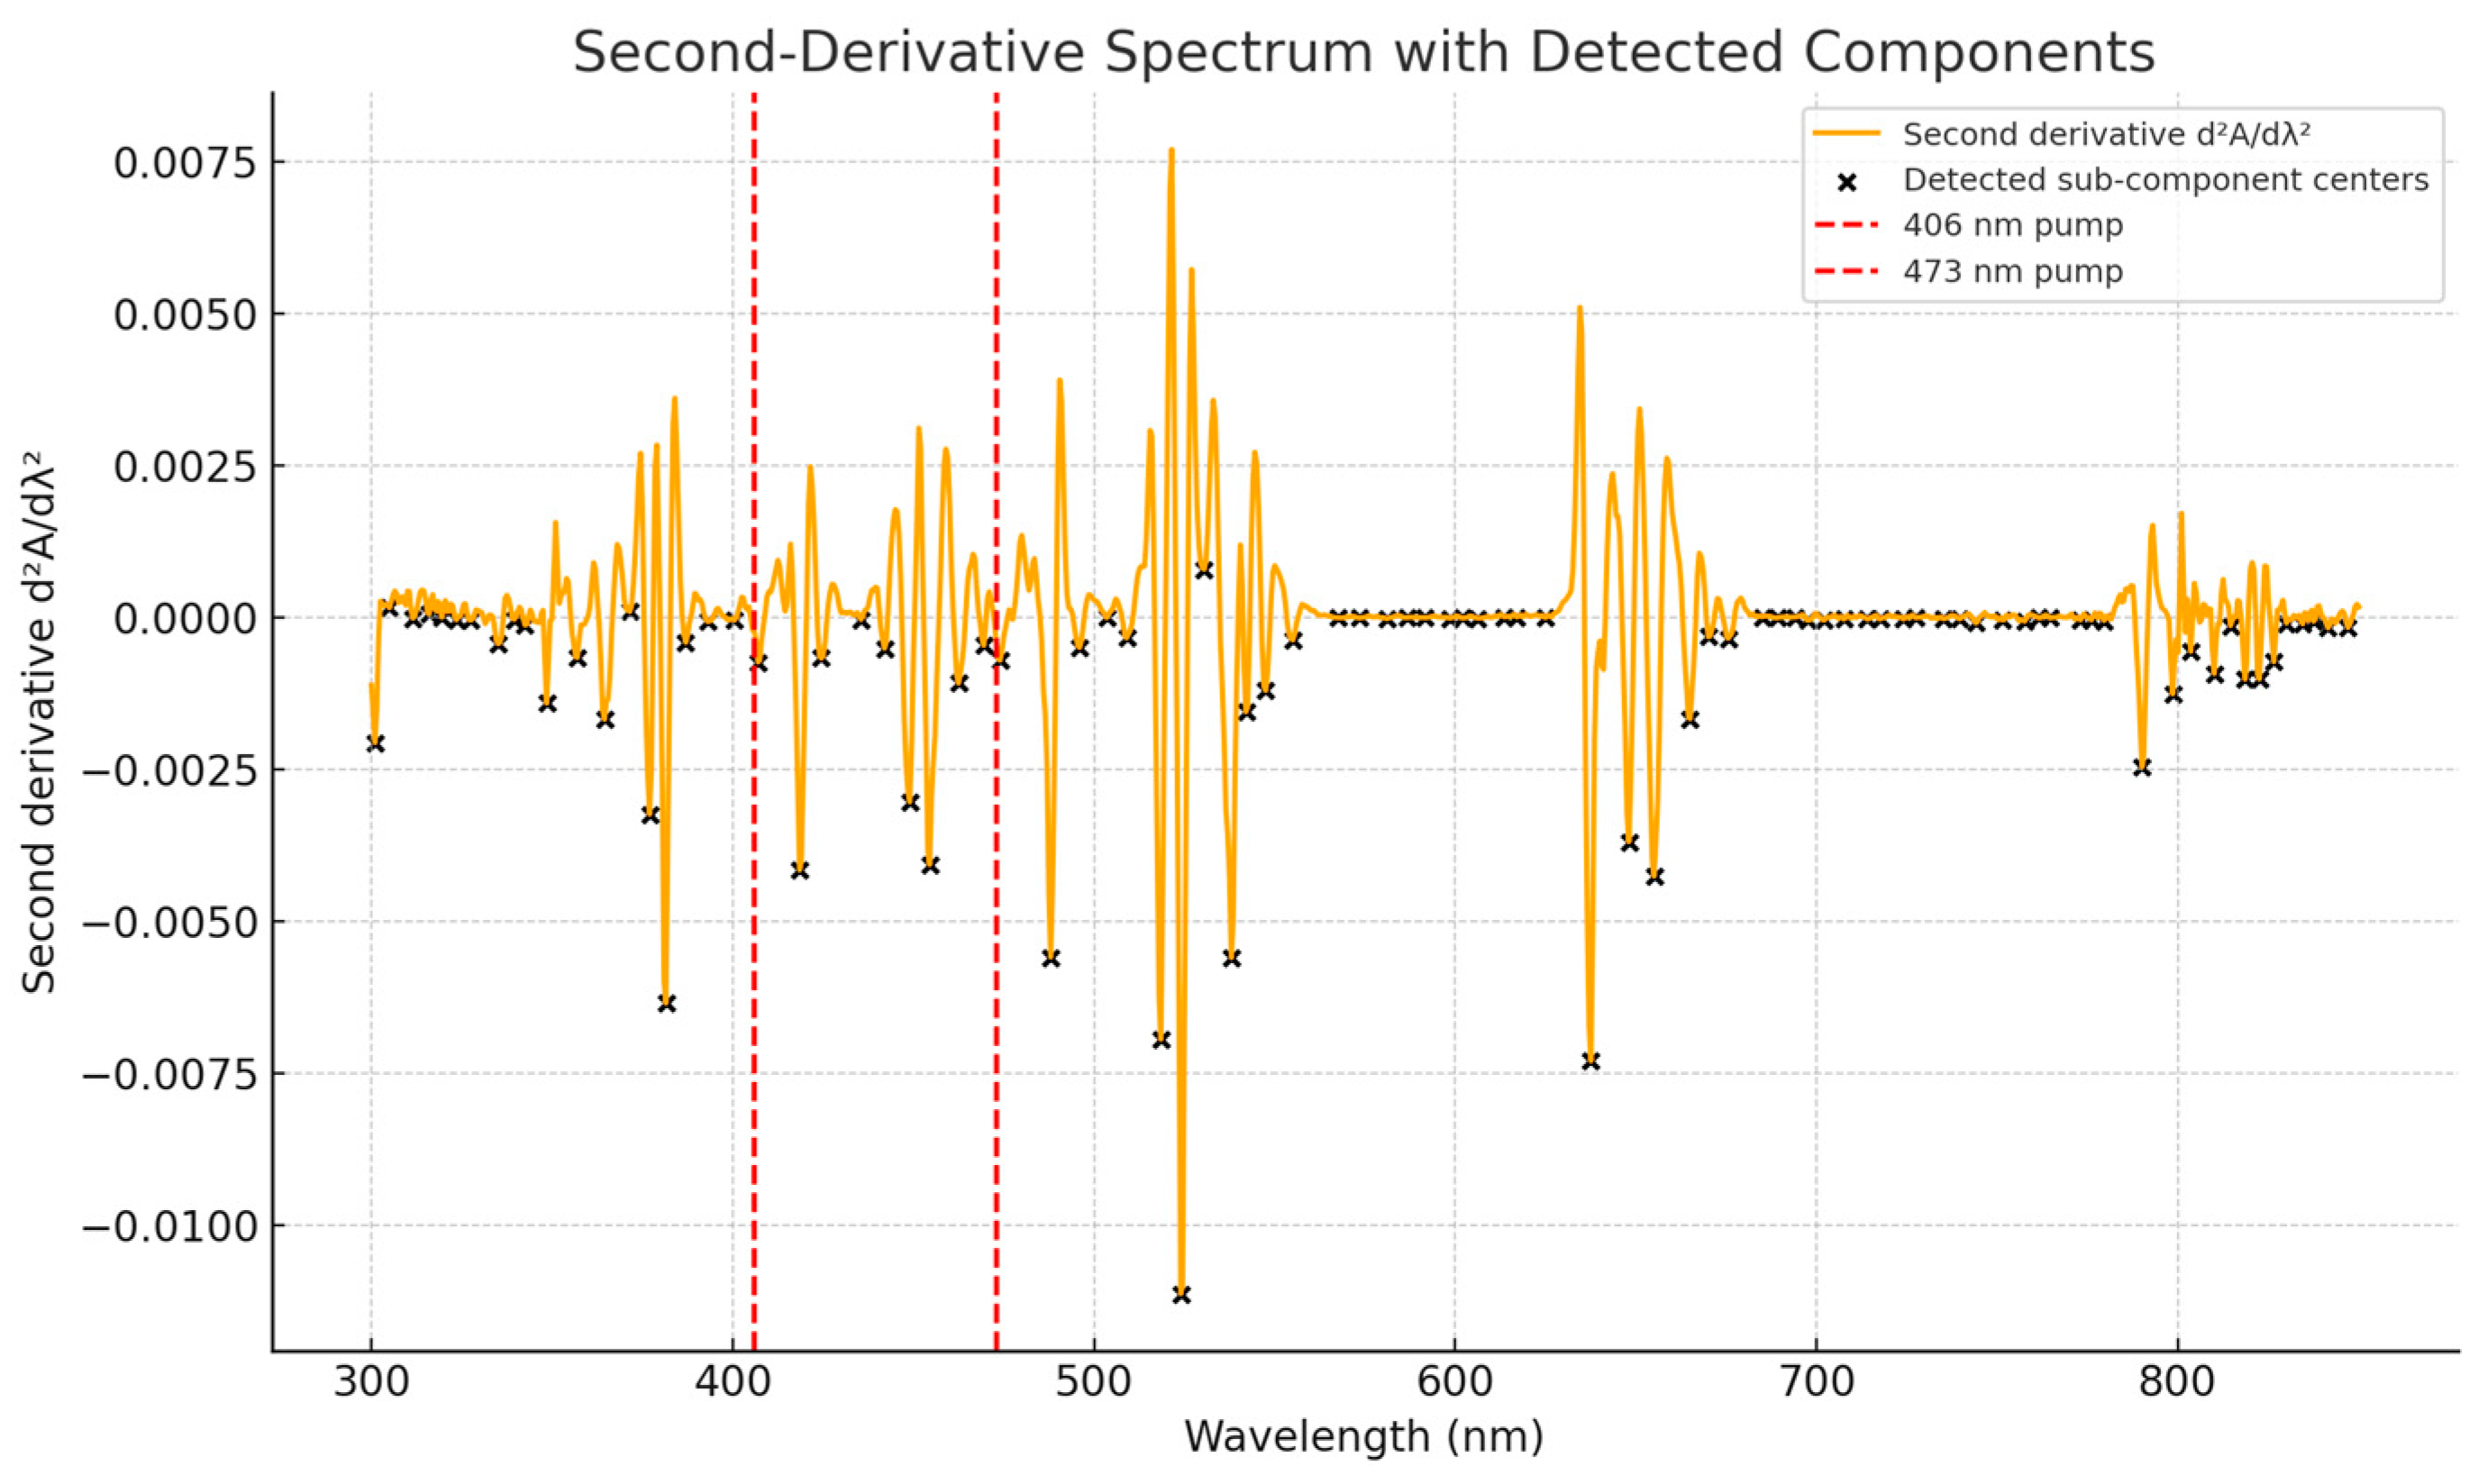
The global second derivative D2(λ) = d2A/dλ2 (Figure 5) enhances substructure that is otherwise unresolved at 295 K due to inhomogeneous broadening, consistent with Stark splitting. To connect line shape to pump performance, we use the derivative-based descriptors defined in Section 2.2: (see Equation (7)), (7), (8), (9), (10) and FOM (11). All derivatives and peak finding operate on the working spectrum (baseline-corrected, somewhat smoothed ; Section 2.3).
Figure 5.
Second-derivative spectrum D2 over about 350–700 nm at 295 K. The crosses indicate detected subcomponent centres (local maxima of −D2.); vertical red dashed lines denote the pump wavelengths (406 and 473 nm). The derivative emphasizes substructure consistent with Stark splitting while the raw absorbance remains envelope-dominated at room temperature. Computed on the baseline-corrected, somewhat smoothed working spectrum (Section 2.3); smoothing stabilizes without shifting peak centres or changing FWHM (Figure S2).
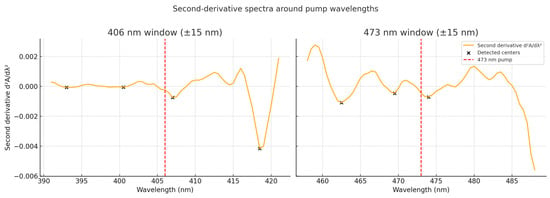
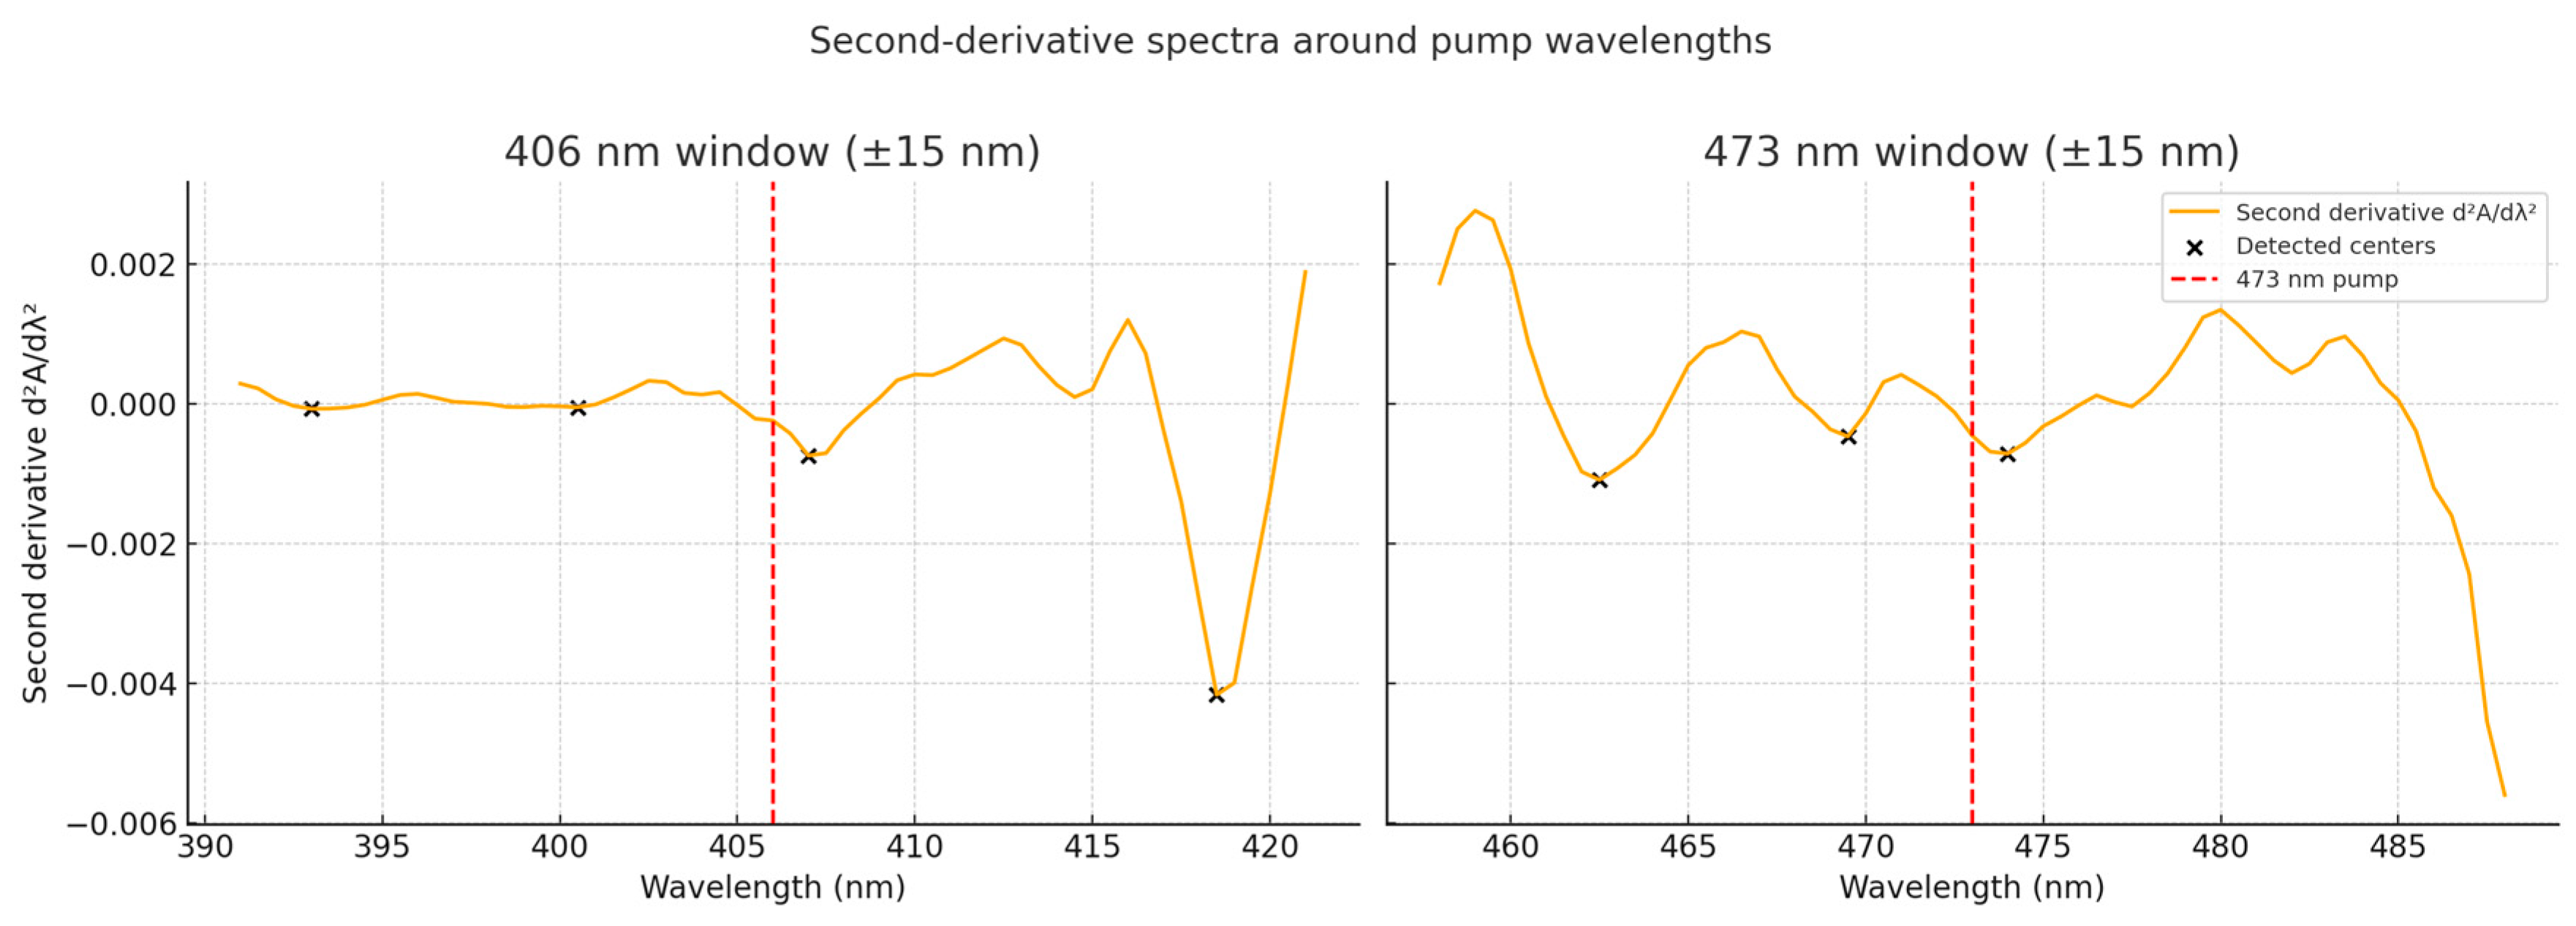
Figure 6 shows the 15 nm spread around each pump with the detected subcomponent centres (local maxima of −D2. The corresponding descriptors are summarized in Table 4. For the dataset considered, near 406 nm and near 473 nm; nm (for 406 nm) and about 5.8 nm (for 473 nm); and nm for both bands. Curvature weights give and (arbitr.), hence , indicating denser/sharper structure near 406 nm. Combining with the absolute cross sections yields and , i.e., comparable “structure times absorption” merits at 295 K despite . Absolute magnitudes rescale with via (Section 2.4); is -invariant. Robustness of the 15 nm spread (10/20/25 nm spread tests) is documented in Figure S1.
Figure 6.
Second-derivative spectrum D2 in 15 nm spread around the pump wavelengths (406 nm and 473 nm). The crosses indicate the maxima of −D2 (detected subcomponent centres); vertical red dashed lines indicate the nominal pump wavelengths. The spread underpins the quantitative descriptors listed in Table 4.
Table 4.
Derivative-based descriptors in the pump band spread of 15 nm (see Figure 6).
Ion-specific selectivity (about 406 nm predominantly addressing Er3+ manifolds and about 473 nm predominantly addressing Ho3+) follows from independent excitation studies reported earlier [19]; the present absorption analysis constrains the spectral structure that underpins that behaviour.
3.5. Uncertainty and Sensitivity
All and values include the propagated effects of instrumental absorbance noise (below 3%) and path-length uncertainty (), giving an overall about 15% relative uncertainty dominated by the thickness term inherited from Ref. [19]. Derivative-based descriptors were computed using identical smoothing parameters, prominence thresholds, and 15 nm spread for both pumps. The selectivity index is -invariant, whereas the figure of merit FOM scales linearly with through its dependence on .
4. Discussion
Since the present analysis uses linear ground-state absorption, inter-ionic energy transfer (for example., Er → Ho) does not alter the extracted or . Processes such as excited-state absorption or cross-relaxation require excitation/emission data and are outside the scope of the present study.
The per-active-ion cross sections retrieved at 406 and 473 nm bands fall in the 10−22 cm2 range, as expected for visible 4f–4f transitions (parity-forbidden, crystal-field-allowed), and are one–two orders below the strongest Er3+ near-infrared bands (about 980/1530 nm) [31,32]. Single-ion Ho:YGG values near 1.9 μm (approximately 10−21 cm2) likewise illustrate that IR 4f–4f lines can exceed their visible counterparts [22]. What was missing for this co-doped host is supplied here: absolute, uncertainty-annotated α and at 406/473 nm with explicit 1/L rescaling (Table 2), referenced to a measured path length [19]. These quantities provide the ground-state inputs for rate-equation modelling and enable quantitative comparison across geometries.
4.1. Single-Pass Implications
A first practical implication follows from the single-pass absorption at the measured thickness. With α = 0.313 cm−1 (406 nm) and 0.472 cm−1 (473 nm), a specimen of absorbs only and about per pass, respectively; the corresponding lengths are approximately 3.2 cm (406 nm) and 2.1 cm (473 nm). Thus, short-path devices must rely on multi-pass or cavity coupling to achieve meaningful pump absorption at 295 K. Conversely, to reach about 10% single-pass absorption at 406 nm and at 473 nm are needed.
Due to , increasing active-ion density raises absorption linearly until concentration-dependent broadening or energy transfer offsets the gain, a design trade-off that remains transparent when reporting per-ion quantities. For visible-band absorption in related garnets, reported per-ion cross sections are typically 10−22–10−21 cm2 at room temperature, consistent with parity-forbidden, crystal-field-allowed 4f–4f transitions; the obtained values at 406/473 nm lie within that range.
4.2. Channel-Specific Implications at 406 nm (Er) and 473 nm (Ho)
In practice, pump deployment is ion-directed: one about 406 nm addresses Er3+ manifolds, whereas that about 473 nm addresses Ho3+ [19]. The ranged second-derivative analysis therefore provides channel-specific specifications rather than a binary choice. In the data used, the Ho-selective 473 nm channel provides with the larger (Table 2), favouring absorption per pass, but its mean spacing is smaller ( ≈ 5.8 nm) and the curvature-weighted prominence is lower (K473 = 0.00705 arbitrary units). In contrast, Er-selective 406 nm channel shows larger K (0.0179 arb.) and a larger ≈ 8.5 nm, i.e., fewer but more contrasted subcomponents. Detuning to the nearest component is comparable in both bands (Δ ≈ 1.0 nm). The selectivity index S ≈ 0.72 quantifies this structural bias towards 406 nm, while the combined FOM values are comparable (Table 4).
Relatively short optical paths favour the Ho channel (473 nm), whereas multi-pass/cavity geometries or broader/less-stable sources can make the Er channel (406 nm) competitive despite its smaller , exactly because its larger K and wider spacing reduce sensitivity to fine jitter and spectral congestion within the 15 nm spread.
4.3. What the Peak Catalogue Adds
The derivative-aided peak list (Table 3) provides reproducible seeds for bounded Gaussian fits and a conservative count of resolvable components at 295 K, extracted from the working spectrum (baseline-corrected, somewhat smoothed). This quantifies spectral congestion in the pump bands used for compact diode pumping, and links naturally to tolerance analysis (via and ) when specifying pump linewidth/stability.
4.4. Relation to Prior Practice
Blue/blue-violet pumping near about 406/473 nm is commonly used to steer excitation pathways in Er/Ho platforms. In this study, we placed those bands on an absolute footing at 295 K and add structure-aware usability metrics in the visible 4f–4f manifolds, where robust experimental numbers have been scarce, complementing IR-centred datasets (for example, McCumber analyses [25] in related gallate garnets [33,34,35]). These ‘structure-aware’ descriptors (Section 2.2) depend on local curvature and component spacing in the pump band, not only on .
4.5. Conversion Notes for Mixed-Ion Hosts
Since the spectrum is co-doped, the derivative-aided analysis is used here to measure structure, not to apportion species. The peak catalogue and second-derivative views quantify spectral congestion and detuning tolerance at 295 K without over-decomposition (Figure 4, Figure 5 and Figure 6; Table 3). Ion-selective excitation at 406/473 nm, i.e., Er- versus Ho-dominated channels, has been demonstrated by independent excitation/emission studies [19]; the present results complement that picture by placing the visible pump band on an absolute basis and by supplying structure-aware metrics where robust experimental data have been scarce [33].
Two conversion notes aid interpretation in mixed-ion hosts.
- (i)
- Reported values are per total active-ion density Ntot = NEr + NHo; if a given range is dominated by one species with fraction xs = Ns/Ntot, a species-specific estimate follows as σs ≈ /xs (for example, for equal Er/Ho contents xs = 0.5, σs ≈ 2 ).
- (ii)
- For device layouts it is convenient to work with decadic absorbance or with the product . Using Equation (2), and , so the single-pass absorbed fraction is . Values reported here map directly to , , and for any path length via the stated rescaling (Section 2.4).
4.6. Limitations and Scope
Diffuse-scattering corrections (for example, integrating-sphere calibration) were not applied. Baseline alternatives (for example, spline) do not shift or at 406/473 nm beyond the ~15% uncertainty, which is dominated by the thickness term (Section 2.4). Refractive-index dispersion in the blue/blue-violet spectral range modifies local-field factors at the few-percent level and is sub-dominant to the stated uncertainty. Multiple internal reflections/etalon fringes were not modelled explicitly; no resolvable fringes were observed, and quite slowly varying components are mitigated by the rolling-quantile baseline. Thin-slab Fresnel corrections at normal incidence are expected to be at the few-percent level, again sub-dominant to the thickness uncertainty.
The uncertainty budget is dominated by ; tighter path-length metrology directly reduces the uncertainties in and . Descriptor values depend on fixed analysis parameters (light smoothing, rolling fifth-percentile baseline, prominence threshold); we held them constant across bands for fair comparison. Finally, this is an absorption-only analysis; integrating emission and lifetimes (for example, McCumber-based consistency checks or pump–probe gain) enables end-to-end predictions and deeper comparison with IR-centred datasets in gallate garnets.
5. Conclusions
In this paper, we reported room-temperature, absolute UV–Vis absorption data for nanocrystalline Er3+/Ho3+:Y3Ga5O12: and per-active-ion (referenced to ), a conservative peak catalogue, and structure-aware descriptors (for definitions, see Section 2.2) that link line shape to pump performance. The aggregate metrics—the selectivity index and the curvature–overlap FOM—indicate comparable FOMs at 406 and 473 nm: the Ho-selective 473 nm channel provides higher single-pass absorption, whereas the Er-selective 406 nm channel shows greater robustness to detuning and spectral congestion. The preferred option therefore depends on optical path/geometry and source stability at 295 K.
Absolute magnitudes are reported with propagated uncertainty (about 15%, dominated by ) and with explicit rescaling (Section 2.4), making the results directly usable for rate-equation modelling and for optical-geometry choices (single/multi-pass or cavity coupling).
Under reatively-small-signal conditions, the single-pass absorbed fractions at mm are found to be of about 0.69% (406 nm) and about 1.0% (473 nm); reaching approximately 10% requires paths of about 3.4 mm and about 2.2 mm, respectively.
This study quantifies not only where to pump (≈406 nm for Er, ≈473 nm for Ho), but also how strongly (absolute , ), with what certainty (propagated errors and rescaling), and how robustly (structure-aware descriptors and FOM) at 295 K, turning qualitative guidance into channel-specific, quantitative design criteria.
Supplementary Materials
The following supporting information can be downloaded at https://www.mdpi.com/article/10.3390/physics7040063/s1, Figure S1: Window-size sensitivity for the 406- and 473-nm pump windows (295 K). Figure S2: Overlay of raw and smoothed absorbance used for derivative stability.
Author Contributions
Conceptualization, H.C.V.; methodology, H.C.V. and M.G.M.; software, H.C.V.; validation, M.G.M.; formal analysis, M.G.M.; investigation, H.C.V.; resources, H.C.V.; data curation, H.C.V.; writing—original draft preparation, H.C.V. and M.G.M.; writing—review and editing, H.C.V. and M.G.M.; visualization, M.G.M. All authors have read and agreed to the published version of the manuscript.
Funding
This research received no external funding.
Data Availability Statement
The UV–Vis absorbance dataset reprocessed in this study was originally published in Ref. [19]. All processed data products, quantitative descriptors, and tabulated peak parameters generated during the present analysis are included within the article and its Supplementary Material. Further inquiries can be directed to the corresponding author.
Conflicts of Interest
The authors declare no conflicts of interest.
References
- Reid, M.F. Transition intensities. In Spectroscopic Properties of Rare Earths in Optical Materials; Hull, R., Parisi, J., Osgood, R.M., Warlimont, H., Liu, G., Jacquier, B., Eds.; Springer: Berlin/Heidelberg, Germany, 2005; pp. 95–129. [Google Scholar] [CrossRef] [Scilit]
- Zuo, S.-L.; Chen, P.; Pan, C.-F. Mechanism of magnetic field-modulated luminescence from lanthanide ions in inorganic crystals: A review. Rare Metals 2020, 39, 1113–1126. [Google Scholar] [CrossRef] [Scilit]
- Klimin, S.A.; Berdonosov, P.S.; Kuznetsova, E.S. Quasi-doublets of non-Kramers Ho3+ ion and magnetic ordering of holmium francisite-analog Cu3Ho(SeO3)2O2Cl. Low Temp. Phys. 2021, 47, 1022–1029. [Google Scholar] [CrossRef] [Scilit]
- Gruber, J.; Burdick, G.; Valiev, U.; Nash, K.; Rakhimov, S.; Sardar, D. Energy levels and symmetry assignments for Stark components of Ho3+ (4f10) in yttrium gallium garnet (Y3Ga5O12). J. Appl. Phys. 2009, 106, 113110. [Google Scholar] [CrossRef] [Scilit]
- Henderson, B.; Imbusch, G.F. Optical Spectroscopy of Inorganic Solids; Clarendon Press/Oxford University Press: Oxford, UK, 1989. [Google Scholar] [CrossRef] [Scilit]
- García-Solé, J.; Bausá, L.E.; Jaque, D. An Introduction to the Optical Spectroscopy of Inorganic Solids; Wiley & Sons, Ltd.: Chichester, UK, 2005. [Google Scholar] [CrossRef] [Scilit]
- Dobrzycki, L.; Bulska, E.; Pawlak, D.A.; Frukacz, Z.; Woźniak, K. Structure of YAG crystals doped/substituted with erbium and ytterbium. Inorg. Chem. 2004, 43, 7656–7664. [Google Scholar] [CrossRef] [Scilit] [PubMed]
- Talsky, G. Derivative Spectrophotometry: Low and High Order; Wiley–VCH Verlagsgesellschaft mbH: Weinheim, Germany, 1994. [Google Scholar] [CrossRef] [Scilit]
- Parmar, A.; Sharma, S. Derivative UV–Vis absorption spectra as an invigorated spectrophotometric method for spectral resolution and quantitative analysis: Theoretical aspects and analytical applications—A review. TrAC Trends Anal. Chem. 2016, 77, 44–53. [Google Scholar] [CrossRef] [Scilit]
- Xu, W.; Yu, H.; Yang, F.; Yang, F.; Liu, D.; Lu, K.; Gao, H.; Song, Y. Second derivative UV–visible spectroscopy characterizing structural components of dissolved and particulate organic matter in an urbanized river. Environ. Sci. Eur. 2022, 34, 29. [Google Scholar] [CrossRef] [Scilit]
- Kulakov, T.A.; Paraschuk, D.Y. First and second derivative analysis of electroabsorption spectra in conjugated molecules and polymers: Stark shift and Stark broadening. Chem. Phys. Lett. 2000, 325, 517–522. [Google Scholar] [CrossRef] [Scilit]
- Tang, X.; Han, Q.; Zhao, X.; Song, H.; Ren, K.; Liu, T. Method for estimating the Stark splitting of rare-earth ions from the measured cross-section spectra. Appl. Opt. 2018, 57, 8573–8577. [Google Scholar] [CrossRef] [Scilit]
- Vemula Venkataramu, V.; León-Luis, S.F.; Rodríguez-Mendoza, U.R.; Montesequro, V.; Manjón, F.J.; Lozano-Gorrín, A.D.; Valiente, R.; Navarro-Urrios, D.; Jayasankar, C.K.; Muñoz, A.; et al. Synthesis, structure and luminescence of Er3+-doped Y3Ga5O12 nano-garnets. J. Mater. Chem. 2012, 22, 13788–13799. [Google Scholar] [CrossRef] [Scilit]
- Tachibana, M.; Iwanade, A.; Miyakawa, K. Distribution coefficients for rare-earth doping in Y3Ga5O12 garnet: Comparison with Y3Al5O12. J. Cryst. Growth 2022, 590, 126700. [Google Scholar] [CrossRef] [Scilit]
- Di Quarto, F.; Zaffora, A.; Di Franco, F.; Santamaria, M. Band gap modeling of different ternary and quaternary alumina garnet phases Y3(AlxGa1−x)5O12 (YAGG) and Lu3(AlxGa1−x)5O12 (LuAGG): A semiempirical approach. J. Phys. Chem. C 2022, 126, 17313–17327. [Google Scholar] [CrossRef] [Scilit]
- Wunderer, T.; Siddharth, A.; Johnson, N.; Chua, C.; Teepe, M.; Yang, Z.; Batres, M.; Maeda, P.; Lihachev, G.; Kippenberg, T.J. Single-frequency violet and blue laser emission from AlGaInN photonic integrated circuit chips. Opt. Lett. 2023, 48, 2781–2784. [Google Scholar] [CrossRef] [Scilit]
- Auzel, F. Up-conversions in RE-doped solids. In Spectroscopic Properties of Rare Earths in Optical Materials; Hull, R., Parisi, J., Osgood, R.M., Warlimont, H., Liu, G., Jacquier, B., Eds.; Springer: Berlin/Heidelberg, Germany, 2005; pp. 266–319. [Google Scholar] [CrossRef] [Scilit]
- Lahoz, F.; Capuj, N.; Haro-González, P.; Martín, I.R.; Pérez-Rodríguez, C.; Cáceres, J.M. Stimulated emission in the red, green, and blue in a nanostructured glass ceramics. J. Appl. Phys. 2011, 109, 043102. [Google Scholar] [CrossRef] [Scilit]
- Soler-Carracedo, K.; Martín, I.R.; Lahoz, F.; Vasconcelos, H.C.; Lozano-Gorrín, A.D.; Martín, L.L.; Paz-Buclatin, F. Er3+/Ho3+ codoped nanogarnet as an optical FIR-based thermometer for a wide range of high and low temperatures. J. Alloys Compd. 2020, 847, 156541. [Google Scholar] [CrossRef] [Scilit]
- Qiu, Q.; He, L.; Gu, Z.; Chen, Y.; Lou, Y.; Zhao, X.; Peng, J.; Li, H.; Xing, Y.; Chu, Y.; et al. Extended L-band few-mode Er/Yb co-doped fiber amplifier with a cladding-pumped pseudo-two-stage configuration. Opt. Lett. 2022, 47, 2963–2966. [Google Scholar] [CrossRef] [Scilit] [PubMed]
- Boccuzzi, K.A.; Newburgh, G.A.; Marciante, J.R. Tm/Ho-doped fiber laser systems using coaxial fiber. Opt. Express 2019, 27, 27396–27408. [Google Scholar] [CrossRef] [Scilit] [PubMed]
- Slimi, S.; Mateos, X.; Yu, H.; Zhang, H.; Kränkel, C.; Loiko, P.; Solé, R.M.; Aguiló, M.; Díaz, F.; Chen, W.; et al. Growth, spectroscopy and laser operation of in-band pumped Ho3+-doped yttrium gallium garnet. EPJ Web Conf. 2024, 307, 04013. [Google Scholar] [CrossRef] [Scilit]
- Förster, T. Zwischenmolekulare Energiewanderung und Fluoreszenz. Ann. Phys. 1948, 437, 55–75. [Google Scholar] [CrossRef] [Scilit]
- Dexter, D.L. A theory of sensitized luminescence in solids. J. Chem. Phys. 1953, 21, 836–850. [Google Scholar] [CrossRef] [Scilit]
- McCumber, D.E. Einstein relations connecting broadband emission and absorption spectra of solids. Phys. Rev. 1964, 136, A954–A957. [Google Scholar] [CrossRef] [Scilit]
- Babkevich, P.; Finco, A.; Jeong, M.; Dalla Piazza, B.; Kovacevic, I.; Klughertz, G.; Krämer, K.W.; Kraemer, C.; Adroja, D.T.; Goremychkin, E.; et al. Neutron spectroscopic study of crystal-field excitations and the effect of the crystal field on dipolar magnetism in LiR F4 (R = Gd, Ho, Er, Tm, and Yb). Phys. Rev. B 2015, 92, 144422. [Google Scholar] [CrossRef] [Scilit]
- Steinkemper, H.; Fischer, S.; Hermle, M.; Goldschmidt, J.C. Stark level analysis of the spectral line shape of electronic transitions in rare earth ions embedded in host crystals. New J. Phys. 2013, 15, 053033. [Google Scholar] [CrossRef] [Scilit]
- Walsh, B.M. Review of Tm and Ho materials: Spectroscopy and lasers. Laser Phys. 2009, 19, 855–866. [Google Scholar] [CrossRef] [Scilit]
- León-Luis, S.F.; Monteseguro, V.; Rodríguez-Mendoza, U.R.; Rathaiah, M.; Venkatramu, V.; Lozano-Gorrín, A.D.; Valiente, R.; Muñoz, A.; Lavín, V. Optical nanothermometer based on the calibration of the Stokes and upconverted green emissions of Er3+ ions in Y3Ga5O12 nano-garnets. RSC Adv. 2014, 4, 57691–57701. [Google Scholar] [CrossRef] [Scilit]
- Savitzky, A.; Golay, M.J.E. Smoothing and differentiation of data by simplified least-squares procedures. Anal. Chem. 1964, 36, 1627–1639. [Google Scholar] [CrossRef] [Scilit]
- Ye, H.-Q.; Gorbaciova, J.; Lyu, C.; Burgess, C.; Walton, A.; Zahra, K.; Curry, R.; Bannerman, R.; Gates, J.; Wyatt, P.; et al. Manipulation of molecular vibrations on condensing Er3+ state densities for 1.5 μm application. J. Phys. Chem. Lett. 2021, 12, 9620–9625. [Google Scholar] [CrossRef] [Scilit] [PubMed]
- van den Hoven, G.N.; van der Elsken, J.A.; Polman, A.; van Dam, C.; van Uffelen, K.W.M.; Smit, M.K. Absorption and emission cross sections of Er3+ in Al2O3 waveguides. Appl. Opt. 1997, 36, 3338–3341. [Google Scholar] [CrossRef] [Scilit]
- Zhang, P.; Zhang, D.-L.; Wang, Y. Crystalline phase, cross-section, and temporal characteristics of erbium ion in Lu3Ga5O12 crystal. Photonics 2023, 10, 586. [Google Scholar] [CrossRef] [Scilit]
- Speghini, F.; Piccinelli, F.; Bettinelli, M. Synthesis, characterization and luminescence spectroscopy of oxide nanopowders activated with trivalent lanthanide ions: The garnet family. Opt. Mater. 2011, 33, 247–257. [Google Scholar] [CrossRef] [Scilit]
- Monteseguro, V.; Rathaiah, M.; Linganna, K.; Lozano-Gorrín, A.D.; Hernández-Rodríguez, M.A.; Martín, I.R.; Babu, P.; Rodríguez-Mendoza, U.R.; Manjón, F.J.; Muñoz, A.; et al. Chemical pressure effects on the spectroscopic properties of Nd3+-doped gallium nanogarnets. Opt. Mater. Express 2015, 5, 1661–1673. [Google Scholar] [CrossRef] [Scilit]

Disclaimer/Publisher’s Note: The statements, opinions and data contained in all publications are solely those of the individual author(s) and contributor(s) and not of MDPI and/or the editor(s). MDPI and/or the editor(s) disclaim responsibility for any injury to people or property resulting from any ideas, methods, instructions or products referred to in the content. |
© 2025 by the authors. Licensee MDPI, Basel, Switzerland. This article is an open access article distributed under the terms and conditions of the Creative Commons Attribution (CC BY) license (https://creativecommons.org/licenses/by/4.0/).