1. Introduction
Cryptography, the study of secure communication, plays a crucial role in protecting sensitive data from unauthorized access or alterations. A specialized branch of this field, image cryptography, concentrates on ensuring the security of digital images. By utilizing cryptographic methods, it safeguards the confidentiality, integrity, and authenticity of image data. Applications of image cryptography are diverse and extend across sectors such as healthcare, military, and finance [
1,
2,
3]. In healthcare, patient medical images are often sensitive, and image cryptography ensures that only authorized personnel can access and interpret them. In the military, the secure transmission of satellite imagery and surveillance data relies on image cryptography to prevent interception by adversaries. Financial transactions involving visual data, such as digital signatures on checks or the secure transmission of financial documents, also benefit from image cryptography to maintain the confidentiality and trustworthiness of the information. As technology advances, image cryptography’s importance becomes increasingly pronounced in our digitally interconnected world [
4,
5]. Chaotic approaches have proven valuable in image cryptography due to their inherent complexity and sensitivity to initial conditions. Chaotic systems exhibit unpredictability and nonlinearity, making them suitable for creating secure encryption algorithms [
6,
7]. In image cryptography, chaotic maps such as logistic maps and Hénon maps have been employed to scramble pixel values or positions, providing a basis for encryption. These chaotic approaches enhance the security of the image by introducing a high level of entropy, making it difficult for adversaries to decipher the encrypted content without the correct decryption key. Researchers have explored different chaotic transformations and their combinations to develop robust image encryption techniques, ensuring the confidentiality and integrity of visual information in diverse applications [
8,
9,
10,
11,
12].
Hyper-chaotic approaches represent an advanced extension of chaotic systems, incorporating multiple chaotic maps or dimensions to further enhance the security of image cryptography. Hyper-chaotic systems offer increased complexity and control parameters, making them even more attack-resistant. In image encryption, hyper-chaotic systems are employed to introduce additional layers of complexity, often in the form of multi-dimensional chaotic transformations. The synergistic combination of chaotic and hyper-chaotic approaches in image cryptography aims to create encryption schemes that can withstand sophisticated attacks and provide a higher level of security for visual data in applications ranging from secure communication to medical imaging and beyond [
13,
14,
15,
16]. This research paper aims to introduce and evaluate a new integrated chaos-based algorithm for image encryption that integrates the chaotic Hénon map with the chaotic logistic map (CLM) to significantly improve the security of digital image communication. By generating cryptographic keys through chaos theory, the algorithm is designed to produce highly unpredictable and complex keys that are crucial for robust encryption. This paper aims to demonstrate the algorithm’s effectiveness in confidently resisting various well-known attacks, such as chosen-plaintext, noise, clipping, occlusion, and known-plaintext attacks, while assessing its performance based on encryption time, throughput, and image quality metrics. Through this research, the authors strive to establish the chaotic Hénon–logistic map integration as a powerful method for protecting digital images in secure communication environments.
The structure of this paper is organized as follows.
Section 2 offers an overview of recent relevant research, and
Section 3 provides a detailed discussion of the proposed scheme. The results and their analysis are expounded upon in
Section 4, while
Section 5 encapsulates a concise summary of the conclusions drawn from this study.
2. Related Works
The Collatz Conjecture, introduced by German mathematician Lothar Collatz in 1937, presents a fascinating mathematical puzzle that remains unsolved [
17]. This conjecture revolves around a straightforward iterative procedure applied to any positive integer. Beginning with a given number,
,
is obtained using the formula
This process is repeated with the resulting number, generating a sequence. It is widely believed that the sequence will inevitably reach the repeating cycle 4-2-1 regardless of the starting integer. Despite extensive efforts, no definitive proof or disproof has been found, but its simplicity and enduring mystery have made it a compelling focus of mathematical inquiry [
17,
18].
Researchers have found a creative application for the Collatz Conjecture in generating cryptographic keys in image encryption. The deterministic nature of the Collatz sequence, coupled with its chaotic behavior for certain starting values, forms the foundation of a unique key generation algorithm. In this approach, the initial conditions of the Collatz Conjecture become a seed to generate a numerical sequence used as a cryptographic key. By mapping the pixel values of an image through this key-generated sequence, a complex and pseudo-random pattern is introduced, enhancing the security of the encryption process. The unpredictability and inherent complexity of the Collatz Conjecture offer a fresh perspective on key generation for image encryption, providing a potential avenue for developing robust and unconventional cryptographic techniques [
17,
18].
Chaotic maps are mathematical functions that exhibit chaos, characterized by sensitivity to initial conditions, topological mixing, and dense periodic orbits. These properties make chaotic maps useful in various fields, especially in cryptography for encryption and secure communications. There are several types of chaotic maps, each with distinct features and applications [
19,
20,
21,
22,
23,
24]:
Logistic Map: The logistic map, a polynomial mapping of degree 2, is one of the most well-known and basic chaotic maps. It is frequently used as a prime illustration of how extremely basic nonlinear dynamical equations can give rise to complex and chaotic behavior.
Tent Map: The tent map is piecewise linear and exhibits chaotic behavior for certain parameter values. It is characterized by its tent-like shape, and it is commonly used in studies of dynamical systems due to its simplicity and the ease with which one can analyze its properties.
Chaotic Hénon Map: A two-dimensional map, the chaotic Hénon map is one of the most studied examples of dynamical systems that exhibit chaotic behavior. Introduced by Michel Hénon, it is renowned for its strange attractor, a complicated set of fractal structures in its phase space.
Chebyshev Map: This map uses Chebyshev polynomials and is known for its use in pseudo-random number generation and cryptographic algorithms. The Chebyshev map exhibits chaotic behavior for certain parameters and is appreciated for its complex dynamical properties.
Each of these maps has its own set of characteristics and applications, and the choice of a specific map often depends on the requirements of the system being designed, particularly in terms of the required cryptographic strength and computational efficiency.
When delving into the intricacies of throughput in image encryption methods, as delineated in
Table 1, a discernible pattern emerges, particularly concerning the performance of various chaotic approaches. Notably, hyper-chaotic approaches tend to outshine their counterparts. This distinction can be attributed to their inherent complexity and dynamic characteristics. Unlike standard chaotic systems, which rely on a single positive Lyapunov exponent, hyper-chaotic systems boast multiple such exponents, enriching the encryption process with an additional layer of unpredictability and security. This complexity, however, does not necessarily impede performance. In fact, despite the sophisticated dynamics at play, hyper-chaotic systems can match and often exceed the throughput rates of their non-chaotic and chaotic counterparts. This superior performance underscores the potential of hyper-chaotic systems in providing robust encryption mechanisms without compromising efficiency, making them a preferred choice in scenarios where security and performance are paramount [
25,
26,
27,
28].
In [
19,
27,
28,
35,
36,
37,
38], various hyper-chaotic approaches were utilized in image encryption to enhance security and efficiency. These methods leverage the complex behavior of hyper-chaotic systems, incorporating sophisticated techniques for key generation, pixel manipulation, and transformation processes. In [
27], the authors presented an image encryption algorithm based on an improved 6D chaotic system, focusing on the security and efficiency of image transmission. It introduces a hyper-chaotic system with enhanced randomness, employs image preprocessing for key-space adjustment, and utilizes the hash value of the original image for key uniqueness. The algorithm includes row and column encryption matrices and employs the Arnold transformation, demonstrating robust security and high speed in encryption and decryption processes.
In [
19], the authors presented a quantum image encryption method using 3D Mobius scrambling and a 3D hyper-chaotic Hénon map. It enhances image encryption by altering pixel locations and gray values, offering better performance in the key space, histogram variance, and correlation coefficient compared to recent algorithms. The approach combines pixel-level scrambling, controlled XOR diffusion, and chaotic sequences for improved security and reliability.
In [
35], the authors introduced a color image encryption method named EDPD, integrating SHA-512, a 4D hyper-chaotic system, and eight-base DNA-level permutation and diffusion. It aims to enhance image encryption by improving the key space, histogram variance, and correlation coefficient metrics. The method involves generating initial chaotic system values using SHA-512, creating a hyper-chaotic sequence, and performing multiple permutation and diffusion operations with dynamic DNA encoding. The EDPD shows promising results in color image encryption and resistance to various attacks.
In [
36], an image encryption algorithm was discussed using a time-delayed nonlinear combinatorial hyper-chaotic map. The method aims to enhance image encryption by incorporating complex dynamics and wider hyper-chaotic intervals, thereby improving efficiency, security, and practical value in secure communications.
In [
37], the authors introduced an image encryption technique combining a hyper-chaotic system with DNA computing for enhanced plaintext sensitivity. It utilizes a cost-effective tent map for key stream generation and incorporates multiple encryption layers, including decimal-level diffusion, permutation, and DNA-level operations, to significantly randomize image data. The method demonstrates robustness, outperforming contemporary schemes in computational efficiency and security, effectively resisting common cryptographic attacks and making it highly suitable for real-world image security applications.
In [
38], the researchers introduced an encryption method to secure high-resolution images by employing Arnold cat and Hénon chaotic maps. The system leverages the Arnold cat map to perform permutations at the bit and pixel levels on both plain and encrypted images. Meanwhile, the chaotic Hénon map creates encrypted images and defines the parameters for these permutations. They describe the cryptographic mechanisms and include security analyses of five distinct images. The findings demonstrate the cryptosystem’s strong resistance to brute-force, chosen-plaintext, and statistical attacks. Furthermore, the study concluded that the cryptographic processes are sufficiently efficient for real-time use.
In [
34], the authors introduced an innovative image encryption method that integrates the chaotic Hénon map, dynamic S-boxes, and elliptic curve cryptography (ECC) to ensure high security and efficiency. The chaotic Hénon map, a two-dimensional chaotic system, is utilized to create dynamic S-boxes for the substitution phase of encryption, significantly improving the cipher’s confusion and diffusion capabilities. ECC facilitates secure key exchange and authentication, ensuring a safe communication channel between the sender and receiver. The authors asserted that their approach offers strong resistance to attacks and features an extensive key space, making it well suited for secure image transmission. The algorithm’s performance was assessed through statistical analysis, key sensitivity tests, and comparisons with other encryption techniques. The findings confirmed the method’s effectiveness and resilience in safeguarding image data against unauthorized access.
The authors of [
39] presented an approach to securing digital images using an encryption scheme based on the Hénon chaotic map. This two-dimensional iterated discrete dynamic system is known for its sensitivity to initial conditions, which is leveraged to enhance the security of the encryption process. The proposed method employs a 128-bit secret key with the Hénon chaotic map to generate a cipher image. Following the encryption, pixel shuffling is performed using a permutation matrix derived from the chaotic map to further obfuscate the image. The algorithm’s effectiveness was validated against standard performance metrics such as PSNR, entropy, and histogram analysis. The results demonstrated that the scheme is robust against various types of attacks, including plain-text, statistical, and chosen-plaintext attacks, making it a promising solution for securing multimedia data in high-bandwidth networks.
Using hyper-chaotic maps in image encryption offers many compelling advantages, cementing their status as a superior choice in cryptographic security. Firstly, hyper-chaotic systems are celebrated for their heightened complexity, attributed to multiple positive Lyapunov exponents. This complexity translates into a more intricate and less predictable encryption pattern, drastically enhancing security. Secondly, these systems exhibit extreme sensitivity to initial conditions and parameters, a trait that amplifies the robustness of encryption against various types of attacks, including chosen-plaintext attacks. Thirdly, hyper-chaotic maps provide a vast key space due to their multiple chaotic variables, significantly reducing the likelihood of brute-force attacks. Moreover, despite their complex nature, hyper-chaotic systems can be designed to maintain efficient computational performance, ensuring that the encryption process is smooth in time-sensitive applications. This blend of robust security features and practical efficiency makes hyper-chaotic maps a highly sought-after solution in secure image encryption [
12,
40].
3. The Proposed Scheme
This paper presents an innovative integrated chaos-based algorithm for image cryptography, combining the chaotic Hénon map and the chaotic logistic map (CLM) to enhance the transmission security of images. The proposed method effectively meets the key requirements of data cryptography, as follows:
Robust encryption key: The algorithm generates a strong encryption key that is highly resistant to brute-force attacks, providing a robust security framework that reassures readers about the system’s security.
Sensitivity to minor changes: Leveraging the unique characteristics of chaotic systems, the method ensures that even the slightest alterations in the input image or encryption key result in a completely different encrypted output. This high sensitivity instills confidence in the system’s ability to protect data from unauthorized parties.
Optimal quality parameters: The approach maintains high-quality parameters throughout decryption and encryption, guaranteeing the similarity between the decrypted and original images, without compromising on quality or fidelity.
High MSE during encryption: A high Mean Square Error (MSE) between the original and encrypted images ensures that the encrypted image appears highly distorted, preventing attackers from interpreting the content. This distortion enhances the algorithm’s security.
Decryption with zero MSE: Following decryption, the MSE should return to zero, confirming that the original image has been perfectly restored without losing data or integrity.
Efficient encryption and decryption: The method prioritizes speed, minimizing the time required for encryption and decryption while maximizing processing efficiency. This emphasis on efficiency reassures readers that the system is practical and responsive for real-world applications.
Broad image compatibility: The algorithm is designed to work effectively with various image formats, resolutions, and color spaces. Its adaptability ensures reliable performance across diverse image types, making it suitable for real-world use cases.
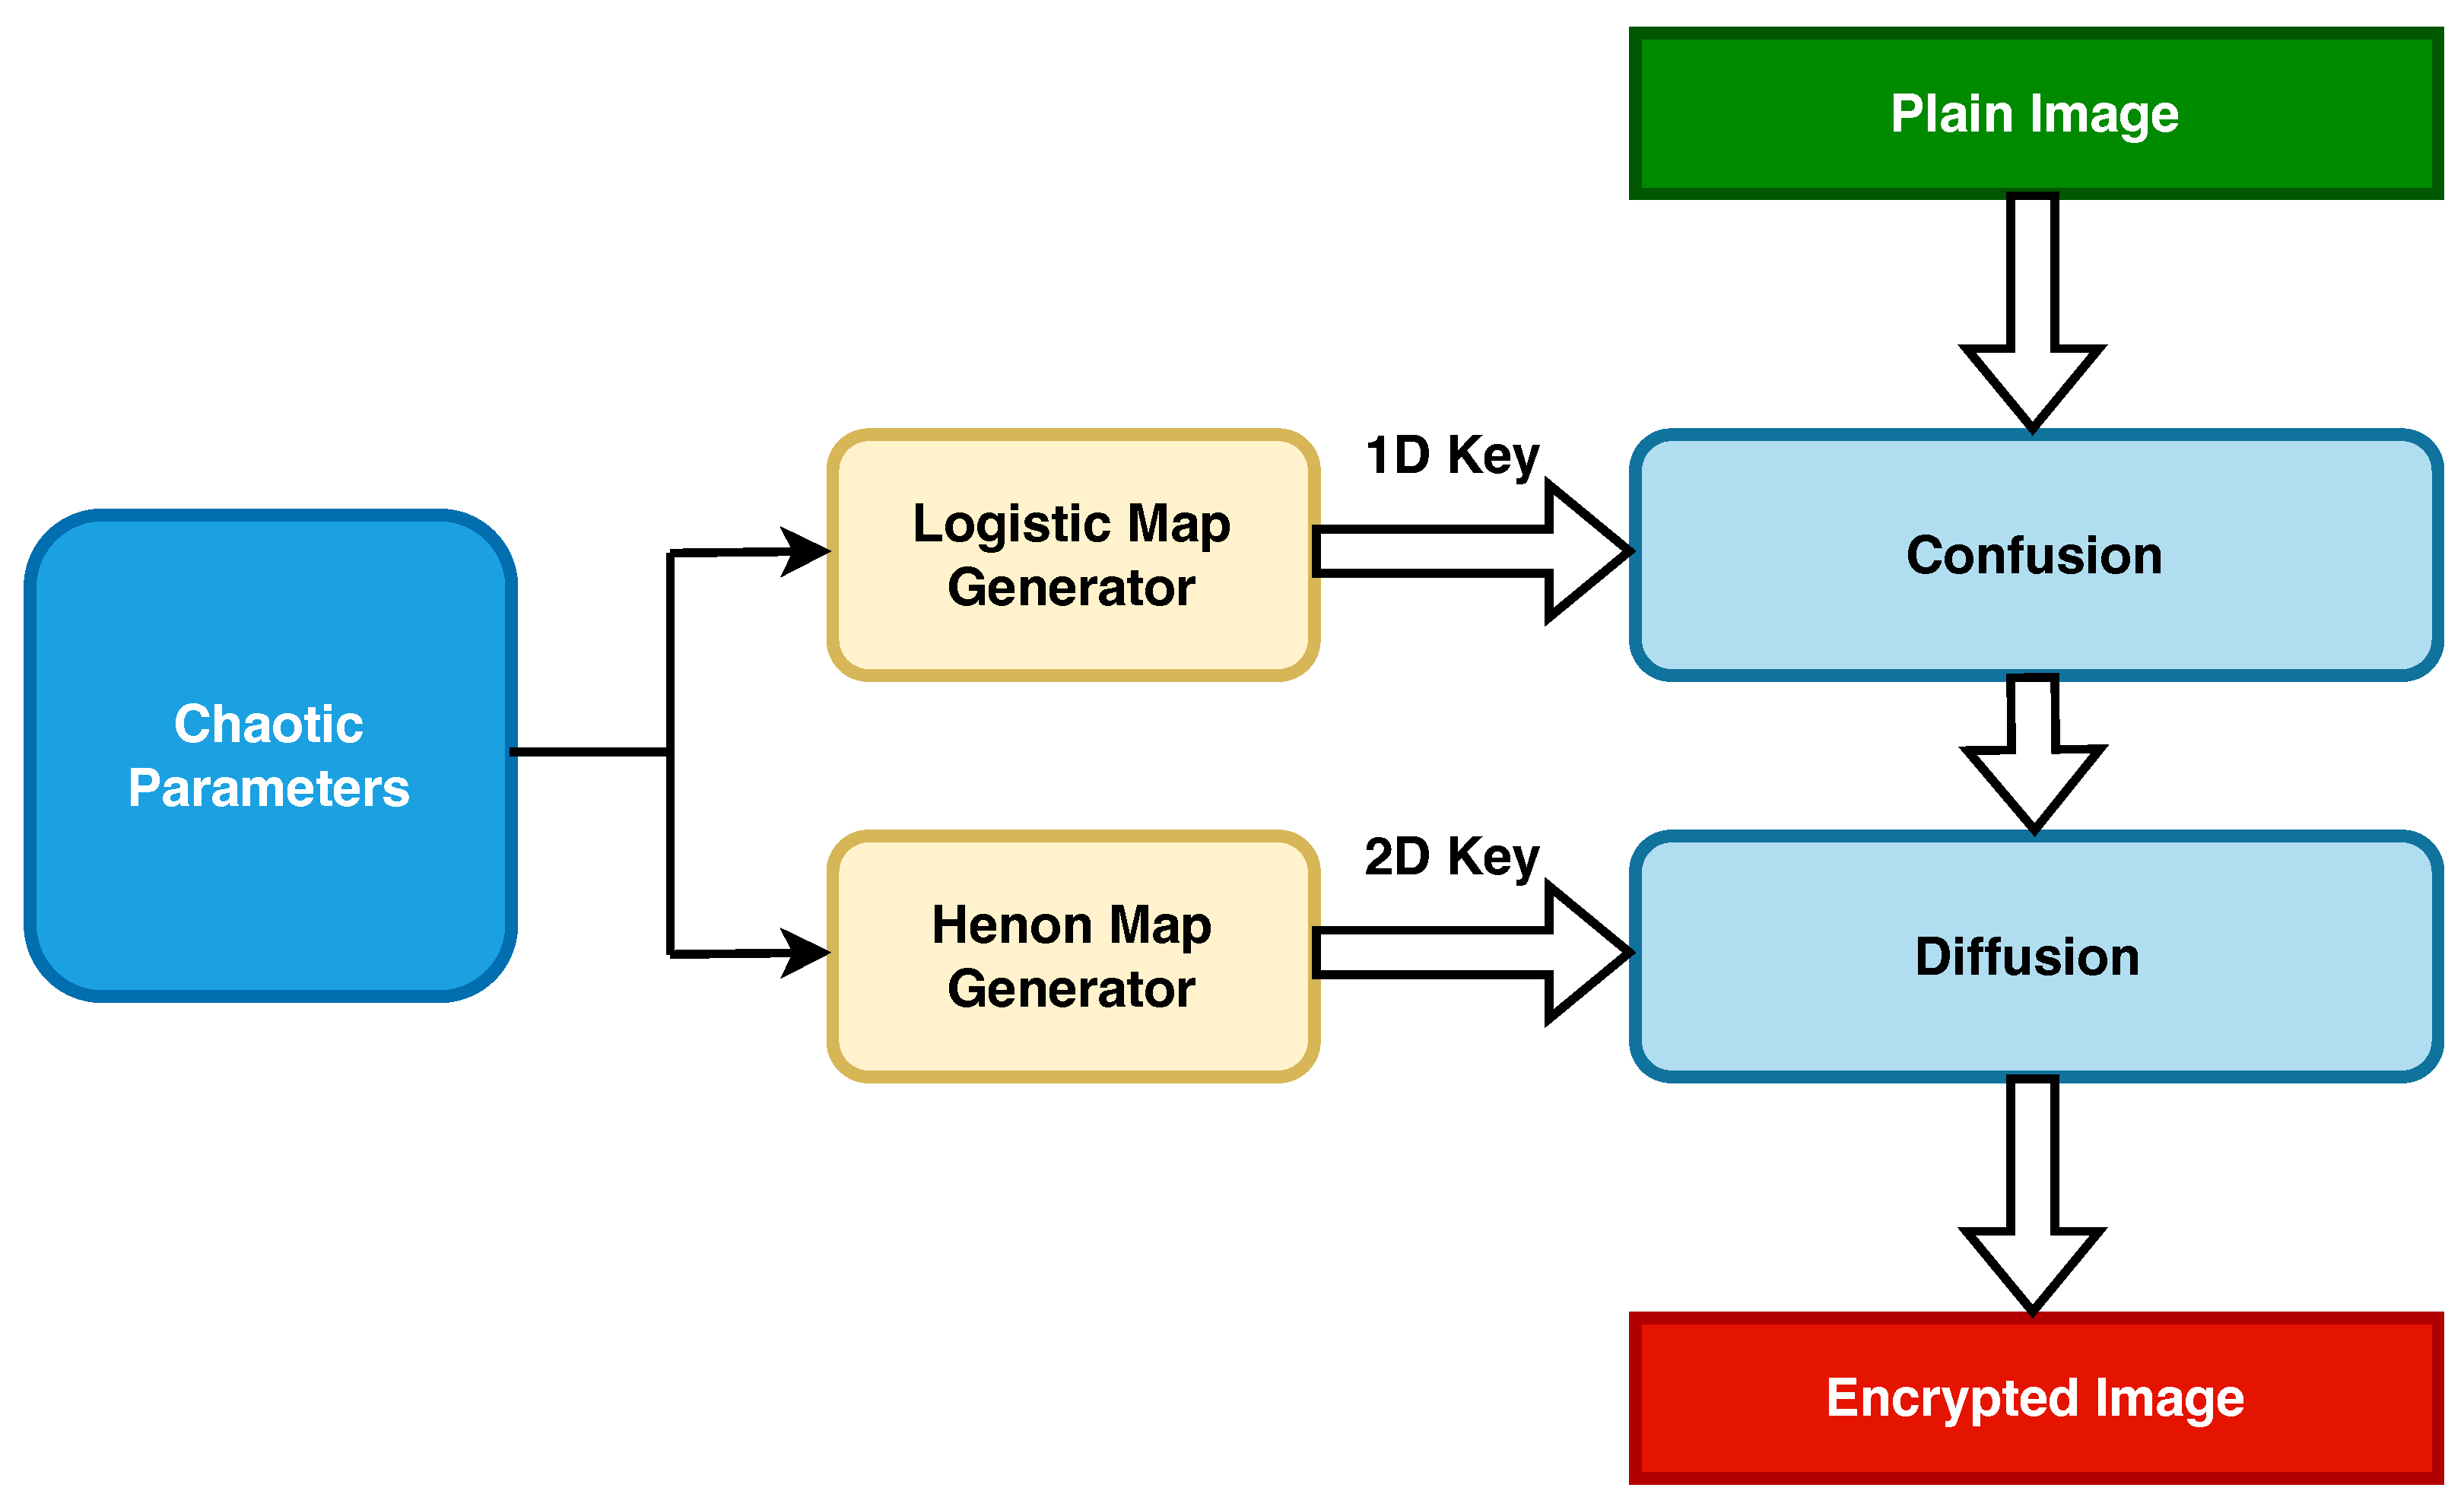
A graphical abstract of the proposed method is shown in
Figure 1, illustrating the generation and application of cryptographic keys using chaos theory for image encryption. Initially, a 1D key is generated using the logistic map generator, while a 2D key is created using the chaotic Hénon map generator. These chaotic maps produce highly unpredictable and complex keys, which are essential for robust encryption. The abstract visually depicts how these keys are used in the encryption algorithm, transforming plain images into encrypted ones. This dual-key approach leverages the inherent randomness of chaotic maps, ensuring enhanced security and resistance against cryptographic attacks.
The chaotic logistic map (CLM) is a mathematical framework that exhibits chaotic dynamics. It operates as a discrete-time dynamical system and is described by the following recursive Equation (
1):
In this context, represents the state of the system at the time step n, r is a parameter that influences the system’s dynamics, and x denotes the system’s initial state. The state variable x typically lies in the interval during iteration. The value of r dictates the behavior of the system, as follows:
For , the system stabilizes at a single point.
For , the system follows a periodic pattern.
For , the system experiences chaotic behavior.
For , the system becomes divergent.
Two one-dimensional (1D) CLM keys are randomly generated using the CLM method to shuffle pixel positions both row-wise and column-wise. By utilizing the CLM model with the parameters
r and
x, the dimensions of the 1D keys are determined by the parameters
R and
C. The generation process for the 1D CLM map, which facilitates pixel shuffling along rows and columns, is shown in Equation (
2) and Equation (
3), respectively.
where CLM-Row is a 1D CLM map of size
R and
is the row index.
where CLM-Col is a 1D CLM map of size
C and
is the column index.
Another example of a discrete-time system that exhibits chaotic behavior is the chaotic Hénon map, which is given by Equation (
4):
where the map depends on two parameters,
a and
b, and the values for the classical chaotic Hénon map are typically
and
.
and
are the initial values for the chaotic map. The number of random values
n equals the number of pixels in the image to be encrypted and reshaped to match the image size.
When encrypting a digital image using the chaotic Hénon map, a bitwise XOR operation is applied between the encryption key and the image. This operation alters the image by flipping bits where the corresponding key bit is 1 while leaving bits unchanged where the key bit is 0. Importantly, this process is inherently reversible. By applying the same bitwise XOR operation between the same key and the encrypted image, the original image is restored. For decryption, the recipient must have access to the identical key used for encryption. The original image can be retrieved by performing the same bitwise XOR operation between the encrypted image and the key. The security of the key is of utmost importance, as the image may be readily decrypted by anyone having the key. This underscores the recipient’s responsibility for maintaining the key’s security. To improve the security of encrypted images, it is crucial to repeat both the confusion and diffusion processes multiple times. Research indicates that a single round of a substitution-permutation network-based cryptosystem lacks sufficient security to prevent vulnerabilities, even when utilizing a chaotic system as the foundation for encryption [
41]. Furthermore, other studies demonstrate that employing four rounds of confusion and diffusion significantly bolsters the security of their encryption methods [
6,
7]. In summary, implementing multiple iterations of these processes can greatly enhance encrypted data protection.
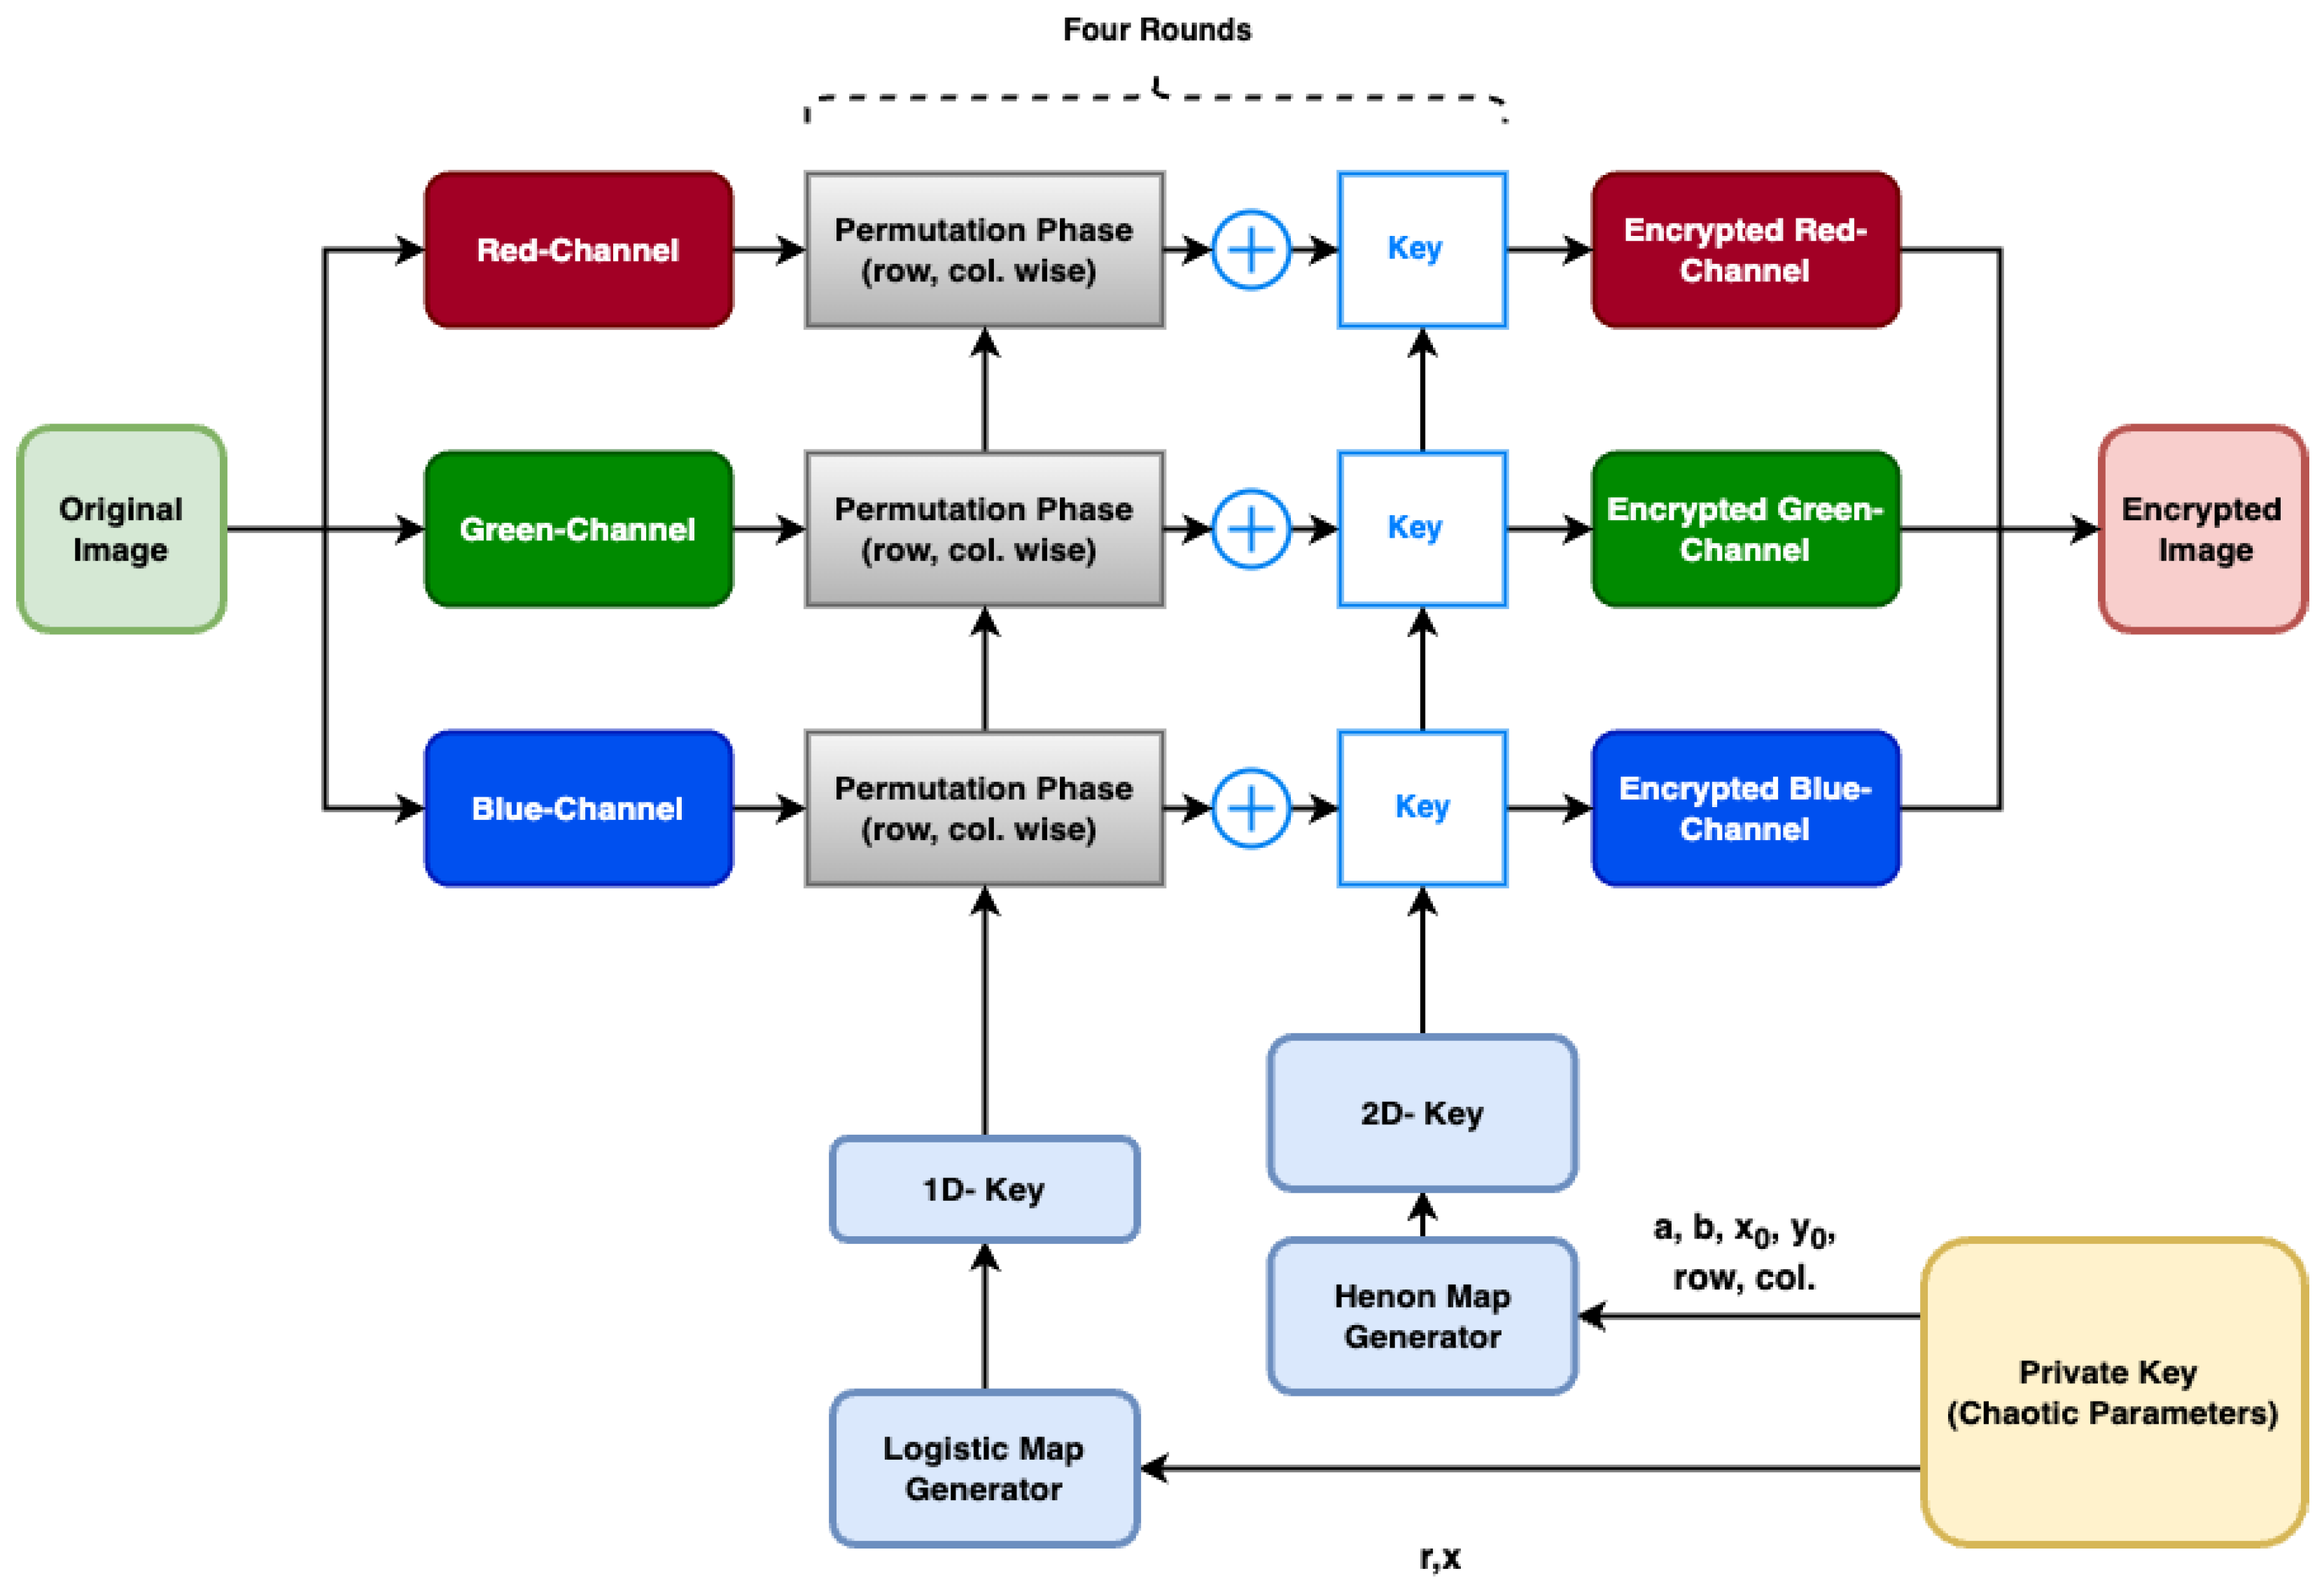
Figure 2 illustrates the effectiveness of the proposed encryption technique, which consists of three primary components: the chaotic parameter generator, confusion, and diffusion. The chaotic parameter generator plays a crucial role in the process, computing specific chaotic parameters like
r,
x,
a, and
b. These parameters introduce a high level of complexity and randomness, enhancing the security of the encryption. The confusion stage rearranges the plain image’s rows and columns using a 1D chaotic vector generated by the CLM map generator. Each permuted color channel is then encrypted in the diffusion phase by performing a bitwise XOR operation with a 2D chaotic matrix, Algorithm 1 explains in details the encryption process of the proposed method. The encryption method involves four rounds of confusion and diffusion, making it robust against known plaintext attacks. The following subsections elaborate on the key parser, encryption, and decryption processes in greater detail.
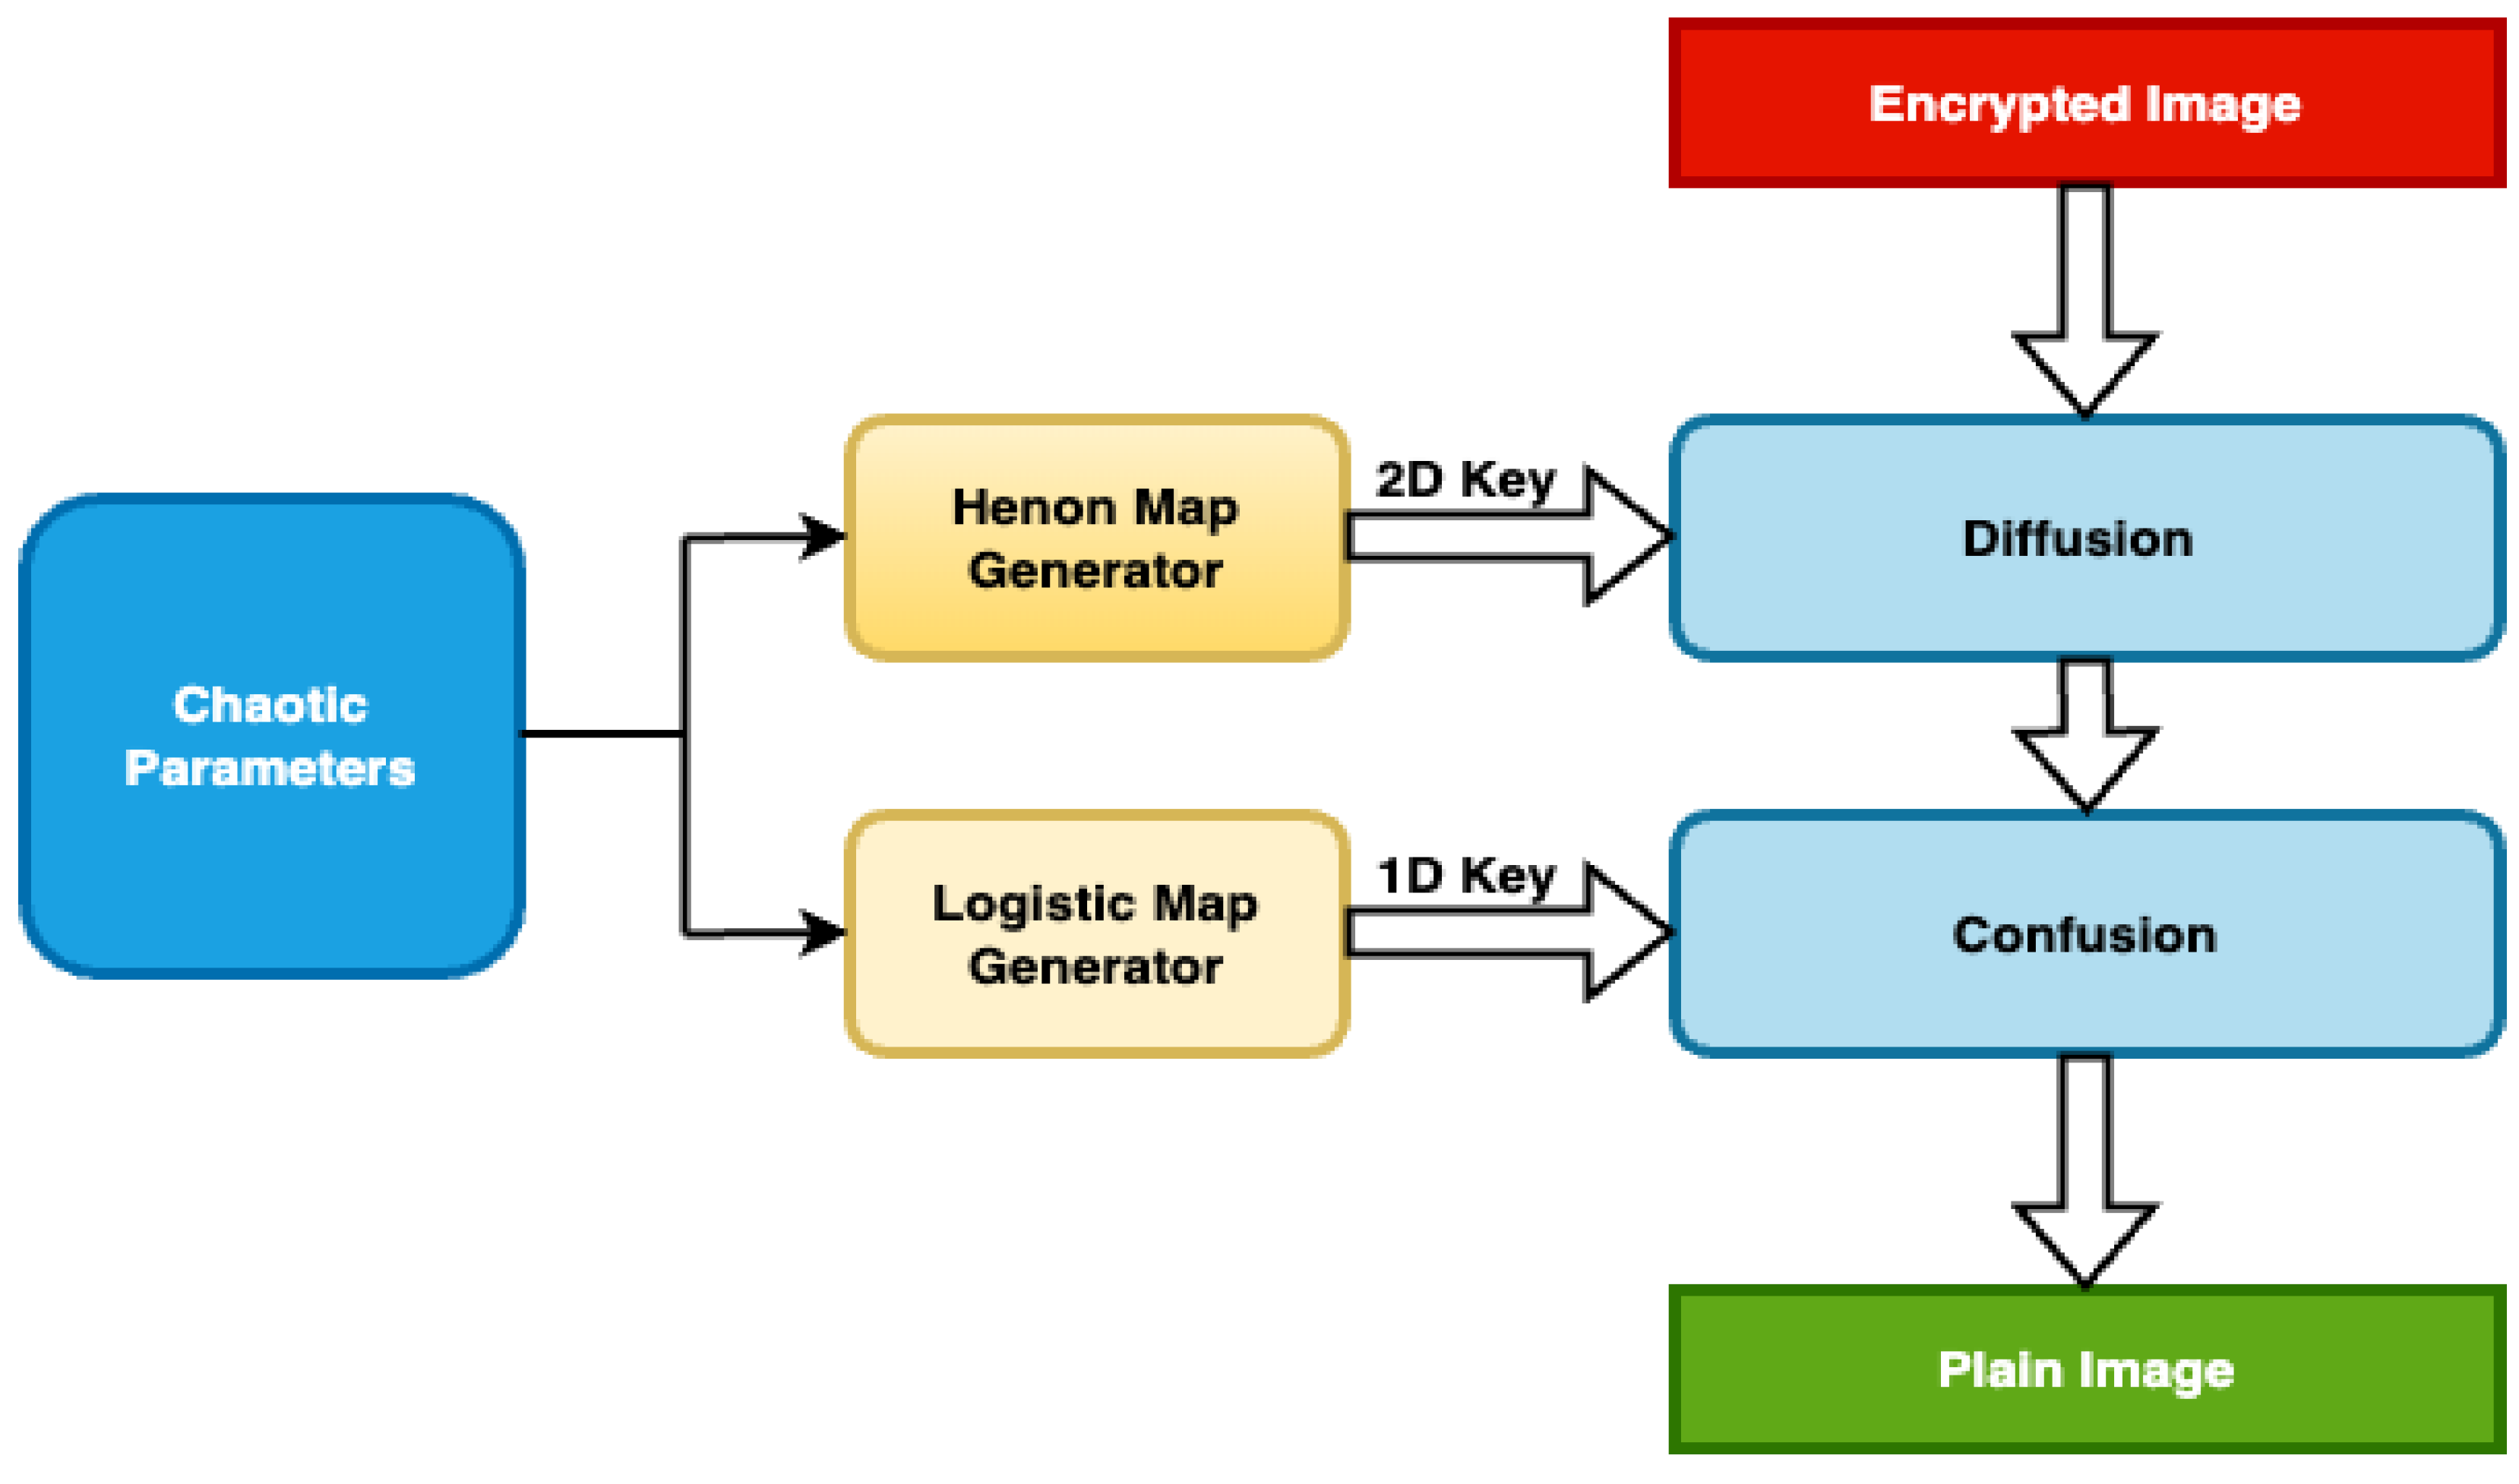
Figure 3 illustrates the proposed decryption method, detailing the roles of the various components in restoring the original data. At the core, the chaotic parameter generator produces specific chaotic parameters, which are crucial for the decryption sequence. These parameters guide the logistic map generator, a key player in generating a 1D key that introduces a complex level of confusion, ensuring the data are accurately unscrambled. Concurrently, the chaotic Hénon map generator provides a 2D key utilized in the diffusion process, further refining the decryption by redistributing the data points to their correct positions, Algorithm 2 represents a detailed explanation for the decryption phase. Together, these elements harmonize to achieve a robust and reliable decryption mechanism.
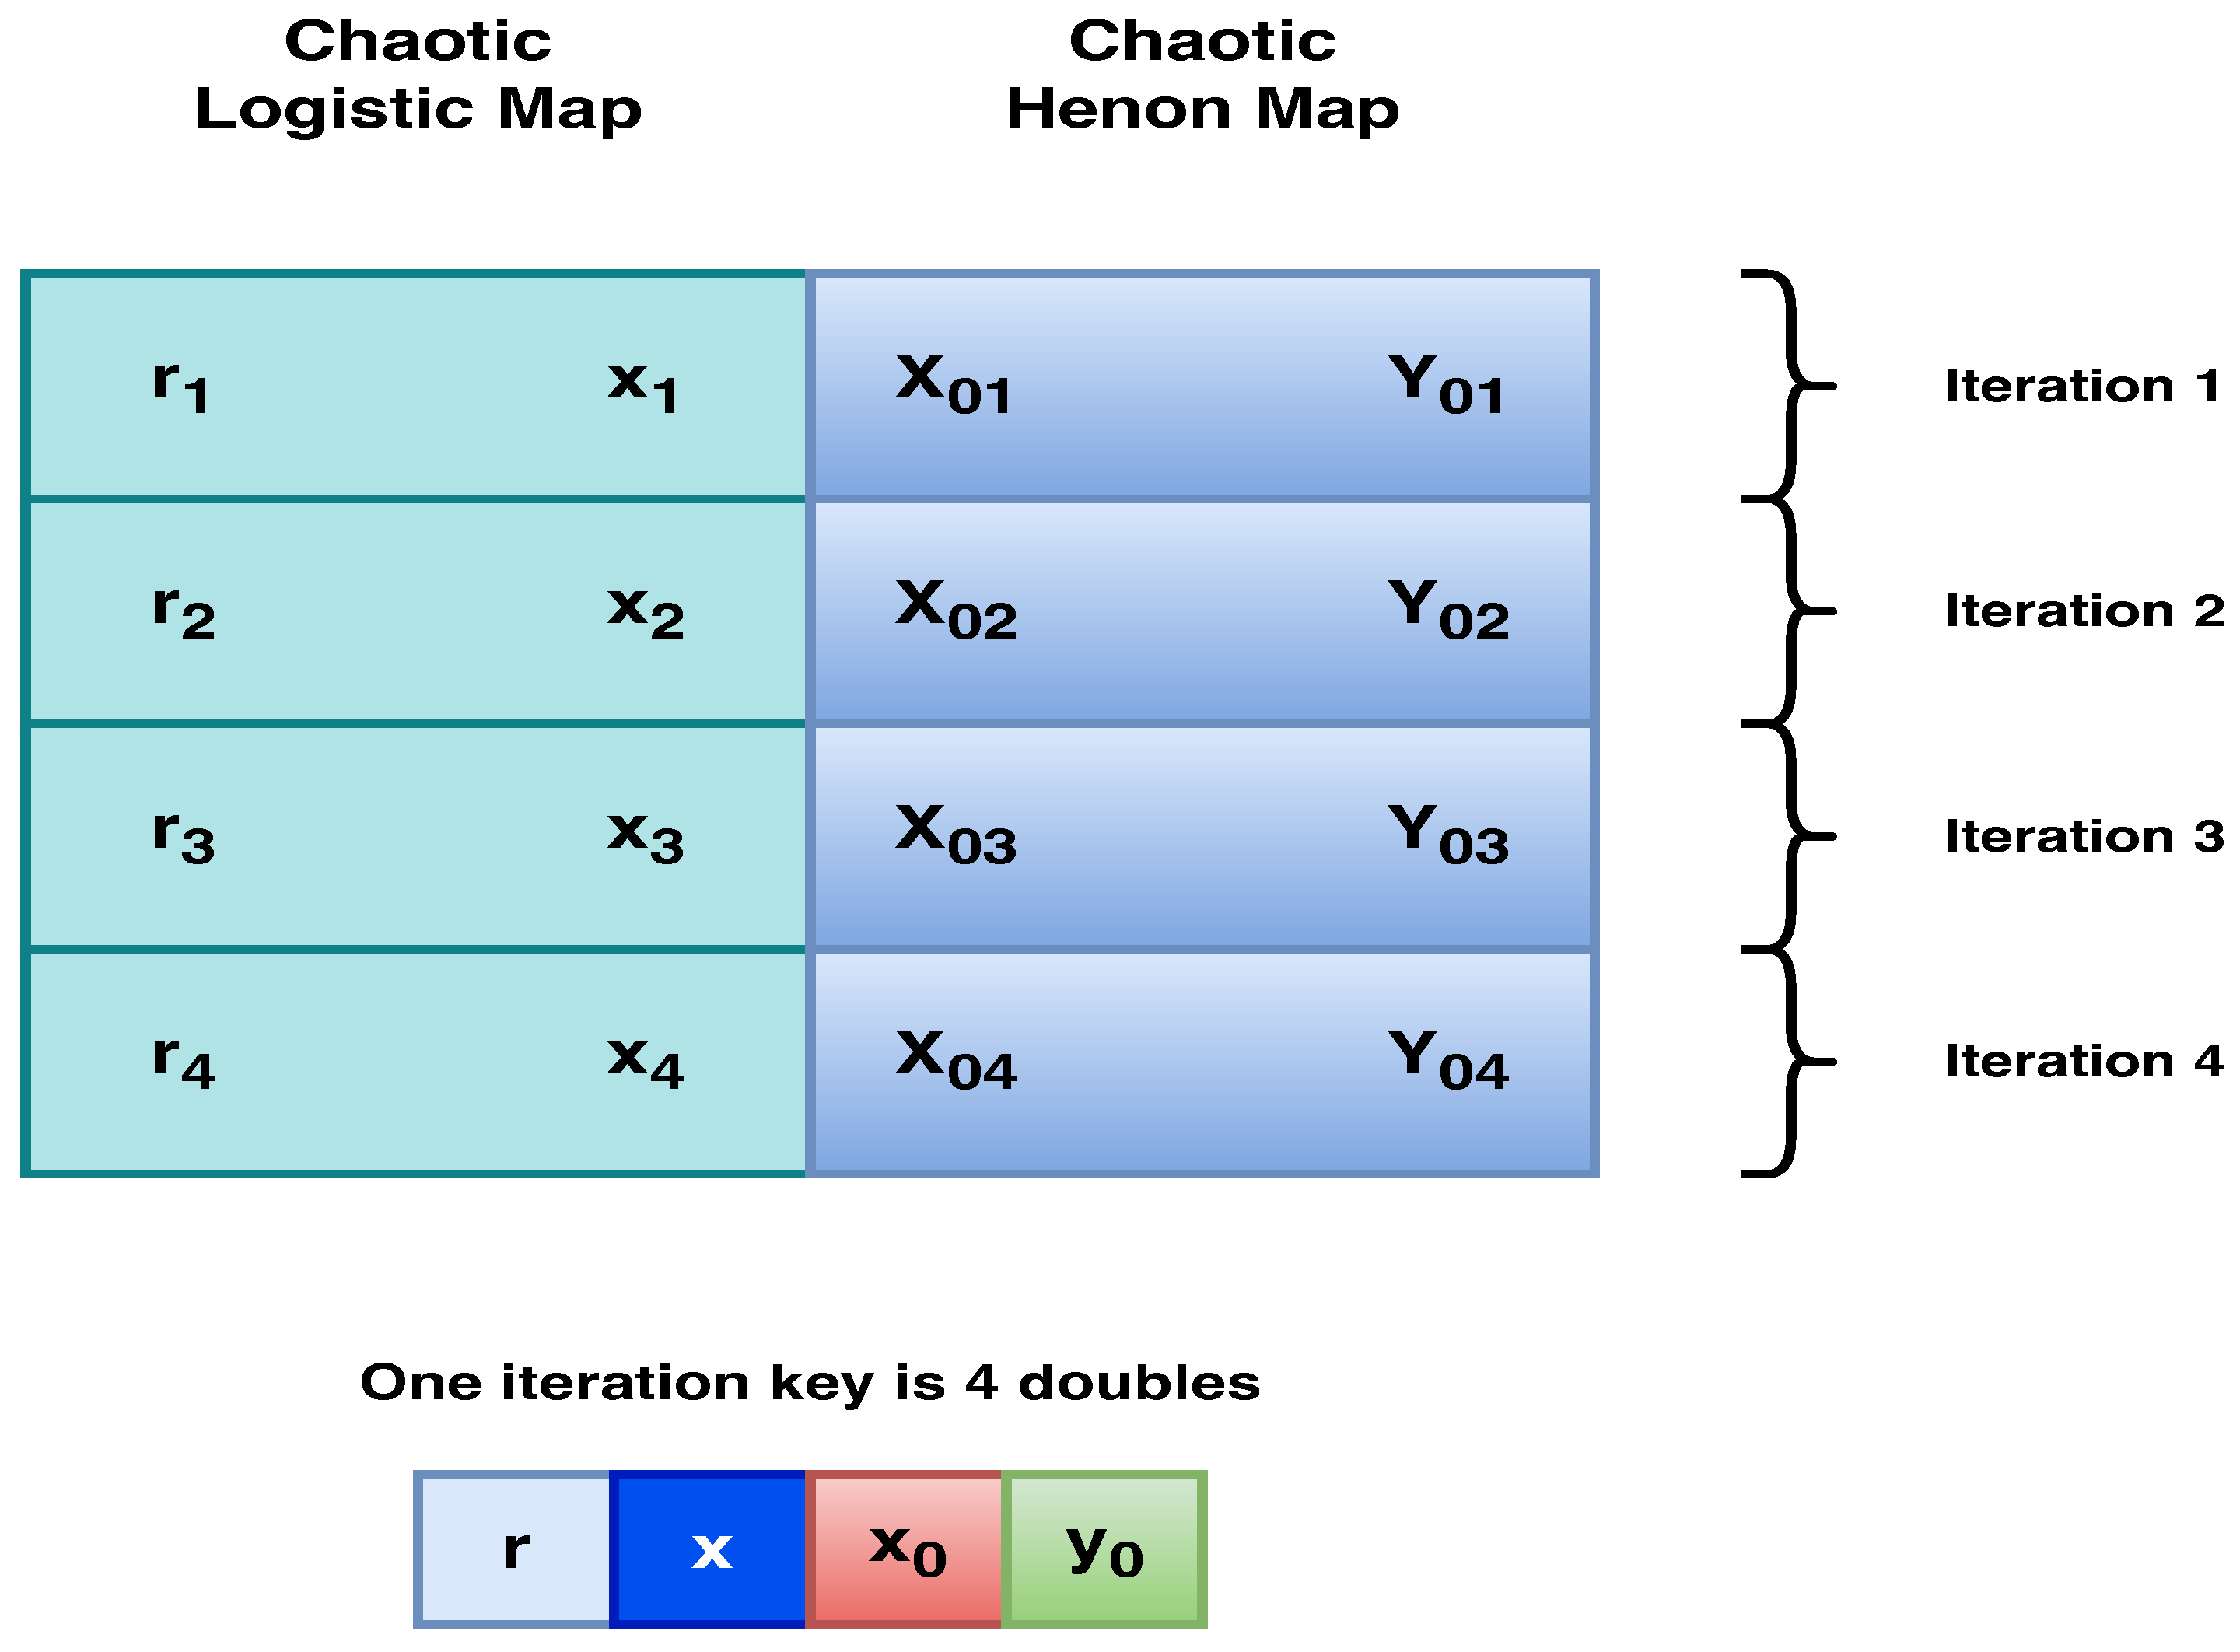
A detailed explanation with an example is provided in
Appendix A to illustrate how the key is generated. Since there are four rounds of encryption and decryption, four keys need to be used, each key consists of four double data type as deceptive in
Figure 4.
| Algorithm 1 Encryption algorithm |
Inputs:
Original Color image, Parameters (Chaotic): a, b, r, x, , and size of the image ()
Output:
Encrypted Color image
Process- 1.
Separate the original image into its Red, Green, and Blue (RGB) color matrices. - 2.
for , , while - (a)
Use the Logistic map with parameters r and initial condition x for the generation of a chaotic sequence - (b)
The rows will be shuffled using this sequence as a random index. - (c)
Again, use the Logistic map with parameters r and initial condition x to generate another chaotic sequence. - (d)
The columns will be shuffled using this sequence as a random index - (e)
Use a, b, , and size of original image input parameters to generate a 2D Chaotic Hénon map key. - (f)
Perform the XOR operation between the resized Hénon map key and each color matrix (Red, Green, Blue) separately.
- 3.
End for - 4.
To obtain the encrypted color image, combine the Red, Green, and Blue matrices back into a single matrix.
|
| Algorithm 2 Decryption Algorithm |
Inputs:
Encrypted image, Parameters (Chaotic): a, b, r, x, , and size of the image ().
Output:
Decrypted image
Process- 1.
Extract each color matrix - 2.
for , , while - (a)
Generate a 2D Chaotic Hénon map key by using the parameters a, b, , , and of image (). - (b)
Perform the XOR operation between the resized Hénon map key and each color matrix (Red, Green, Blue) to decrypt the matrices. - (c)
Use the Logistic map to generate a 1D chaotic vector. This vector will act as a random index for reshuffling the rows - (d)
Using this chaotic vector to reshuffle the rows of the color matrix to return them to their original positions - (e)
Again, use the Logistic map to generate another 1D chaotic vector. This vector will act as a random index for reshuffling the columns - (f)
Using the chaotic vector to reshuffle the columns of the color matrix to return them to their original positions
- 3.
End for - 4.
Merge the decrypted Red, Green, and Blue matrices back into a single matrix to reconstruct the decrypted color image.
|
3.1. Dataset Used
The dataset used in this article is the Kodak Lossless True-Color Image Suite, a comprehensive collection of high-quality, true-color images that serves as a valuable resource for researchers and developers in image processing, compression, and encryption. This image suite, which is available in [
42], provides a consistent benchmark for evaluating and comparing the performance of various algorithms and techniques in image processing.
The imaging suite comprises 24 true color images of size , captured using Kodak’s high-quality imaging equipment. These images cover a wide range of subjects, including portraits, landscapes, and still-life compositions. The diverse contents of the imaging suite allow researchers to test their algorithms and techniques against various image characteristics, such as color distribution, texture, and detail.
3.2. Key-Space Analysis
In the proposed method, the key for one iteration consists of four doubles (i.e., double type–64 bits), including
, as depicted in
Figure 4. Each double requires 64 bits to be stored in memory with a mantissa of the “double” data type.
1 bit
Sign | 11 bits
Exponent | 52 bits
Mantissa |
The key’s first half includes the CLM parameters, r and x. Starting with r, which should take a value in the period , the difference between these two values is 0.43, a double value that can be stored in the mantissa part of the double, and these are the optimal values for the CLM. Since the mantissa is 52 bits long (see image above), the number of different binary numbers representable is . Thus, the range of values of r can be computed as . Thus, taking into account all the range of values for r, this yields:
different possible values.
Following the same procedure for the second CLM parameter, x, which can take any value in the interval
, and since the difference is 1, this will result in a total of
distinct possible values. As for the second half of the key, which includes the initial values for the chaotic Hénon map parameters,
and
, these can take values that lie in the polygon (ABCD) with points
A (−1.33, 0.42),
B (1.32, 0.133),
C (1.245, −0.14), and
D (−1.06, −0.5), as shown in
Figure 5.
The area of the polygon (ABCD) is , and the number of possible points inside the area, which can be used as initial values, is proportional to the area of the polygon (ABCD) and their representation in double. Thus, represents the interval between −1 and 1, and represents the interval from −0.5 to 0.5. The number of double values between −1 and 1 is , and the number of double values between −0.5 and 0.5 is . Thus, has over representations. Therefore, the search space > .
4. Results and Discussion
4.1. Image Quality Analysis
In image processing activities, especially image encryption, metrics like the peak signal-to-noise ratio, Mean Square Error (MSE), Structural Similarity Index Measure, and Unified Average Changing Intensity are essential. Their widespread adoption underscores their paramount significance within this field.
The average squared deviations between the original and encrypted images are measured using the MSE. A higher degree of similarity between the two images is indicated by a lower MSE. While the MSE alone does not fully encapsulate an image’s perceptual quality, combined with other metrics, it provides a more comprehensive assessment, bolstering our confidence in the evaluation process.
The peak signal-to-noise ratio (PSNR) assesses the relationship between the maximum possible signal and the noise power that influences the fidelity of the image representation. It considers the root-mean-square error (RMSE) ratio between the original and encrypted images to the highest pixel intensity. A higher PSNR score indicates greater similarity between the encrypted and original images.
In the context of image encryption, these metrics serve as instrumental tools in evaluating the quality of the encrypted image and assessing the efficacy of the encryption algorithm in preserving the image’s content. They not only guide us in assessing the performance of an image encryption algorithm but also empower us to make informed decisions when selecting the most suitable algorithm for a specific application. Equations (
5) and (
6) are used to calculate these metrics [
6]:
where
stands for the pixel value from the original picture,
stands for the pixel value from the transmitted image,
m represents the number of rows, and
n represents the number of columns in the cover image.
where
represents the maximum signal value in the original reference image, which is “known to be good”.
The UACI (Unified Average Changing Intensity) metric is essential for assessing the effectiveness of image encryption algorithms, specifically in altering pixel intensities. Equation (
7) presents the formula for UACI, where
denotes the dimensions of the images (
I,
K) being compared. Additionally, the Number of Pixels Change Rate (NPCR) is another important measure, with its mathematical expression provided in Equation (
8) [
6]:
where
The Unified Average Changing Intensity (UACI) metric is a crucial instrument in image encryption. It evaluates the effectiveness of encryption algorithms and improves techniques for maximum security and attack resistance. UACI quantifies the average variation in pixel intensity between an original image and its encrypted counterpart, providing valuable insights into the uniform distribution of pixel values within the encrypted image. A more secure encryption result is produced when the encryption technology has effectively distributed pixel intensities, as indicated by a higher UACI score.
A well-known statistic in image processing for assessing the effectiveness of image encryption methods is the Structural Similarity Index Measure (SSIM), which compares the structural similarity of the original and encrypted images. Unlike metrics such as the MSE or PSNR, which primarily focus on pixel-level discrepancies, the SSIM incorporates factors that align with human visual perception, including contrast, structural information, and luminance. An efficient technique for image encryption should provide encrypted images that are visually different from the original and devoid of any obvious patterns or connections. The SSIM is a quantifiable measure of encryption performance, assessing the structural similarity between the original and encrypted images. A low SSIM indicates that the encryption method has effectively obscured the structural details of the original image, thereby thwarting potential attackers from reconstructing the original image or extracting valuable information. As a result, the SSIM is an essential part of creating and assessing image encryption techniques, helping practitioners and academics optimize algorithms to improve security and protect privacy. Equation (
9) expresses the SSIM calculation:
In this context, and represent the pixel sample means of images x and y, respectively. Similarly, and denote the variances of images x and y, while refers to the covariance between the two images. The terms and are constants introduced to prevent division by a very small denominator. Here, L represents the dynamic range of pixel values, calculated as . By default, the constants are set to and .
Table 2 presents the two critical quality metrics, the Mean Square Error (MSE) and peak signal-to-noise ratio (PSNR), used to assess the performance of the encryption algorithm. A greater disparity between the original and encrypted images indicates improved encryption performance, denoted by a lower MSE value. This disparity suggests that the encrypted image is significantly different from the original, making decryption more difficult for unauthorized users. Conversely, a lower PSNR value denotes increased noise or distortion in the encrypted image compared to the original, unencrypted image.
Table 3 provides a comprehensive evaluation of the proposed encryption method, encompassing metrics such as the Structural Similarity Index Measure (SSIM), Unified Average Changing Intensity (UACI), and Number of Pixels Change Rate (NPCR). This meticulous evaluation, as presented in
Table 3, highlights the method’s performance, offering a nuanced understanding of its efficacy and resilience to potential vulnerabilities. The comprehensive nature of this evaluation reinforces the research’s credibility and the results’ reliability.
4.2. Histogram Analysis
Histogram analysis is a vital part of evaluating image encryption methods. By comparing the histograms of the original and encrypted images, we can assess how well an encryption algorithm disguises the original image’s statistical properties. This technique focuses on factors such as intensity levels and pixel distributions. It plays a crucial role in determining the strength and efficacy of encryption algorithms, ensuring that the encrypted images resist attacks while exhibiting high entropy and a uniform distribution. The security and effectiveness of encrypted images have been significantly improved by recent advances in image encryption, which have given rise to novel approaches like deep learning and chaotic maps. These advancements ensure that encrypted images show no discernible patterns, making them highly resistant to statistical attacks. This improved security is crucial for protecting sensitive information in various applications [
19,
43].
Figure 6 illustrates the histograms of both the original and encrypted images. The histogram of the encrypted image shows a more even distribution of pixel values, resulting in nearly uniform probabilities across all intensity levels.
4.3. Speed Analysis
Table 4 provides information on the performance of the proposed encryption technique by detailing the image index, encryption time, and throughput for each image. The data reflect the method’s efficiency, with an average encryption time of 3.238 s across all tested images. This demonstrates the method’s ability to encrypt images rapidly, making it well suited for scenarios where time efficiency is paramount. Furthermore, the table reports an average throughput of 0.3868 Mbps, emphasizing the method’s strong data-processing capabilities. This impressive performance can assure the reader of the method’s effectiveness in securely encrypting image data without causing significant delays.
4.4. Correlation Analysis
The linear relationship between two images is measured by the correlation coefficient (CC), which assesses the similarity between the pixel values of an encrypted image and its original counterpart. A higher CC value indicates a stronger correlation between the two images. The formula for calculating the CC is given by Equation (
10) [
6]:
where
and
are the pixel values of the first and second images,
and
are their respective means, and
n is the number of pixels in the images.
Table 5 shows the calculated CC values between the encrypted and original images using the proposed method for each color channel. The extremely low values of the CC confirm the absence of any notable relationship between the two images. An example result where the CC value between two image files indicates the relationship between their gray levels is shown in
Figure 7. The CCs for consecutive pixels that are horizontal, vertical, and diagonal in a variety of plain images and their encrypted equivalents are shown in
Table 5. These coefficients range from
to 1, with 1 indicating a perfect positive correlation between neighboring pixel pairs,
indicating a perfect negative correlation, and 0 indicating no correlation. Higher correlation coefficients signify stronger relationships between adjacent pixels, leading to lower randomness in pixel distribution. The table demonstrates that the original images exhibit high correlation coefficients, whereas the encrypted images show significantly reduced coefficients, reflecting increased randomness and decreased similarity between pixel pairs.
Table 6 demonstrates the correlation coefficients, indicating how the encryption process significantly reduces the correlation between adjacent pixels, thus ensuring increased randomness and security in the encrypted images. This reduction in correlation is essential for making the encrypted images resistant to statistical attacks. These coefficients, which range between
and 1, reflect the degree of correlation between neighboring pixel pairs: 1 represents a perfect correlation, while 0 signifies no correlation. Higher values indicate a stronger connection between adjacent pixels, increasing pixel arrangement randomness. The table reveals that the original images have high correlation coefficients, whereas the encrypted images display significantly lower values. This substantial reduction in correlation coefficients for the encrypted images highlights increased randomness and emphasizes the role of encryption in altering the original image structure.
Figure 7 shows the horizontal, vertical, and diagonal correlations between adjacent pixels in both the original and encrypted images processed using the proposed encryption technique. The figure includes the correlation coefficients for these directions before and after encryption, demonstrating how the encryption technique effectively reduces the correlation among adjacent pixels, thus enhancing the randomness and security of the encrypted images. As
Figure 7 shows, the encrypted image displays minimal correlation among neighboring pixels, contrasting sharply with the strong correlation in the original color image. This indicates that the encryption method effectively reduces pixel correlation, thereby increasing the difficulty for attackers in reconstructing the original image. More importantly, the proposed approach demonstrates robust resistance to various attack strategies, underscoring its security.
4.5. Information Entropy Analysis
Information entropy analysis plays a pivotal role in evaluating the security and performance of image encryption algorithms. This measure assesses the level of randomness or unpredictability in a dataset. Specifically, image encryption measures the unpredictability of pixel values in an image. A higher entropy value indicates a more uniform distribution of pixel intensities. This uniformity makes it harder for attackers to detect patterns or predict pixel values, making the encrypted image more challenging for attackers to analyze or decrypt by recognizing patterns. Consequently, a high entropy value means that the encryption technique effectively conceals the information in the original image and offers a robust defense against different types of attacks [
44,
45]. Information entropy analysis involves determining and comparing the entropy values of the original and encrypted images to assess an encryption algorithm. An efficient encryption method should result in encryption with an entropy value nearing the theoretical maximum for 8-bit images. Achieving a high entropy value is a paramount indicator that an encryption method is performing effectively by producing a secure and impenetrable encrypted image. Equation (
11) provides the formula for calculating information entropy:
where
represents the likelihood that the pixel intensity
i will exist in the image and
represents the information entropy of the image. In an 8-bit grayscale image, the summing covers all potential pixel intensity values between 0 and 255. The entropy values for both plain and encrypted images are shown in
Table 7. Plain and encrypted images obtained mean entropy values of 7.1149 and 7.8879, respectively. The noticeably higher entropy values of the encrypted images show that the encryption procedure was successful in adding a significant amount of randomness, which improves the security of the final encrypted images.
Table 8 compares the
H (information entropy) values for several algorithms, including the proposed method and six benchmark alternatives. The proposed method achieved an
H value of 7.8879. This table provides a detailed breakdown of the results, offering a clear and thorough understanding of the data.
4.6. Key Sensitivity Analysis
In order to test the robustness of the proposed method against any slight change in the key, a small experiment was conducted where the key used for encryption was slightly modified and then used in the decryption phase.
Table 9 illustrates the difference between using the correct, identical key in both the encryption and decryption phases and using a key with slight changes in both phases. Results show that this minor change in the key produces a significant impact on the decrypted image, as shown in
Figure 8.
4.7. Robustness Analysis
4.7.1. Special Plain-Image Attacks
The proposed encryption technique was used to encode simple black-and-white images in a recent experiment. Certain images were chosen as inputs, and the test images were similar in size to those in the cited dataset, measuring 512 × 768 × 3. The findings indicate that the information entropy of the encrypted images increased significantly compared to that of the plaintext images, reaching values nearly equal to the theoretical maximum.
Figure 9 and
Figure 10 present the encryption results for selected plaintext images using the proposed method. In
Figure 9, an entirely black image is encrypted, showcasing how the technique transforms a uniform black image into a randomized pattern, effectively obscuring any trace of the original content. Similarly,
Figure 10 displays the encryption of an all-white image, where the uniform white pixels are converted into a chaotic, unrecognizable encrypted form. These examples emphasize the algorithm’s robustness against attacks on plaintext images with uniform values, ensuring secure encryption without exposing identifiable patterns or hints of the original image.
Table 10 presents a comprehensive analysis of the encryption and decryption operations for all-black and all-white images, using various metrics to evaluate the performance of the proposed encryption method. These metrics include the MSE, PSNR, UACI, NPCR, SSIM, and information entropy. The results indicate that the information entropy of the cipher images increased significantly compared to that of the plaintext images, reaching a value of 7.99, which is very close to the theoretical maximum of 8. This high entropy value suggests that the encryption method effectively transformed the plaintext images into cipher images with highly unpredictable and random distributions, enhancing security. The other metrics, such as the MSE, PSNR, UACI, NPCR, and SSIM, further demonstrate the robustness and effectiveness of the encryption process in altering the original image characteristics while maintaining the integrity of the decryption process.
4.7.2. Salt-and-Pepper Noise
Salt-and-pepper noise, or randomly distributed black-and-white pixels, can significantly reduce image quality and disrupt image encryption methods. Researchers frequently add different amounts of salt-and-pepper noise to images to test how resilient these systems are to this kind of noise. They then evaluate how well the system can reduce or correct the distortions that arise. Noise reduction techniques, such as median, mean, and adaptive filtering, are often applied and evaluated to determine their efficacy in handling this noise. Quantitative metrics like the Mean Square Error (MSE) and peak signal-to-noise ratio (PSNR) are used to measure the system’s robustness under different noise levels. Carrying out a comprehensive robustness study can find possible flaws in image encryption systems and improve their dependability by creating algorithms that are resistant to noise, guaranteeing reliable and accurate performance in real-world situations [
7].
The robustness of the proposed encryption method against salt-and-pepper noise is evaluated in
Table 11 and
Figure 11.
Table 11 presents the calculated PSNR and MSE values, comparing noisy encrypted images to the original versions. As the noise intensity increases, the PSNR values drop, reflecting reduced image reconstruction quality, while the MSE values rise, indicating more significant errors and distortions. A higher PSNR corresponds to better reconstruction accuracy, whereas a lower MSE indicates fewer discrepancies between the original and noisy images. The data in
Table 11 confirm that the proposed encryption system effectively withstands salt-and-pepper noise, preserving the quality of decrypted images, even under substantial noise levels.
Figure 11 demonstrates the effect of incorporating salt-and-pepper noise at varying levels into an encrypted image. Even with noise, the decrypted images maintain a high level of similarity to the original ones, highlighting the method’s ability to retain image quality and fidelity. The efficiency of the proposed method in reducing the effects of noise is confirmed by the strong alignment between the original and decrypted images, acting as a reliable anti-noise algorithm. These findings emphasize the robustness and dependability of the encryption system in managing noise interference, ensuring accurate image reconstruction.
4.7.3. Gaussian Noise Attack
Gaussian noise is a type of statistical noise that follows a Gaussian distribution, also known as a normal distribution. This noise is characterized by its probability density function, defined by the mean and standard deviation of the noise values. In digital images, Gaussian noise typically arises during acquisition due to sensor noise, which can be caused by poor lighting conditions or high temperatures, and during transmission due to electronic circuit noise. Gaussian noise in images results in random variations in pixel values, which can affect the quality and clarity of the image. Gaussian noise can be mitigated in image processing using various filtering techniques, such as Gaussian smoothing. However, these methods may inadvertently blur fine details and edges in the image [
7].
Table 12 analyzes the effectiveness of the proposed method using various Gaussian noise levels by examining the PSNR and MSE metrics. These metrics assess how effectively the encryption technique maintains the integrity of encrypted images when noise is present. With higher noise levels, the PSNR values generally decline, signifying a decrease in image quality, while the MSE values rise, indicating increased error and distortion.
Figure 12 illustrates the impact of different Gaussian noise levels on an encrypted image. Even with added noise, the decrypted images closely resemble the original ones, demonstrating the method’s ability to maintain image integrity. The positive results highlight a strong correlation between the original and decrypted images, verifying the encryption method’s resilience to Gaussian noise. This robustness ensures the accurate recovery of the original image, even under significant noise conditions.
4.7.4. Occlusion Attacks
Occlusion attacks, which involve partially obstructing or covering parts of an image, can pose significant challenges to image encryption systems. Our study shows that the proposed algorithm can effectively withstand up to 50% occlusion attacks.
Figure 13 and
Figure 14 illustrate the effects of occlusion on decrypted images, showing results from encrypted images with varying levels of occlusion: 5%, 25%, and 50%. In these cases, although the decrypted images exhibit some distortion, they remain recognizable to the human eye, indicating the resilience of the proposed encryption method. Beyond 50% occlusion, the decrypted images become unrecognizable, suggesting that the method’s robustness is compromised. These findings underscore the importance of the proposed method’s balance between security and image recognizability, making it highly relevant for applications where partial image loss is a concern.
Table 13 analyzes how different levels of occlusion impact various image quality metrics, including the SSIM, PSNR, and MSE. The data clearly show that as there is a rise in the occlusion, these metrics decline. At 0% occlusion, the SSIM is high at 1, indicating excellent similarity to the original image. At the same time, the MSE is low at 0, and the PSNR is high at
∞, reflecting minimal distortion and high image quality. As the occlusion increases to 5%, 10%, and 25%, the SSIM decreases to 0.765, 0.6511, and 0.3977, respectively, showing a progressive decline in structural similarity. Concurrently, the MSE rises to 527.6988, 927.653, and
, indicating increasing error, and the PSNR drops to 488.14, 42.4987, and 33.4866, reflecting reduced image quality. At 75% occlusion, the SSIM plummets to 0.0782, the MSE surges to
, and the PSNR falls to 22.4474, highlighting significant degradation. These results illustrate the method’s ability to maintain some level of image quality up to 50% occlusion, beyond which the quality metrics indicate substantial deterioration.
4.7.5. Clipping Attacks
Clipping attacks involve altering the dynamic range of an image by truncating pixel values, which can lead to a loss of detail and contrast, potentially compromising the effectiveness of image encryption systems [
7].
Table 14 and
Figure 15 clearly show that the algorithm is robust against clipping attacks, particularly when the changes in dynamic range values are minor. As the clipping range increases, various quality metrics show degradation in their values, indicating some loss of image quality. Despite this degradation, the recovered images remain understandable to the human eye, suggesting that the images’ essential features and overall structure are preserved. This robustness is crucial for applications where maintaining the recognizability of an image is important, even in the presence of attacks that alter its dynamic range. The data in
Table 14 and the visual representations in
Figure 15 confirm that the proposed method can effectively withstand clipping attacks, ensuring that the decrypted images retain sufficient quality for human interpretation, even under conditions of increased clipping.
4.8. Test
A crucial technique used to evaluate the independence of variables and the regularity of data distribution in image cryptosystems is the Chi-square () test. This test, which compares the frequency distribution of pixel values to a theoretically uniform distribution, is crucial for assessing the randomness and security of encrypted images. For encryption approaches like chaos-based and DNA-based systems, where attaining a high degree of unpredictability and efficient pixel value diffusion is essential for guaranteeing strong security, such an analysis is essential. Greater randomness and better encryption quality are indicated by lower Chi-square values, which show how well the encryption process can mask the original image’s statistical properties and maintain robust security.
Table 15 illustrates the results of the Chi-square test, offering a quantitative evaluation of the encryption method by comparing pixel intensity distributions between the original and encrypted images. The table reveals a marked difference, with encrypted images exhibiting significantly smaller Chi-square values than the original images. This result provides compelling evidence that the encryption method effectively secures images, underscoring its reliability and instilling confidence in its performance.
5. Conclusions
In conclusion, this study significantly contributes to image encryption by developing and validating an integrated chaos-based algorithm. This algorithm, which combines the chaotic Hénon map and chaotic logistic map (CLM), represents a unique approach to enhancing the security of digital image communication. The method’s innovation lies in using chaos theory to generate cryptographic keys, utilizing 1D and 2D key generators. This approach proves highly effective in producing complex and unpredictable keys essential for robust encryption. The algorithm’s resilience against various potential attacks, including chosen-plaintext, noise, clipping, occlusion, and known-plaintext attacks, is demonstrated through extensive experimentation and rigorous performance evaluations. The comprehensive analysis of encryption time, throughput, and various image quality metrics further substantiates the effectiveness and efficiency of this integrated approach. The chaotic Hénon–logistic map integration emerges as a powerful and secure method for safeguarding digital images during transmission and storage, offering significant potential for real-world applications in secure image sharing, cloud storage, and digital forensics. As the demand for robust image encryption continues to grow in our increasingly digital world, this research contributes a valuable tool to the field of information security, paving the way for more secure and reliable image communication systems. Future work could explore the adaptation of this algorithm to other types of digital media and its integration into existing cybersecurity frameworks to further enhance its practical applicability and impact.


