Abstract
On 10 August 2025, a powerful earthquake (Mw = 6.1) occurred in Balıkesir, located within the Aegean Graben System, one of Türkiye’s major tectonic elements, and was felt across a very wide region. This study presents a comprehensive assessment of the seismotectonic characteristics, recorded ground motions, and observed structural performance during this earthquake, focusing specifically on implications for regional seismic hazard assessment. Peak ground acceleration values obtained from local accelerometer stations were compared with predicted peak ground accelerations. The study also conducted comparisons for Balıkesir districts using the two most recent earthquake hazard maps used in Türkiye. Comparative hazard analyses revealed whether existing seismic hazard maps adequately represent Balıkesir. The findings highlight the need for region-specific hazard model updates, improved implementation of earthquake-resistant design rules, and targeted retrofit strategies to mitigate future earthquake risk. The methodology adopted in this study involved comparative hazard analysis using the last two seismic hazard maps, evaluation of PGA’s across 20 districts of Balıkesir Province, and a field-based survey of structural damage. This integrative approach ensured that both seismological and engineering perspectives were comprehensively addressed.
1. Introduction
Geo-hazards are a geological or environmental condition arising from short- or long-term geological processes that have the potential to cause significant damage or loss of life and property. Earthquake characteristics, local ground conditions, and the properties of the existing building stock directly affect the intensity and destructiveness of earthquakes resulting from energy accumulation and sudden releases within the Earth’s crust. Therefore, any work conducted before and after an earthquake can make a critical contribution to seismic risk assessment and building safety planning. After the devastating earthquakes that occurred in different parts of the world, each study conducted within the scope of earthquake and civil engineering is considered a case study [1,2,3,4,5,6]. These studies provide critical data for more realistically identifying risk areas, assessing damage, assessing building safety, and improving disaster management strategies. These processes significantly contribute to both earthquake risk reduction and the rapid and safe recovery of society. Moreover, such studies provide the scientific basis for determining the vulnerability of building stock to seismic hazards, preparing microzonation maps, and developing earthquake risk reduction strategies. Thus, geohazard analyses not only enhance safety in engineering design but also become an indispensable tool for urban planning, disaster preparedness, and early warning systems [7,8,9,10,11,12,13,14,15,16,17]. Türkiye, located in one of the most active earthquake zones in the world, was shaken once again by the Sındırgı (Balıkesir) (Mw = 6.1) earthquake on 10 August 2025, following the devastating Kahramanmaraş earthquakes (Mw = 7.7 and Mw = 7.6) on 6 February 2023.
Türkiye has a complex tectonic structure due to its location in the convergence zone of the Eurasian and African plates and is located on the Alpine–Himalayan seismic belt, one of the most important earthquake belts in the world. The Anatolian Peninsula, which is under N-S compressive stresses between the Eurasian continent in the north and the African–Arabian continent in the south, moves first in direction and then rotationally towards the west and southwest. During this active tectonic process, large and destructive earthquakes occur as a result of the discharge of stress energy accumulated in the North Anatolian Fault Zone (NAFZ) and East Anatolian Fault Zone (EAFZ) regions (Figure 1). Western Anatolia, on the other hand, is characterized by an extensive active fault network predominantly associated with the Western Anatolian Graben System (WAGS) and the southern branches of the North Anatolian Fault Zone (NAFZ) [18,19,20,21,22,23].
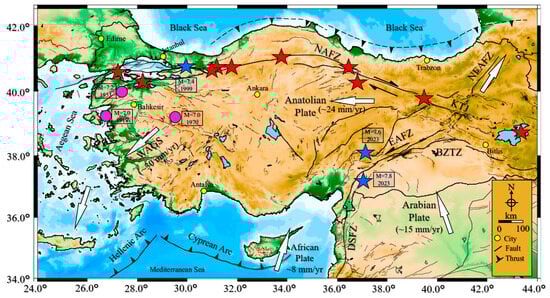
Figure 1.
The main tectonic elements of Türkiye (modified from [24,25,26,27]). Active faults (black lines) and plate velocities (mm/yr) were taken from Reilinger et al. [27] and Emre et al. [28]. Red stars represent earthquakes that occurred during the instrumental period (taken from KOERI). Abbreviations: BZTZ: Bitlis–Zagros Thrust Zone, NAFZ: Northern Anatolian Fault Zone, NEAFZ: Northeast Anatolian Fault Zone, EAFZ: East Anatolian Fault Zone, DSFZ: Dead Sea Fault Zone, KTJ: Karlıova Triple Junction, WAGS: West Anatolian Graben System. This figure was obtained using GMT [29]. Topography model was taken from National centers for Environmental information (NOAA).
The southern part of Western Anatolia expands towards the southeast and the northern part expands towards the north. The Aegean Region, where seismic activity is very intense, has been exposed to destructive earthquakes throughout history due to the westward movement of the Anatolian plate, at the extreme end. Seismicity is high compared to the graben structure in Western Anatolia and shows cluster-type activity with remarkable low-magnitude earthquake groups depending on the region-time. The Aegean Graben System consists of many blocks bounded by normal faults in the east–west direction.
A strong earthquake with an instrumental magnitude of Mw = 6.1 occurred in western Türkiye on 10 August 2025, at 19:53 local time with the epicenter in Sındırgı (Balıkesir) and was felt significantly in İstanbul, İzmir, Yalova, Bursa, Çanakkale, Tekirdag, and many other provinces. Studies conducted by the relevant ministry determined that following the earthquake, one person lost her life, 29 people were injured, one building collapsed, 16 structures were severely damaged, and 61 structures were slightly damaged. In this study, the Balıkesir earthquake was examined in detail in terms of earthquake and civil engineering.
After experiencing an earthquake, conducting field observations, damage assessment studies, and rapid evaluation methods are highly important for the advancement of earthquake engineering knowledge. Evidence from past destructive earthquakes has demonstrated that the distribution of damage is governed not only by local site effects and soil–structure interaction, but also by construction quality and material characteristics. In this regard, post-earthquake investigations following the 2012 Emilia event have provided comprehensive insights into the seismic performance and failure mechanisms of precast reinforced concrete and industrial structures [30,31,32,33]. Furthermore, studies addressing secondary hazards such as soil liquefaction contribute substantially to the development of strategies for understanding post-disaster risks, as assessments conducted in diverse regions worldwide yield valuable insights into liquefaction phenomena and support the advancement of risk reduction and emergency response planning [34,35,36,37,38,39,40]. Moreover, detailed studies conducted after the 2023 Kahramanmaraş earthquakes have provided important insights into structural damage, regional variations, and seismic performance of reinforced concrete buildings, contributing to the understanding of the earthquake’s effects on building behavior [41,42,43]. Also, studies examining secondary hazards such as soil liquefaction make significant contributions to the development of strategies aimed at understanding post-disaster risks, as assessments conducted in different regions around the world provide highly valuable insights into liquefaction phenomena and help improve risk reduction and emergency response planning [44,45,46,47,48,49,50,51]. Comparative studies of seismic hazard in regions with similar tectonic settings, highlight the importance of interregional evaluations for understanding local seismic risk. Moreover, recent advancements in post-earthquake rapid damage assessment, including AI-driven image recognition, remote sensing, and rapid visual survey tools, have proven to be essential in enhancing preparedness and improving disaster response strategies. Incorporating these insights strengthens the scientific and practical relevance of seismic hazard research in Balıkesir.
Post-earthquake ground motion and damage assessment studies provide the basis for developing future risk reduction strategies by scientifically demonstrating the severity of the disaster, structural performance, and soil-structure interactions. These studies are critical for both improving engineering design criteria and developing rapid and accurate post-disaster response plans. This study aims to examine the ground motions immediately following the August 10 Sındırgı (Balıkesir) earthquake in detail and to determine whether the seismic hazard for Balıkesir province and its districts, the epicenter of the earthquake, is adequately represented. Intensity values for the earthquake epicenter were obtained using different magnitude-intensity relationships. In this study, limited damage samples obtained from field observations were evaluated within the context of earthquake and civil engineering. The obtained results were interpreted, and recommendations were made.
2. Methodology
2.1. Seismicity of the Study Area and 2025-Sındırgı (Balıkesir) Earthquake (Mw = 6.1)
The boundaries of the Balıkesir province are predominantly defined by active faults and fault zones that have developed within the extensional tectonic regime of Western Anatolia. As can be seen from the active fault map of Türkiye prepared by Emre et al. [22], active faults and fault zones exist both within and around the provincial borders (Figure 2). Within the provincial borders, Balıkesir fault, Havran-Balya fault zone, Yenice-Gönen fault, Edremit fault zone, Manyas fault, Susurluk fault, Gelenbe fault zone, Düvertepe fault zone, and Simav fault zone are important tectonic structures. Outside the provincial borders, in the north-northwest, are the Biga-Çan Fault Zone, Evciler fault, Sarıköy fault, Kestanbol fault, and Mustafa Kemal Paşa fault. In the east-northeast are the Bursa fault, the İnegöl fault zone, the Soğukpınar fault, the Oylat fault, the Dodurga fault, the Kütahya fault, and the Emet-Gediz fault zone. In the southwest are the Gediz graben system (~150 km long), the Soma-Kırkağaç fault zone, the Güzelhisar fault, the Menemen fault zone, and the Seferhisar fault. The Simav fault also extends along the southeast, intersecting with the Çivril graben system. The fault segments in the region generally strike NE-SW and NW-SE and are generally right-lateral strike-slip and normal faults. The Simav fault zone, one of the important tectonic structures in the region, is a right-lateral strike-slip fault and is 205 km long.
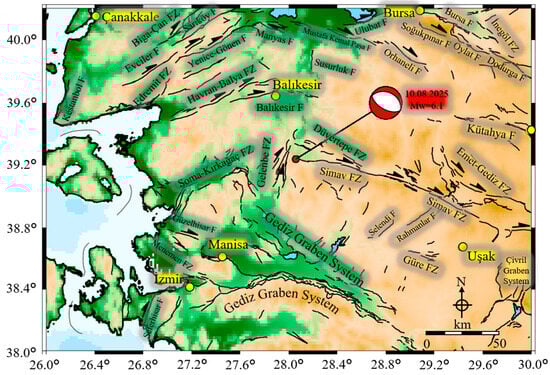
Figure 2.
The local active faults and tectonic units of the west Anatolian region (modified from Emre et al. [28]). The red focal mechanism solution indicates the epicenter of the August 10 earthquake (taken from AFAD). Yellow circles represent city centers. F: Fault, FZ: Fault Zone.
During the historical period approximately 116 earthquakes with intensities ranging from Io = VII–X occurred in the vicinity of Balıkesir, and six of these earthquakes were estimated to have intensities of Io = X (Figure 3). Among the earthquakes that occurred during the historical period, destructive/damaging earthquakes (Io = VII–VIII) were recorded in 1860, 1815, 1870, and 1897 [52]. In general, historical earthquake data appear to be concentrated around the Gediz Graben System, the Aegean Sea offshore, and the southern branch of the North Anatolian Fault Zone. During the historical period, approximately 116 earthquakes with intensities ranging from Io = VII–X occurred in the vicinity of the study area, and six of these earthquakes were estimated to have intensities of Io = X (Figure 3). Among the earthquakes that occurred during the historical period, destructive/damaging earthquakes (Io = VII–VIII) were recorded in 1860, 1815, 1870, and 1897 [52].
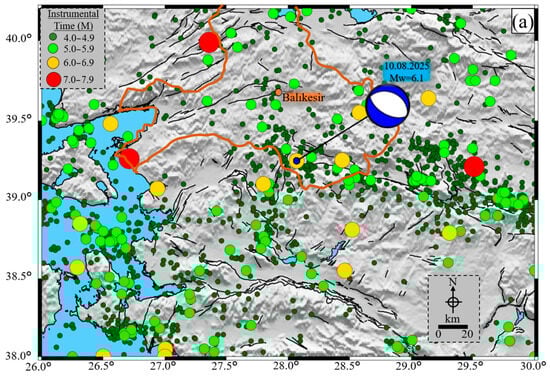
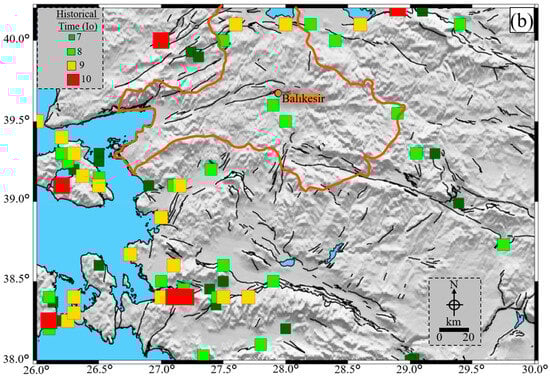
Figure 3.
Geographical distribution of earthquakes (a) in the instrumental period (1 January 1900–20 August 2025) and (b) historical (0–1899 AD) within the Western Anatolian Region (compiled from AFAD website [53]. The orange solid line encloses of Balıkesir province. The blue beach ball indicates the epicenter of the August 10 earthquake (taken from AFAD).
During the instrumental period (1900–2025, M ≥ 7.0), three large earthquakes occurred in the immediate vicinity of the study area (Figure 1 (purple circles) and Figure 3 (red circles)). The 1919 Ayvalık earthquake (Mw = 7.0) and the 1953 Yenice-Gönen earthquake (Mw = 7.2) are particularly noteworthy as these. In addition to these two earthquakes, the 1970 Gediz (Kütahya) earthquake (Mw = 7.2) was another destructive earthquake recorded in the region. These earthquakes occurred within the borders of neighboring provinces in the north-northeast and south-southeast. Fifteen earthquakes with magnitudes of 6.0 ≤ M ≤ 6.9 were scattered around the provincial borders. Apart from this, medium-sized earthquakes are generally clustered around main fault zones (such as the Simav Fault Zone, Gelenbe Fault Zone, Düvertepe Fault Zone, and Soma-Kırkağaç Fault Zone) and important tectonic structures (Gediz Graben System, Aegean Sea).
Gündoğdu et al. [54] identified a four-phase tectonic regime representing the Neotectonic Period in their kinematic studies around the Sındırgı segment of the Simav Fault Zone. This tectonic system exhibits NE-SW compression, NW-SE extension, NW-SE compression, and NNE-SSW extension. The focal mechanism analysis results of the earthquakes indicate that the extension direction in the region is N31° E, and that a NNE-SSW extensional regime predominates today. Historical and instrumental seismicity patterns indicate that the western segments of the Simav Fault and adjacent graben systems exhibit a recurrence of Mw ≥ 6.0 earthquakes within relatively short intervals. Stress transfer between fault segments suggests the existence of potential seismic gaps, where future events may occur.
On 10 August 2025, at 7:53 p.m. local time, an earthquake with a magnitude of Mw 6.1 occurred with its epicenter in Sındırgı (Balıkesir). The epicenter of this earthquake, which occurred at a depth of 11.0 km, was recorded as the Sındırgı district of Balıkesir province. During the earthquake, one casualty was reported, while 457 residences, 58 workplaces, and 5 barns in Sındırgı, along with 62 residences, 8 workplaces, and 20 barns in Manisa, were severely damaged or destroyed. Almost 10,000 aftershocks with instrumental magnitudes ranging from 1.0 to 5.1 were recorded from the main shock until 23 September 2025. Of these earthquakes, approximately 9400 had magnitudes below 3.0, around 500 ranged between 3.0 and 3.9, and about 30 occurred within the 4.0 to 4.9 range (Figure 4). When the depths of the main and aftershocks are examined, the resulting seismic activity should be considered shallow. Focal mechanism analyses by earthquake institutes such as AFAD, KOERI, GCMT, and USGS all indicate that the earthquake was of a normal fault.
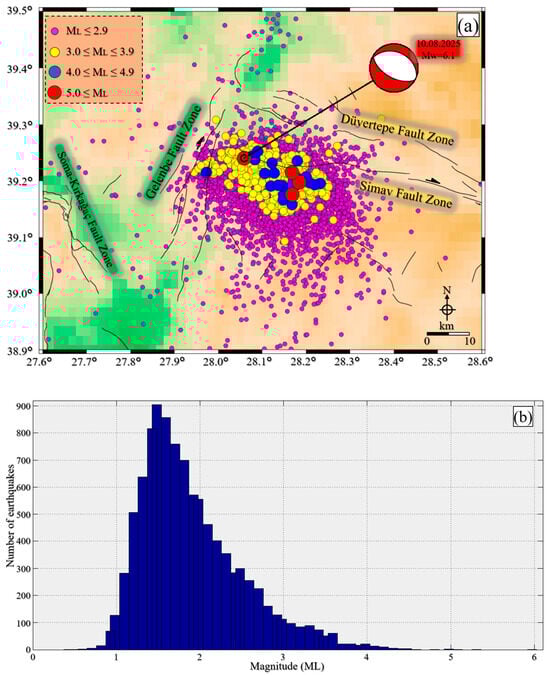
Figure 4.
(a) Aftershock locations of ~10,000 after the Balıkesir main shock (Mw = 6.1) between 10 August 2025, and 23 September 2025. The magnitudes of events are represented by different circles. The catalogue information and fault-plane solution (red beach ball) were taken from the KOERI website [55]. The active fault database is taken from Emre et al. [28]. (b) The relationship of magnitude (ML)-number of earthquakes that occurred in the region between 10 August 2025, and 23 September 2025.
2.2. Comparison of Acceleration Spectra
The E-W and N-S components of the ground acceleration recorded at selected stations during the Balıkesir earthquake are presented in Figure 5. While multiple records of the event are available, the stations shown here were chosen due to their proximity to the epi-center and because they recorded the highest peak ground accelerations. The peak ground accelerations at these stations did not exceed 0.30 g in either the E-W or N-S directions. Figure 6 shows the spectral accelerations derived from these records, compared with the design spectra defined in the Turkish Building Earthquake Code (TBEC-2018) [56] for DD-1 (2475-year return period) and DD-2 (475-year return period) earthquake levels and soil classes ZC and ZD, assuming 5% damping. Accordingly, the recorded accelerations remained well below the DD-1 and DD-2 design levels, indicating that, for the considered stations, the seismic demand generated by this event did not surpass the code-based de-sign spectra.
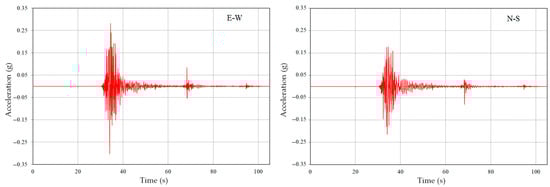
Figure 5.
E–W and N–S components of recorded ground accelerations at Station 1015 (Balıkesir–Sındırgı; 39.2546° N, 28.1644° E) during the Balıkesir earthquake.
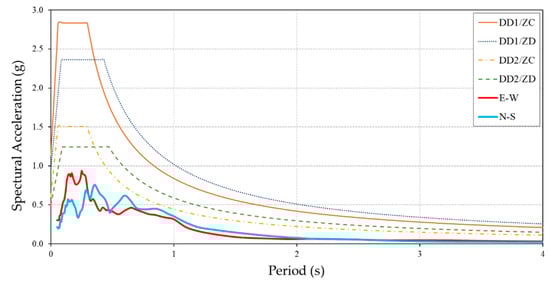
Figure 6.
Elastic response spectra of the Balıkesir earthquake recorded at Station 1015. Red and blue curves show the E–W and N–S ground-motion components, respectively, compared with the Turkish Earthquake Code design spectra DD1/ZC, DD1/ZD, DD2/ZC, and DD2/ZD.
Table 1 presents the accelerometer stations located in the Balıkesir and Manisa provinces, together with their geographical coordinates, recorded acceleration values in North–South, East–West, Vertical components, and the epicenter distances. The number of accelerometer stations is not very high. It is mostly located in urban centers, and acceleration records in rural areas could not be recorded for this reason. However, on the other hand, it would not be very meaningful to define the relationship between the building and the ground based on acceleration records, since the defects related to construction come to the fore in rural areas. Ground accelerations in the vicinity of the epicenter were recorded by 5 stations in Table 1. As seen in the table, the highest acceleration values were recorded at the Sındırgı station in Balıkesir.

Table 1.
Accelerometer stations in the region and the recorded acceleration values.
Furthermore, the site conditions at these stations, predominantly classified as ZC and ZD soil types, may have influenced the amplification of ground motions. A more refined site-response analysis is needed to fully account for soil–structure interaction effects, which could have contributed to the localized damage patterns observed in Balıkesir.
3. Results
3.1. Comparative Analysis of Earthquake Hazard in Balıkesir Province
Türkiye has learned the necessary lessons from the earthquakes it has experienced and has been making changes and updates to both its earthquake hazard maps and seismic design codes over time. In this study, comparisons were made in the Balıkesir province and its districts, taking into account the last two earthquake hazard maps used in the country [57]. To evaluate the implications for seismic hazard mapping, recorded ground motions were compared with hazard levels indicated in the current Türkiye Earthquake Hazard Map (2018) [57] and previous Earthquake Zone Map (1996) [58]. The previous earthquake zone map for Balıkesir province is shown in Figure 7. This map, which was published in 1996, was prepared by considering the maximum acceleration values. Türkiye was divided into five regions and 5th degree region, displaying the lowest acceleration, was <0.1 g, and the 1st degree region, with the highest acceleration, was divided into >0.4 g. Red colors indicate 1st degree earthquake zones.
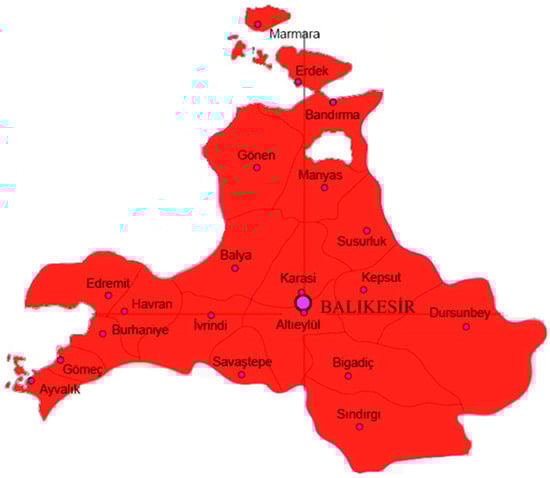
Figure 7.
Previous earthquake zone map of Balıkesir (adopted from [58]).
The previous earthquake zone map, prepared on a regional basis, consisted of five different regions, and the regions with the highest earthquake risk were defined as Region 1. As can be seen from the map, the entire Balıkesir province is located in the 1st degree earthquake zone. With the current seismic design code that came into effect in 2019, the concept of earthquake zone was abolished and replaced by the use of geographical location-specific earthquake hazard map. From this year onwards, the seismic parameters of any geographical location can be obtained using the Interactive Web Earthquake Application (TEHMIWA) [57], which is named Türkiye Earthquake Hazard Maps. According to the current map, the faults and earthquake hazard in Balikesir are shown in Figure 8. The earthquake hazard map of Türkiye, which came into force in 2019, was prepared by taking into account the acceleration values. In this map, a recurrence period of 475 years and the possibility of exceeding it in 50 years are foreseen. As can be seen in Figure 8, yellow colors indicate low acceleration values and red colors represent high acceleration values. The lowest acceleration value was defined as 0.1 g and the highest acceleration value was defined as >0.5 g. Accordingly, the 0.2–0.3 g values recorded in the Sındırgı earthquake were lower than the acceleration values that could be in this region.
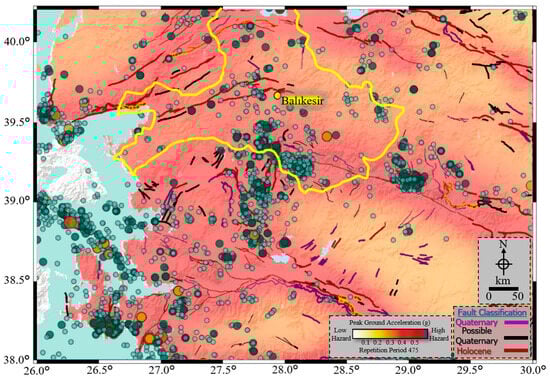
Figure 8.
Current earthquake hazard map of Balıkesir [56]. Green circles represent the epicenters of earthquakes (M ≥ 3.0) from 1976 to the present (taken from AFAD earthquake catalogue). The active fault database is taken from Emre et al. [28]. The yellow continuous line shows the borders of Balıkesir province.
Balıkesir province comprises 20 different districts. The study aims to reflect the heterogeneity of seismic demand across the province by considering each district separately. This will allow for a detailed analysis of the entire province. Seismic parameters obtained for randomly selected geographical locations of 20 different districts of Balıkesir Province were compared using two recent earthquake hazard maps. In the previous map, seismic parameters were determined at a regional scale, while with the current map, seismic parameters can be determined for each geographical location using the Interactive Web Earthquake Application, using different soil classes and exceedance probabilities. Furthermore, four different earthquake ground motion levels were considered in the study: 2%, 10%, 50%, and 68%, with exceedance probabilities within 50 years, in accordance with current earthquake regulations. Information regarding these different ground motion levels is presented in Table 2.
Table 2.
Earthquake ground motion levels in current seismic design code [59].
The standard earthquake ground motion level (50-year probability of exceeding the 10% level) included in both regulations was considered for comparison. The ZC soil class, which is the average soil class in TBEC-2018, was used as the soil class. The PGA and PGV values obtained for different exceedance probabilities for randomly selected locations from 20 districts of Balıkesir province are shown in Table 3.
Table 3.
PGA and PGV’s for selected locations in Balıkesir.
For Balıkesir province, the highest PGA value for a 2% exceedance probability was obtained for Sındırgı with 0.938g. The lowest PGA value for this exceedance probability was obtained for Susurluk with 0.609g. For the selected locations, the PGA for the standard-design ground motion level (DD-2) for Balıkesir province was determined between 0.33 g–0.51 g. For the same earthquake ground motion level (DD-2), the PGV was obtained as 19.670–29.094 cm/s. A comparison of the PGA values obtained for the Balıkesir districts according to the current earthquake hazard map with the PGA values predicted in the previous earthquake zone map is shown in Table 4. This table also compares the design spectrum acceleration coefficients (SDS) predicted in the last two earthquake hazard maps.
Table 4.
The comparison of PGA and SDS over the last two maps [56,59].
The highest change occurred in Sındırgı, the epicenter of this earthquake. PGA values increased in Edremit, Gönen, and Marmara Island, while earthquake hazards decreased in other districts. Design spectral acceleration coefficients were completely changed in the districts of Balıkesir province. The largest change occurred in Sındırgı, while the smallest change occurred in Kepsut. Table 5 shows the comparison of the highest PGA values obtained from the seismometer in Balıkesir after the Sındırgı (Balıkesir) earthquake with the PGA values given in the last two maps.
Table 5.
Comparison of measured and predicted PGAs.
As can be seen in Table 5, the predicted PGAs in the last two earthquake hazard maps used in Türkiye are well above the measured PGAs for this earthquake. This indicates that the earthquake hazard for Balıkesir province and its districts was adequately captured in relation to this event. The acceleration values measured for both earthquakes for all districts were lower than the acceleration values predicted for the standard-design ground motion in the current earthquake hazard map.
Peak Ground Accelerations (PGA) recorded at local accelerometer stations during the Balıkesir earthquake were compared with predicted values obtained from both the 2007 Turkish Seismic Design Code (TSDC-2007) and the 2018 Türkiye Earthquake Hazard Map (TBEC-2018). Recorded accelerations did not exceed 0.40 g, which remained below the code-based design spectra for both DD-1 and DD-2 levels. Measured PGA values for all districts were lower than the design-level accelerations, indicating that the seismic demand of this event did not surpass the expected hazard levels defined by current codes.
In this study, the intensity values of the earthquake in Balıkesir province and its districts were also obtained. For this purpose, the intensity-magnitude decay relationship proposed by Bayrak [60] for Türkiye was used. The proposed decay relationship is given in Equation (1).
log (PGA) = 0.3392 × I − 0.5427
Here, PGA is taken as the peak ground acceleration (cm/s2), while I denotes the earthquake intensity. Since Balıkesir and its districts have recorded earthquake stations, the highest PGA values obtained at these stations were used to obtain the intensity values for each district separately for each earthquake. Similarly, the intensity distribution for the earthquake-affected region, including Balıkesir, was also compared using the relationship established by Büyüksaraç et al. [61], which correlates intensity values to PGA values following the Balıkesir earthquake:
MMI = 3.02 log (PGA) + 1.62
Furthermore, the maximum acceleration values recorded in Balıkesir during both earthquakes were used in Equations (1) and (2) to calculate the corresponding intensity values. The comparison of these intensity values is presented in Table 6.
Table 6.
Intensity values obtained for Balıkesir province and its districts.
In this earthquake, the highest intensity value was obtained as VIII for Sındırgı, the epicenter of the earthquake, while the lowest intensity value was obtained as IV for Erdek. Intensity values estimated from the recorded PGAs using empirical relationships confirmed that maximum shaking intensity reached IX (MMI) in Sındırgı and decreased toward the periphery. This spatial intensity distribution aligns well with the observed damage pattern, which was most pronounced near the epicentral region.
3.2. Field Damage Survey
The Ministry of Environment, Urbanization, and Climate Change reported that 265 independent sections in 152 buildings in Balıkesir were severely damaged or collapsed, while 53 independent sections (all the sections within a building, from apartments to shops, from warehouses to stores, that can be used independently) in 41 buildings in Manisa were severely damaged after the earthquake. All these structural damages show that the structural effects of this earthquake were quite limited. Pre-earthquake images of the reinforced concrete structure where one person lost her life due to total collapse are shown in Figure 9.
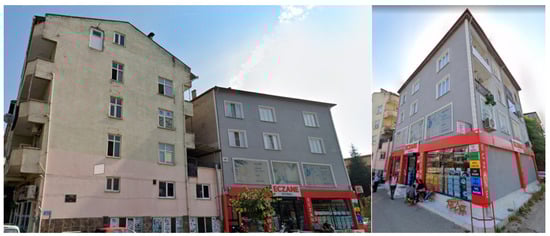
Figure 9.
Pre-earthquake images of the RC structure that totally collapsed.
Post-earthquake images of the building are shown in Figure 10. The images show the severe collapse of a reinforced concrete (RC) building following the Balıkesir earthquake.
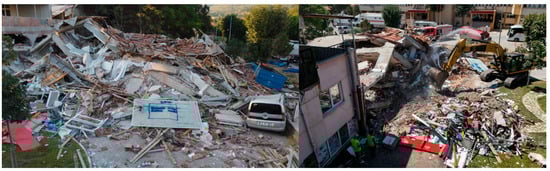
Figure 10.
Post-earthquake images of the RC structure that totally collapsed.
This building, which suffered a total collapse, was constructed before 2000 and had a four-story reinforced concrete structural system. The first two floors of the building were used for commercial purposes, while the upper floors are residential. This, in particular, led to the variation in the amount of infill walls used between floors. It can be said that the building had soft story situation, relatively. The building suffered a total collapse due to a side collapse (accordion). The primary cause of this type of collapse is the occurrence of plastic hinge formation in columns before beams, i.e., the strong beam-weak column approach. However, earthquake regulations require columns to be stronger than beams [56,59]. Furthermore, factors such as lack of transverse reinforcement, low-strength concrete, and poor workmanship played critical roles in this type of collapse. Structures subjected to this type of collapse lack the reinforcement detailing and concrete material quality necessary to ensure ductile behavior, and lack proper shear wall positioning to ensure rigidity. Consequently, they experience excessive horizontal displacements and collapse before completing Mode-1 motion [62]. The combination of negative factors that directly reduce earthquake performance made damage and destruction much easier.
Owing to its geographical location and seismic hazard, Balıkesir is among the most seismically active regions in Türkiye [54,55]. The existing building stock predominantly comprises reinforced concrete and masonry structures constructed between 1980 and 2000. A significant portion of these structures exhibit structural weaknesses, including material quality that fails to meet current seismic design codes, inadequate engineering services, and irregular plan types. Masonry structures, particularly in rural areas, are prevalent, and their seismic performance is limited due to the use of low-strength mortar and inadequate connection details. While reinforced concrete buildings with engineering services are common in urban centers, their design in accordance with outdated codes and a lack of maintenance and repair pose risks to earthquake safety. Therefore, strengthening, renovation, and urban transformation projects are needed to increase the seismic resistance of Balıkesir’s existing building stock. Following the earthquake, the minaret of the Yeşilli Mosque in the Kızılgür Neighborhood suffered significant damage. The minaret, constructed of masonry, collapsed in the middle of its body during this earthquake. Separation damage and cracks were noted across a large section of the minaret. Images of the destroyed minaret are shown in Figure 11.
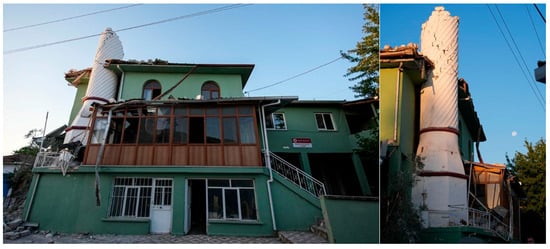
Figure 11.
Front and side views of a minaret after the Balıkesir earthquake, showing damage to the minaret and partial collapse of the mosque.
Comparative images of the minaret before and after the earthquake are given in Figure 12.
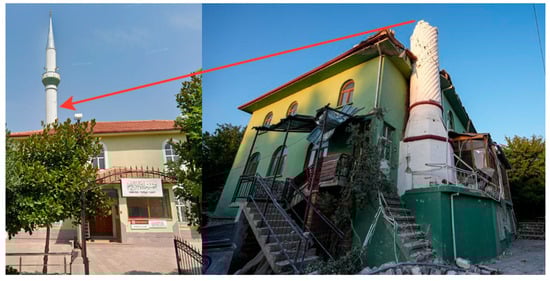
Figure 12.
Pre and post-earthquake images of the minaret.
In single-balcony mosques, the “body” refers to the section between the balcony and the pedestal (lug); in multi-balcony mosques, it denotes the area between the pedestal (lug) and the next pedestal, as well as the space between two balconies. Collapses occurring in the center of the body of masonry minarets generally result from a combination of material properties, structural geometry, and dynamic behavior. Although the center of the body carries greater loads than the upper sections in terms of both cross-sectional area and rigidity, it is the region where torsional and bending moments reach their most critical levels with increasing height. The geometric thinning of the body and the ellipsification of the circular cross-section due to defective workmanship also increase local buckling tendencies, increasing the risk of sudden collapse at the center of the structure. Damage to the body is generally encountered in minarets constructed adjacent to or very close to the mosque [63,64,65,66,67,68].
Out-of-plane behavior of structural walls in masonry structures typically occurs when a wall moves out of its own plane under horizontal forces such as earthquake loads, wind forces, or ground settlement. This situation poses a serious threat to the integrity of the structure. During an earthquake, weak or flexible floor systems, particularly those that cannot provide a rigid diaphragm effect, and walls not connected by adequate clamping and anchoring, reduce out-of-plane stability. Furthermore, excessive wall height-to-thickness ratios, low material strength, weakening of mortar bonds over time, and the lack of adequate tie beams at the edges of openings can trigger such movements. Out-of-plane behavior can result in sudden wall collapse, crack propagation, joint failure, and partial or complete collapse of the entire structure. Therefore, clamping, horizontal bond beams, and rigid floor connections that enhance the integrated behavior between structural elements are critical for preventing out-of-plane movement in masonry structures [69,70,71,72,73,74,75,76,77]. Examples of out-of-plane wall damage are shown in Figure 13. While both buildings in the example are used as residental, one is 1-storey and the other is 2-storey.
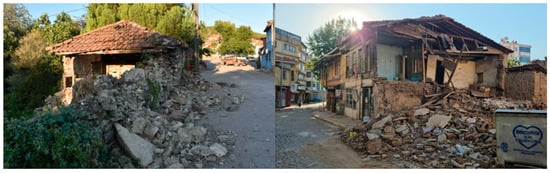
Figure 13.
Out-of-plane wall damage samples.
Examples of cracks and delamination damage occurring in the heavy overhang section of wall cladding in the structures are shown in Figure 14.
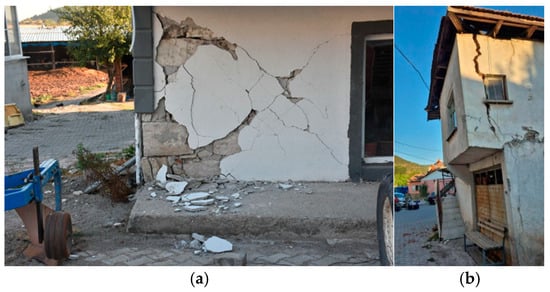
Figure 14.
(a) Wall cover damage; (b) heavy overhang damage.
The damage around the Sındırgı epicenter likely results from a mix of moderate shaking, local site effects, and construction quality. Compared with the 1999 İzmit (Mw 7.4) and 2023 Kahramanmaraş (Mw 7.7 and 7.6) earthquakes, this event produced lower peak ground accelerations and a more limited intensity pattern. Even so, it shows that moderate earthquakes can still cause serious damage where buildings are weak and soil conditions are poor, even when the recorded accelerations are below national design levels. It can be said that the accelerations that were during the earthquake are not too high, and the short-term ground motion played a critical role in the minimal damage observed.
4. Discussion
Earthquakes, depending on their mechanisms within the systems to which they belong, can transfer stress to adjacent segments and trigger their movement. The most recent example of this occurred during the 6 February 2023, Kahramanmaraş earthquakes, where a Mw 7.8 earthquake was followed just nine hours later by a Mw 7.6 event [78,79,80] (Alkan et al., 2024; Büyüksaraç et al., 2024; Avcil et al., 2024). The aftershocks that occurred around Sındırgı in the study area are triggering new moderate-sized earthquakes in Simav, which is located further east within the same fault system. Such short-term triggering was undoubtedly related to the sudden release of long-term accumulated stress. Moreover, evidence is emerging that large earthquakes may also trigger distant faults. The February 6 earthquakes, for instance, caused deformation and/or eruptions equivalent to a moment magnitude of 6.1 in 56 mud volcanoes located about 1000 km away in the Kura Basin of the western Caspian region. It has been proposed that this occurred because seismic waves induced changes in pore pressure at depth, which in turn triggered aseismic slip along several crustal faults crossing the basin and its surroundings [81].
According to the data obtained in this study, the 2018 Turkish Seismic Hazard Map and the earlier TSDC (2007) maps adequately represent the seismic hazard for Balıkesir and its districts. The recorded post-earthquake acceleration values remaining below the design-level accelerations confirm that the current hazard map has been prepared with a conservative safety margin. Also, the severe damage and collapses seen in a small number of buildings show the regional risk of buildings made with low-quality materials and having problems with their structural systems. The damage that cultural heritage masonry structures, like mosque minarets, have suffered also shows that these buildings need special seismic retrofitting plans to keep them safe.
The findings of this study confirm that the 2018 Türkiye Earthquake Hazard Map provides a conservative realistic representation of seismic demand for Balıkesir Province. Recorded peak ground accelerations remained below the design-level values, reinforcing the adequacy of the current seismic code provisions. However, structural vulnerabilities in the existing building stock, particularly the prevalence of soft-story mechanisms, inadequate transverse reinforcement, and the use of low-quality materials, significantly increased the damage potential even under moderate shaking levels.
In addition, the observed failure of cultural heritage masonry structures, such as mosque minarets, highlights the urgent need for tailored retrofitting strategies that respect architectural heritage while enhancing seismic resilience. Lessons drawn from recent destructive earthquakes in Türkiye and comparable Mediterranean regions underline that seismic hazard is not merely a matter of ground motion intensity but is strongly conditioned by construction practices and maintenance culture.
Therefore, risk reduction strategies in Balıkesir should focus on strengthening non-engineered and pre-2000 RC buildings, implementing targeted retrofitting of cultural assets, and improving rapid damage assessment capacities through advanced digital tools. These approaches will contribute significantly to regional disaster risk reduction policies.
In Türkiye, earthquake-resistant construction has been regulated for several decades, with significant updates introduced in the Turkish Seismic Design Code (TSDC-2007) and more comprehensively in the Turkish Building Earthquake Code (TBEC-2018). However, a large portion of the existing building stock in Balıkesir was constructed between 1980 and 2000, prior to the enforcement of modern seismic provisions. The collapsed and heavily damaged structures observed in this study predominantly reflect deficiencies such as inadequate detailing, insufficient transverse reinforcement, low-quality concrete, and the absence of ductility-oriented design principles. Unlike countries such as Chile, Mexico, or the United States, where rigorous code enforcement and continuous seismic retrofitting programs have significantly reduced vulnerabilities, compliance and supervision in Türkiye, particularly before 2000, were limited. Consequently, many buildings in the study area do not fully conform to current seismic design codes, and in some cases, their service life has been exceeded. This underscores the urgent need for systematic retrofitting and urban transformation policies to align the existing building stock with contemporary seismic safety requirements. Türkiye has made significant progress in this area and has begun to create earthquake-resistant cities.
Future studies could benefit from integrating rapid post-disaster data collection techniques, such as AI-assisted image recognition and remote sensing, to complement field-based observations. Such digital tools could improve the efficiency and coverage of structural damage assessments, thereby supporting more comprehensive post-earthquake evaluations. Furthermore, due to the prevalence of similar vulnerabilities in the earthquake zone, it highlights the need to develop specialized retrofitting approaches for both non-engineered RC buildings and cultural heritage assets. Therefore, the Balıkesir case demonstrates how locally obtained data can be scaled up to inform international efforts in seismic risk reduction and resilience building.
5. Conclusions
Known active faults in Türkiye continue to exhibit activity that culminates in rupture after a certain degree of stress and energy accumulation has been reached. The Simav Fault is one of the faults likely to exhibit activity at any time. The Simav Fault Zone (SFZ) exhibits behavior that can transfer stress from east to west in Western Anatolia. Following the earthquakes in the eastern segments of the SFZ in the recent past, tension accumulated in the western segments, eventually leading to seismic activity. According to instrumental period records, an earthquake with a magnitude of Ms 5.6 occurred at the eastern end of the SFZ in 1900, followed by an earthquake of Ms 6.0 slightly to the west in 1944, and another earthquake of Ms 6.0 in 1969 on the Sındırgı side in the west. A similar cycle occurred in 1970 with Ms 5.6 and Ms 7.2 earthquakes on the eastern side, while ML 5.0, ML 5.7, and ML 5.1 earthquakes in 2012 occurred in the central part of the SFZ toward the west. The first major earthquake after this period occurred on 10 August 2025, as Mw 6.1, at the westernmost tip, Sındırgı.
The Sındırgı earthquake (Mw 6.1), which occurred on 10 August 2025, occurred at the western end of the Simav Fault. While the earthquake’s magnitude and resulting acceleration were significant, the destruction was devastating: one building was destroyed and more than 400 were severely damaged. The completely collapsed building undoubtedly suffered this destruction due to structural flaws. However, it has been observed that the severely damaged buildings were constructed, particularly on loose soil, without considering the structure-soil interaction. Another striking feature of this earthquake is the aftershock activity. Although the number of aftershocks gradually decreases, the existence of earthquakes with magnitudes of 4.0–4.3 is quite thought-provoking. Because more than 10,000 aftershocks have occurred since August 10, when the earthquake occurred, and as expected, the magnitudes of the aftershocks should be 3.0 and lower, but new aftershocks reaching magnitude 5.0 are taking place. This situation is reminiscent of the situation where a similar earthquake activity that occurred in this region in 1969 ended with the 7.1 magnitude Gediz earthquake after about 9 months.
The 2025 Sındırgı (Balıkesir) earthquake has once again highlighted the significant seismic hazard potential for Western Türkiye, a region influenced by the complex interaction of active fault systems, including segments of the North Anatolian Fault Zone and secondary tectonic structures. This clearly demonstrates that the earthquake hazard in Balıkesir province and its districts, the epicenter of the earthquake, was adequately represented on the last two earthquake hazard maps used in the country. The damage from this ground motion, which can be considered one of the earthquakes expected in the region, was also limited. A very weak and occupied building collapsed, resulting in one death. This earthquake has once again highlighted the importance of structural features that negatively affect the seismic performance of buildings.
The novelty of this study lies in presenting, for the first time, a comprehensive and district-scale comparative hazard analysis combined with detailed field observations for Balıkesir following the 2025 Sındırgı earthquake. By correlating recorded PGA’s with hazard map predictions and integrating structural performance data, the study provides strong evidence for the adequacy of the 2018 Türkiye Earthquake Hazard Map. Furthermore, the field-based insights emphasize the persistent seismic vulnerability of older RC and masonry structures. These contributions not only advance scientific understanding but also provide actionable knowledge for local authorities, urban planners, and policymakers to strengthen earthquake risk reduction strategies in Western Türkiye.
The main contribution of this research lies in presenting, for the first time, a district-scale comparative hazard analysis integrated with field damage observations for Balıkesir, thereby linking recorded ground motions with structural performance. At an international level, the findings underscore the importance of validating seismic hazard maps through post-earthquake data and demonstrate how region-specific analyses can enhance the reliability of national hazard models. This approach offers a transferable framework for other seismically active regions worldwide, highlighting the necessity of combining hazard map evaluations with real earthquake observations to refine design codes, inform retrofitting strategies, and improve disaster risk reduction policies. This study not only provides a district-scale comparative hazard analysis for Balıkesir but also offers insights that are globally applicable. Specifically, it highlights the value of integrating post-earthquake observations into the validation of seismic hazard maps, a practice that can enhance the accuracy of seismic design codes in any earthquake-prone region.
In the present study, the comparative hazard maps primarily reflect ground motion parameters rather than structure-specific vulnerabilities. However, the field observations clearly demonstrate that the seismic performance of buildings is highly dependent on their construction period, material quality, and compliance with design codes. Therefore, while the hazard maps themselves do not differentiate between building types, their interpretation for risk assessment requires coupling with an inventory of the existing building stock. In other words, seismic hazard defines the level of ground motion expected, but seismic risk can only be realistically assessed when the vulnerability of reinforced concrete, masonry, and heritage structures is explicitly considered. For Balıkesir, this implies that future risk maps should integrate both ground motion estimates and typological vulnerability classifications to provide a more accurate and actionable representation of potential earthquake impacts.
Author Contributions
Conceptualization, A.B., F.A., and H.A.; methodology, A.B., E.I., and A.Ö.; validation, F.A., E.I., and E.H.; investigation, A.B., H.A., and A.Ö.; resources, F.A., H.A., and E.I.; data curation, F.A., and A.Ö.; writing—original draft preparation, A.B., F.A., and E.I.; writing—review and editing, H.A., E.H., and A.Ö.; visualization, E.I., and E.H.; supervision, A.B., and E.I.; funding acquisition, E.H. All authors have read and agreed to the published version of the manuscript.
Funding
This research received no external funding.
Data Availability Statement
The original contributions presented in this study are included in the article. Further inquiries can be directed to the corresponding author.
Conflicts of Interest
The authors declare no conflicts of interest.
References
- Bilgin, H.; Hadzima-Nyarko, M.; Isik, E.; Ozmen, H.B.; Harirchian, E. A comparative study on the seismic provisions of different codes for RC buildings. Struct. Eng. Mech. 2022, 83, 195–206. [Google Scholar]
- Gouliotis, L.; Papanikolaou, D. The Northern Giona Fault Zone, a major active structure through Central Greece. GeoHazards 2024, 5, 1370–1388. [Google Scholar] [CrossRef]
- Akhundzadah, N.A. Earthquake risk severity and urgent need for disaster management in Afghanistan. GeoHazards 2025, 6, 9. [Google Scholar] [CrossRef]
- Mantovani, E.; Viti, M.; Tamburelli, C.; Babbucci, D.; Baglione, M.; D’Intinosante, V. Seismicity patterns in some Mediterranean Zones after the 1939 Anatolian earthquake: Insights on Seismic Risk and the Tectonic Setting. GeoHazards 2025, 6, 29. [Google Scholar] [CrossRef]
- Mavroulis, S.; Mavrouli, M.; Sarantopoulou, A.; Antonarakou, A.; Lekkas, E. Increased preparedness during the 2025 Santorini–Amorgos (Greece) earthquake swarm and comparative insights from recent cases for civil protection and disaster risk reduction. GeoHazards 2025, 6, 32. [Google Scholar] [CrossRef]
- Işık, E.; Avcil, F.; Hadzima-Nyarko, M.; İzol, R.; Büyüksaraç, A.; Arkan, E.; Radu, D.; Özcan, Z. Seismic performance and failure mechanisms of reinforced concrete structures subject to the earthquakes in Türkiye. Sustainability 2024, 16, 6473. [Google Scholar] [CrossRef]
- Nanda, R.P.; Paul, N.K.; Chanu, N.M. Seismic loss estimation tool as a rapid survey for prioritizing buildings for disaster preparedness: Case study to hospital buildings. Nat. Hazards 2019, 95, 769–781. [Google Scholar] [CrossRef]
- Bulajić, B.; Lozančić, S.; Bajić, S.; Radu, D.; Işık, E.; Negovanović, M.; Hadzima-Nyarko, M. Horizontal UHS predictions for varying deep geology conditions—A case study of the city of Banja Luka. Sustainability 2025, 17, 6012. [Google Scholar] [CrossRef]
- Estêvão, J.M. Effectiveness of generative AI for post-earthquake damage assessment. Buildings 2024, 14, 3255. [Google Scholar] [CrossRef]
- Ozturk, M.; Arslan, M.H.; Korkmaz, H.H. Effect on RC buildings of 6 February 2023 Turkey earthquake doublets and new doctrines for seismic design. Eng. Fail. Anal. 2023, 153, 107521. [Google Scholar] [CrossRef]
- Naik, S.P.; Reicherter, K.; Kázmér, M.; Skapski, J.; Mohanty, A.; Kim, Y.S. Archeoseismic study of damage in Medieval Monuments around New Delhi, India: An approach to understanding paleoseismicity in an intraplate region. GeoHazards 2024, 5, 142–165. [Google Scholar] [CrossRef]
- Senkaya, M.; Erkan, E.F.; Silahtar, A.; Karaaslan, H. Implementation of clustering algorithms for damage prediction through seismic local-site parameters: 2023 Kahramanmaraş earthquake sequence. Bull. Earthq. Eng. 2024, 22, 6545–6566. [Google Scholar] [CrossRef]
- Feng, D.C.; Yi, X.; Deger, Z.T.; Liu, H.K.; Chen, S.Z.; Wu, G. Rapid post-earthquake damage assessment of building portfolios through deep learning-based component-level image recognition. J. Build. Eng. 2024, 98, 111380. [Google Scholar] [CrossRef]
- Arslan, M.H.; Dere, Y.; Ecemiş, A.S.; Doğan, G.; Özturk, M.; Korkmaz, S.Z. Code-based damage assessment of existing precast industrial buildings following the February 6th, 2023 Kahramanmaraş earthquakes (Pazarcık Mw 7.7 and Elbistan Mw 7.6). J. Build. Eng. 2024, 86, 108811. [Google Scholar] [CrossRef]
- Yuzbasi, J. Post-earthquake damage assessment: Field observations and recent developments with recommendations from the Kahramanmaraş earthquakes in Türkiye on February 6th, 2023 (Pazarcık M7.8 and Elbistan M7.6). J. Earthq. Eng. 2024, 1–26. [Google Scholar] [CrossRef]
- Işık, E.; Hadzima-Nyarko, M.; Tayeh, B.A.; Harrat, Z.R.; Avcil, F.; Arkan, E. Comparison of reinforcement methods with advanced materials for R/C columns. Adv. Eng. Lett. 2025, 4, 1–13. [Google Scholar] [CrossRef]
- Zhang, H.; Reuland, Y.; Shan, J.; Chatzi, E. Post-earthquake structural damage assessment and damage state evaluation for RC structures with experimental validation. Eng. Struct. 2024, 304, 117591. [Google Scholar] [CrossRef]
- Bozkurt, E. Neotectonics of Turkey–a synthesis. Geodin. Acta 2001, 14, 3–30. [Google Scholar] [CrossRef]
- Şengör, A.C.; Yilmaz, Y. Tethyan evolution of Turkey: A plate tectonic approach. Tectonophysics 1981, 75, 181–241. [Google Scholar] [CrossRef]
- Sborshchikov, I.M.; Savostin, L.A.; Zonenshain, L.P. Present plate tectonics between Turkey and Tibet. Tectonophysics 1981, 79, 45–73. [Google Scholar] [CrossRef]
- Bozkurt, E.; Mittwede, S.K. Introduction: Evolution of continental extensional tectonics of western Turkey. Geodin. Acta 2005, 18, 153–165. [Google Scholar] [CrossRef]
- Barka, A.A.; Kadinsky-Cade, K. Strike-slip fault geometry in Turkey and its influence on earthquake activity. Tectonics 1998, 7, 663–684. [Google Scholar] [CrossRef]
- Işık, E.; Ulutaş, H.; Büyüksaraç, A. The comparison of sectional damages in reinforced-concrete structures and seismic parameters on regional Basis; a case study from western Türkiye (Aegean Region). Earthq. Struct. 2023, 24, 37–51. [Google Scholar]
- Işık, E.; Harirchian, E.; Büyüksaraç, A.; Levent Ekinci, Y. Seismic and structural analyses of the eastern Anatolian region (Turkey) using different probabilities of exceedance. Appl. Syst. Innov. 2021, 4, 89. [Google Scholar] [CrossRef]
- Alkan, H.; Öztürk, S.; Bektaş, Ö.; Büyüksaraç, A. Statistical and seismotectonic analyses of the Marmara region under existing stress regime in the west of the NAFZ. Acta Geophys. 2025, 73, 1117–1136. [Google Scholar] [CrossRef]
- Bektaş, Ö.; Alkan, H.; Pırtı, A.; Yücel, M.; Büyüksaraç, A. Stress accumulation on the Karlıova (Bingöl) Triple Junction after two big earthquakes (Pazarcık-Ekinözü) in Turkey in 2023. Boll. Geofis. Teor. Appl. 2025, 66, 2. [Google Scholar]
- Reilinger, R.; McClusky, S.; Vernant, P.; Lawrence, S.; Ergintav, S.; Cakmak, R.; Ozener, H.; Kadirov, F.; Guliev, I.; Stepanyan, R.; et al. GPS constraints on continental deformation in the Africa-Arabia-Eurasia continental collision zone and implications for the dynamics of plate interactions. J. Geophys. Res. Solid Earth 2006, 111, B05411. [Google Scholar] [CrossRef]
- Emre, Ö.; Duman, T.Y.; Özalp, S.; Şaroğlu, F.; Olgun, Ş.; Elmacı, H.; Çan, T. Active fault database of Türkiye. Bull. Earthq. Eng. 2018, 16, 3229–3275. [Google Scholar] [CrossRef]
- Wessel, P.; Luis, J.F.; Uieda, L.; Scharroo, R.; Wobbe, F.; Smith, W.H.F.; Tian, D. The Generic Mapping Tools Version 6. Geochem. Geophys. Geosystems 2019, 20, 5556–5564. [Google Scholar] [CrossRef]
- Magliulo, G.; Ercolino, M.; Petrone, C.; Coppola, O.; Manfredi, G. The Emilia earthquake: Seismic performance of precast reinforced concrete buildings. Earthq. Spectra 2014, 30, 891–912. [Google Scholar] [CrossRef]
- Bournas, D.A.; Negro, P.; Taucer, F.F. Performance of industrial buildings during the Emilia earthquakes in Northern Italy and recommendations for their strengthening. Bull. Earthq. Eng. 2014, 12, 2383–2404. [Google Scholar] [CrossRef]
- Minghini, F.; Ongaretto, E.; Ligabue, V.; Savoia, M.; Tullini, N. Observational failure analysis of precast buildings after the 2012 Emilia earthquakes. Earthq. Struct. 2016, 11, 327. [Google Scholar] [CrossRef]
- Savoia, M.; Buratti, N.; Vincenzi, L. Damage and collapses in industrial precast buildings after the 2012 Emilia earthquake. Eng. Struct. 2017, 137, 162–180. [Google Scholar] [CrossRef]
- Valente, M.; Barbieri, G.; Biolzi, L. Damage assessment of three medieval churches after the 2012 Emilia earthquake. Bull. Earthq. Eng. 2017, 15, 2939–2980. [Google Scholar] [CrossRef]
- Valente, M.; Barbieri, G.; Biolzi, L. Seismic assessment of two masonry Baroque churches damaged by the 2012 Emilia earthquake. Eng. Fail. Anal. 2017, 79, 773–802. [Google Scholar] [CrossRef]
- Standoli, G.; Clementi, F.; Gentile, C.; Lenci, S. Post-earthquake continuous dynamic monitoring of the twin belfries of the Cathedral of Santa Maria Annunziata of Camerino, Italy. Procedia Struct. Integr. 2023, 44, 2066–2073. [Google Scholar] [CrossRef]
- Clementi, F.; Ferrante, A.; Giordano, E.; Dubois, F.; Lenci, S. Damage assessment of ancient masonry churches stroked by the Central Italy earthquakes of 2016 by the non-smooth contact dynamics method. Bull. Earthq. Eng. 2020, 18, 455–486. [Google Scholar] [CrossRef]
- Kocaman, İ.; Eroğlu, E.; Yıldız, M.E.; Yıldız, M.A.; Mercimek, Ö.; Çetin, S. Reinforced concrete interventions on the collapse mechanism of historical masonry structures with detailed finite element analyses: Kabasakal Mosque. Eng. Fail. Anal. 2025, 174, 109504. [Google Scholar] [CrossRef]
- Atmaca, E.E.; Genç, A.F.; Altunişik, A.C.; Yilmaz, S.; Yavru, T.E.; Yilmaz, E.I.; Adanur, S.; Günaydin, M.; Sunca, F. Damage assessment of regional cultural heritage assets following the 6 February 2023, Kahramanmaraş-Türkiye earthquakes: Habib-i Neccar Mosque with numerical validation. Results Eng. 2025, 106306. [Google Scholar] [CrossRef]
- Altunişik, A.C.; Arslan, M.E.; Kahya, V.; Aslan, B.; Sezdirmez, T.; Dok, G.; Kirtel, O.; Öztürk, H.; Sunca, F.; Baltaci, A.; et al. Field observations and damage evaluation in reinforced concrete buildings after the 6th February 2023, Kahramaraş–Türkiye earthquakes. J. Earthq. Tsunami 2023, 17, 2350024. [Google Scholar] [CrossRef]
- Tonyalı, Z.; Kıral, A. Evaluation of earthquake-related damages on the reinforced concrete buildings due to the February 6, 2023, Kahramanmaras-Türkiye earthquakes. Recep Tayyip Erdoğan Üni. Fen. Müh. Bil. Derg. 2024, 5, 89–114. [Google Scholar] [CrossRef]
- Doğan, T.P.; Kalkan, H.; Aldemir, Ö.; Ayhan, M.; Böcek, M.; Anıl, Ö. Investigation of RC structure damages after February 6, 2023, Kahramanmaraş earthquake in the Hatay region. Bull. Earthq. Eng. 2024, 22, 5201–5229. [Google Scholar] [CrossRef]
- Çelebi, E.; Kırtel, O. Seismic performance of reinforced concrete framed buildings with ribbed slabs at the affected region by 2023 Kahramanmaraş earthquakes. Bull. Earthq. Eng. 2025, 23, 3623–3646. [Google Scholar] [CrossRef]
- Lai, C.G.; Bozzoni, F.; Mangriotis, M.D.; Martinelli, M. Soil liquefaction during the 20 May 2012 M5.9 Emilia earthquake, Northern Italy: Field reconnaissance and post-event assessment. Earthq. Spectra 2015, 31, 2351–2373. [Google Scholar] [CrossRef]
- Papathanassiou, G.; Ganas, A.; Valkaniotis, S. Recurrent liquefaction-induced failures triggered by 2014 Cephalonia, Greece earthquakes: Spatial distribution and quantitative analysis of liquefaction potential. Eng. Geol. 2016, 200, 18–30. [Google Scholar] [CrossRef]
- Zhu, J.; Baise, L.G.; Koch, M. Mapping earthquake induced liquefaction surface effects from the 2011 Tohoku earthquake using satellite imagery. In Proceedings of the 2016 IEEE International Geoscience and Remote Sensing Symposium (IGARSS), Beijing, China, 10–15 July 2016; pp. 2328–2331. [Google Scholar]
- Baik, H.; Son, Y.S.; Kim, K.E. Detection of liquefaction phenomena from the 2017 Pohang (Korea) earthquake using remote sensing data. Remote Sens. 2019, 11, 2184. [Google Scholar] [CrossRef]
- Bassal, P.; Papageorgiou, E.; Moug, D.M.; Bray, J.D.; Cetin, K.O.; Şahin, A.; Nepal, S.; Toth, C.; Kendır, S.B.; Bikçe, M.; et al. Liquefaction ground deformations and cascading coastal flood hazard in the 2023 Kahramanmaraş earthquake sequence. Earthq. Spectra 2024, 40, 1845–1869. [Google Scholar] [CrossRef]
- Bol, E.; Özocak, A.; Sert, S.; Çetin, K.Ö.; Arslan, E.; Kocaman, K.; Ayhan, B.U. Evaluation of soil liquefaction in the city of Hatay triggered after the February 6, 2023 Kahramanmaraş-Türkiye earthquake sequence. Eng. Geol. 2024, 339, 107648. [Google Scholar] [CrossRef]
- Chen, L.; Lei, J.; Wang, Y. Liquefaction phenomena following the February 6th, 2023, Turkiye earthquakes: Observation and lessons. Nat. Hazards 2024, 120, 10709–10726. [Google Scholar] [CrossRef]
- Cetin, K.O.; Cakir, E.; Elsaid, A.; Cuceoglu, F.; Soylemez, B.; Ocak, S.; Ayhan, B.U. Geotechnical aspects of February 6, 2023 Kahramanmaraş-Türkiye earthquake sequence. In Geotechnical Engineering Challenges to Meet Current and Emerging Needs of Society; CRC Press: Boca Raton, FL, USA, 2024; pp. 25–44. [Google Scholar]
- AFAD. Historical Earthquakes (2000 BC–1900 AD). Available online: https://deprem.afad.gov.tr/event-historical (accessed on 14 August 2025).
- AFAD. Turkish Disaster and Emergency Management Presidency. Available online: https://en.afad.gov.tr (accessed on 14 August 2025).
- Gündoğdu, E.; Özden, S.; Bekler, T. Sındırgı Fayı ve Düvertepe Fay Zonu yakın civarının kinematik ve sismotektonik özellikleri: Batı Anadolu (Türkiye). Çanakkale Onsekiz Mart Üniversitesi Fen. Bilim. Enstitüsü Derg. 2020, 6, 378–395. [Google Scholar] [CrossRef]
- KOERI. Bogazici University Kandilli Observatory and Earthquake Research Institute (KOERI). Available online: http://www.koeri.boun.edu.tr/scripts/lst4.asp (accessed on 26 September 2025).
- TBEC-2018; Turkey Building Earthquake Code. Disaster and Emergency Management Presidency of Türkiye: Ankara, Türkiye, 2018.
- AFAD. TDTH. Available online: https://tdth.afad.gov.tr (accessed on 14 August 2025).
- Bayındırlık ve İskân Bakanlığı Afet İşleri Genel Müdürlüğü Deprem Araştırma Dairesi Başkanlığı, Ankara, Temmuz 1996. Available online: https://www.afad.gov.tr/ (accessed on 14 August 2025).
- TSDC-2007; Turkish Seismic Design Code. Disaster and Emergency Management Presidency: Ankara, Türkiye, 2007. Available online: https://scholar.google.com/scholar_lookup?title=Turkish+Seismic+Design+Code&author=TSDC-2007&publication_year=2007 (accessed on 14 August 2025).
- Bayrak, E. Türkiye Için Şiddet-Magnitüd Azalım Ilişkisinin Geliştirilmesi ve Makro Sismik Deprem Tehlike Haritasının Hazırlanması. Ph.D. Thesis, Karadeniz Teknik Üniversitesi, Trabzon, Türkiye, 2018. [Google Scholar]
- Büyüksaraç, A.; Işık, E.; Bektaş, Ö.; Avcil, F. Achieving intensity distributions of 6 February 2023 Kahramanmaraş (Türkiye) earthquakes from peak ground acceleration records. Sustainability 2024, 16, 599. [Google Scholar] [CrossRef]
- Dogan, G.; Ecemis, A.S.; Korkmaz, S.Z.; Arslan, M.H.; Korkmaz, H.H. Buildings damages after Elazığ, Turkey earthquake on January 24, 2020. Nat. Hazards 2021, 109, 161–200. [Google Scholar] [CrossRef]
- Koç, V. Deprem sonrası ağır hasarlı bina hasarlarının sınıflandırılması. Doğal Afetler Çevre Derg. 2016, 2, 46–65. [Google Scholar] [CrossRef]
- Kocaman, İ. The effect of the Kahramanmaraş earthquakes (Mw 7.7 and Mw 7.6) on historical masonry mosques and minarets. Eng. Fail. Anal. 2023, 149, 107225. [Google Scholar] [CrossRef]
- Yılmaz, S.; Arslan, M.; Demir, A.D.; Yılmaz, E.İ.; Cebir, F.; Aydın, Ç.; Baş, G.Y.; Demir, S. Seismic damage assessment of historical mosques minarets in Antakya/Türkiye after the 6 February 2023, Kahramanmaraş earthquake sequence. Eng. Fail. Anal. 2025, 182, 110125. [Google Scholar] [CrossRef]
- Trešnjo, F.; Humo, M.; Casarin, F.; Ademović, N. Experimental investigations and seismic assessment of a historical stone minaret in Mostar. Buildings 2023, 13, 536. [Google Scholar] [CrossRef]
- Bilgin, H.; Ramadani, F. Numerical study to assess the structural behaviour of the Bayrakli Mosque (Western Kosovo). Adv. Civ. Eng. 2021, 2021, 4620916. [Google Scholar] [CrossRef]
- Erkek, H.; Yetkin, M. Assessment of the performance of a historic minaret during the Kahramanmaraş earthquakes (Mw 7.7 and Mw 7.6). In Structures; Elsevier: Amsterdam, The Netherlands, 2023; Volume 58, p. 105620. [Google Scholar]
- Işık, E.; Bilgin, H.; Avcil, F.; İzol, R.; Arkan, E.; Büyüksaraç, A.; Harirchian, E.; Hysenlliu, M. Seismic performances of masonry educational buildings during the 2023 Türkiye (Kahramanmaraş) Earthquakes. GeoHazards 2024, 5, 700–731. [Google Scholar] [CrossRef]
- Dedeoglu, I.O.; Yetkin, M.; Tunc, G.; Ozbulut, O.E. Evaluating earthquake-induced damage in Dogansehir, Malatya after 2023 Kahramanmaras earthquake sequence: Geotechnical and structural perspectives. J. Build. Eng. 2025, 104, 112266. [Google Scholar] [CrossRef]
- Kocaman, I.; Gedik, B.; Okuyucu, D. The effects of the Kahramanmaraş earthquakes on historical masonry minarets in Hatay, Türkiye. Sādhanā 2025, 50, 155. [Google Scholar] [CrossRef]
- Dedeoğlu, İ.Ö.; Yetkin, M.; Calayır, Y. Seismic performance of masonry structures in the rural area during the November 23, 2022, Düzce-Gölyaka earthquake. J. Build. Eng. 2024, 96, 110373. [Google Scholar] [CrossRef]
- Ferreira, T.M.; Costa, A.A.; Costa, A. Analysis of the out-of-plane seismic behaviour of unreinforced masonry: A literature review. Int. J. Archit. Herit. 2015, 9, 949–972. [Google Scholar] [CrossRef]
- Ademović, N.; Hadzima-Nyarko, M.; Zagora, N.; Stojnović, V. Various numerical modelling procedures of XIX-century masonry building. Eng. Struct. 2024, 301, 117361. [Google Scholar] [CrossRef]
- Hadzima-Nyarko, M.; Čolak, S.; Bulajić, B.Đ.; Ademović, N. Assessment of selected models for FRP-retrofitted URM walls under in-plane loads. Buildings 2021, 11, 559. [Google Scholar] [CrossRef]
- Milani, G.; Pizzolato, M.; Tralli, A. Simple numerical model with second order effects for out-of-plane loaded masonry walls. Eng. Struct. 2013, 48, 98–120. [Google Scholar] [CrossRef]
- Akhoundi, F.; Vasconcelos, G.; Lourenço, P. Experimental out-of-plane behaviour of brick masonry infilled frames. Int. J. Archit. Herit. 2020, 14, 221–237. [Google Scholar] [CrossRef]
- Alkan, H.; Büyüksaraç, A.; Bektaş, Ö. Investigation of earthquake sequence and stress transfer in the Eastern Anatolia Fault Zone by Coulomb stress analysis. Turk. J. Earth Sci. 2024, 33, 56–68. [Google Scholar] [CrossRef]
- Büyüksaraç, A.; Bektaş, Ö.; Alkan, H. Fault modeling around southern Anatolia using the aftershock sequence of the Kahramanmaraş earthquakes (Mw = 7.7 and Mw = 7.6) and an interpretation of potential field data. Acta Geophys. 2024, 72, 2985–2996. [Google Scholar] [CrossRef]
- Avcil, F.; Işık, E.; İzol, R.; Büyüksaraç, A.; Arkan, E.; Arslan, M.H.; Aksoylu, C.; Eyisüren, O.; Harirchian, E. Effects of the February 6, 2023, Kahramanmaraş earthquake on structures in Kahramanmaraş city. Nat. Hazards 2024, 120, 2953–2991. [Google Scholar] [CrossRef]
- Bayramov, Z.; Viltres, R.; Doubre, C.; Maggi, A.; Jolivet, R.; Rivera, L. Very-Long-Range Dynamic Triggering Of Mud Volcano Unrest And Silent Magnitude-6 Fault Slip. Science 2025, 389, 996–1002. [Google Scholar] [CrossRef]


Disclaimer/Publisher’s Note: The statements, opinions and data contained in all publications are solely those of the individual author(s) and contributor(s) and not of MDPI and/or the editor(s). MDPI and/or the editor(s) disclaim responsibility for any injury to people or property resulting from any ideas, methods, instructions or products referred to in the content. |
© 2025 by the authors. Licensee MDPI, Basel, Switzerland. This article is an open access article distributed under the terms and conditions of the Creative Commons Attribution (CC BY) license (https://creativecommons.org/licenses/by/4.0/).