Abstract
Reliable differentiation of crops and weeds is essential for precision agriculture, where real-time detection can minimize chemical inputs and support site-specific interventions. This study presents the large-scale and systematic benchmark of 19 YOLO-family variants, spanning YOLOv3 through YOLOv11, for cotton–weed detection using the Cotton–8 dataset. The dataset comprises 4440 annotated field images with five categories: broadleaf weeds, grass weeds, and three growth stages of cotton. All models were trained under a standardized protocol with COCO-pretrained weights, fixed seeds, and Ultralytics implementations to ensure reproducibility and fairness. Inference was conducted with a confidence threshold of 0.25 and a non-maximum suppression (NMS) IoU threshold of 0.45, with test-time augmentation (TTA) disabled. Evaluation employed precision, recall, mAP@0.5, and mAP@0.5:0.95, along with inference latency and parameter counts to capture accuracy–efficiency trade-offs. Results show that larger models, such as YOLO11x, achieved the best detection accuracy (mAP@0.5 = 81.5%), whereas lightweight models like YOLOv8n and YOLOv9t offered the fastest inference ( 27 msper image) but with reduced accuracy. Across classes, cotton growth stages were detected reliably, but broadleaf and grass weeds remained challenging, especially under stricter localization thresholds. These findings highlight that the key bottleneck lies in small-object detection and precise localization rather than architectural design. By providing the first direct comparison across successive YOLO generations for weed detection in cotton, this work offers a practical reference for researchers and practitioners selecting models for real-world, resource-constrained cotton–weed management.
1. Introduction
Agriculture sustains the global economy by providing food, raw materials, and livelihoods for billions of people, while also driving industrial supply chains and rural development [1]. Yet the sector faces mounting pressures from climate change, water scarcity, soil degradation, limited arable land, and persistent threats from pests and weeds [2]. These challenges demand innovative approaches that maintain both productivity and sustainability. Precision agriculture has emerged as one such approach, integrating sensing platforms, data-driven methods, and intelligent algorithms to support site-specific crop management [3]. Applications range from plant-health monitoring and yield prediction to resource optimization and weed detection [4], promising reduced input costs, lower environmental impact, and stable harvests [5,6].
Cotton is a crop of major global significance, providing natural fiber for the textile industry as well as a source of edible oil and by-products for livestock feed. Weeds pose a particularly severe threat to cotton because they compete for moisture, nutrients, and sunlight and can harbor insect pests and pathogens [7]. If left unmanaged during the early growth stages, weed pressure can reduce lint yield by as much as 90% and compromise fiber quality, resulting in substantial economic losses. Effective control therefore depends on early and accurate identification of weeds in the field, when interventions are most effective [8]. Traditional management, such as manual weeding or broad-spectrum herbicide application, remains labor-intensive, costly, and environmentally burdensome [9]. Mechanical inter-row cultivation can partly suppress weeds but risks damaging young cotton plants [10]. These limitations underscore the need for automated, timely weed detection systems that support targeted interventions and reduced chemical use [11].
Early efforts to automate weed detection in row crops, including cotton, relied on classical machine learning (ML) classifiers such as K-nearest neighbors (KNNs), support vector machines (SVMs), and random forests (RFs), which used spectral, texture, or shape descriptors extracted from images [12]. These models achieved moderate accuracy under controlled conditions and highlighted the potential of ML to reduce labor and herbicide inputs. Examples include stereo-vision systems with ML classifiers that reached about 90% classification accuracy in experimental plots [13] and SVM-based sprayer integrations that enabled near-real-time weed discrimination [14]. However, the dependence on hand-crafted features made such models sensitive to lighting, soil background, occlusion, and crop growth stage, limiting their robustness in commercial cotton fields [15,16]. These shortcomings motivated a shift toward deep-learning approaches [17].
Deep learning, particularly convolutional neural networks (CNNs), learns hierarchical representations directly from image data and has markedly advanced automatic weed detection [18,19]. Transfer-learning strategies using ResNet have shown strong performance for multi-class weed recognition in cotton, while DenseNet-based patch classification methods achieved high F1 scores by capturing fine-grained spatial cues [20]. Two main deep learning paradigms now dominate: semantic segmentation networks such as U-Net variants for pixel-level crop–weed mapping, and object-detection frameworks such as Faster R-CNN, SSD, and the YOLO family that localize weeds or crop plants in field imagery [21]. Object-detection models are particularly attractive for precision spraying and UAV-based scouting because they provide spatial localization at a practical computational cost [22].
Among these, the YOLO series has been especially influential, evolving toward better feature extraction, improved localization loss functions, and lightweight scalable variants that address the accuracy–latency trade-off critical for embedded agricultural platforms [23]. Yet prior agricultural studies remain fragmented: most examined only a handful of YOLO versions, trained on different datasets with inconsistent protocols, or reported only accuracy without deployment-oriented measures [24]. As YOLO architectures continue to advance, there is still no unified benchmark that clarifies how model scale, architectural changes, and training regimes affect both detection accuracy and inference speed in cotton-field scenarios [25]. Persistent challenges such as class imbalance, morphological similarity between weeds and early cotton growth stages, occlusion, and variable illumination further motivate the need for such a benchmark [26].
This study benchmarks nineteen YOLO variants spanning from YOLOv3 to YOLOv11 on a cotton–weed detection dataset using a single, standardized training and testing pipeline. Model performance was assessed through detailed comparisons covering accuracy, inference latency, and error characteristics to understand the trade-offs among successive YOLO generations. The main contributions are as follows:
- A comprehensive comparison of nineteen YOLO models was conducted under identical experimental settings, ensuring fair evaluation across versions and architectures.
- Model performance was statistically analyzed using standard detection metrics (precision, recall, mAP@0.5, mAP@0.5:0.95) to identify consistent trends and significant differences among models.
- Inference latency was measured uniformly to quantify computational efficiency, followed by a detailed speed–accuracy trade-off analysis highlighting practical deployment considerations.
- Per-class error analysis was performed to examine detection difficulty across cotton growth stages and weed types, providing insights into model strengths and remaining challenges.
By consolidating scattered evidence into a single comparative framework, this work provides both a foundation for developing improved architectures and practical insight for selecting detection models suited to different operational constraints in cotton-weed management.
2. Related Work
Weed detection is a fundamental task in precision agriculture: timely and accurate identification enables site-specific herbicide application, reduces chemical use, increases yield, and lessens environmental impact. In cotton, where early weed competition can severely stunt seedlings, automated detection systems are particularly valuable for lowering labor demand and enabling targeted interventions that reduce cost and chemical exposure [27]. Practically, however, in-field weed detection is hard. Weeds vary widely in species, morphology, and spectral response, appear at different growth stages, and present under changing illumination and soil backgrounds [28]. Occlusion, overlapping foliage, and visual similarity between cotton and weed species frequently lead to misclassification, motivating domain-adapted solutions rather than off-the-shelf detectors [29]. These factors make weed detection more demanding than generic object detection and argue for dataset-driven models that generalize across heterogeneous field conditions [30].
Before the deep learning era, most approaches relied on handcrafted color, texture, and shape descriptors paired with classical classifiers (SVMs, random forests, boosted trees). These pipelines perform well in controlled settings, for example, SVMs using color and texture can separate rice weeds from crops under constrained illumination [14] but their performance degrades under field variability and illumination shifts. Hybrid or shallow CNN ensembles provided incremental gains, yet they still required extensive feature tuning and per-site retraining [31,32]. Even with carefully curated datasets, classical methods lacked the contextual perception and hierarchical feature extraction needed to distinguish visually similar plants across seasons; their static feature representations and need for field-specific calibration limited scalability, real-time deployment, and cross-season robustness [33,34].
Deep learning has largely overcome many of these limitations by learning hierarchical, discriminative representations that capture complex spatial, spectral, and textural cues across variable field conditions. Among contemporary detectors, the YOLO (You Only Look Once) family is widely adopted in agricultural vision because it offers real-time inference, end-to-end training, and a favorable accuracy–efficiency trade-off. The growing literature demonstrates how different YOLO variants can be adapted for crop–weed separation across crops and environments. Examples include a dual-branch design that fuses a Vision Transformer with a CNN backbone (plus receptive-field enhancement and a shared detection head) to outperform baseline YOLOv8n in cotton fields [21]; a reconstruction of the YOLOv8 backbone using EfficientNet together with cross-attention and multi-scale fusion that reports 92.3% accuracy at very low per-image latency (≈1.9 ms) in cotton [35]; and the YOLO-Weed Nano that streamlines YOLOv8n with a BiFPN and a lightweight head to cut parameters and FLOPs while preserving precision for cotton–weed detection [36]. Work beyond cotton includes HSG-Net, which adapts YOLOv8 with an HGNetv2 backbone and attention modules for wheat, producing compact models (≈3.4 MB) suitable for edge deployment [37]. Earlier contributions such as TIA-YOLOv5 showed that pixel-level data synthesis and advanced feature fusion can notably improve small-object detection in sugar beet fields [38]. Together, these studies illustrate the rapid evolution and practical versatility of YOLO family architectures in precision agriculture.
Despite steady gains in accuracy and inference speed, important gaps remain. Many studies train and evaluate models on a single, geographically constrained dataset, which limits cross-field generalization and fails to capture seasonal and environmental variability [22]. Analyses of deployment feasibility on edge-device performance and latency are infrequent, obscuring whether reported architectures meet resource constraints in real field settings [39]. Systematic investigations into how model complexity affects generalization are also scarce: most papers present results for a single architecture or variant, without exploring scaling trade-offs under dense weed cover, varying illumination, or partial occlusion [40]. Finally, the field lacks standardized benchmarking protocols; differences in datasets, preprocessing, hyperparameter choices, and evaluation metrics make fair cross-study comparisons difficult.
This work addresses those shortcomings by providing a unified, reproducible benchmark of 19 YOLO-family models (spanning YOLOv3 to YOLOv11) for cotton–weed detection. Using a controlled protocol that measures accuracy, efficiency, and generalization, and by explicitly analyzing architecture-level trade-offs across generations, we deliver a comprehensive reference that clarifies practical accuracy–latency–robustness trade-offs and supports future research and deployment in precision cotton farming.
3. Materials and Methods
3.1. Experimental Framework
The primary objective of this study was to evaluate the performance of recent YOLO architectures for the task of cotton–weed discrimination. To achieve a fair and systematic comparison, we designed an experimental framework built around three core elements: dataset preparation, model selection, and evaluation methodology.
In the first stage, the Cotton-8 dataset was prepared for use in object-detection tasks. Images were standardized to a fixed input size, and bounding box annotations were preserved across all subsets. A stratified 70/20/10 train–validation–test split was applied to ensure that each of the five classes was proportionally represented, reducing the risk of bias due to class imbalance.
The second stage focused on model selection. Nineteen YOLO variants were included, spanning YOLOv3 through YOLOv11. This progression was chosen to capture the evolution of the architecture across multiple design generations and to assess whether newer models consistently deliver improvements in detection accuracy and inference efficiency. By covering lightweight, medium, and large variants, this study also provides insight into trade-offs between model capacity and deployment feasibility.
Finally, the third stage defined the evaluation methodology. Detection accuracy was assessed using standard COCO metrics: precision, recall, mAP@0.5, and mAP@0.5:0.95. The mAP values were computed as the area under the precision–recall curve using 101 recall points, following the official COCO evaluation protocol. Class-wise AP was calculated using macro averaging across all eight Cotton-8 classes to ensure balanced assessment, and per-class AP at IoU 0.75 (AP@0.75) was also reported as an additional indicator of localization accuracy. To address real-time applicability, we measured average per-image inference latency (ms/image) under uniform testing conditions. Together, these metrics capture both recognition quality and computational efficiency, enabling a holistic comparison across models.
This framework, shown in Figure 1, ensures that all models are evaluated under identical experimental conditions, allowing conclusions to be drawn not only about raw accuracy but also about the suitability of different YOLO versions for deployment in precision agriculture systems.
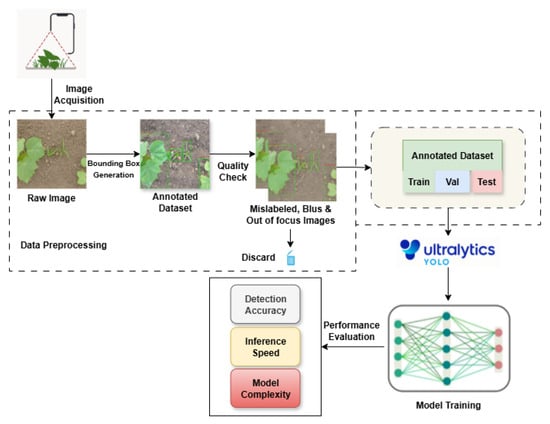
Figure 1.
Experimental framework illustrating the workflow of dataset preparation, model selection, and performance evaluation of YOLO variants on the Cotton-8 dataset.
3.2. Dataset Description
We used the Cotton-8 dataset from Roboflow Universe (https://universe.roboflow.com/cotton-8/cotton-8; accessed 12 March 2025). The dataset contains 4440 RGB field images annotated with axis-aligned bounding boxes captured under varied outdoor conditions (illumination changes, differing soil background, occlusion, and overlapping vegetation). Although the Roboflow project is named Cotton-8, this study uses five object categories: broadleaf weed, grass weed, cotton stage 1, cotton stage 2, and cotton stage 3. Annotations are provided in YOLOv8 format and are also available in COCO format. Following the original Roboflow image-level split (to preserve class balance), images were divided into 3108 training, 888 validation, and 444 test samples (≈70/20/10). Table 1 reports image and object counts per class and split; representative samples are shown in Figure 2.

Table 1.
Dataset statistics for Cotton-8, showing image and object counts per class and split.
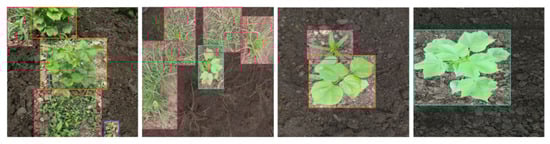
Figure 2.
Representative samples from the Cotton-8 dataset with annotated bounding boxes. grass = pink, broadleaf weed = purple, cotton stage 1 and stage 3 = orange, and cotton stage 2 = green.
3.3. Implementation Details
All experiments were conducted under a standardized environment to ensure reproducibility and fair comparison across all YOLO variants. Table 2 summarizes the hardware, software, and training configurations adopted in this study.
Table 2.
Implementation details for YOLO model training and evaluation.
To manage GPU memory limitations, batch sizes were adjusted for each YOLO variant according to model complexity, as listed in Table 3. Larger architectures (e.g., YOLO10x and YOLO11x) required smaller batches to fit within the 8 GB VRAM constraint, whereas lightweight models (e.g., YOLO8n and YOLO11n) allowed larger batches for improved parallelization.
Table 3.
Batch size configuration for different YOLO variants.
All models were trained under identical preprocessing and augmentation settings. Images were resized to 640 × 640 pixels, with corresponding bounding boxes rescaled accordingly. The AdamW optimizer was used with automatic parameter tuning and learning-rate scheduling as implemented in Ultralytics. Training continued for a maximum of 100 epochs. AMP was enabled throughout training to accelerate computation and reduce memory usage without compromising precision.
Model evaluation was performed on the held-out test split following COCO metric standards. Inference time was reported as the mean latency per image measured on the RTX 4060 Ti. The best-performing model weights were saved in their native PyTorch format for consistency and reproducibility.
3.4. Evaluation Metrics
Model performance was evaluated using standard object-detection metrics that jointly assess classification accuracy and localization quality. These include precision, recall, Intersection-over-Union (IoU), and two forms of Mean Average Precision (mAP). Together, these metrics provide a balanced view of detection reliability across classes and thresholds, which is essential for assessing both crop and weed identification in the Cotton-8 dataset.
- Precision () measures the proportion of correctly identified objects among all predicted detections:where and represent true and false positives, respectively. High precision indicates fewer false alarms, which is critical for avoiding incorrect weed treatments in agricultural applications.
- Recall () measures the proportion of ground-truth objects correctly detected by the model:where denotes false negatives. High recall ensures that most relevant objects (e.g., weeds or cotton plants) are captured.
- Intersection-over-Union (IoU) quantifies localization accuracy between predicted and ground-truth bounding boxes:where and denote the predicted and ground-truth boxes. A detection is considered correct when IoU exceeds a chosen threshold (commonly 0.5).
- Average Precision (AP) represents the area under the precision–recall curve for a single class:
- Mean Average Precision at 0.5 IoU (mAP@05) averages AP across all C classes at a fixed IoU threshold of 0.5:
- COCO-style Mean Average Precision (0.5:0.95) computes AP across multiple IoU thresholds (0.5—0.95 in 0.05 increments) and averages over all classes:where thresholds in this study. This metric provides a stricter and more comprehensive measure of detection robustness, penalizing poor localization.
These metrics collectively evaluate both the detection accuracy and localization quality of YOLO variants, offering a robust assessment framework for analyzing crop–weed detection performance on the Cotton-8 dataset.
4. Results
4.1. Model Performance and Statistical Evaluation
Table 4 summarizes the detection performance of all 19 YOLO variants on the Cotton-8 dataset. Across successive generations, results show a modest upward trend in accuracy, with mean mAP@0.5 increasing from 78.5% (YOLOv3) to 81.5% (YOLOv11x). Variants of the YOLOv8 family achieved a clear improvement relative to earlier baselines (mAP@0.5 ≈ 80.8–81.2%), with precision and recall for these models approximately near 0.78 and 0.77, respectively, and narrow confidence intervals (typically within ±0.005), indicating stable convergence across seeds. The highest single precision value observed in the table is for YOLOv8m (0.817 ± 0.002); several YOLOv9, YOLOv10, and YOLOv11 variants produced comparable overall accuracy but did not exceed this precision value in the provided runs.
Table 4.
Detection performance of 19 YOLO variants on the Cotton-8 dataset, reported as mean ± standard deviation over three independent runs (seeds 0, 1, 2). Values in parentheses denote the 95% confidence intervals.
Performance within the YOLOv10 and YOLOv11 families was tightly clustered: most variants fall between 80.4% and 81.5% mAP@0.5, with 95% confidence intervals generally below ±0.004. The best measured model in our experiments, YOLOv11l, achieved mAP@0.5 = 0.815 ± 0.003 and mAP@0.5:0.95 = 0.592 ± 0.003, representing an absolute gain of about three percentage points in mAP@0.5 and roughly four points in the stricter mAP@0.5:0.95 metric compared with YOLOv3 (0.785 and 0.548, respectively). Across the full set of variants, precision values (approximately 0.775–0.817) generally exceeded recall (approximately 0.740–0.794), indicating a tendency toward higher-confidence (but slightly more conservative) detections in this dataset.
Statistical summaries are reported as mean ± SD across three independent runs (seeds 0, 1, and 2), with 95% confidence intervals estimated via Student’s t-distribution (see Table 4 caption). Standard deviations were typically small (below 0.006), and the confidence intervals for the top-performing models (YOLOv9m, YOLOv10x, YOLOv11x) overlap substantially; this overlap indicates that the measured differences among those top variants are not statistically significant at the level given the present experimental design. Taken together, the results suggest that recent YOLO generations have converged to a performance level near ∼81% mAP@0.5 on Cotton-8. Any further improvements are therefore more likely to arise from changes in data or inference configuration (e.g., higher input resolution, targeted augmentation, or small-object-centric strategies) than from marginal increases in backbone depth alone. The following sections examine inference efficiency and class-level behavior to contextualize these observations.
4.2. Inference Latency Analysis
Table 5 reports single-image inference times for nineteen YOLO variants evaluated on the Cotton-8 dataset. Measurements were obtained on an RTX 4060 Ti GPU in FP32 with torch.backends.cudnn.benchmark=True, using a batch size of 1. The reported timings include preprocessing (resize, padding, normalization) but exclude disk I/O. Values are presented as mean ± SD with 95% confidence intervals from three independent runs (seeds 0, 1, 2).
Table 5.
Comparison of model size, compute complexity, and inference latency of YOLO variants on the Cotton-8 dataset. Latency values represent mean ± SD (95% CI) from three independent runs (seeds 0, 1, 2).
Latency generally increased with model size and computational load. Large-capacity detectors such as YOLOv8x (approximately 68 M parameters, 258 GFLOPs) required 88.0 ± 4.5 ms per image (about 11 FPS), while YOLOv11n, despite a smaller parameter, showed a comparable 90.2 ± 4.8 ms (about 11 FPS). In contrast, a cluster of mid-sized models achieved near-real-time throughput around 30 ms/image, including YOLOv3s (27.1 ± 1.2 ms), YOLOv8m (28.8 ± 1.1 ms), YOLOv9s (29.4 ± 1.2 ms), and YOLOv10m (30.1 ± 1.3 ms).
Not all results followed the FLOPs–latency trend. YOLOv8s (approximately 11 M parameters, 28.7 GFLOPs) recorded 67.3 ± 3.0 ms, and YOLOv9t (approximately 2 M parameters, 7.9 GFLOPs) required 72.4 ± 3.6 ms, both markedly slower than expected for their computational footprint. These discrepancies likely arise from differences in operator composition, kernel efficiency, memory overhead, or post-processing steps such as non-maximum suppression.
From a deployment standpoint, models sustaining approximately 30 ms or faster are suitable for real-time or edge applications, whereas the larger variants are preferable when accuracy is prioritized over speed. It should be noted that latency values are hardware and precision dependent; FP16 or INT8 inference on optimized back-ends (for example, TensorRT) could reduce latency substantially and may change the relative ordering of models.
4.3. Speed vs. Accuracy Trade-Off
Figure 3 illustrates the trade-off between detection accuracy (mAP@0.5) and inference latency for representative YOLO models. Each point corresponds to a variant evaluated on the Cotton-8 dataset, with latency (ms per image) plotted along the x-axis and accuracy along the y-axis. The plot clearly demonstrates the inverse relationship between speed and precision: as model complexity and depth increase, detection accuracy improves modestly, while inference time rises sharply.
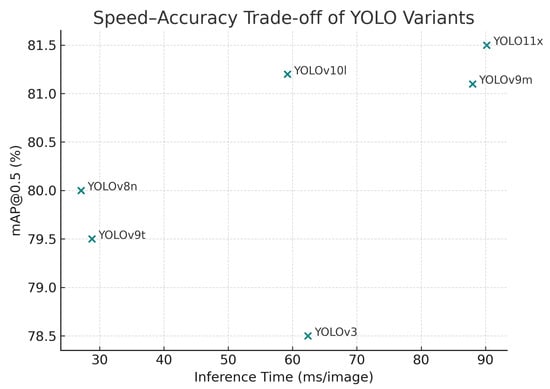
Figure 3.
Speed–accuracy trade-off comparison among representative YOLO models. Each point corresponds to a variant, with inference latency (ms per image) plotted against mAP@0.5.
The YOLOv11x and YOLOv9m variants occupy the upper-right region of the plot, achieving the highest mAP@0.5 values (≈81.5%) but requiring more than 80–90 ms per image. These models are therefore optimal for offline or server-based analysis, where latency is less restrictive. In contrast, YOLOv8n and YOLOv9t reside in the lower-left region, delivering inference speeds below 30 ms (≈33 FPS), with only a modest drop in accuracy (≈79–80%). Such lightweight models offer the best compromise for real-time, embedded, or UAV-based applications, where rapid frame processing is essential.
Overall, the distribution of points confirms a predictable speed–accuracy trade-off curve across YOLO generations. Smaller variants (n, s) favor throughput and energy efficiency, while larger ones (l, x) deliver marginal accuracy gains at a substantial computational cost. This trend reinforces the scalability of the YOLO architecture, enabling practitioners to select an optimal variant based on operational constraints rather than pursuing maximal accuracy alone.
4.4. Per-Class Error Insight
Detection performance varied noticeably among categories in the Cotton–8 dataset. Cotton growth stages were consistently the easiest to recognize, with all YOLO variants achieving high detection accuracy (mAP@0.5 typically 0.91–0.98) and reasonably strong localization under the stricter mAP@0.5:0.95 metric (0.72–0.80). In contrast, broadleaf weeds and grasses remained far more challenging, with lower detection and localization scores (mAP@0.5 often 0.53–0.65 and mAP@0.5:0.95 as low as 0.26–0.34). This gap highlights that while the models effectively learn structured crop features, they struggle with the heterogeneous shapes and frequent occlusions characteristic of weed species.
Training and validation trends further reinforce these class-level differences (Figure 4 and Figure 5). Loss curves across all variants show smooth convergence, but a persistent gap between training and validation losses indicates limited generalization, particularly for weed-related classes. Similarly, mAP trajectories plateau near 0.95 for cotton categories but remain lower and more variable for weeds, reflecting residual difficulty in distinguishing morphologically similar species or detecting small, partially obscured targets. These observations suggest that the principal challenge lies in the visual variability and small-object nature of many weed instances.
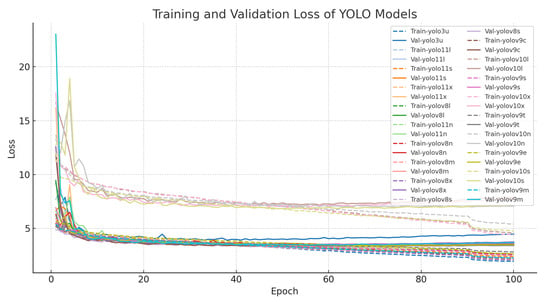
Figure 4.
Training and validation loss curves across YOLO variants. Smooth convergence is observed, but a persistent training–validation gap indicates limited generalization, particularly for weed classes.
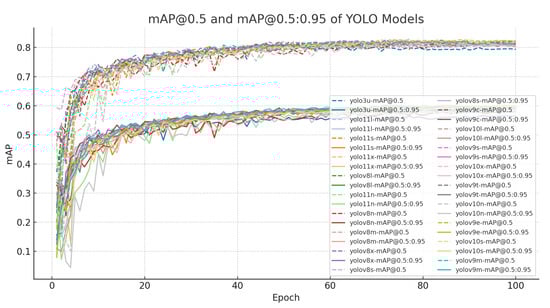
Figure 5.
Evolution of mAP@0.5 and mAP@0.5:0.95 during training. Cotton categories reach stable high accuracy, whereas weed categories remain lower and more variable, reflecting class-level imbalance.
To better characterize these limitations, Figure 6 summarizes the distribution of typical failure cases aggregated across YOLO variants. Missed weeds constitute the most frequent error type (38%), followed by mislocalized cotton instances (27%) and false-positive detections on soil backgrounds (18%). These results confirm that reliable weed detection and precise localization remain the dominant bottlenecks for practical deployment in precision agriculture applications.
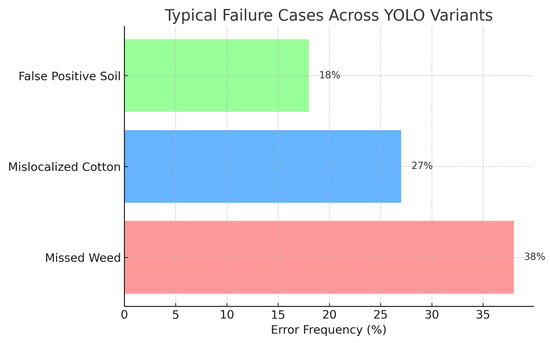
Figure 6.
Typical failure cases aggregated across YOLO variants, showing the relative frequency of false-positive soil detections (18%), mislocalized cotton instances (27%), and missed weeds (38%).
Qualitative examples in Figure 7 illustrate these error patterns. Smaller or occluded grasses are often missed entirely, broadleaf weeds may be detected with loose bounding boxes, and soil textures occasionally trigger spurious detections. Collectively, these findings indicate that while YOLO architectures have largely converged in overall accuracy, reducing class-specific errors, particularly for small or occluded weeds, remains an important avenue for future model and dataset refinement.
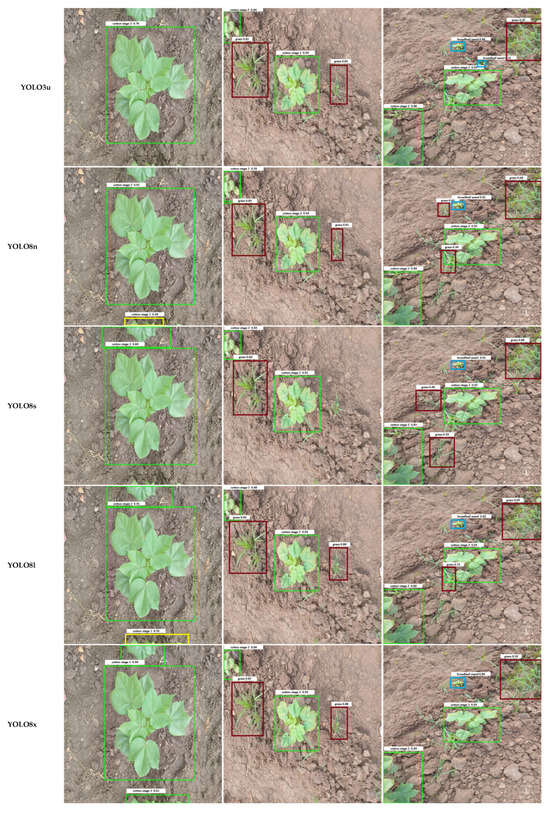
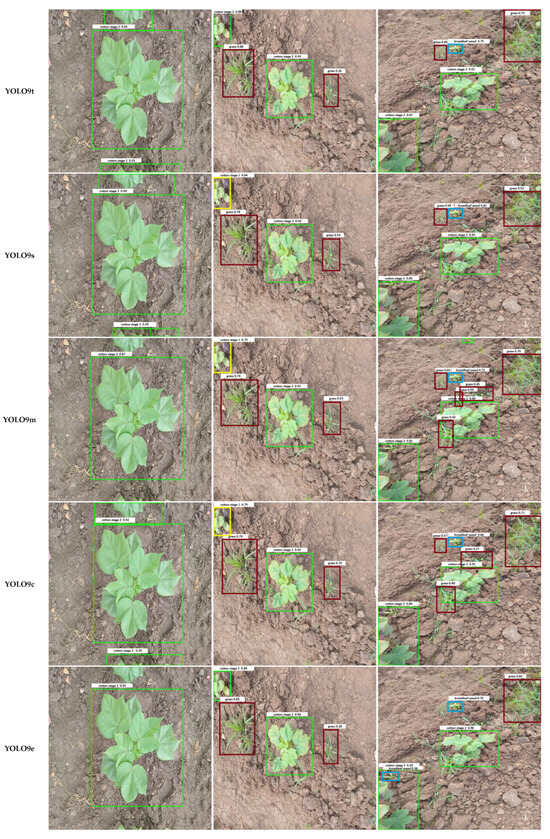
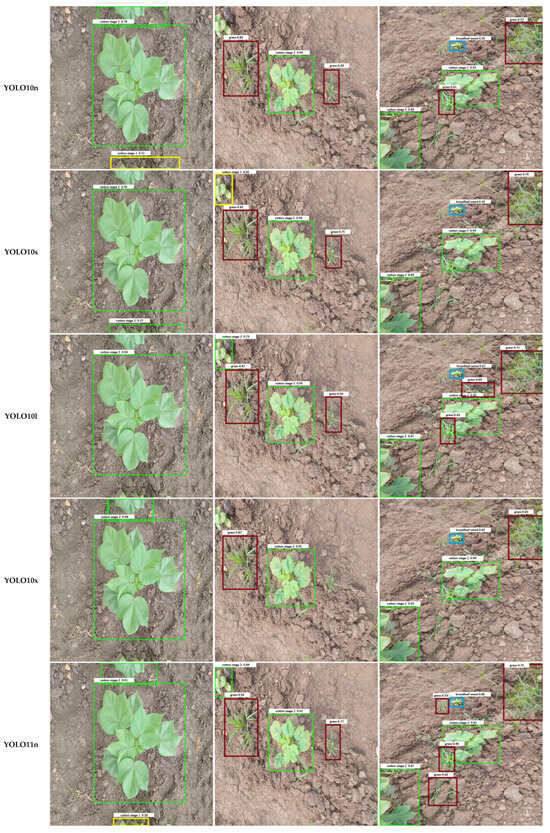
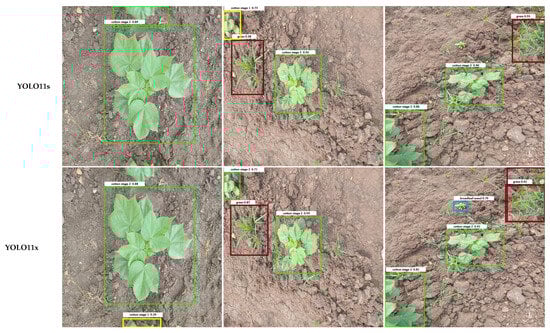
Figure 7.
Comparison of output images generated by different YOLO model variants. Each row shows the result for one model, labeled in the left column. Bounding box colors indicate the detected object classes: Weeds include Grass Weed (red) and Broadleaf Weed (Blue), while Cotton Growth Stages include Cotton Stage 1 (Yellow), Cotton Stage 2 (Green), and Cotton Stage 3 (Purple).
5. Conclusions
This study systematically benchmarked nineteen YOLO-family models, from YOLOv3 through YOLOv11, on the Cotton-8 dataset comprising five classes representing cotton growth stages and weed categories. Using a unified training and evaluation pipeline, we quantified both detection accuracy and inference latency to expose the practical trade-off between model complexity and deployment efficiency. The results show that larger architectures achieve up to 81.5% mAP@0.5, while compact variants deliver faster inference (27 ms per image) at a modest accuracy cost. Class-wise analysis further revealed that cotton growth stages are consistently well detected, whereas broadleaf and grass weeds remain challenging at higher IoU thresholds.
Beyond ranking architectures, this benchmark underscores where progress is still needed. Future research should prioritize improving small-object localization, handling inter-class visual similarity, and maintaining performance stability across varying field conditions, rather than proposing yet another detector family. For practitioners, the reported results provide a transparent reference for selecting YOLO models according to deployment constraints, maximizing accuracy for server-based systems or minimizing latency for real-time edge devices. By standardizing the evaluation pipeline and releasing complete implementation details, this work promotes reproducibility and offers a clear foundation for advancing efficient, field-ready crop-weed detection systems.
Author Contributions
Conceptualization, S.D.K. and M.A.B.; methodology, M.A.B., S.D.K. and H.R.; experiments, H.R.; writing original draft preparation, H.R., M.A.B.; writing, review and editing, H.B., M.U. and H.U.; supervision, M.A.B. and S.D.K. All authors have read and agreed to the published version of the manuscript.
Funding
This research was supported by the National Research Program for Universities (NRPU) of the Higher Education Commission (HEC) of Pakistan (20-17332/NRPU/RD/HEC/2021-2020).
Institutional Review Board Statement
Not applicable.
Informed Consent Statement
Not applicable.
Data Availability Statement
The dataset used in this study is publicly available at Roboflow. https://universe.roboflow.com/cotton-8/cotton-8, accessed on 3 November 2024.
Acknowledgments
We appreciate the support from the Norwegian University of Science and Technology (NTNU) through its open-access journal publication fund.
Conflicts of Interest
The authors declare no conflicts of interest.
References
- Bank, W. World Development Report 2024: Thriving with Agriculture; World Bank: Washington, DC, USA, 2024. [Google Scholar]
- Awais, M.; Wang, X.; Hussain, S.; Aziz, F.; Mahmood, M.Q. Advancing precision agriculture through digital twins and smart farming technologies: A review. AgriEngineering 2025, 7, 137. [Google Scholar] [CrossRef]
- Qu, H.R.; Su, W.H. Deep learning-based weed–crop recognition for smart agricultural equipment: A review. Agronomy 2024, 14, 363. [Google Scholar]
- Gund, R.; Badgujar, C.M.; Samiappan, S.; Jagadamma, S. Application of Digital Twin Technology in Smart Agriculture: A Bibliometric Review. Agriculture 2025, 15, 1799. [Google Scholar] [CrossRef]
- AlZubi, A.A.; Galyna, K. Artificial intelligence and internet of things for sustainable farming and smart agriculture. IEEE Access 2023, 11, 78686–78692. [Google Scholar] [CrossRef]
- Wu, F.; Zhu, R.; Meng, F.; Qiu, J.; Yang, X.; Li, J.; Zou, X. An enhanced cycle generative adversarial network approach for nighttime pineapple detection of automated harvesting robots. Agronomy 2024, 14, 3002. [Google Scholar] [CrossRef]
- Suzer, M.H.; Şenbayram, M.; Çullu, M.A. Sustainable Farming through Precision Agriculture: Enhancing Nitrogen Use and Weed Management. Precis.-Agric.-Emerg. Technol. 2024. [Google Scholar]
- Agrawal, A.; Singh, M. Agronomic Interventions for Sustainable Weed Management in Cotton. J. Cotton Sci. 2025, 29, 1–8. [Google Scholar]
- Devi, P.; Singh, K.; Sewhag, M.; Kumar, S. Performance of Bt cotton evaluated in relation to mulching and weed control measures in northwest India. J. Cotton Res. 2024, 7, 35. [Google Scholar] [CrossRef]
- Gao, W.T.; Su, W.H. Weed management methods for herbaceous field crops: A review. Agronomy 2024, 14, 486. [Google Scholar] [CrossRef]
- Azghadi, M.R.; Olsen, A.; Wood, J.; Saleh, A.; Calvert, B.; Granshaw, T.; Fillols, E.; Philippa, B. Precision robotic spot-spraying: Reducing herbicide use and enhancing environmental outcomes in sugarcane. Comput. Electron. Agric. 2025, 235, 110365. [Google Scholar] [CrossRef]
- Su, W.H. Advanced machine learning in point spectroscopy, RGB-and hyperspectral-imaging for automatic discriminations of crops and weeds: A review. Smart Cities 2020, 3, 767–792. [Google Scholar]
- Li, Y.; Al-Sarayreh, M.; Irie, K.; Hackell, D.; Bourdot, G.; Reis, M.M.; Ghamkhar, K. Identification of weeds based on hyperspectral imaging and machine learning. Front. Plant Sci. 2021, 11, 611622. [Google Scholar] [CrossRef]
- Dadashzadeh, M.; Abbaspour-Gilandeh, Y.; Mesri-Gundoshmian, T.; Sabzi, S.; Hernández-Hernández, J.L.; Hernández-Hernández, M.; Arribas, J.I. Weed classification for site-specific weed management using an automated stereo computer-vision machine-learning system in rice fields. Plants 2020, 9, 559. [Google Scholar] [CrossRef]
- Dalal, M.; Mittal, P. A Systematic Review of Deep Learning-Based Object Detection in Agriculture: Methods, Challenges, and Future Directions. Comput. Mater. Contin. 2025, 84, 57–91. [Google Scholar] [CrossRef]
- Altalak, M.; Ammad uddin, M.; Alajmi, A.; Rizg, A. Smart agriculture applications using deep learning technologies: A survey. Appl. Sci. 2022, 12, 5919. [Google Scholar] [CrossRef]
- Adhinata, F.D.; Sumiharto, R.; Meng, F.; Qiu, J.; Yang, X.; Li, J.; Zou, X. A comprehensive survey on weed and crop classification using machine learning and deep learning. Artif. Intell. Agric. 2024, 13, 45–63. [Google Scholar] [CrossRef]
- Silva, J.A.O.S.; Siqueira, V.S.d.; Mesquita, M.; Vale, L.S.R.; Marques, T.d.N.B.; Silva, J.L.B.d.; Silva, M.V.d.; Lacerda, L.N.; Oliveira-Júnior, J.F.d.; Lima, J.L.M.P.d.; et al. Deep learning for weed detection and segmentation in agricultural crops using images captured by an unmanned aerial vehicle. Remote. Sens. 2024, 16, 4394. [Google Scholar] [CrossRef]
- Faisal, H.M.; Aqib, M.; Mahmood, K.; Safran, M.; Alfarhood, S.; Ashraf, I. A customized convolutional neural network-based approach for weeds identification in cotton crops. Front. Plant Sci. 2025, 15, 1435301. [Google Scholar] [CrossRef]
- Li, Y.; Guo, R.; Li, R.; Ji, R.; Wu, M.; Chen, D.; Han, C.; Han, R.; Liu, Y.; Ruan, Y.; et al. An improved U-net and attention mechanism-based model for sugar beet and weed segmentation. Front. Plant Sci. 2025, 15, 1449514. [Google Scholar] [CrossRef]
- Hu, J.; Gong, H.; Li, S.; Mu, Y.; Guo, Y.; Sun, Y.; Hu, T.; Bao, Y. Cotton Weed-YOLO: A Lightweight and Highly Accurate Cotton Weed Identification Model for Precision Agriculture. Agronomy 2024, 14, 2911. [Google Scholar] [CrossRef]
- Allmendinger, A.; Saltık, A.O.; Peteinatos, G.G.; Stein, A.; Gerhards, R. Assessing the capability of YOLO-and transformer-based object detectors for real-time weed detection. Precis. Agric. 2025, 26, 52. [Google Scholar] [CrossRef]
- Sonawane, S.; Patil, N.N. Comparative performance analysis of YOLO object detection algorithms for weed detection in agriculture. Intell. Decis. Technol. 2025, 19, 507–519. [Google Scholar] [CrossRef]
- Bajraktari, F.; Toylan, H. Performance Evaluation of Deep Learning Object Detectors for Weed Detection for Cotton. Machines 2025, 13, 219. [Google Scholar] [CrossRef]
- Kim, J.; Kim, G.; Yoshitoshi, R.; Tokuda, K. Real-Time Object Detection for Edge Computing-Based Agricultural Automation: A Case Study Comparing the YOLOX and YOLOv12 Architectures and Their Performance in Potato Harvesting Systems. Sensors 2025, 25, 4586. [Google Scholar] [CrossRef] [PubMed]
- Rai, S.; Sun, H. WeedVision: A Single-Stage Deep Learning Architecture for Weed Detection and Segmentation Using Drone-Acquired Images. Comput. Electron. Agric. 2024, 219, 108792. [Google Scholar] [CrossRef]
- Saini, P.; Nagesh, D. Robotic Weed Removal Using Deep Learning for Precision Farming. In Proceedings of the 2024 2nd International Conference on Advancements and Key Challenges in Green Energy and Computing (AKGEC), Ghaziabad, India, 21–23 November 2024; IEEE: Piscataway, NJ, USA, 2024; pp. 1–5. [Google Scholar]
- Lu, Z.; Chengao, Z.; Lu, L.; Yan, Y.; Jun, W.; Wei, X.; Ke, X.; Jun, T. Star-YOLO: A lightweight and efficient model for weed detection in cotton fields using advanced YOLOv8 improvements. Comput. Electron. Agric. 2025, 235, 110306. [Google Scholar] [CrossRef]
- Zhou, Q.; Li, H.; Cai, Z.; Zhong, Y.; Zhong, F.; Lin, X.; Wang, L. YOLO-ACE: Enhancing YOLO with Augmented Contextual Efficiency for Precision Cotton Weed Detection. Sensors 2025, 25, 1635. [Google Scholar] [CrossRef]
- Zhu, Y.; Hao, S.; Zheng, W.; Jin, C.; Yin, X.; Zhou, P. Multi-teacher cotton field weed detection model based on knowledge distillation. Trans. Chin. Soc. Agric. Eng. 2025, 41, 200–210. [Google Scholar]
- Li, Y.; Nie, J.; Chao, X. Do we really need deep CNN for plant diseases identification? Comput. Electron. Agric. 2020, 178, 105803. [Google Scholar] [CrossRef]
- Nanwal, J.; Sethi, P. A hybrid algorithm for efficient and scalable weed detection for precision in agriculture using CNN and random forest algorithm. In Progressive Computational Intelligence, Information Technology and Networking; CRC Press: Boca Raton, FL, USA, 2025; pp. 615–621. [Google Scholar]
- Macedo, F.L.; Nóbrega, H.; de Freitas, J.G.; Pinheiro de Carvalho, M.A. Assessment of Vegetation Indices Derived from UAV Imagery for Weed Detection in Vineyards. Remote. Sens. 2025, 17, 1899. [Google Scholar] [CrossRef]
- Alam, M.; Alam, M.S.; Roman, M.; Tufail, M.; Khan, M.U.; Khan, M.T. Real-time machine-learning based crop/weed detection and classification for variable-rate spraying in precision agriculture. In Proceedings of the 2020 7th International Conference on Electrical and Electronics Engineering (ICEEE), Antalya, Turkey, 14–16 April 2020; IEEE: Piscataway, NJ, USA, 2020; pp. 273–280. [Google Scholar]
- Zheng, L.; Long, L.; Zhu, C.; Jia, M.; Chen, P.; Tie, J. A lightweight cotton field weed detection model enhanced with efficientNet and attention mechanisms. Agronomy 2024, 14, 2649. [Google Scholar] [CrossRef]
- Wang, J.; Qi, Z.; Wang, Y.; Liu, Y. A lightweight weed detection model for cotton fields based on an improved YOLOv8n. Sci. Rep. 2025, 15, 457. [Google Scholar] [CrossRef]
- Qi, Z.; Wang, J.; Yang, G.; Wang, Y. Lightweight YOLOv8-Based Model for Weed Detection in Dryland Spring Wheat Fields. Sustainability 2025, 17, 6150. [Google Scholar] [CrossRef]
- Wang, A.; Peng, T.; Cao, H.; Xu, Y.; Wei, X.; Cui, B. TIA-YOLOv5: An improved YOLOv5 network for real-time detection of crop and weed in the field. Front. Plant Sci. 2022, 13, 1091655. [Google Scholar] [CrossRef] [PubMed]
- Deng, B.; Lu, Y.; Xu, J. Weed database development: An updated survey of public weed datasets and cross-season weed detection adaptation. Ecol. Inform. 2024, 81, 102546. [Google Scholar] [CrossRef]
- Hasan, A.M.; Diepeveen, D.; Laga, H.; Jones, M.G.; Sohel, F. Object-level benchmark for deep learning-based detection and classification of weed species. Crop. Prot. 2024, 177, 106561. [Google Scholar] [CrossRef]


Disclaimer/Publisher’s Note: The statements, opinions and data contained in all publications are solely those of the individual author(s) and contributor(s) and not of MDPI and/or the editor(s). MDPI and/or the editor(s) disclaim responsibility for any injury to people or property resulting from any ideas, methods, instructions or products referred to in the content. |
© 2025 by the authors. Licensee MDPI, Basel, Switzerland. This article is an open access article distributed under the terms and conditions of the Creative Commons Attribution (CC BY) license (https://creativecommons.org/licenses/by/4.0/).