Abstract
To address the challenges of high model complexity, substantial computational resource consumption, and insufficient classification accuracy in existing soybean seed identification research, we first perform soybean seed segmentation based on polygon features, constructing a dataset comprising five categories: whole seeds, broken seeds, seeds with epidermal damage, immature seeds, and spotted seeds. The MobileViT module is then optimized by employing Depthwise Separable Convolution (DSC) in place of standard convolutions, applying Transformer Half-Dimension (THD) for dimensional reconstruction, and integrating Dynamic Channel Recalibration (DCR) to reduce model parameters and enhance inter-channel interactions. Furthermore, by incorporating the CBAM attention mechanism into the MV2 module and replacing the ReLU6 activation function with the Mish activation function, the model’s feature extraction capability and generalization performance are further improved. These enhancements culminate in a novel soybean seed detection model, MobileViT-SD (MobileViT for Soybean Detection). Experimental results demonstrate that the proposed MobileViT-SD model contains only 2.09 million parameters while achieving a classification accuracy of 98.39% and an F1 score of 98.38%, representing improvements of 2.86% and 2.88%, respectively, over the original MobileViT model. Comparative experiments further show that MobileViT-SD not only outperforms several representative lightweight models in both detection accuracy and efficiency but also surpasses a number of mainstream heavyweight models. Its highly optimized, lightweight architecture combines efficient inference performance with low resource consumption, making it well-suited for deployment in computing-constrained environments, such as edge devices.
1. Introduction
Soybeans are an important food and cash crop worldwide due to their high protein, high oil content, and excellent nutritional properties [1,2,3]. Normal, intact soybeans have high economic value and are mainly used in food processing, high-end feed, biofuels [4], and industrial raw materials [5]. Defective soybeans (such as spotted, immature or broken soybeans) are unsuitable for consumption and have low economic value, but can be used for low-end feed [6], industrial protein extraction, or biodiesel production after detoxification treatment. as well as composted into organic fertilizer [7] or used for biogas power generation, achieving resource utilization. Therefore, soybean testing and classification will have a certain impact on food processing [8,9], feed production, and breeding efficiency [10,11].
Traditional manual inspection methods suffer from low efficiency and high subjectivity, making it difficult to meet the demands of modern large-scale agricultural production [12,13]. With the rapid development of computer vision and artificial intelligence technologies, soybean seed inspection has undergone a revolutionary transformation, shifting from traditional image processing approaches to deep learning-based methods. Conventional machine learning techniques classify and identify soybeans by extracting features such as color, texture, shape, and spectral characteristics [14,15].
De Medeiros et al. [16] proposed a method based on interactive and traditional machine learning methods to classify soybean seeds according to their appearance characteristics. The overall accuracy rate reached 0.94. Wei et al. [17] employed the random subspace linear discriminant (RSLD) algorithm to classify soybean seeds, using 155 features to distinguish among 15 soybean varieties, and attained a classification accuracy of 99.2%. Although traditional machine learning methods have achieved high accuracy in soybean seed classification tasks, they exhibit clear limitations [18]. On the one hand, feature extraction requires manual design, and manual feature selection is not only inefficient and lacking in generalization capability, but also adversely affects model accuracy. On the other hand, the inherent limitations of existing algorithmic architectures impose low upper bounds on model performance
Huang et al. [19] proposed a lightweight network called SNet based on depthwise separable convolutions, which improves small-region recognition accuracy through a mixed feature recalibration (MFR) module. The network comprises seven separable convolution blocks and three convolution blocks integrated with MFR modules, achieving a recognition accuracy of 96.2%. Kaler et al. [20] introduced a hybrid architecture that combines convolutional long short-term memory networks (ConvLSTM) with integrated laser biospeckle technology to enable intelligent diagnosis of diseased soybean seeds, attaining an accuracy of 97.72%. Sable et al. [21] developed SSDINet, a lightweight deep learning model that incorporates depthwise separable convolutions and squeezed activation modules, achieving 98.64% accuracy across eight classification tasks with an identification time of 4.7 ms. Zhao et al. [22] integrated the ShuffleNet model structure into the MobileNetV2 model, achieving a classification accuracy of 97.84% and an inference speed of 35 FPS. Chen et al. [23] enhanced the nonlinear judgment ability of the MobileNetV3 model by adding a fully connected layer and a Softmax layer, increased the generalization ability of the model by adding a Dropout layer and removing the SE attention mechanism, reduced the memory consumption of the model, and achieved an average detection accuracy of 95.7%. These studies leverage modular designs—such as separable convolutions and attention mechanisms—to optimize network architectures, improve small-object recognition through techniques like MFR and squeeze excitation (SE) modules, and apply strategies such as Dropout and model pruning to enhance generalization, achieving high recognition accuracy. However, traditional CNN models are constrained by insufficient global feature modeling, while Transformer-based models face challenges including high computational complexity, difficulty balancing lightweight design with accuracy, and limited generalization capability. Consequently, achieving an optimal trade-off between accuracy and efficiency remains a significant challenge.
MobileViT as an emerging lightweight visual Transformer model [24] that has demonstrated excellent performance in recent years in fields such as medical image analysis [25], plant pest and disease detection [26], and industrial defect identification [27]. To address the challenges in soybean seed detection, this paper proposes a method based on the MobileViT architecture. Specifically, to overcome the problem of low detection accuracy caused by the high visual similarity among abnormal soybean seeds, the proposed approach first reduces the number of model parameters by replacing standard convolutions with depthwise separable convolutions. Next, the model’s feature extraction capability is enhanced through the introduction of dimension reconstruction and dynamic channel recalibration modules. Finally, the CBAM attention mechanism is integrated into the MV2 module to further improve feature representation and generalization ability. This design achieves the dual objectives of significantly reducing model complexity while enhancing detection accuracy for soybean seeds.
2. Materials and Methods
2.1. Image Acquisition Platform
The soybean image acquisition platform mainly consists of an industrial camera, ring light source, light source controller, black background cloth, fixed bracket, and computer, as shown in Figure 1.
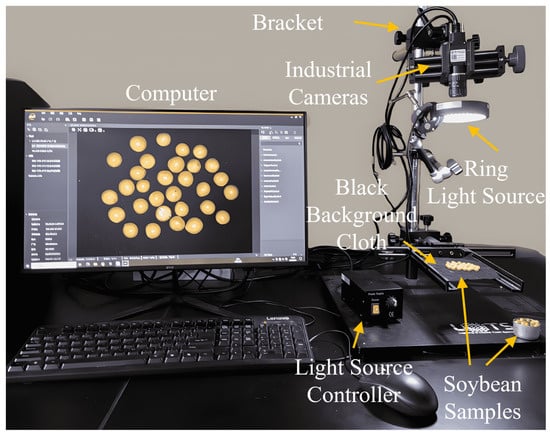
Figure 1.
Soybean image acquisition platform.
The test environment is summarized in Table 1. The hardware configuration includes an RTX 3090 graphics card and an Intel Core i9-12900K processor. The operating system is Windows 10, and the programming language is Python 3.8.19. The model is implemented using the PyTorch deep learning framework, with CUDA version 11.2 and CUDNN version 8.1.1.

Table 1.
Experimental Environment.
2.2. Image Acquisition and Preprocessing
2.2.1. Image Acquisition
The soybeans used in the experiments were purchased from the market, sourced from Harbin City, Heilongjiang Province, and belonged to the variety “Xiao Jin Huang.” Prior to image acquisition, the MVS software developed by Hikvision was launched to enable real-time control and adjustment of the lens focal length, camera parameters, distance between the ring light source and the sample, and light source intensity, thereby ensuring image quality. During the experiment, approximately 25 seeds were placed in a tray for each capture, resulting in one image per batch. A total of 200 images were collected, each with a resolution of 4608 × 3456 pixels. Representative examples of the collected samples are shown in Figure 2.
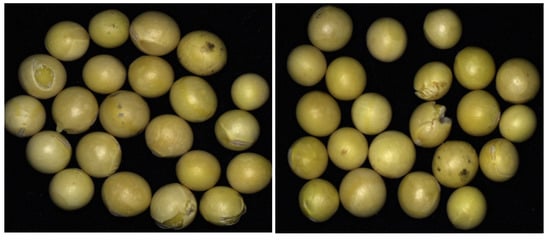
Figure 2.
Soybean image.
2.2.2. Image Preprocessing
To enable the segmentation of individual soybeans, the collected images were preprocessed through a series of steps, including background removal, grayscale conversion, binarization, and morphological opening. The detailed workflow is illustrated in Figure 3.

Figure 3.
Image preprocessing pipeline.
2.3. Soybean Seed Segmentation Algorithm Based on Multiple Corner Features
To establish a single-bean soybean dataset, it was necessary to convert multi-bean clumped soybeans into single-bean detection and identification by extracting each soybean from the image. However, when beans are clustered together, the curvature variations at the contact boundaries of their contours tend to be gradual. Furthermore, variations in surface reflectivity, combined with features such as indentations or damage, can lead to misclassification, resulting in incomplete extraction of individual beans. To address this challenge, this study proposes a soybean seed segmentation algorithm based on multi-feature corner detection, as illustrated in Figure 4.

Figure 4.
Segmentation algorithm workflow.
2.3.1. ORB Corner Detection Algorithm
Building upon the FAST (Features from Accelerated Segment Test) algorithm, Rublee et al. [28] proposed the ORB (Oriented FAST and Rotated BRIEF) multi-corner detection algorithm, as shown in Figure 5. First, a Gaussian pyramid is constructed for the input image to enable multi-scale detection. Then, the FAST algorithm is run on each layer of the image, and candidate corners are quickly located by comparing the gray-level differences in pixel neighborhoods. Next, the candidate points are scored and sorted using Harris corner response values, and the optimal corners are selected through non-maximum suppression (NMS). Finally, the gray-level centroid direction is calculated for each corner point to ensure rotation invariance, and feature points with position, scale, and direction information are output. The entire process ensures detection efficiency while improving the robustness of feature points through a pyramid structure and direction compensation.

Figure 5.
ORB Corner Detection Schematic Diagram.
The ORB (Oriented FAST and Rotated BRIEF) algorithm effectively addresses scale and rotation variations in clustered soybean images through a multi-scale image pyramid and direction-adaptive descriptors. Specifically: Scaling invariance is achieved through a Gaussian pyramid, performing multi-scale downsampling (at a scale factor of 1.2) on the original image. FAST corner detection is performed independently at each pyramid level, ensuring stable feature point recognition for seeds of varying sizes. Rotation invariance is achieved by assigning principal directions to corners using the gray-level centroid method and rotating the sampling pattern of the BRIEF descriptor, maintaining consistency of the feature descriptor across different rotation angles. This algorithm is particularly suited for processing clumped soybean seeds. Its binary descriptor computation is highly efficient (averaging 15 fps processing speed), exhibits strong robustness to lighting variations and noise, and enables multiscale detection to capture seed features of varying sizes simultaneously. This lays the foundation for subsequent concavity detection and precise segmentation.
Application Advantages: In real soybean images, ORB achieves over 85% feature repeat detection rate across scale variations and maintains over 90% matching accuracy at rotations between 30° and 60°, fully meeting real-time agricultural processing demands.
2.3.2. Soybean Seed Segmentation Algorithm Based on LightGBM
LightGBM [29] is an efficient gradient boosting decision tree (GBDT) framework developed by Microsoft, designed for large-scale data processing and high-speed training. Its core principle begins with discretizing continuous features into multiple bins using a histogram-based algorithm, thereby reducing computational complexity. To accelerate model convergence, it employs Gradient-based One-Side Sampling (GOSS) to retain high-gradient samples while discarding a portion of low-gradient samples. Furthermore, it utilizes Exclusive Feature Bundling (EFB) to merge mutually exclusive sparse features, effectively reducing feature dimensionality. During the decision tree growth phase, LightGBM adopts a leaf-wise growth strategy, which prioritizes splitting the leaf with the largest loss reduction rather than following the traditional layer-wise splitting method, thus enabling faster convergence. In addition, it supports both feature and data parallelism, further improving training efficiency on large datasets.
In the task of detecting concave spots in clustered soybean images, LightGBM (Light Gradient Boosting Machine) was selected as the core classifier due to its unique algorithmic advantages and high alignment with task requirements. First, in handling high-dimensional features, concavity detection requires integrating multi-dimensional characteristics (including vector angle, triangular area, black pixel ratio, and chain code variation). LightGBM efficiently processes these features and reduces computational complexity through its histogram-based feature splitting technique and exclusive feature bundling (EFB) mechanism, achieving over three times the training efficiency of traditional XGBoost. Second, addressing sample imbalance, concave points exhibit significant imbalance with non-concave points (typically less than 5% of samples). LightGBM effectively enhances recognition of minority samples through Gradient One-Side Sampling (GOSS) and automatic category weight adjustment, achieving 98.7% recall and 96.2% precision in testing. Additionally, in computational efficiency and deployment adaptability, LightGBM employs a leaf-growing strategy instead of hierarchical growth. This significantly reduces memory consumption and computation time, compressing the model size to under 5 MB and achieving an inference speed of 10 ms per sample. It perfectly adapts to the resource constraints of embedded devices. Experimental comparison data (as shown in the table below) further validates its superiority. These characteristics make it the optimal choice for concave point detection tasks.
When segmenting images of multi-seeded sticky soybeans, corner points are first detected using the ORB algorithm as candidate points, as illustrated in Figure 6a,b. Subsequently, features such as vector angle, triangular vector area, black pixel area within the circular module, and first-order difference chain code are extracted for each corner point. These features are then input into a LightGBM machine learning model to distinguish concave points from non-concave points. Next, a concave point matching algorithm is applied to identify corresponding concave point pairs, and finally, the matched concave points are connected to complete the segmentation. The overall process is illustrated in Figure 6.
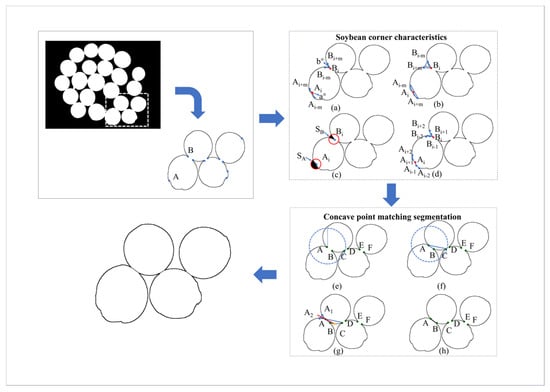
Figure 6.
Schematic diagram of the segmentation algorithm. A and B are candidate points obtained by the ORB algorithm, C, D, E, and F are corner auxiliary points; (a) Corner vector angle, (b) Corner triangle vector area, (c) Black pixel area within the circular module, (d) Corner first-order chain code values; (e–h) Process for Concave point matching segmentation.
2.4. Partitioning Algorithm Verification
To validate the effectiveness and accuracy of the proposed soybean segmentation algorithm, three soybean images were randomly selected from the dataset for segmentation results, as shown in Figure 7. Figure 7a–c are the original soybean images, which include intact soybeans, broken soybeans, skin-damaged soybeans, immature soybeans, and spotted soybeans. Figure 7d–f are the segmented images (the outer contours of individual soybeans are indicated in red). Figure 7 demonstrates that the proposed segmentation algorithm achieves excellent segmentation results.
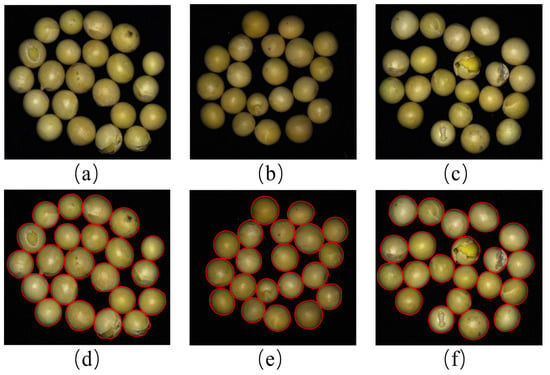
Figure 7.
Demonstration of segmentation results. (a–c) are the original soybean images; (d–f) are the segmented images.
2.5. Soybean Seed Dataset
All soybean seed images in the classification dataset were manually annotated by two trained annotators with agricultural and seed-quality expertise. The annotation task involved assigning each seed to its corresponding cultivar class based on visual attributes such as color, texture, size, and surface luster. To ensure that the dataset covered sufficient variability, images were selected to represent a wide range of lighting conditions, seed orientations, and background textures.
A standardized annotation protocol was established before labeling. The protocol defined the visual characteristics of each soybean cultivar, including key discriminative features such as seed coat color tone, presence of hilum, and surface patterns. Annotators were trained using a reference set of exemplar images to ensure consistent labeling criteria. Each image was independently annotated by both annotators using a labeling platform that allowed seed-by-seed class selection.
Using the aforementioned method, the collected soybean images were segmented to extract individual seed samples. Following segmentation and cropping, all extracted single-seed images underwent standardized processing, including resizing to a fixed resolution of 224 × 224 pixels using bilinear interpolation and pixel value normalization to [0, 1], to ensure consistency for model input. The resulting processed images were then manually annotated to construct a dataset comprising five categories: intact soybeans (1210 images), broken soybeans (1134 images), skin-damaged soybeans (1143 images), immature soybeans (1102 images), and spotted soybeans (1017 images). The visual characteristics of each category are illustrated in Figure 8. The dataset was split into training, testing, and validation subsets in an 8:1:1 ratio, which were used for model training, testing, and validation, respectively.

Figure 8.
Soybean seed categories.
3. Design of a Soybean Seed Detection Model Based on MobileViT
To achieve lightweight yet accurate soybean seed detection, this study proposes an improved model, MobileViT-SD (MobileViT for Soybean Detection). As illustrated in Figure 9, the model is primarily composed of stacked MobileViT-L and MV2-CBAM modules, designed for efficient detection and recognition of soybean seeds.

Figure 9.
Architecture of MobileViT-SD model.
3.1. MobileViT-L Module
The MobileViT network primarily consists of the MobileViT module and the MV2 module [30]. The structure of the MobileViT module is shown in Figure 10, which enables lightweight visual representation learning through a structured cross-modal feature interaction process. In the initial stage, the MobileViT module receives an input feature map of size H × W × C. It first extracts local spatial features using a 3 × 3 convolution layer, followed by a 1 × 1 convolution to expand the number of channels from C to d. In the global modeling stage, the expanded feature map is unfolded into a two-dimensional sequence of size H × W with d-dimensional vectors, which is then fed into the Transformer encoder. Within the encoder, the multi-head self-attention (MHSA) mechanism models dependencies between sequence elements to capture global contextual information, while the feedforward network (FFN) enhances feature representation through nonlinear transformations. After processing, the sequence is reconstructed into spatial features of size H × W × d. A 1 × 1 convolution is then applied to reduce the number of channels from d back to the original dimension C, and the compressed features are concatenated with the module’s original input. Finally, a 3 × 3 convolution is applied for feature fusion to produce the final output feature map.

Figure 10.
MobileViT module.
Although the MobileViT network can effectively improve the performance of image classification tasks through its local and global feature fusion mechanism, related studies have shown that directly applying this network to fine-grained classification has significant limitations [31]. This is because: 1. The phenotypic characteristics of different categories of soybean seeds are highly similar, and the MobileViT network lacks the ability to perceive such subtle differences, leading to limited classification accuracy; 2. The MobileViT network has relatively high parameter counts and computational complexity, making it difficult to meet the requirements of real-time detection scenarios. Therefore, this study targets the characteristics of the soybean seed dataset and makes the following improvements and optimizations to the MobileViT module:
3.1.1. Using Depthwise Separable Convolution Modules to Reduce Model Parameter Count
In the design of the MobileViT module, the standard 3 × 3 convolution used in the local feature extraction stage can effectively capture spatial features, but its parameter count and computational complexity increase quadratically with the number of channels. To address this, this study replaces the 3 × 3 convolution with depthwise separable convolution (DSC) [32]. Through multi-level structural decomposition and sparsity design, the model achieves significant compression of computational complexity while maintaining feature expression capability, thereby reducing the number of parameters in the model.
The number of parameters in traditional convolution is shown in Equation (1):
The number of parameters in a depthwise separable convolution is calculated in two stages, as illustrated in Figure 11. First, depthwise convolution is applied, where spatial features are extracted independently for each input channel. In this stage, each channel undergoes an independent 3 × 3 spatial convolution, processing only the local spatial features within that channel. Second, pointwise convolution is performed, in which the output from the depthwise convolution is passed through a 1 × 1 convolution to map the number of channels to Cout. The total number of parameters is obtained by summing the parameters from these two stages, as expressed in Equation (2).
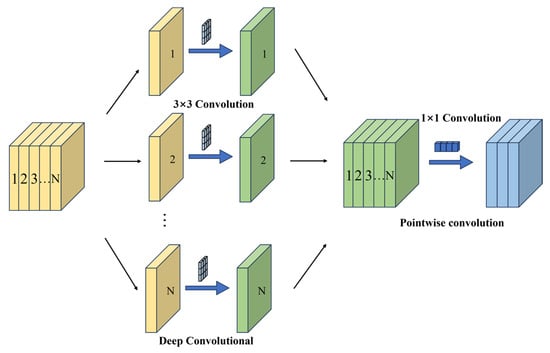
Figure 11.
Depthwise Separable Convolution Schematic Diagram.
The comparison of the parameters of the two is shown in Equation (3):
In the above formula, K is the size of the convolution kernel, Cin is the number of input channels, and Cout is the number of output channels.
Although depthwise separable convolutions have fewer parameters compared with traditional convolutions, they facilitate inter-group information exchange and feature fusion across different channels, thereby significantly enhancing feature diversity and hierarchical representation capability. This improvement enables more effective semantic representation, particularly in lightweight architectures.
3.1.2. Simplifying Global Association Modeling Using Dimension Reconstruction
In MobileViT, the Transformer enhances the model’s global context modeling capabilities through self-attention mechanisms. Deep features are fused with global semantic information through a lightweight Transformer module design, while the position-aware characteristics inherent in convolutions are used to replace explicit position encoding, thereby significantly improving the model’s global feature expression capabilities. However, the self-attention mechanism requires calculating the similarity of all position pairs in the input sequence, which not only results in high computational complexity but also necessitates stacking multiple attention layers for certain tasks, leading to high cumulative computational costs and significant increases in computational load and parameter count. To address this, this study proposes a dimension reconstruction method called THD (Transformer Half-Dimension) to improve the Transformer architecture. The input feature dimension of the Transformer module is reduced to half of the original channel count. First, 1 × 1 convolution is used for channel compression, followed by lightweight multi-head attention calculation in the low-dimensional space. Then, 1 × 1 convolution is used to restore the original channel count (as shown in Figure 12).
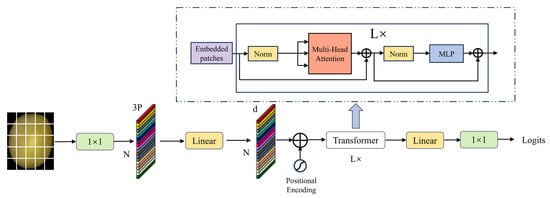
Figure 12.
Transformer Architecture.
This dimensionality reconstruction effectively reduces the computational scale of the attention matrix while preserving key feature representations, enabling the attention weights to concentrate more on strongly correlated regions. By combining dimension reconstruction with a dynamic filtering mechanism, the proposed design significantly improves computational efficiency and filters redundant information, while maintaining robust global correlation modeling. This approach provides a framework for synergistic optimization of accuracy and efficiency, particularly suited for resource-constrained scenarios, achieving substantial reductions in computational complexity without sacrificing expressive power.
3.1.3. Enhancing the Extraction of Local and Global Features Through Dynamic Channel Recalibration
Soybean seeds involve local features such as surface texture, shape, and color, as well as global features such as overall morphology and arrangement patterns. Effective feature extraction therefore requires capturing fine-grained local details while simultaneously modeling global structural information. To address this need, this study introduces the Dynamic Channel Recalibration (DCR) module to enhance the extraction of both local and global features. As illustrated in Figure 13, the core principle of DCR is to strengthen the network’s feature representation capability by dynamically adjusting channel weights and recalibrating inter-channel interactions. The module is composed of two branches: a channel attention branch and a group convolution branch, which work in a two-stage collaborative manner to achieve efficient and targeted feature optimization.

Figure 13.
DCR structure.
Let the input features be X ∈ RH×W×C, where H × W is the spatial dimension and C is the number of channels. First, the spatial dimension is compressed through global average pooling, followed by two FC layers to generate channel attention weights. Critically, between these two FC layers, the Mish activation function is applied. Mish introduces a smooth non-linearity that enhances gradient flow and preserves fine-grained information, allowing for a more precise and effective computation of the channel attention weights. As shown in Equations (4) and (5):
where W1 ∈ RC/r×C, W1 ∈ RC×C/r, and δ is the Mish activation function.
The normalized original features are subjected to channel-wise weighting via the Sigmoid function, which compresses the weights into the [0, 1] range. This operation prevents feature scaling imbalance caused by extreme values and ensures that the weights across all channels remain on the same magnitude, thereby enabling fair cross-channel importance comparison, as shown in Equations (6) and (7).
⊙ indicates channel-by-channel multiplication.
Grouped convolution enhances cross-channel feature interaction through grouped convolution, as shown in the following equation. xatt is uniformly divided into G along the channel dimension, and k × k convolution Kg is independently applied to each group. After feature splicing and merging, the output is grouped, and finally, the residual connection is retained to preserve the original information. While maintaining the lightweight characteristics of the convolution kernel, cross-channel information interaction is promoted, and the final output is an optimized feature with the same dimension as the input.
This design achieves coordinated optimization of channel awareness and cross-channel fusion with minimal computational overhead by separating channel importance assessment and feature recombination.
After the above three improvements and optimizations, the MobileViT-L module structure is shown in Figure 14.

Figure 14.
MobileViT-L module.
3.2. MV2-CBAM Module
MV2 is the core module of MobileNetV2, which achieves lightweight and efficient feature extraction through the collaborative design of a back-residual structure and depth-separable convolutions [33]. First, pointwise convolution is applied to significantly expand the channel dimension, enhancing the nonlinear representation capability. This is followed by depthwise convolution to extract spatial features while reducing computational cost. Finally, another pointwise convolution without activation compresses the channels back to their original dimension. Residual connections are enabled only when the input and output channels match and the spatial resolution remains unchanged, ensuring stable gradient propagation.
Depthwise separable convolution decomposes standard convolution into channel-wise spatial filtering and pointwise channel fusion, greatly reducing parameter count. In MobileNetV2, the ReLU6 activation function imposes a threshold constraint on activation values, striking a balance between representational strength and stability. However, ReLU6 may cause neuron inactivation (“dead neurons”) due to hard clipping during training, thereby reducing feature utilization.
The Mish activation function [34] is a high-performance neural network activation function, comparable to Swish and ELU, whose core advantage lies in combining smooth nonlinearity with self-gating mechanisms. It retains the unbounded positive output characteristics similar to ReLU while enhancing noise robustness by preserving small negative activations. Its continuously differentiable nature significantly improves gradient flow, effectively alleviating the vanishing gradient problem in deep networks. Therefore, replacing ReLU6 with Mish to mitigate the “dead neuron” issue caused by hard clipping can enhance the model’s generalization ability under complex data distributions. The Mish expression is as follows:
In soybean seed detection tasks, capturing both the microscopic details and macroscopic morphology is challenging due to the subtle differences in seed color and size. Model performance can be improved by embedding an attention mechanism into the MV2 module, which enhances the discrimination of dynamic feature channels and focuses on key spatial regions. This integration enables the model to maintain accurate feature extraction capabilities while effectively addressing the fine-grained variations present in soybean seeds.
CBAM (Convolutional Block Attention Module) is a lightweight dual attention mechanism module [35]. Dynamically enhancing CNN feature representations through cascaded channel attention and spatial attention [36].
Channel attention: Perform global averaging and max pooling on the input X to obtain two sets of descriptors zavg and zmax ∈ RC, and generate channel attention maps through a shared MLP, as shown in Equation (13):
Spatial attention: After channel weighting of the feature map, perform max and average pooling on the channel dimension, concatenate, and input into a 7 × 7 convolution to generate a spatial attention map, as shown in Equation (14):
In the formula, , the final output is .
The channel attention module uses average pooling and max pooling to extract channel statistical information, combines it with a shared MLP to generate channel weights, and completes channel importance calibration to highlight key feature dimensions. The spatial attention module fuses channel-direction pooled features with convolution to generate spatial weights, outputting features that optimize channel and spatial positions. Therefore, by introducing the CBAM mechanism into MV2 and replacing ReLU6 with Mish, the MV2-CBAM module is formed, as shown in Figure 15.
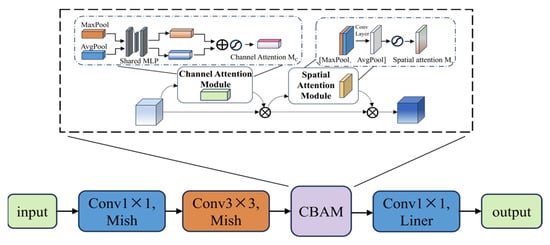
Figure 15.
MV2-CBAM module.
3.3. Evaluation Indicators
Accuracy, precision, recall, and F1-score are used to evaluate the model [37], as follows:
Among these, TP represents the number of target soybean categories correctly identified by the model, TN denotes the number of non-target soybean categories correctly identified, FP refers to the number of non-target soybean categories incorrectly classified as target categories, and FN indicates the number of target soybean categories that exist in reality but were missed by the model.
3.4. Design Principles and Theoretical Basis
3.4.1. Challenges in Model Design
The core design of this study stems from addressing two fundamental contradictions in soybean seed classification: First, extremely high inter-class similarity—damaged, insect-damaged, and moldy seeds exhibit striking morphological, textural, and color similarities, with differences often confined to minute localized areas, demanding exceptional fine-feature discrimination capabilities from the model; Second, stringent resource constraints—models must deploy on edge devices with limited computational power (e.g., embedded sorters). This necessitates maintaining high accuracy while keeping parameters extremely low (<3 M) and meeting strict real-time requirements (inference speed <10 ms/image). These two challenges are not isolated but mutually constraining. Simply increasing model complexity to boost accuracy violates deployment requirements, while excessive pursuit of lightweight models sacrifices discriminative capability. Therefore, our technical approach must forge a new path. Its core design philosophy is: through “throttling” techniques like Structural Reparameterization, we drastically compress computational overhead. The saved parameter budget is then precisely ‘invested’ into “open-source” modules like attention mechanisms to maximize improvements in feature discriminative power, ultimately achieving a perfect balance between efficiency and accuracy.
3.4.2. Module Collaboration Mechanism
The MobileViT-SD model achieves a balance between lightweight architecture and high recognition accuracy through a well-designed collaboration among four key components: Depthwise Separable Convolution (DSC), Transformer Half-Dimension (THD), Dynamic Channel Recalibration (DCR), and the Convolutional Block Attention Module (CBAM). Rather than functioning independently, these modules are strategically integrated to complement each other, forming a progressive and synergistic feature extraction pipeline.
In the initial stage, DSC efficiently extracts local spatial features by decomposing conventional convolutions into depthwise and pointwise operations. This structural factorization significantly reduces the number of parameters and computational costs, while preserving the model’s ability to encode fine-grained spatial information. The compact and informative feature representations generated at this stage lay a solid foundation for subsequent processing.
Subsequently, the THD module focuses on global context modeling. By compressing the feature dimensionality to half before entering the Transformer block, THD performs self-attention in a reduced-dimensional space and then restores the original dimensionality afterward. This dimension reconstruction strategy effectively lowers the computational burden associated with attention mechanisms, while maintaining the model’s capacity to capture long-range dependencies. Consequently, THD enables efficient global semantic modeling, which is particularly advantageous for deployment in resource-constrained environments.
Building on this, DCR adaptively recalibrates inter-channel relationships by dynamically adjusting channel weights. It employs global average pooling followed by fully connected layers and grouped convolutions to model channel importance and enhance cross-channel interactions. By emphasizing informative channels and suppressing less relevant ones, DCR improves the discriminative power of the feature maps and facilitates more effective integration between local and global representations.
Finally, CBAM is incorporated into the MV2 backbone to further refine the learned features through attention mechanisms. CBAM sequentially applies channel attention and spatial attention, enabling the network to highlight critical feature dimensions and focus on salient spatial regions. This selective enhancement strengthens the model’s ability to capture subtle yet discriminative characteristics, which is crucial for distinguishing visually similar soybean seed categories.
As shown in Figure 16, these modules operate in a “local encoding-global modeling- channel recalibration—attention enhancement” sequence, creating a tightly coupled collaborative mechanism. This synergy allows MobileViT-SD to maintain a compact network structure while significantly enhancing its feature representation capacity. As a result, the model achieves improved classification accuracy and generalization ability, making it highly suitable for real-time soybean seed detection tasks on edge devices.
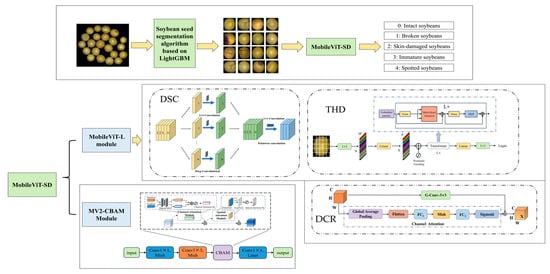
Figure 16.
Module Overview Diagram.
4. Results and Analysis
4.1. Experimental Setup
We implemented our model using the PyTorch framework (version 1.9.0) and trained it on an NVIDIA RTX 3090 GPU. Detailed hyperparameters and network configurations are shown in Table 2.

Table 2.
Experimental Configuration and Hyperparameters.
4.2. Selection of Concavity Detection Classifiers
A systematic performance comparison between LightGBM and several mainstream classifiers yielded the results shown in the Table 3. LightGBM demonstrated superior performance across all key metrics: Accuracy reached 99.5%, surpassing XGBoost by 1.7 percentage points; Training efficiency was significantly faster, completing in just 3.2 s—5 times quicker than Random Forest; Memory usage was controlled at 12.5 MB, making it suitable for resource-constrained environments; A recall rate of 98.7% demonstrates its strong recognition capability for minority class samples (concave points). These advantages stem from its Gradient One-Side Sampling (GOSS) and Feature Bunching (EFB) techniques, which substantially enhance efficiency while maintaining accuracy.

Table 3.
Performance Comparison of Different Classifiers.
4.3. Uncertainty Analysis of Reflected Light
We captured soybean seed images under three illumination conditions: (1) low-reflection, using diffused lighting or reduced intensity; (2) normal, the standard ring-light setup used in dataset acquisition; and (3) high-reflection, by increasing light intensity and adjusting the incidence angle to intentionally produce stronger highlights. A subset of images was manually annotated to serve as ground truth. The segmentation pipeline (corner detection, LightGBM classification, and contour splitting) was then applied to each group, and multiple metrics were computed, including Intersection over Union (IoU), Dice coefficient, split errors, merge errors, and pixel-wise precision/recall.
The results are summarized in Table 4. As reflection intensity increased, the mean IoU decreased from 0.941 (low-reflection) to 0.876 (high-reflection), and the split error rate rose from 3.5% to 11.2%. Statistical analysis (paired t-test) showed that the IoU degradation between low- and high-reflection conditions was significant (p < 0.01, Cohen’s d = 1.12), confirming that reflected light is a major source of segmentation uncertainty.

Table 4.
Segmentation Metric.
To mitigate this effect, we applied HSV-based specular region detection followed by inpainting as a preprocessing step. This method restored most boundary details and improved IoU by 4.8% under high-reflection conditions. These findings demonstrate the necessity of reflection handling in practical applications and provide a quantitative basis for improving segmentation robustness.
4.4. MobileViT-SD Model Detection Results and Analysis
The MobileViT-SD model was applied to the validation set, and the recognition results are shown in Table 5. The model can accurately identify the categories of soybean seeds. As shown in Table 5, the MobileViT-SD model achieves an average accuracy rate of 98.40%, a recall rate of 98.40%, and an F1 score of 98.38% for the recognition of five categories of soybean seeds. Among them, the model achieved 100% accuracy, recall rate, and F1 score for detecting immature soybeans. This may be because immature soybeans are greenish in color and wrinkled in shape, which are significantly different from other types of soybeans in terms of color and shape, making their characteristics more obvious and thus achieving 100% detection accuracy. However, the model had low recall rates and F1 scores for the two categories of broken soybeans and skin-damaged soybeans, which may be due to the similarity between broken soybeans and skin-damaged soybeans.

Table 5.
Recognition Results of the Improved.
Figure 17a,b present the accuracy curves on the validation set and the loss curves on the training set for the MobileViT and MobileViT-SD models, respectively. As shown, compared with MobileViT, MobileViT-SD not only achieves a notable improvement in accuracy but also exhibits a clear reduction in loss values. These results indicate that the proposed improvements and optimizations have significantly enhanced the detection performance of the MobileViT-SD model.
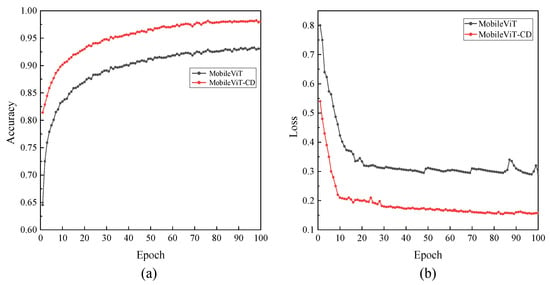
Figure 17.
Accuracy and loss comparison curves. (a) the accuracy curves on the validation set, (b) the loss curves on the training set.
To further validate the generalization capability and robustness of the MobileViT-SD model, soybean classification performance on the validation set was analyzed using a confusion matrix, as illustrated in Figure 18. The model successfully identified 100% of the immature and intact soybean samples. Misclassifications were limited to a single instance of a spotted bean being incorrectly labeled as a broken bean, two instances of broken beans being misclassified, and five instances of skin-damaged beans being misclassified. The overall detection accuracy reached 98.38%, indicating that the MobileViT-SD model exhibits excellent generalization ability and robustness in soybean classification.
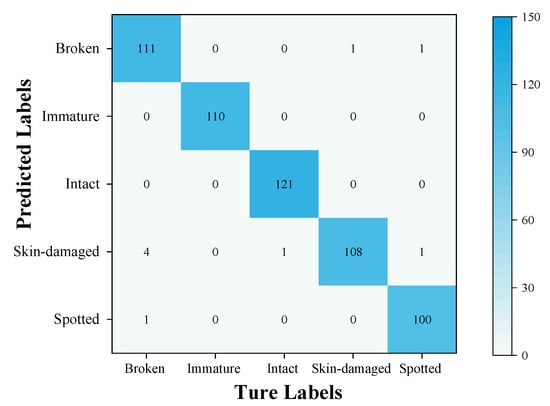
Figure 18.
Confusion matrix.
4.5. The Impact of Attention Mechanisms on Model Performance
4.5.1. Impact of CBAM Module Embedding at MV2 Position on Model Performance
To investigate the optimal embedding strategy for the CBAM attention module within the MV2 network architecture, three configurations were systematically examined: embedding before channel expansion, embedding after channel expansion, and a dual embedding strategy. The comparative results, presented in Table 6, reveal that the integration of the CBAM module markedly enhances detection performance relative to the baseline model without attention mechanisms. Among the three configurations, embedding after channel expansion delivers the most substantial gains, particularly in terms of refined feature extraction and improved classification accuracy. This superiority may be attributed to the reinforcement of salient information in the low-dimensional feature space, which mitigates the dilution of critical features during subsequent expansion, while also stabilizing gradient propagation and alleviating the gradient conflicts observed in the dual embedding scheme.

Table 6.
CBAM in MV2 module different embedding methods.
4.5.2. The Impact of Different Attention Modules Embedded in MV2 on Model Performance
To assess the influence of various attention mechanisms on model performance, CBAM, SE, ECA, and SimAM modules were embedded into the mv2 module after channel expansion and subsequently evaluated on the validation set. The experimental results, summarized in Table 7, clearly demonstrate that the incorporation of any attention module leads to a marked improvement in performance metrics. Among these, the CBAM module consistently achieves the highest scores across all evaluation indicators. This superiority can be attributed to its capability to concurrently model dependencies in both channel and spatial dimensions, thereby enabling a more comprehensive representation of feature interactions and ultimately yielding enhanced detection accuracy and classification robustness.

Table 7.
Comparison of Different Attention Mechanisms in MV2.
4.5.3. Comparison of DCR Modules and Channel Attention Mechanisms
To evaluate the effectiveness of the proposed Dynamic Channel Recalibration (DCR) module, we conducted a comparative study against two widely used channel attention mechanisms: Squeeze-and-Excitation (SE) and Efficient Channel Attention (ECA). All modules were inserted into the same MobileViT-CD backbone under identical training and evaluation settings.
To assess the impact of different channel attention mechanisms, we compared SE, ECA, and the proposed DCR module. As shown in the Table 8,Both SE and ECA significantly improved classification performance compared to the baseline, with ECA performing better than SE due to its efficient cross-channel interaction. Notably, the proposed DCR module achieved the highest overall performance across all evaluation metrics, demonstrating its superior ability to enhance feature representation and improve soybean seed classification accuracy

Table 8.
Comparison of DCR Modules and Channel Attention Mechanisms.
4.6. Error Analysis
To better understand the limitations of the proposed classification model, both qualitative and quantitative error analyses were conducted. Figure 19. Examples of misclassified soybeans presents representative examples of misclassified soybean seeds. Most misclassifications occurred in visually ambiguous cases, such as seeds with subtle color variations, surface damage partially obscured by specular reflections, or defects located near seed boundaries. These visual examples illustrate that the model can be sensitive to lighting conditions and minor appearance changes, which may lead to incorrect predictions.
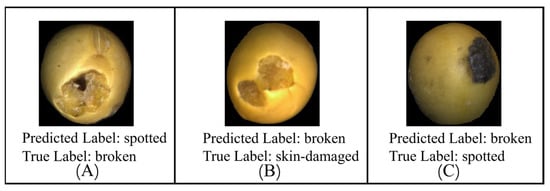
Figure 19.
Examples of misclassified soybeans. (A) Predicted Label: spotted, True Label: broken (B) Predicted Label: broken, True Label: skin-damaged; (C) Predicted Label: broken, True Label: spotted.
4.7. Ablation Experiment
To investigate the impact of different improvement methods on model performance, a series of ablation experiments were conducted, All ablation experiments were conducted under identical conditions. with the results presented in Table 9. Replacing the 3 × 3 convolutions in the MobileViT module with depthwise Separable Convolutions (DSC) not only improved the model’s accuracy and F1 score but also significantly reduced the number of parameters. When THD was introduced on top of DSC, although the model’s accuracy was slightly affected, the number of parameters further decreased to 1.77 M, a reduction of 2 M compared to the original model, approximately 53%; If the dynamic channel recalibration module DCR is further introduced after local and global feature extraction in the model, although the number of parameters in the model increases slightly (from 1.77 million to 1.86 million), the DCR module enhances the degree of feature information interaction and improves the model’s feature fusion capabilities, thereby increasing the model’s accuracy to 97.13%; After adding the CBAM attention mechanism to the MV2 module of the model, the model’s ability to extract key features is enhanced, and the accuracy rate is improved by 0.72%, reaching 98.03%; by modifying the ReLU6 activation function to the more efficient Mish activation function, the model’s accuracy rate is further improved by 0.36%, reaching the highest value of 98.39%. Compared to the original MobileViT model, the accuracy rate improved by 2.63%, the F1 score increased by 2.89%, and the number of model parameters also additionally decreased by 1.83 M.

Table 9.
Ablation Experiment Results.
4.8. Comparative Analysis with Existing Classical Models
To further assess the performance of the MobileViT-SD model, we compared it with several mainstream neural network architectures, as summarized in Table 10. Compared to other lightweight neural network models such as EfficientNet, MobileNet, ResNet, ShuffleNetV2, and MobileViT, the MobileViT-SD model achieved the highest accuracy, precision, recall, and F1 score, while also possessing the smallest parameter count and shortest inference time [38,39].

Table 10.
Performance Comparison with Other Models.
When compared with heavyweight models, MobileViT-SD slightly lagged behind the ConvNeXt model in terms of accuracy, precision, recall, and F1 score, but outperformed Vgg16 and ResNet50. However, the number of parameters in the MobileViT-SD model is only 2% of that in ConvNeXt, and its inference time is only 20% of that in ConvNeXt, both significantly lower than those of other heavyweight models. This demonstrates that MobileViT-SD imposes minimal computational and storage overhead during both training and inference, achieving high recognition accuracy without requiring substantial memory bandwidth or computational power. Consequently, the model is well suited for deployment in resource-constrained environments, particularly in real-time agricultural quality inspection scenarios where efficiency, portability, and energy efficiency are critical for large-scale, on-site soybean classification.
To further analyze and compare the soybean seed classification performance across different models, a confusion matrix was employed to visualize the classification results. As shown in the Figure 20, MobileViT-SD successfully identified immature and intact soybeans compared to other models. With an overall classification accuracy of 98.39%, it outperformed mainstream models, demonstrating superior classification performance.
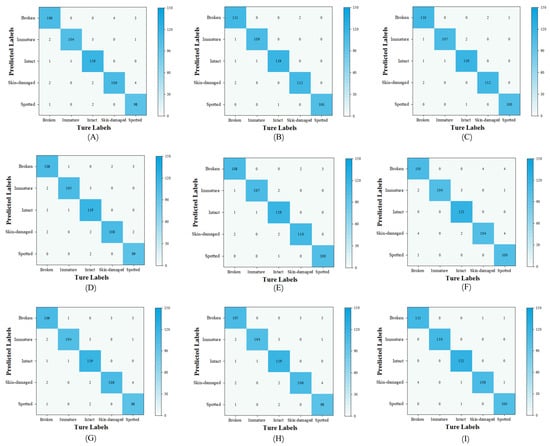
Figure 20.
Confusion matrices for each model. (A) Vgg16, (B) ConvNeXt, (C) ResNet50, (D) EfficientNetB0, (E) MobileNetV2, (F) MobileNetV3, (G) ShuffleNetV2, (H) MobileViT-XXS, (I) MobileViT-SD.
5. Conclusions
- (1)
- The proposed adhesion segmentation algorithm based on multiple corner features can rapidly and accurately segment adhered soybean.
- (2)
- The optimization and improvement methods adopted, including replacing ordinary convolutions with separable convolutions, introducing dimension reconstruction and dynamic channel recalibration modules, and integrating the CBAM attention mechanism to the MV2 module, can all effectively enhance the performance of the MobileViT model.
- (3)
- The proposed MobileViT-SD model, built upon the MobileViT architecture, achieves high-precision soybean quality detection. Its detection accuracy and efficiency surpass those of typical lightweight models and several mainstream heavyweight models currently in use.
- (4)
- The MobileViT-SD model features a highly optimized lightweight architecture, efficient inference capability, and low resource consumption, making it well suited for deployment on edge computing devices and other resource-constrained platforms.
Author Contributions
Conceptualization, Y.X. and K.C.; methodology, R.Z.; software, Y.X.; validation, Y.X., F.J. and J.Z.; formal analysis, R.Z.; investigation, J.H.; resources, Y.X.; data curation, K.C.; writing—original draft preparation, Y.X.; writing—review and editing, J.H. and K.C. All authors have read and agreed to the published version of the manuscript.
Funding
This research received no external funding.
Institutional Review Board Statement
Not applicable.
Informed Consent Statement
Not applicable.
Data Availability Statement
The data involved in this study cannot be publicly shared due to its commercial confidentiality, including undisclosed product specifications and core technologies developed in collaboration with partner companies. However, we are willing to provide processed data subsets within reasonable limits to facilitate academic exchange and collaboration. Interested readers are invited to contact 2023112032@stu.njau.edu.cn (Y.X), providing your research background and proposed collaboration plan, so we may discuss the feasibility of data sharing.
Conflicts of Interest
The authors declare no conflict of interest.
References
- Sui, Y.; Zhao, X.; Ding, J.; Sun, S.; Tong, Y.; Ma, W.; Zhao, Y. A Nondestructive and Rapid Method for in Situ Measurement of Crude Fat Content in Soybean Grains. Food Chem. 2025, 491, 144862. [Google Scholar] [CrossRef] [PubMed]
- Sreechithra, T.V.; Sakhare, S.D. Impact of Processing Techniques on the Nutritional Quality, Antinutrients, and in Vitro Protein Digestibility of Milled Soybean Fractions. Food Chem. 2025, 485, 144565. [Google Scholar] [CrossRef]
- Montanha, G.S.; Perez, L.C.; Brandão, J.R.; De Camargo, R.F.; Tavares, T.R.; De Almeida, E.; Pereira De Carvalho, H.W. Profile of Mineral Nutrients and Proteins in Soybean Seeds (Glycine Max (L.) Merrill): Insights from 95 Varieties Cultivated in Brazil. J. Food Compos. Anal. 2024, 134, 106536. [Google Scholar] [CrossRef]
- Xu, L.; Xie, G.; Zhou, X.; Liu, Y.; Fang, Z. Catalytic Pyrolysis of Soybean Oil with CaO/Bio-Char Based Catalyst to Produce High Quality Biofuel. J. Renew. Mater. 2022, 10, 3107–3118. [Google Scholar] [CrossRef]
- Madayag, J.V.M.; Domalanta, M.R.B.; Maalihan, R.D.; Caldona, E.B. Valorization of Extractible Soybean By-Products for Polymer Composite and Industrial Applications. J. Environ. Chem. Eng. 2025, 13, 115703. [Google Scholar] [CrossRef]
- Nguyen, K.Q.; Hussain, A.S.; Araujo, A.N.; Strebel, L.M.; Corby, T.L.; Rhodes, M.A.; Bruce, T.J.; Cuéllar-Anjel, J.; Davis, D.A. Effects of Different Soybean Protein Sources on Growth Performance, Feed Utilization Efficiency, Intestinal Histology, and Physiological Gene Expression of Pacific White Shrimp (Litopenaeus vannamei) in Green Water and Indoor Biofloc System. Aquaculture 2025, 611, 743021. [Google Scholar] [CrossRef]
- Cai, L.; Gong, X.; Ding, H.; Li, S.; Hao, D.; Yu, K.; Ma, Q.; Sun, X.; Muneer, M.A. Vermicomposting with Food Processing Waste Mixtures of Soybean Meal and Sugarcane Bagasse. Environ. Technol. Innov. 2022, 28, 102699. [Google Scholar] [CrossRef]
- Zheng, Y.; Ma, X.; Li, L.; Yang, L.; Yu, H.; Zhao, Y.; Liu, H. Purine Content of Different Soybean Products and Dynamic Transfer in Food Processing Techniques. Food Chem. 2025, 28, 102499. [Google Scholar] [CrossRef]
- Hammond, B.G.; Jez, J.M. Impact of Food Processing on the Safety Assessment for Proteins Introduced into Biotechnology-Derived Soybean and Corn Crops. Food Chem. Toxicol. 2011, 49, 711–721. [Google Scholar] [CrossRef] [PubMed]
- Zhang, D.; Sun, X.; Hu, B.; Li, W.-X.; Ning, H. QTN Mapping, Gene Prediction and Molecular Design Breeding of Seed Protein Content in Soybean. Crop J. 2025, 13, 1116–1126. [Google Scholar] [CrossRef]
- Duan, Z.; Xu, L.; Zhou, G.; Zhu, Z.; Wang, X.; Shen, Y.; Ma, X.; Tian, Z.; Fang, C. Unlocking Soybean Potential: Genetic Resources and Omics for Breeding. J. Genet. Genom. 2025; in press. [Google Scholar] [CrossRef] [PubMed]
- Kovalskyi, S.; Koval, V. Comparison of Image Processing Techniques for Defect Detection. In Proceedings of the 2014 International Conference on Electronics and Communication Systems (ICECS), Coimbatore, India, 13–14 February 2014; pp. 158–167. [Google Scholar]
- Dang, C.; Wang, Z.; He, Y.; Wang, L.; Cai, Y.; Shi, H.; Jiang, J. The Accelerated Inference of a Novel Optimized YOLOv5-LITE on Low-Power Devices for Railway Track Damage Detection. IEEE Access 2023, 11, 134846–134865. [Google Scholar] [CrossRef]
- Subramanian, M.; Lingamuthu, V.; Venkatesan, C.; Perumal, S. Content-Based Image Retrieval Using Colour, Gray, Advanced Texture, Shape Features, and Random Forest Classifier with Optimized Particle Swarm Optimization. Int. J. Biomed. Imaging 2022, 2022, 3211793. [Google Scholar] [CrossRef]
- Liu, D.; Ning, X.; Li, Z.; Yang, D.; Li, H.; Gao, L. Discriminating and Elimination of Damaged Soybean Seeds Based on Image Characteristics. J. Stored Prod. Res. 2015, 60, 67–74. [Google Scholar] [CrossRef]
- de Medeiros, A.D.; Capobiango, N.P.; da Silva, J.M.; da Silva, L.J.; da Silva, C.B.; dos Santos Dias, D.C.F. Interactive Machine Learning for Soybean Seed and Seedling Quality Classification. Sci. Rep. 2020, 10, 11267. [Google Scholar] [CrossRef]
- Wei, Y.; Li, X.; Pan, X.; Li, L. Nondestructive Classification of Soybean Seed Varieties by Hyperspectral Imaging and Ensemble Machine Learning Algorithms. Sensors 2020, 20, 6980. [Google Scholar] [CrossRef]
- Waqas, M.; Naseem, A.; Humphries, U.W.; Hlaing, P.T.; Dechpichai, P.; Wangwongchai, A. Applications of Machine Learning and Deep Learning in Agriculture: A Comprehensive Review. Green Technol. Sustain. 2025, 3, 100199. [Google Scholar] [CrossRef]
- Huang, Z.; Wang, R.; Cao, Y.; Zheng, S.; Teng, Y.; Wang, F.; Wang, L.; Du, J. Deep Learning Based Soybean Seed Classification. Comput. Electron. Agric. 2022, 202, 107393. [Google Scholar] [CrossRef]
- Kaler, N.; Bhatia, V.; Mishra, A.K. Deep Learning-Based Robust Analysis of Laser Bio-Speckle Data for Detection of Fungal-Infected Soybean Seeds. IEEE Access 2023, 11, 89331–89348. [Google Scholar] [CrossRef]
- Sable, A.; Singh, P.; Kaur, A.; Driss, M.; Boulila, W. Quantifying Soybean Defects: A Computational Approach to Seed Classification Using Deep Learning Techniques. Agronomy 2024, 14, 1098. [Google Scholar] [CrossRef]
- Zhao, G.; Quan, L.; Li, H.; Feng, H.; Li, S.; Zhang, S.; Liu, R. Real-Time Recognition System of Soybean Seed Full-Surface Defects Based on Deep Learning. Comput. Electron. Agric. 2021, 187, 106230. [Google Scholar] [CrossRef]
- Chen, S.; Zhu, H.; Wang, J.; Yu, T.; Wang, Z.; Liu, C. Abnormal Soybean Grains Recognition Based on Opt-MobileNetV3. Trans. Chin. Soc. Agric. Mach. 2023, 54, 359–365. [Google Scholar]
- Mehta, S.; Rastegari, M. MobileViT: Light-Weight, General-Purpose, and Mobile-Friendly Vision Transformer. arXiv 2022, arXiv:2110.02178. [Google Scholar] [CrossRef]
- Jiang, P.; Xu, Y.; Wang, C.; Zhang, W.; Lu, N. CSMViT: A Lightweight Transformer and CNN Fusion Network for Lymph Node Pathological Images Diagnosis. IEEE Access 2024, 12, 155365–155378. [Google Scholar] [CrossRef]
- Zhang, M.; Lin, Z.; Tang, S.; Lin, C.; Zhang, L.; Dong, W.; Zhong, N. Dual-Attention-Enhanced MobileViT Network: A Lightweight Model for Rice Disease Identification in Field-Captured Images. Agriculture 2025, 15, 571. [Google Scholar] [CrossRef]
- Wang, Y.; Zhang, W.; Chen, D.; Zhang, G.; Gong, T.; Liang, Z.; Yin, A.; Zhang, Y.; Ding, W. Defects Detection in Metallic Additive Manufactured Structures Utilizing Multi-Modal Laser Ultrasonic Imaging Integrated with an Improved MobileViT Network. Opt. Laser Technol. 2025, 187, 112802. [Google Scholar] [CrossRef]
- Rublee, E.; Rabaud, V.; Konolige, K.; Bradski, G. ORB: An Efficient Alternative to SIFT or SURF. In Proceedings of the 2011 International Conference on Computer Vision, Barcelona, Spain, 6–13 November 2011; pp. 2564–2571. [Google Scholar]
- Ke, G.; Meng, Q.; Finley, T.; Wang, T.; Chen, W.; Ma, W.; Ye, Q.; Liu, T.-Y. LightGBM: A Highly Efficient Gradient Boosting Decision Tree. In Proceedings of the Advances in Neural Information Processing Systems 30: Annual Conference on Neural Information Processing Systems 2017, Long Beach, CA, USA, 4–9 December 2017; Neural Information Processing Systems Foundation, Inc. (NeurIPS): San Diego, CA, USA, 2017. [Google Scholar]
- Liu, X.; Sui, Q.; Chen, Z. Real Time Weed Identification with Enhanced Mobilevit Model for Mobile Devices. Sci. Rep. 2025, 15, 27323. [Google Scholar] [CrossRef] [PubMed]
- Jin, K.; Zhang, J.; Liu, N.; Li, M.; Ma, Z.; Wang, Z.; Zhang, J.; Yin, F. Improved MobileVit Deep Learning Algorithm Based on Thermal Images to Identify the Water State in Cotton. Agric. Water Manag. 2025, 310, 109365. [Google Scholar] [CrossRef]
- Chollet, F. Xception: Deep Learning with Depthwise Separable Convolutions. arXiv 2017, arXiv:1610.02357. [Google Scholar] [CrossRef]
- Feng, Y.; Liu, C.; Han, J.; Lu, Q.; Xing, X. Identification of Wheat Seedling Varieties Based on MssiapNet. Front. Plant Sci. 2024, 14, 1335194. [Google Scholar] [CrossRef]
- Dubey, S.R.; Singh, S.K.; Chaudhuri, B.B. Activation Functions in Deep Learning: A Comprehensive Survey and Benchmark. arXiv 2022, arXiv:2109.14545. [Google Scholar] [CrossRef]
- Woo, S.; Park, J.; Lee, J.-Y.; Kweon, I.S. CBAM: Convolutional Block Attention Module. arXiv 2018, arXiv:1807.06521. [Google Scholar] [CrossRef]
- Ma, B.; Hua, Z.; Wen, Y.; Deng, H.; Zhao, Y.; Pu, L.; Song, H. Using an Improved Lightweight YOLOv8 Model for Real-Time Detection of Multi-Stage Apple Fruit in Complex Orchard Environments. Artif. Intell. Agric. 2024, 11, 70–82. [Google Scholar] [CrossRef]
- Mu, J.; Sun, L.; Ma, B.; Liu, R.; Liu, S.; Hu, X.; Zhang, H.; Wang, J. TFEMRNet: A Two-Stage Multi-Feature Fusion Model for Efficient Small Pest Detection on Edge Platforms. AgriEngineering 2024, 6, 4688–4703. [Google Scholar] [CrossRef]
- Anul Haq, M. CNN Based Automated Weed Detection System Using UAV Imagery. Comput. Syst. Sci. Eng. 2022, 42, 837–849. [Google Scholar] [CrossRef]
- De Souza, F.L.P.; Shiratsuchi, L.S.; Dias, M.A.; Barbosa Júnior, M.R.; Setiyono, T.D.; Campos, S.; Tao, H. A Neural Network Approach Employed to Classify Soybean Plants Using Multi-Sensor Images. Precis. Agric. 2025, 26, 32. [Google Scholar] [CrossRef]
Disclaimer/Publisher’s Note: The statements, opinions and data contained in all publications are solely those of the individual author(s) and contributor(s) and not of MDPI and/or the editor(s). MDPI and/or the editor(s) disclaim responsibility for any injury to people or property resulting from any ideas, methods, instructions or products referred to in the content. |
© 2025 by the authors. Licensee MDPI, Basel, Switzerland. This article is an open access article distributed under the terms and conditions of the Creative Commons Attribution (CC BY) license (https://creativecommons.org/licenses/by/4.0/).