Article

Lightweight and Accurate Deep Learning for Strawberry Leaf Disease Recognition: An Interpretable Approach

by
Raquel Ochoa-Ornelas
1,*,
Alberto Gudiño-Ochoa
2,
Ansel Y. Rodríguez González
3,
Leonardo Trujillo
4,5,
Daniel Fajardo-Delgado
1 and
Karla Liliana Puga-Nathal
6
1
Systems and Computation Department, Tecnológico Nacional de México/Instituto Tecnológico de Ciudad Guzmán, Ciudad Guzmán 49100, Jalisco, Mexico
2
Electronics and Computing Division, Centro Universitario de Ciencias Exactas e Ingenierías (CUCEI), Universidad de Guadalajara, Guadalajara 44430, Jalisco, Mexico
3
Centro de Investigación Científica y de Educación Superior de Ensenada, Unidad Académica Tepic, Tepic 63155, Nayarit, Mexico
4
Electric and Electronics Department, Tecnológico Nacional de México/Instituto Tecnológico de Tijuana, Tijuana 22430, Baja California, Mexico
5
LASIGE, Department of Informatics, Faculty of Sciences, University of Lisbon, 1749-016 Lisbon, Portugal
6
Basic Sciences Department, Tecnológico Nacional de México/Instituto Tecnológico de Ciudad Guzmán, Ciudad Guzmán 49100, Jalisco, Mexico
*
Author to whom correspondence should be addressed.
AgriEngineering 2025, 7(10), 355; https://doi.org/10.3390/agriengineering7100355
Submission received: 31 August 2025 / Revised: 14 October 2025 / Accepted: 15 October 2025 / Published: 21 October 2025

Abstract

Background/Objectives: Strawberry crops are vulnerable to fungal diseases that severely affect yield and quality. Deep learning has shown strong potential for plant disease recognition; however, most architectures rely on tens of millions of parameters, limiting their use in low-resource agricultural settings. This study presents Light-MobileBerryNet, a lightweight and interpretable model designed to achieve accurate strawberry disease classification while remaining computationally efficient for potential use on mobile and edge devices. Methods: The model, inspired by MobileNetV3-Small, integrates inverted residual blocks, depthwise separable convolutions, squeeze-and-excitation modules, and Swish activation to enhance efficiency. A publicly available dataset was processed using CLAHE and data augmentation, and split into training, validation, and test subsets under consistent conditions. Performance was benchmarked against state-of-the-art CNNs. Results: Light-MobileBerryNet achieved 96.6% accuracy, precision, recall, and F1-score, with a Matthews correlation coefficient of 0.96, while requiring fewer than one million parameters (~2 MB). Grad-CAM confirmed that predictions focused on biologically relevant lesion regions. Conclusions: Light-MobileBerryNet approaches state-of-the-art performance with a fraction of the computational cost, providing a practical and interpretable solution for precision agriculture.

1. Introduction

Strawberries are vulnerable to a variety of fungal diseases, including blossom blight (Botrytis spp.), gray mold (Botrytis cinerea), and powdery mildew (Podosphaera aphanis), which can significantly affect both yield and fruit quality. If not promptly identified and controlled, these diseases have the potential to disrupt the strawberry production cycle, leading to inconsistent yields [1,2,3]. Strawberries rank among the most widely consumed fruits and are extensively cultivated across the globe. Between 2015 and 2021, global annual production increased by approximately 11.6%, reaching 9.17 million tons in 2021. Early and accurate detection of these diseases is therefore essential for effective management and timely intervention [1].
Deep learning, particularly convolutional neural networks (CNNs), has demonstrated great potential in plant disease recognition due to their ability to automatically learn and extract relevant features from images [4,5,6]. Transfer learning, which consists of adapting a pre-trained model to a new dataset, is especially valuable in agricultural applications, where labeled data are often scarce [4,5,6,7,8]. This approach has been successfully applied to detect various plant diseases, including those affecting strawberries [1,2]. The integration of CNNs with transfer learning techniques represents a promising strategy to optimize disease management and improve agricultural productivity. Furthermore, the development of lightweight and interpretable models enables high accuracy and efficiency, facilitating deployment in real-world precision agriculture scenarios.
The adoption of such models offers multiple benefits, including significant economic impact, since strawberry diseases can cause substantial financial losses by reducing yield and quality [1,2,3]. Deep learning-based disease detection also allows optimization of cultivation practices, enabling early interventions and reducing pesticide use [2,9]. Moreover, transfer learning-based models require fewer data and less computational power for training, making them well suited for real-time applications in resource-limited environments [4,5,6,8,10,11].
Several deep learning models, particularly those based on transfer learning, such as VGG16, EfficientNetV2B1, and MobileNetV2, have been used for the identification and classification of various strawberry diseases, achieving high accuracy [1,2,12]. Transfer learning has shown remarkable potential to improve performance in disease detection even with small datasets, making it a reliable and adaptable solution for automating strawberry disease diagnosis [1,2,12]. In this context, MobileNetV2 stands out for its ability to achieve a balance between accuracy and efficiency, making it particularly suitable for agricultural environments where computational resources are limited [2].
Transfer learning models must be adaptable to different types of diseases, including those with visually similar symptoms. Fine-tuning pre-trained models on datasets containing specific diseases has been shown to significantly improve performance. However, achieving high accuracy in scenarios involving a variety of diseases remains challenging [13,14]. One of the main difficulties lies in the variability between the source and target domains, influenced by factors such as lighting, background, and strawberry cultivar [15]. Approaches using hyperspectral images and spectral signature analysis have been explored to enhance early detection, but these methods require specialized equipment and technical expertise [16]. However, most existing studies optimize accuracy over limited disease categories and overlook the trade-off between model compactness and generalization.
Although deep learning models have achieved strong performance, most of them rely on large, high-parameter architectures—such as EfficientNet, Inception, or ResNet—that demand substantial computational resources and are difficult to deploy in real agricultural environments [10,11,12,13,14]. Conversely, lightweight models often sacrifice accuracy or robustness, particularly when generalizing across multiple visually similar disease categories. Thus, an evident research gap persists in developing lightweight yet generalizable models that retain high diagnostic accuracy while remaining feasible for real-world agricultural deployment [10].
To address these challenges, we propose a lightweight and interpretable architecture specifically designed for strawberry disease detection. This work directly addresses that gap by proposing a scalable, interpretable CNN tailored for practical deployment in strawberry disease monitoring systems. The proposed model directly targets the above limitations by pursuing a trade-off between performance and efficiency, offering a scalable solution for mobile and edge computing scenarios. It incorporates advanced techniques inspired by architectures such as MobileNetV2, which has demonstrated high accuracy with a reduced number of parameters [2,10]. The approach also leverages pre-trained models on large datasets, subsequently fine-tuned on strawberry disease images to accelerate training and improve accuracy [1,2]. The goal is to achieve classification accuracy comparable to or surpassing current models [2,10], while ensuring computational efficiency for deployment on mobile and edge devices [10,11].
The main contributions of this work are as follows:
  • Development of a novel lightweight deep learning architecture, inspired by MobileNetV3Small, integrating Inverted Residual blocks with depthwise separable convolutions, Squeeze-and-Excitation modules, and explicit Swish activation to enhance feature extraction efficiency while maintaining low computational cost.
  • Significant reduction in model complexity, achieving a smaller number of parameters and reduced model size compared to baseline architectures such as MobileNetV3Small, MobileNetV3Large, and EfficientNetB0, enabling deployment on low-cost mobile and edge devices.
  • Interpretability through visual attention mechanisms (e.g., Grad-CAM) to highlight the region’s most influential in the model’s decision-making process.
The remainder of this paper is organized as follows: Section 2 reviews related works on plant disease detection, lightweight CNN architectures, and mobile deployment strategies. Section 3 describes the dataset, preprocessing pipeline, and the proposed lightweight CNN model. Section 4 presents the experimental results and comparative analysis with other transfer learning architectures. Section 5 discusses the implications of the findings, potential limitations, and opportunities for improvement. Finally, Section 6 concludes the paper and outlines directions for future research.

2. Related Work

Deep learning architectures, particularly CNNs, have become a dominant approach for strawberry disease detection, achieving notable success in classifying diseases such as gray mold, powdery mildew, and blossom blight [1,10,12,17,18,19,20]. Sijan Karki et al. [1] reported a 94.4% accuracy using ResNet-50 with feature extraction, specifically for Powdery Mildew Leaf, Gray Mold Leaf, and healthy leaf classification. Improvements to AlexNet through fine-tuning, aimed at reducing the number of trainable parameters and shortening training time, have yielded accuracies of up to 97.35% [1].
BerryNet-Lite, proposed by Jianping Wang et al. (2024), integrates an efficient channel attention (ECA) mechanism with a multilayer perceptron (MLP), achieving an accuracy of 99.45%—surpassing ResNet34, VGG16, and AlexNet [10]. Transfer learning has proven particularly advantageous, significantly reducing training time and trainable parameters while maintaining or even improving accuracy, a benefit that becomes more pronounced in scenarios with limited datasets [1,19].
Among pre-trained models, MobileNetV2 has achieved accuracies of 98.97% in recognizing gray mold, powdery mildew, and blossom blight [2], demonstrating a consistent balance between accuracy and computational efficiency for agricultural applications. ResNet-50, when fine-tuned, has also produced accuracies above 94.4% for strawberry disease identification [2,17,20]. DenseNet-121, after fine-tuning, achieved 94.1% accuracy, confirming its suitability for detecting diverse strawberry diseases [1,17]. EfficientNetB0–B7 variants have achieved benchmark performances exceeding 99% for strawberry disease classification, further reinforcing the potential of transfer learning for high-accuracy detection in this domain [12]. Given their balance of efficiency and accuracy, MobileNetV2 and EfficientNetB0 are considered particularly suitable for real-time monitoring and mobile deployment [2,12]. Although most studies address gray mold and powdery mildew explicitly, blossom blight is often included implicitly within broader disease classification tasks using MobileNetV2 and ResNet-50, indicating that these architectures can also handle its recognition [1,2]. Recently, several transformer-based architectures have been introduced for strawberry disease recognition. Li et al. [21] proposed a Spatial Convolutional Self-Attention Transformer (SCSA-Transformer) combining convolutional encoding and multi-head self-attention to enhance disease localization in complex backgrounds, achieving 99.1% accuracy. An optimized strawberry disease and quality detection using Vision Transformers and attention-based CNN hybrids, reporting accuracies above 98% [22]. Likewise, Nguyen et al. [23] demonstrated the potential of transfer-learned Vision Transformers for seven-class strawberry disease identification, achieving F1-scores near 0.93.
Beyond conventional classification models, alternative approaches have emerged. Mingzhou Chen et al. (2025) explored YOLOv8-based segmentation for detecting leaf lesions and powdery mildew, outperforming SOLOv2, YOLACT, and YOLOv7-seg with 92% segmentation accuracy, 85.2% recall, and 90.4% mean average precision [24]. Yousef Alhwaiti et al. (2025) compared YOLOv3 and YOLOv4, reporting 97% accuracy and 92% mAP for YOLOv3, while YOLOv4 demonstrated lower complexity, faster inference, and improved precision, achieving 98% accuracy and 98% mAP [25].
Ensemble learning has also been investigated. Haram Kim et al. (2023) combined RegNet and EfficientNet for leaf disease classification, obtaining an 85% accuracy—below expectations for strawberry leaf diseases [26]. Hyperspectral imaging, when combined with CNNs, can integrate multi-dimensional features such as spectral fingerprints and vegetation indices, achieving recognition accuracies between 88.9% and 96.6% [27]. Nevertheless, these methods require specialized equipment and substantial computational resources, limiting their practicality for on-field deployment.
Despite these advances, deep learning and transfer learning methods for strawberry disease recognition still face critical challenges. High-accuracy recognition often demands large-scale datasets [28], while variability in image acquisition—due to differences in lighting, background, and cultivar—complicates feature extraction, leading to degraded performance under complex conditions [29,30]. Even with transfer learning and advanced deep neural networks, classification performance can be hindered by domain shifts and dataset imbalance [31].
In this context, our proposed lightweight CNN addresses several of these limitations. It is inspired by MobileNetV3Small but incorporates design refinements—including Inverted Residual blocks with depthwise separable convolutions, integrated Squeeze-and-Excitation modules, and explicit Swish activation—to enhance feature representation without sacrificing efficiency. The architecture is designed to achieve a balance between accuracy and computational efficiency, making it suitable for deployment on low-cost mobile and edge devices. By combining architectural efficiency with interpretability (via Grad-CAM visualizations), the model not only delivers competitive accuracy but also provides transparent decision-making, addressing both performance and usability gaps identified in the current literature.

3. Materials and Methods

3.1. Image Datasets

The experiments in this study were conducted using the Strawberry Disease Detection Dataset (Instance Segmentation Dataset for Seven Types of Strawberry Diseases), which contains a total of 2500 images accompanied by segmentation annotation files for seven distinct strawberry disease categories. The dataset was compiled by the Artificial Intelligence Laboratory at the Department of Computer Science and Engineering, Jeonbuk National University (JBNU), and aggregates imagery from multiple reputable institutions and public repositories, including the University of Bologna, the USDA Agricultural Research Service (ARS), the University of California Agriculture and Natural Resources, Cornell University, the University of Kentucky, and other academic and governmental sources [32].
According to Afzaal et al. [32], approximately 80% of the images were collected in real greenhouse environments in South Korea using camera-equipped mobile phones under natural illumination, while the remaining 20% were obtained from open-access online agricultural repositories to increase variability in background, lighting, and disease stages. The dataset therefore includes both close-up and distant perspectives and covers different phases of disease progression, contributing to a realistic visual diversity that supports model robustness and generalization to field conditions.
The dataset comprises seven disease categories: angular leaf spot, anthracnose fruit rot, blossom blight, gray mold, leaf spot, powdery mildew (fruit), and powdery mildew (leaf). These diseases represent critical threats to strawberry production, affecting flowers and fruits during key developmental stages and causing substantial economic losses if left untreated. Representative examples of each class are shown in Figure 1.
In this work, the segmentation annotations provided in the original dataset were not used, as the main objective was to develop an image-level classification model rather than a segmentation-based approach. This design choice simplifies deployment and reflects realistic field scenarios where pixel-wise labels are typically unavailable. All images were preprocessed and augmented as described in Section 3.2 to enhance robustness under diverse illumination conditions, background variability, and field-level complexity.

3.2. Preprocessing

All images were first resized to a fixed resolution of 224 × 224 pixels to ensure consistency with the input requirements of the proposed lightweight CNN architecture. Images were converted to RGB format when necessary and stored in category-specific directories corresponding to the selected disease classes.
To improve contrast and enhance visual details relevant for disease recognition, we applied Contrast Limited Adaptive Histogram Equalization (CLAHE) to all images prior to augmentation [31,33]. For RGB images, CLAHE was applied to the luminance channel after conversion to the YUV color space, with a clip limit of 2.0 and a tile grid size of 8 × 8. This step helped normalize lighting variations and highlight disease symptoms under varying field conditions.
Following contrast enhancement, data augmentation was performed applying a diverse set of transformations to improve the model’s robustness against changes in orientation, scale, and illumination. The augmentation operations included:
  • Random rotations of up to ± 25° to simulate different camera angles;
  • Zoom scaling within a range of 0.8 to 1.2 to account for variable shooting distances;
  • Horizontal and vertical flips to replicate different leaf and fruit orientations in the field;
  • Brightness adjustments within the range [0.5, 1.5] to handle variations in natural lighting;
  • Nearest-neighbor filling for pixels introduced during geometric transformations.
Augmentation was applied iteratively until each disease class reached a target of 1000 images, ensuring a balanced dataset across all categories and reducing the risk of overfitting [34,35,36,37,38]. This approach mitigated potential class imbalance, which can adversely affect model training and evaluation. During this process, augmented images were also processed with CLAHE to maintain contrast enhancement consistency between original and synthetic samples.

3.3. Proposed Lightweight CNN Model

To address the computational and deployment constraints of in-field strawberry disease detection, we propose Light-MobileBerryNet, a lightweight convolutional neural network inspired by MobileNetV3-Small but re-designed with the following traits:
  • A key efficiency lever, which involves is the use of depthwise separable convolutions in inverted-residual (IR) blocks;
  • The ability to improve non-linear representation using the Swish activation [36,38];
  • The ability to minimize architectural redundancy by carefully selecting expansion factors, strides, and block depths to preserve accuracy while reducing parameters and multiply–accumulate operations (MACs) [39].
These choices are motivated by the need to detect fine-grained, texture-like cues (e.g., mold hyphae, lesion borders) typical of strawberry leaf disease, under edge latency and memory budgets [1,10]. The overall architecture is summarized in Figure 2.
A key efficiency lever involves the use of depthwise separable convolutions in inverted-residual (IR) blocks [40,41]. For an input with M channels and N output channels using a K × K kernel, the parameter/MAC count of a standard convolution is:
P a r a m s s t d = K 2 · M · N
where a depthwise + pointwise decomposition uses
P a r a m s d w + p w = K 2 · M + M · N
Equation (2) yields a substantial reduction when K m i n M , N . We further retain representational capacity by expanding to t M channels (expansion factor t ) before the depthwise operation and projecting back to N channels. The Swish activation function is defined as
S w i s h x = x σ β x ,     β = 1   i n   t h i s   w o r k
where x denotes the input activation, σ is the logistic sigmoid function, and β is a scaling parameter that controls the smoothness of the non-linearity [39]. Channel recalibration is achieved using SE attention, where global average pooling is applied to each feature map to obtain channel descriptors z c which are then reweighted through a bottleneck and sigmoid gating [40]:
z c = 1 H W i = 1 H j = 1 W x i j c ,       s = σ W 2 δ W 1 z ,       y i j c = s c x i j c ,
where x i j c denotes the activation at spatial location i , j and channel c , H and W are the spatial height and width of the feature map, z c is the aggregated channel descriptor obtained by global average pooling, W 1 and W 2 are the learnable weight matrices of the SE bottleneck, δ is the rectified linear unit (ReLU) activation, σ is the logistic sigmoid function, s c is the channel-wise scaling factor, y i j c is the recalibrated output activation at position i , j , c , and r is the reduction ratio of the bottleneck (we use r = 4 ) controlling the SE overhead. To facilitate quantization and pruning, the architecture was kept shallow-to-moderate (eight IR blocks), avoiding exotic operations and concentrating capacity where it benefits most, namely mid- and high-level texture cues.

3.3.1. Architecture of Light-MobileBerryNet

Given an RGB input X R 224 × 224 × 3 , the network applies a 3 × 3 stem convolution (stride 2, 16 filters) with batch normalization and ReLU, followed by eight inverted-residual blocks. A stack of eight inverted-residual blocks was used, and each block contains an optional 1 × 1 expansion to t M channels, 3 × 3 depthwise convolution with stride, SE module, and 1 × 1 projection to N output channels; Swish activations are used after expansion and depthwise. A skip connection is used when s = 1 and M = N . The stack ends with a 1 × 1 convolution (576 channels) with Swish, global average pooling, a dense layer (128 units, ReLU, L 2 regularization, dropout 0.4), and a final softmax over the seven classes. Table 1 summarizes the macro-architecture. Here, t is the expansion factor, C i n and C o u t are input/output channels of the block, and SE indicates Squeeze-and-Excitation usage.

3.3.2. Layers of Light-MobileBerryNet

The computational flow of Light-MobileBerryNet starts with a stem convolution that extracts low-level edges and textures. Specifically, the input image X R 224 × 224 × 3 is processed with a 3 × 3 convolution (stride 2, 16 filters), followed by batch normalization and the ReLU activation, producing the initial feature representation H 0 :
U = B N X · W 3 × 3 ( 16 ) ,     H 0 = R e L U ( U )
The backbone consists of eight IR blocks. Each block follows the general principle of expansion, depthwise convolution, channel recalibration via SE (Equation (4)), and projection. Formally, given an input H R H × W × M , the expansion step increases the channels to t M with a 1 × 1 convolution and Swish activation (Equation (3)) [41]:
E = B N H · W 1 × 1 t M
This is followed by a 3 × 3 depthwise convolution applied channel-wise, also activated with Swish:
D = B N E K 3 × 3
where denotes depthwise convolution. The output D is then recalibrated through the SE mechanism already described in Equation (4), yielding channel-wise scaling coefficients s c that modulate the activations [39]. The block concludes with a 1 × 1 projection to N output channels:
P = B N Y · W 1 × 1 ( N )
When the stride is one and the channel dimensions match s = 1 ,   M = N , a residual skip connection is applied, producing
H = P + H ,     i f       s = 1   Λ   M = N ,   P ,                                         o t h e r w i s e
After the IR stack, the head of the network expands the feature representation to 576 channels with a 1 × 1 convolution and Swish activation, followed by global average pooling to obtain a compact vector g:
Z = B N H · W 1 × 1 ( 576 ) ,       g = G A P ( Z )
The classification stage projects g into a 128-dimensional dense representation with ReLU activation, applies dropout regularization, and finally maps to the seven output classes with a softmax layer:
h = δ ( W f c g + b f c ) ,   h ~ = D r o p o u t 0.4 ( h ) ,       y ^ = S o f t m a x ( W c h ~ + b c )
The model is optimized by minimizing the categorical cross-entropy loss with an additional l 2 regularization term applied to the fully connected layer:
L = k = 1 3 y k log y ^ k + λ W f c 2 2
where y 0 ,   1 3 is the one-hot encoded ground truth vector, y ^ is the predicted probability distribution, and λ = 0.01 .

3.4. Visual Saliency Maps with Grad-CAM

To enhance interpretability and provide insights into the decision-making process of Light-MobileBerryNet, we employed Gradient-weighted Class Activation Mapping (Grad-CAM). This technique allows us to visualize the regions of strawberry leaves and fruits that most strongly contribute to the classification decision, thereby ensuring that the network is focusing on disease-specific lesions such as mold hyphae, blight-affected tissues, or powdery patches, rather than irrelevant background cues. The Grad-CAM approach has proven particularly useful in lightweight CNNs, where interpretability is crucial for validating model robustness in real agricultural applications [30,42,43].
Formally, let y c denote the pre-softmax score associated with class c , and let A k represent the k-th feature map of the last convolutional layer, with spatial indices i , j . Grad-CAM first computes the gradients of y c with respect to A i j k , propagating the class-specific signal back to the convolutional layer. These gradients are then global average pooled across the spatial dimensions to produce the neuron importance weights α c k :
α c k = 1 Z i j y c A i j k
where Z = H × W is the product of the height and width of the feature map. The weights α c k quantify the relative contribution of each feature map A k to the prediction of class c .
The Grad-CAM saliency map L c G r a d C A M R u × v is then obtained as the weighted sum of the feature maps followed by a ReLU:
L c G r a d C A M = R e L U k α c k A k
here, ReLU is defined as
R e L U ( x ) = x , x > 0 , 0 , x 0 ,
Ensuring that only the positive contributions supporting the prediction of class ccc are preserved, Grad-CAM highlights the discriminative regions in the input image that drive the final classification decision. When applied to the strawberry disease dataset, Grad-CAM demonstrates that Light-MobileBerryNet attends to biologically relevant regions. This visual interpretability provides an additional layer of validation, reinforcing the reliability of the proposed lightweight model for real-world deployment in precision agriculture [43].

4. Results

All models, including the proposed Light-MobileBerryNet and the baseline architectures, were implemented in Python 3.13 and trained under identical hyperparameter settings to ensure a fair comparison. Experiments were executed on a workstation equipped with an Intel i9-13900KF CPU (3.0 GHz, 64 GB RAM), an NVIDIA RTX A4500 GPU (20 GB VRAM), and a 1 TB PCIe SSD.
The reported latency, floating-point operations (FLOPs), and multiply–accumulate operations (MACs) represent per-image inference on this desktop hardware. These metrics serve primarily for reproducibility and benchmarking, not as direct indicators of mobile-device performance. Nevertheless, given the small computational footprint (~2 MB model size), the architecture is expected to achieve real-time inference on mid-range mobile SoCs or embedded GPUs (e.g., NVIDIA Jetson Nano [44]).
The dataset was divided into sections (80% training, 10% validation, and 10% testing) using a fixed random seed to preserve reproducibility (~700 test images). Cross-validation was initially considered, but a fixed validation subset was preferred to reduce computational cost—an approach consistent with common computer-vision practices [45]. Images were resized to 224 × 224 RGB and fed through Keras data generators (batch = 16, shuffling enabled for training/validation only).
Training used the Adam optimizer (learning rate = 1 × 10 3 ) and categorical cross-entropy loss, capped at 30 epochs. Performance typically plateaued beyond this point, as observed consistently across the proposed and baseline architectures. Extending the training beyond 30 epochs did not yield further improvement and, in some models, even led to minor degradation due to overfitting. Early stopping (patience = 5), learning-rate reduction on plateau (factor = 0.5, patience = 3), and model checkpointing were employed to prevent overfitting and ensure generalization.
The evaluation encompassed Light-MobileBerryNet—designed as a lightweight MobileNetV3-Small-inspired architecture—and a comprehensive suite of state-of-the-art CNNs, including MobileNetV2/V3-Large, EfficientNet (B0/B3/B7, V2-S/M/L), DenseNet (121/169), NASNetMobile, ResNet (50/101), InceptionResNetV2, and Xception. All models shared identical optimization and early stopping protocols, ensuring that performance differences reflected architectural design rather than training conditions.
Finally, an ablation study was performed to quantify the contribution of Light-MobileBerryNet key components, including the Swish activation, the number of inverted residual blocks, and the expansion factor.

4.1. Performance Metrics

To assess model performance comprehensively, we adopted a set of evaluation metrics commonly used in plant disease recognition; These include accuracy, precision, recall, F1-score, Matthews Correlation Coefficient (MCC), and the area under the receiver operating characteristic curve (ROC-AUC). Accuracy measures the overall proportion of correctly classified samples, while precision quantifies the proportion of predicted positives that are true positives, capturing the model’s ability to avoid false alarms. Recall assesses sensitivity, i.e., the proportion of true positives correctly identified, and the F1-score harmonically balances precision and recall, particularly relevant under imbalanced distributions. MCC provides a more stringent correlation-based evaluation that incorporates all elements of the confusion matrix and is particularly informative in multiclass settings. ROC-AUC complements these by evaluating class separability independent of specific thresholds, highlighting the discriminative ability of the model [1,32,46,47]. The metrics were computed according to the following definitions:
Accuracy = T P + T N T P + T N + F P + F N
Precision = T P T P + F P
Recall = T P T P + F N
F 1 s c o r e = 2 Precision Recall Precision + Recall
ROC   AUC = 0 1 TPR FPR d FPR
MCC = T P T N F P F N T P + F P T P + F N T N + F P T N + F N
where T P , T N , F P , and F N denote true positives, true negatives, false positives, and false negatives, respectively. T P R are True Positive Rate and F P R are False Positive Rate. Together, these indicators provide both a global and class-level understanding of performance, balancing overall accuracy with the model’s capacity to identify each disease category reliably and consistently.

4.2. Model Evaluation

The learning dynamics of Light-MobileBerryNet (Figure 3) reveal a rapid and stable convergence. Training and validation losses declined sharply during the initial epochs and stabilized around epoch 22. In parallel, accuracy increased rapidly, with validation performance plateauing near 97% after the tenth epoch, while training accuracy continued to improve, reaching its peak around epoch 29 in both loss and accuracy curves. This behavior indicates an efficient optimization process, where regularization prevented overfitting and ensured that performance gains were not achieved at the expense of generalization.
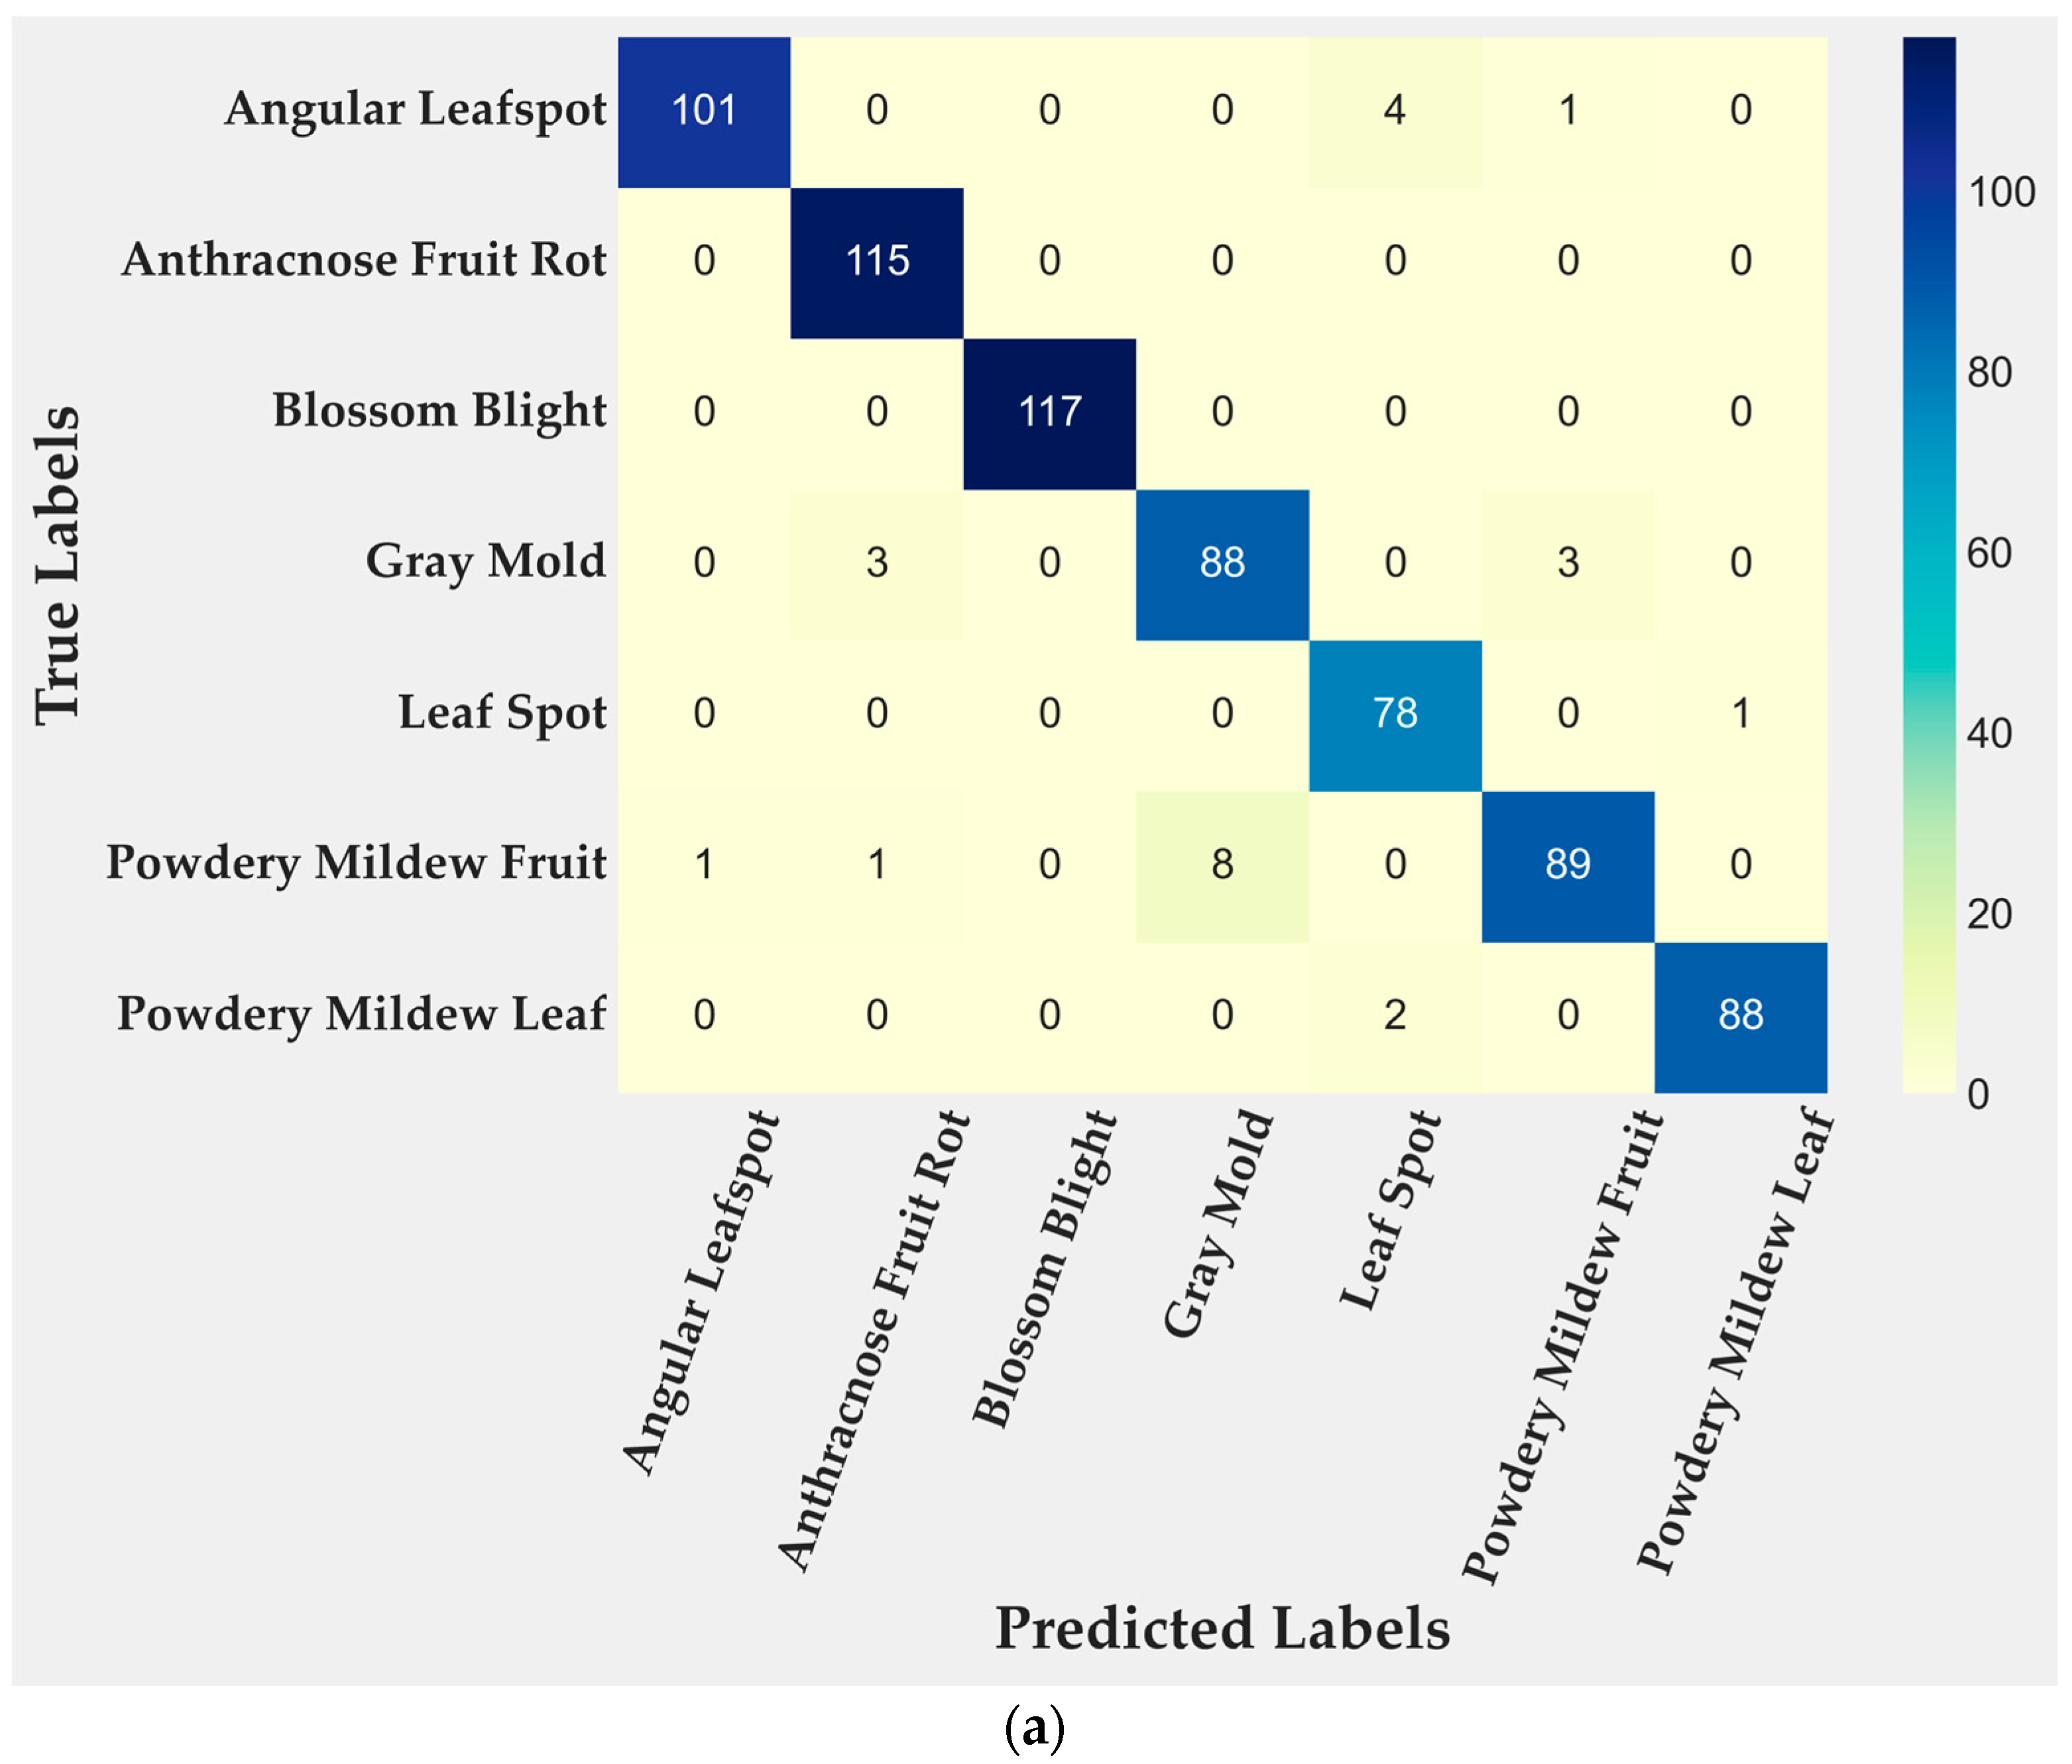
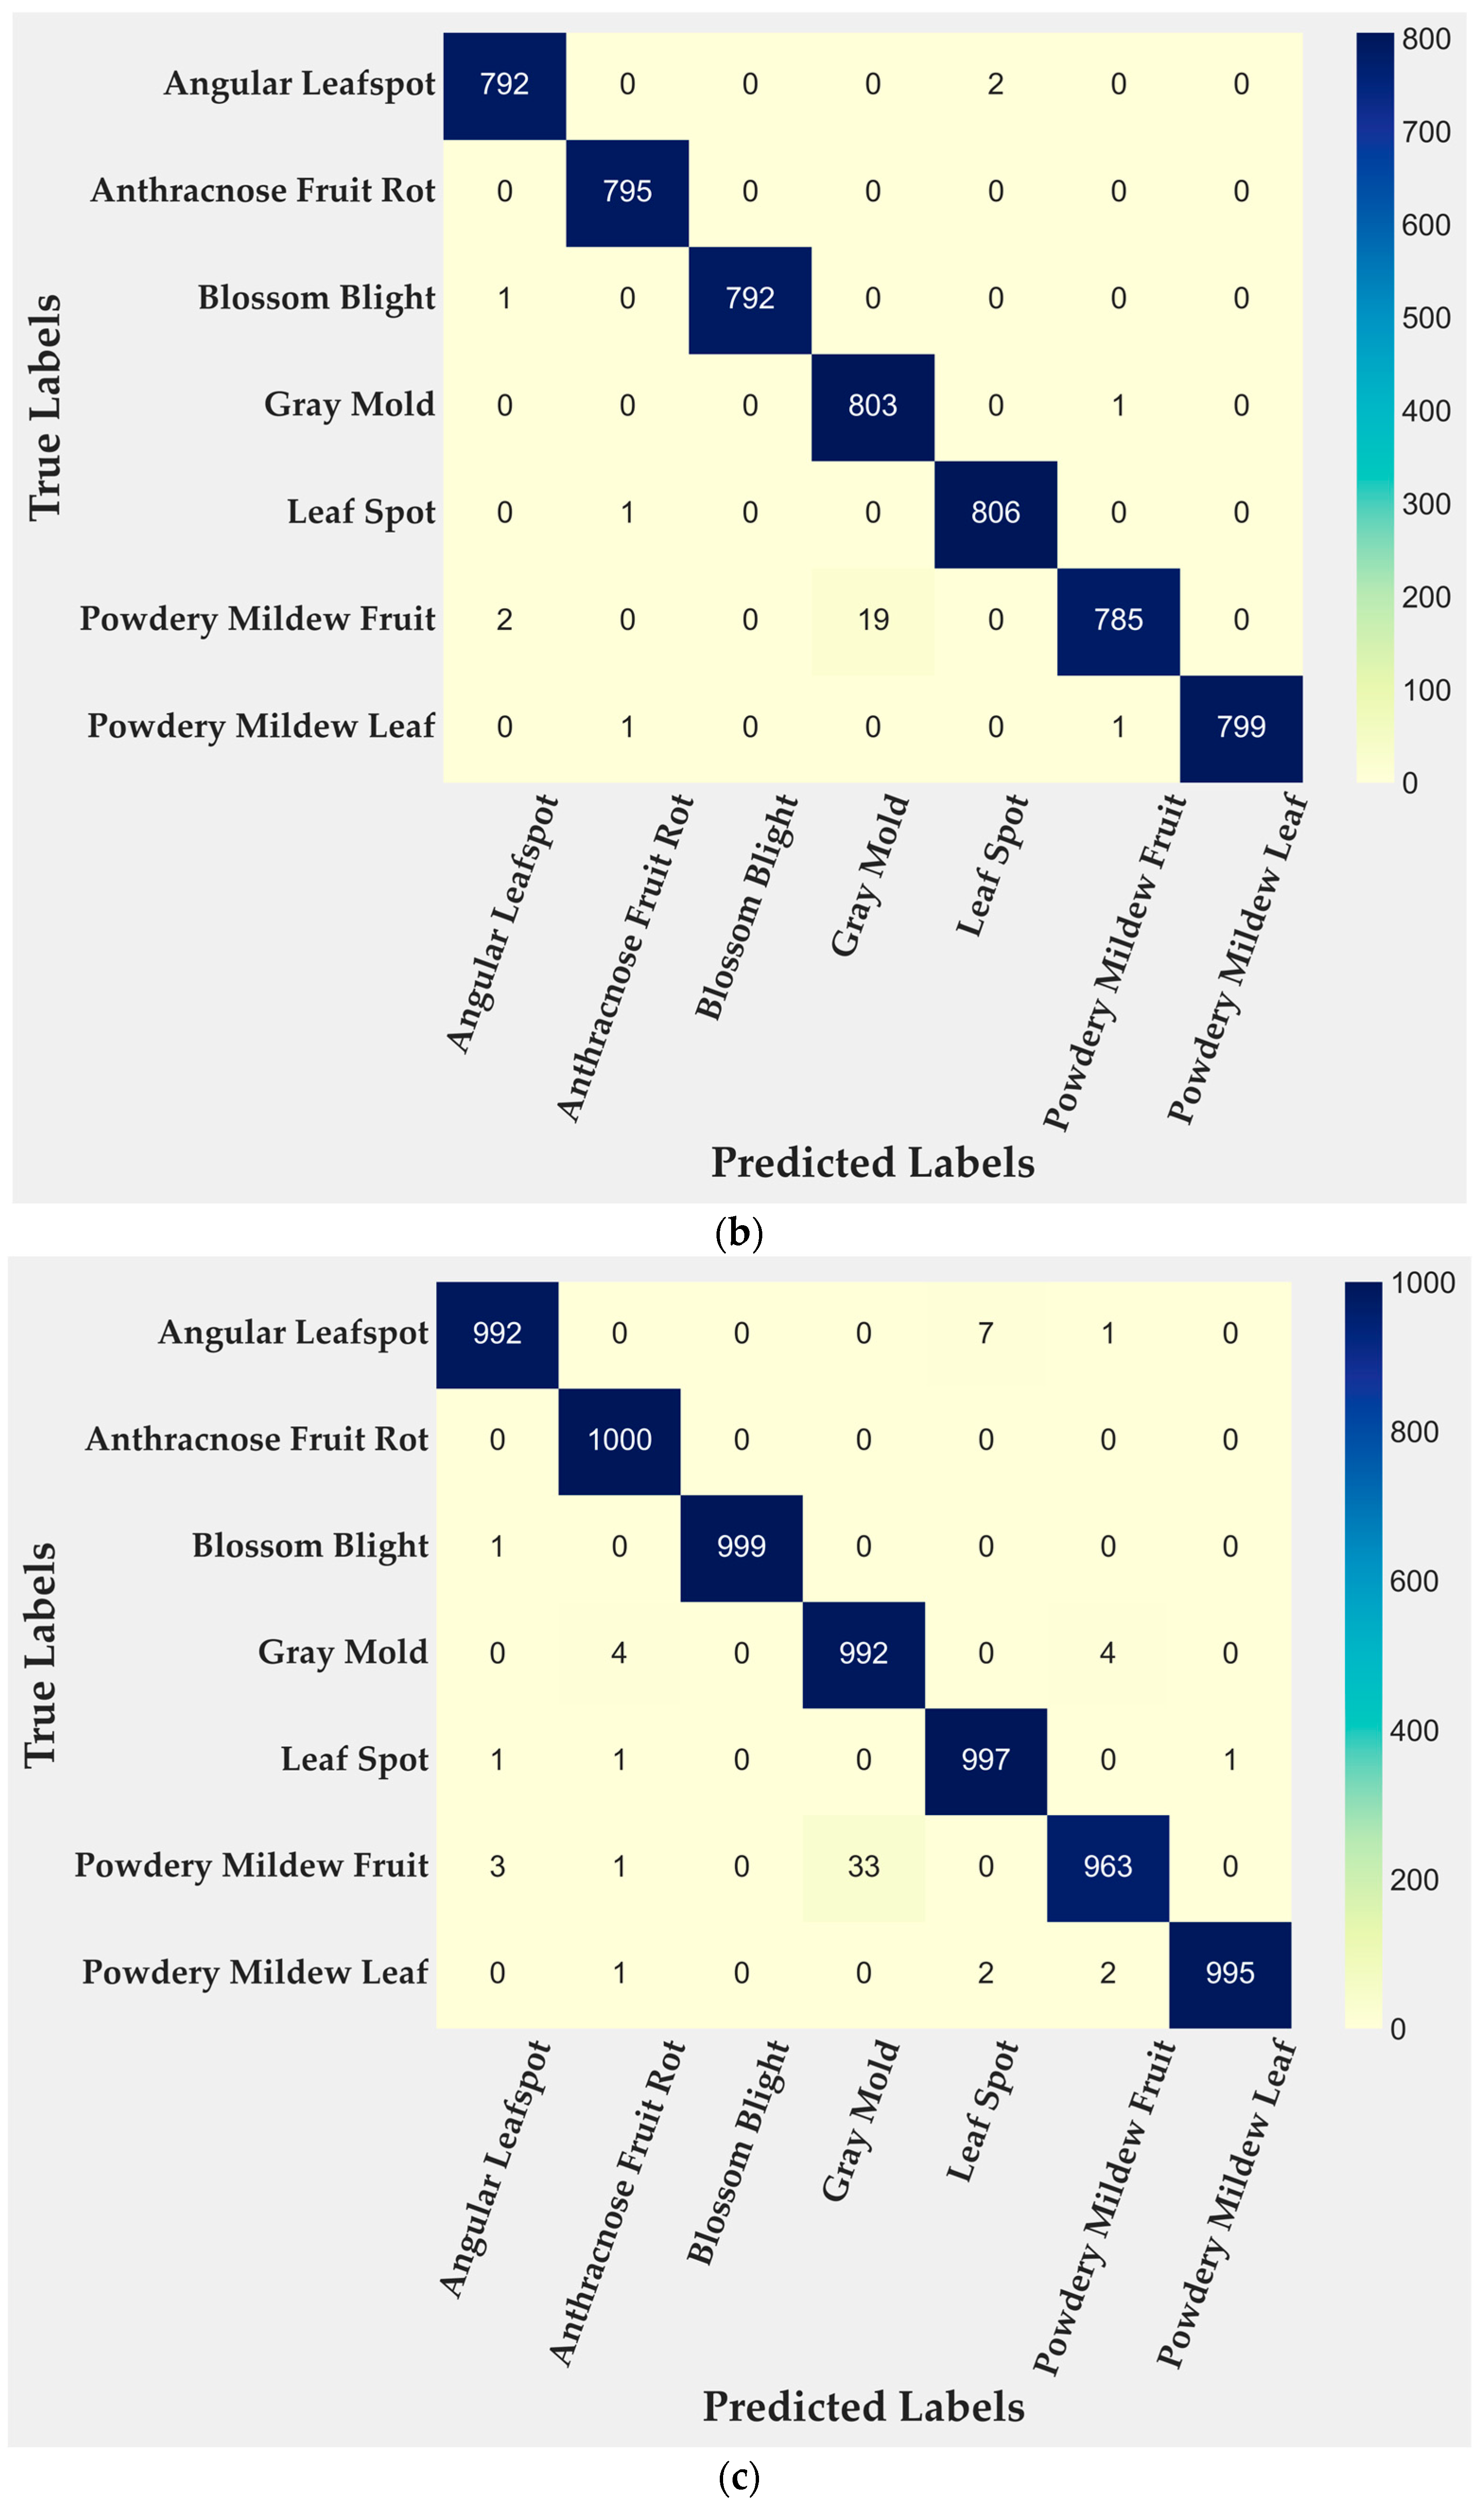
The confusion matrices in Figure 4 show consistent performance across the seven disease categories, with only 24 misclassifications out of 700 test images (around 3.4%). Most errors arose from confusions between powdery mildew fruit and gray mold, along with isolated cases involving angular leafspot, anthracnose fruit rot, leaf spot, and powdery mildew leaf.
On the training set, the error pattern mirrored that of the test data, with misclassifications concentrated between powdery mildew fruit and gray mold. In contrast, Anthracnose fruit rot was classified perfectly. Out of 5600 training images, only 28 were misclassified, corresponding to an error rate of 0.5%.
When evaluated on the entire dataset, the model reproduced the same error pattern, with powdery mildew fruit accounting for most of the 33 misclassifications and gray mold showing the highest number of false positives and negatives. Other categories presented between 1 and 8 errors, except for anthracnose fruit rot, which was classified perfectly, and blossom blight, with only a single error. In total, 62 misclassifications were observed out of 7000 images, corresponding to an error rate of around 0.9%.
Table 2 summarizes the class-wise performance in terms of precision, recall, and F1-score across the test, training, and full datasets. We emphasize recall and F1 because together they capture the model’s ability to minimize both false negatives and false positives, offering a more reliable assessment than accuracy alone. On the test set, the model achieved perfect recognition for one class (F1 of 1.000), while the most challenging were gray mold (F1 of 0.926) and powdery mildew fruit (F1 of 0.927), reflecting higher false positives in the former and higher false negatives in the latter. All other categories maintained an F1-score above 0.95. On training data, performance was nearly flawless (F1 between 0.985 and 0.999; recall between 0.973 and 1.000), and on the full dataset it remained stable (F1 no lower than 0.977; recall between 0.963 and 1.000). These results confirm the balanced control of both error types across categories, underscoring the robustness of the proposed model.
The global indicators in Table 3 confirm the consistency of the model across datasets. On the test set, accuracy, precision, recall, and F1-score were all 96.6%, with an MCC of 0.960, confirming balanced predictive performance across disease categories. On the training set, performance approached perfection (accuracy 99.5%, F1-score 0.994, MCC 0.994), and evaluation on the full dataset maintained this stability (accuracy 99.1%, F1-score 0.991, MCC 0.990). These results highlight not only the strong discriminative capacity of the proposed architecture but also its reliability under realistic, data-intensive conditions.
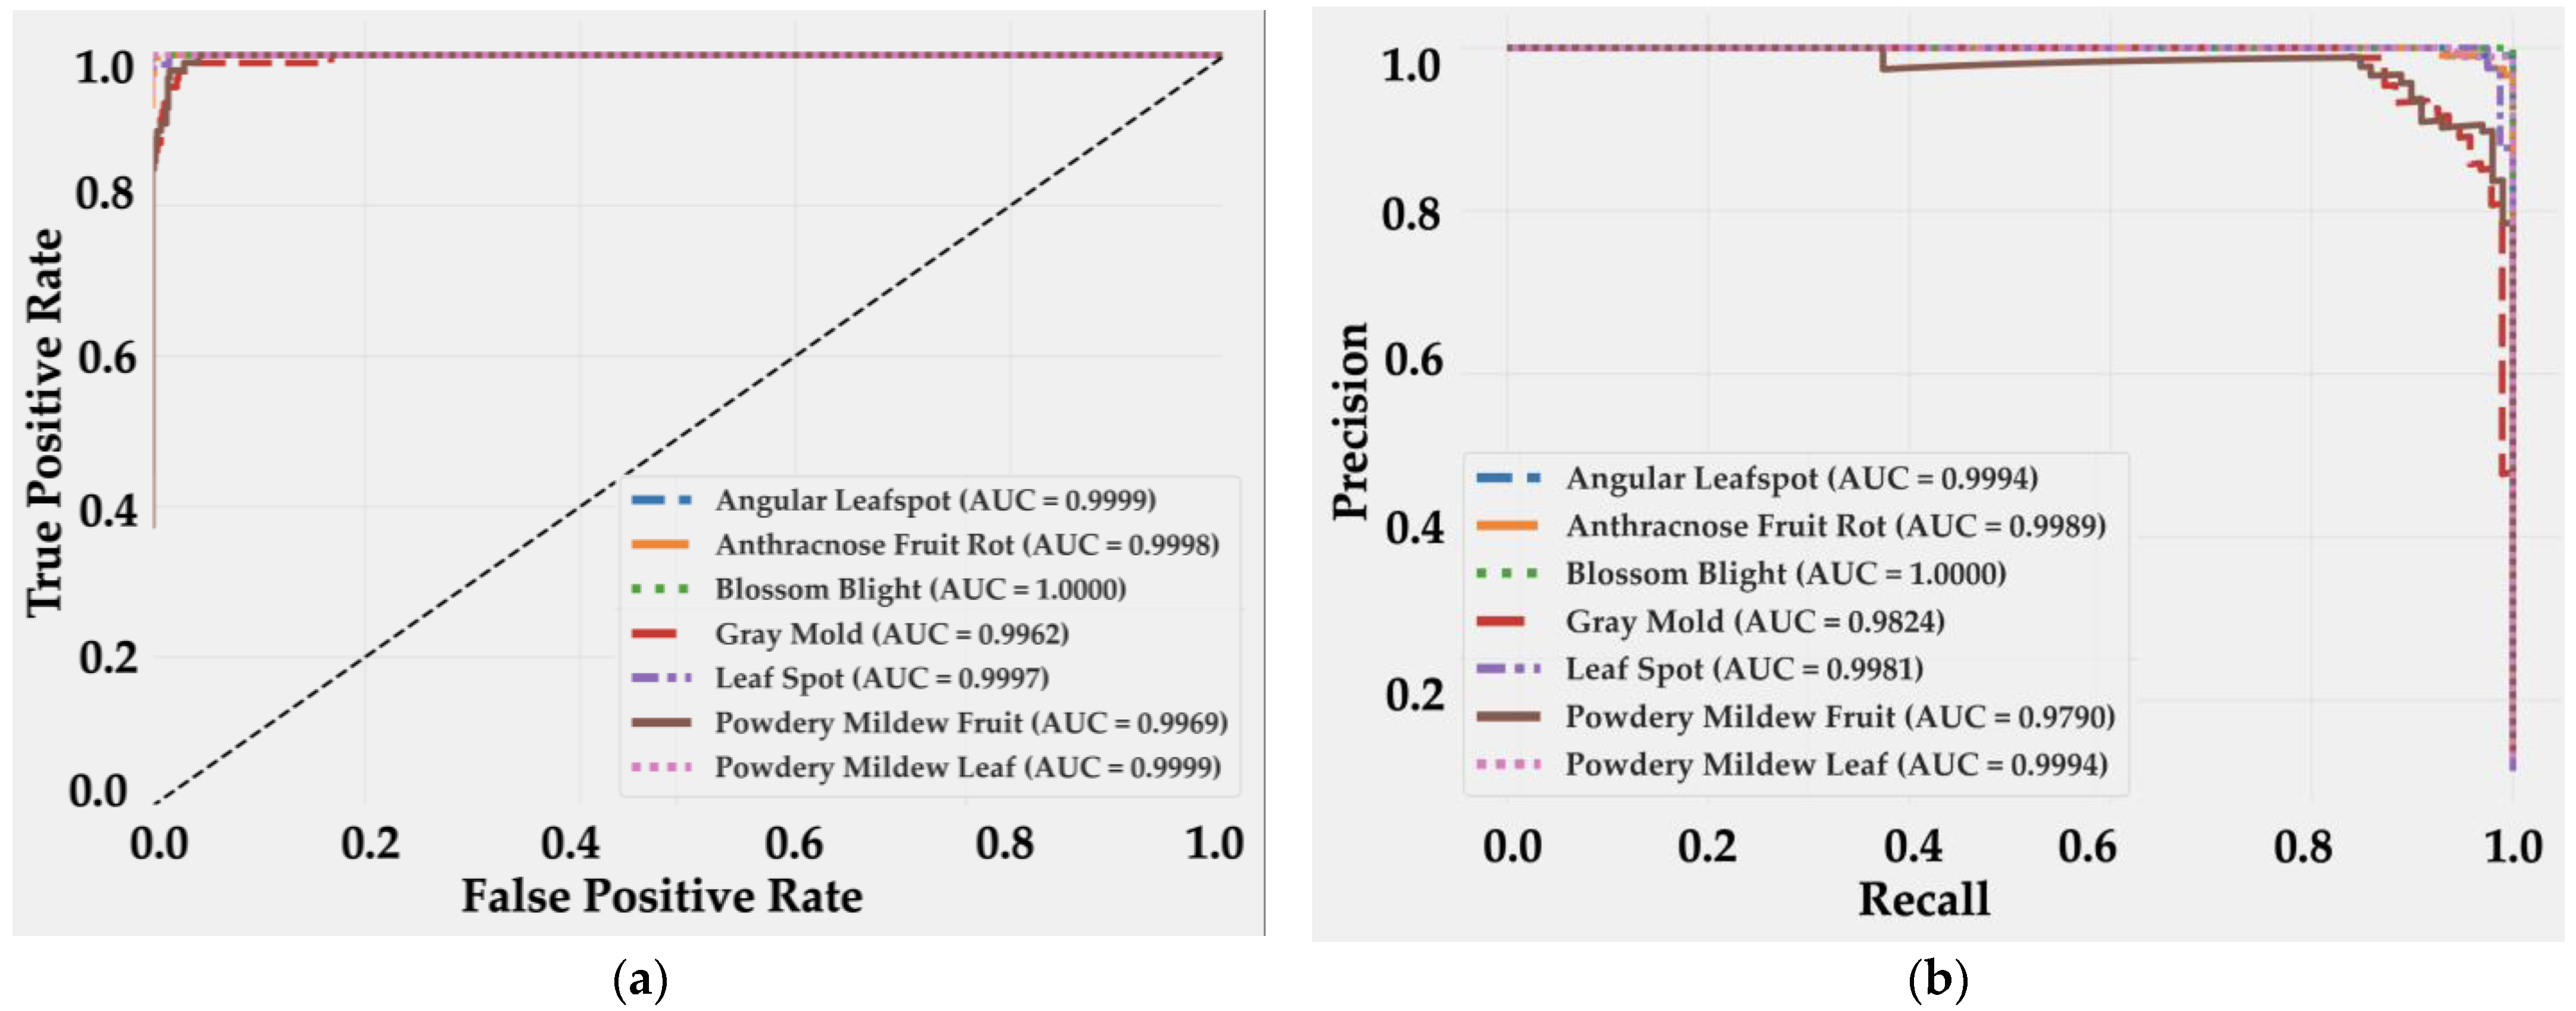
The receiver operating characteristic (ROC) and precision–recall (PR) curves in Figure 5 further confirm the discriminative strength of the proposed model for strawberry leaf disease recognition. All classes achieved near-perfect separability, with area under the curve (AUC) values above 0.996 in the ROC analysis. blossom blight reached an AUC of 1.000, reflecting its highly distinctive symptom patterns, while gray mold (AUC = 0.9962) was the lowest, consistent with its visual similarity to powdery mildew fruit. In the PR curves, the trend was comparable, with most classes exceeding an AUC of 0.998. The only exceptions were gray mold (AUC = 0.9824) and powdery mildew fruit (AUC = 0.9790), which exhibited minor drops in precision at high recall levels, again underscoring their overlap in visual features. Overall, the uniformly high AUC values across both metrics demonstrate not only excellent sensitivity and specificity but also a strong balance between precision and recall, reinforcing the robustness of Light-MobileBerryNet for strawberry leaf disease recognition.

4.3. Ablation Study

To quantify the influence of key architectural choices, an ablation study was performed in which each component of the proposed configuration—Swish activation, eight inverted residual (IR) blocks, and an expansion factor of 6—was independently modified. Table 4 summarizes the computational efficiency and predictive performance of each variant. The metrics include the number of parameters, model size, MACs, FLOPs, throughput (frames per second, FPS), and latency, as well as standard classification metrics. All MACs, FLOPs, and latency values refer to per-image measurements.
Replacing Swish with ReLU maintained a comparable theoretical workload (≈280 M FLOPs per image) and slightly improved throughput (157 FPS vs. 132 FPS) yet produced a sharp performance decline—accuracy decreased by 6.5% and MCC by 0.074. This confirms that the smoother nonlinearity of Swish is essential for capturing subtle lesion textures and non-linear feature interactions. Reducing the network to seven IR blocks decreased parameters by ≈30% and model size from 2.03 MB to 1.42 MB, while slightly lowering accuracy (−0.9%) and MCC (−0.01). The additional IR block therefore contributes non-redundant representational depth with minimal computational overhead.
Lowering the expansion factor from 6 to 4 yielded the smallest and fastest variant (1.35 MB, 159 FPS, 6.3 ms per-image latency) but also the lowest reliability (accuracy −2.2%, MCC −0.026). The narrower bottlenecks limit channel capacity and feature abstraction despite their speed advantage. Overall, the proposed configuration offers the most favorable balance: it is compact (~2 MB), efficient (~132 FPS, 7.6 ms per image), and achieves the highest predictive consistency (accuracy = 96.6%, MCC = 0.960). These results demonstrate that Swish activation, eight IR blocks, and an expansion factor of 6 act synergistically, providing an optimal trade-off between accuracy and efficiency for lightweight strawberry disease recognition.

4.4. Comparative Analysis with State-of-the-Art Models

Table 5 summarizes the comparative performance of Light-MobileBerryNet against a broad suite of state-of-the-art convolutional architectures, all trained under identical hyperparameter, optimization, and early stopping settings.
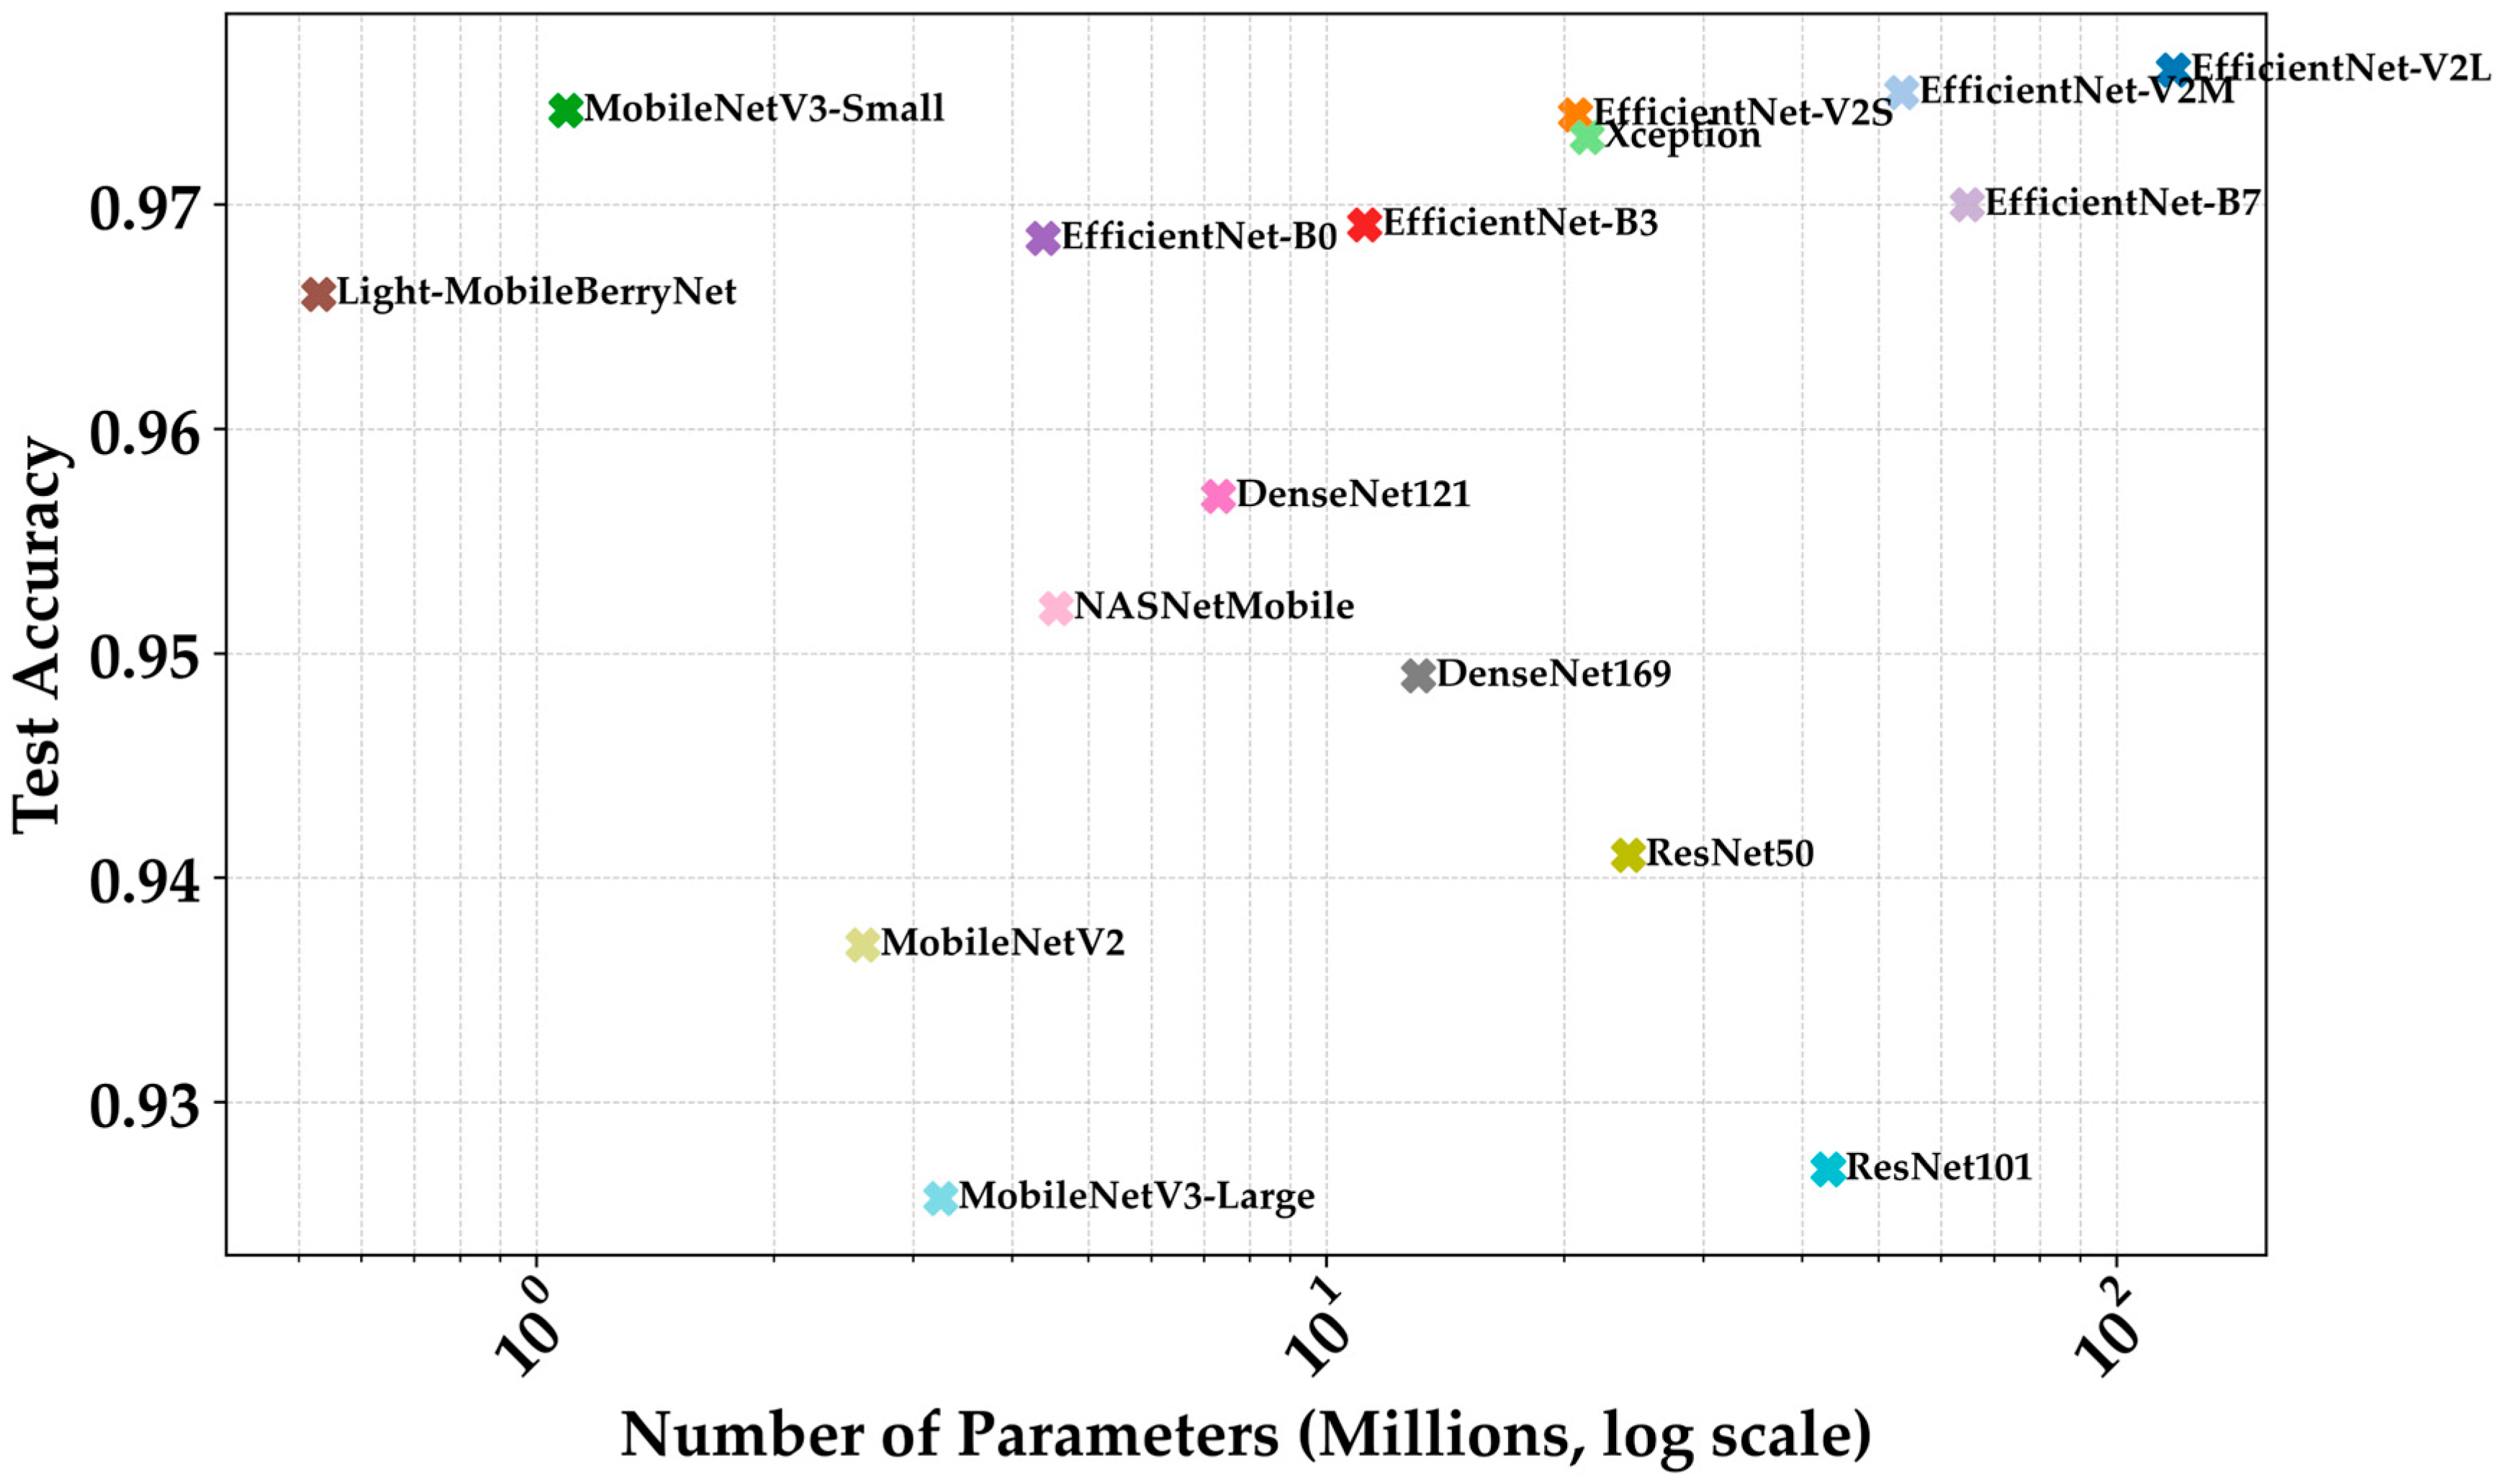
Across the benchmark, Light-MobileBerryNet attains 96.6% test accuracy and an MCC of 0.960 while requiring only 0.53 million parameters (~2 MB). This translates into a >99% reduction in size compared with EfficientNet-V2L (118 M parameters, 450 MB) and only a 0.01 drop in accuracy. In practical terms, the proposed network retains almost the full discriminative capacity of the most complex EfficientNet-V2 models while remaining lightweight enough for real-time inference on mobile hardware (~7.6 ms per image).
When compared with MobileNetV3-Small—its most conceptually similar baseline—Light-MobileBerryNet achieves nearly the same accuracy (96.6% vs. 97.4%) with half the parameters (0.53 M vs. 1.09 M) and less than half the memory footprint (2.03 MB vs. 4.16 MB). This equivalence in predictive quality at substantially lower computational cost underscores the effectiveness of the design choices refined through the ablation study, namely the adoption of Swish activations, depthwise-separable convolutions, and channel-attention modules.
High-capacity models such as EfficientNet-V2S/M/L and Xception reached 97–97.6% accuracy but required 20–118 million parameters, limiting their feasibility for real-time agricultural monitoring. Conversely, deeper residual and densely connected networks (ResNet50/101, DenseNet169) exhibited diminishing accuracy (<95%) despite their large parameter counts. This pattern highlights that, in leaf disease recognition tasks, focused representational efficiency and well-balanced feature extraction outperform excessive architectural depth.
Figure 6 illustrates the accuracy–complexity relationship across models: while larger architectures achieve slightly higher scores, their computational requirements grow disproportionately. Beyond a moderate scale, increases in parameter count yield only marginal accuracy gains at a steep cost in latency and memory. Light-MobileBerryNet lies at the efficient end of this spectrum, delivering near–state-of-the-art accuracy with the smallest footprint and fastest inference. This balance of precision and efficiency highlights its suitability for edge-level agricultural deployment, where real-time decision support depends on both accuracy and resource economy.

4.5. Visual Saliency Maps for Model Explainability

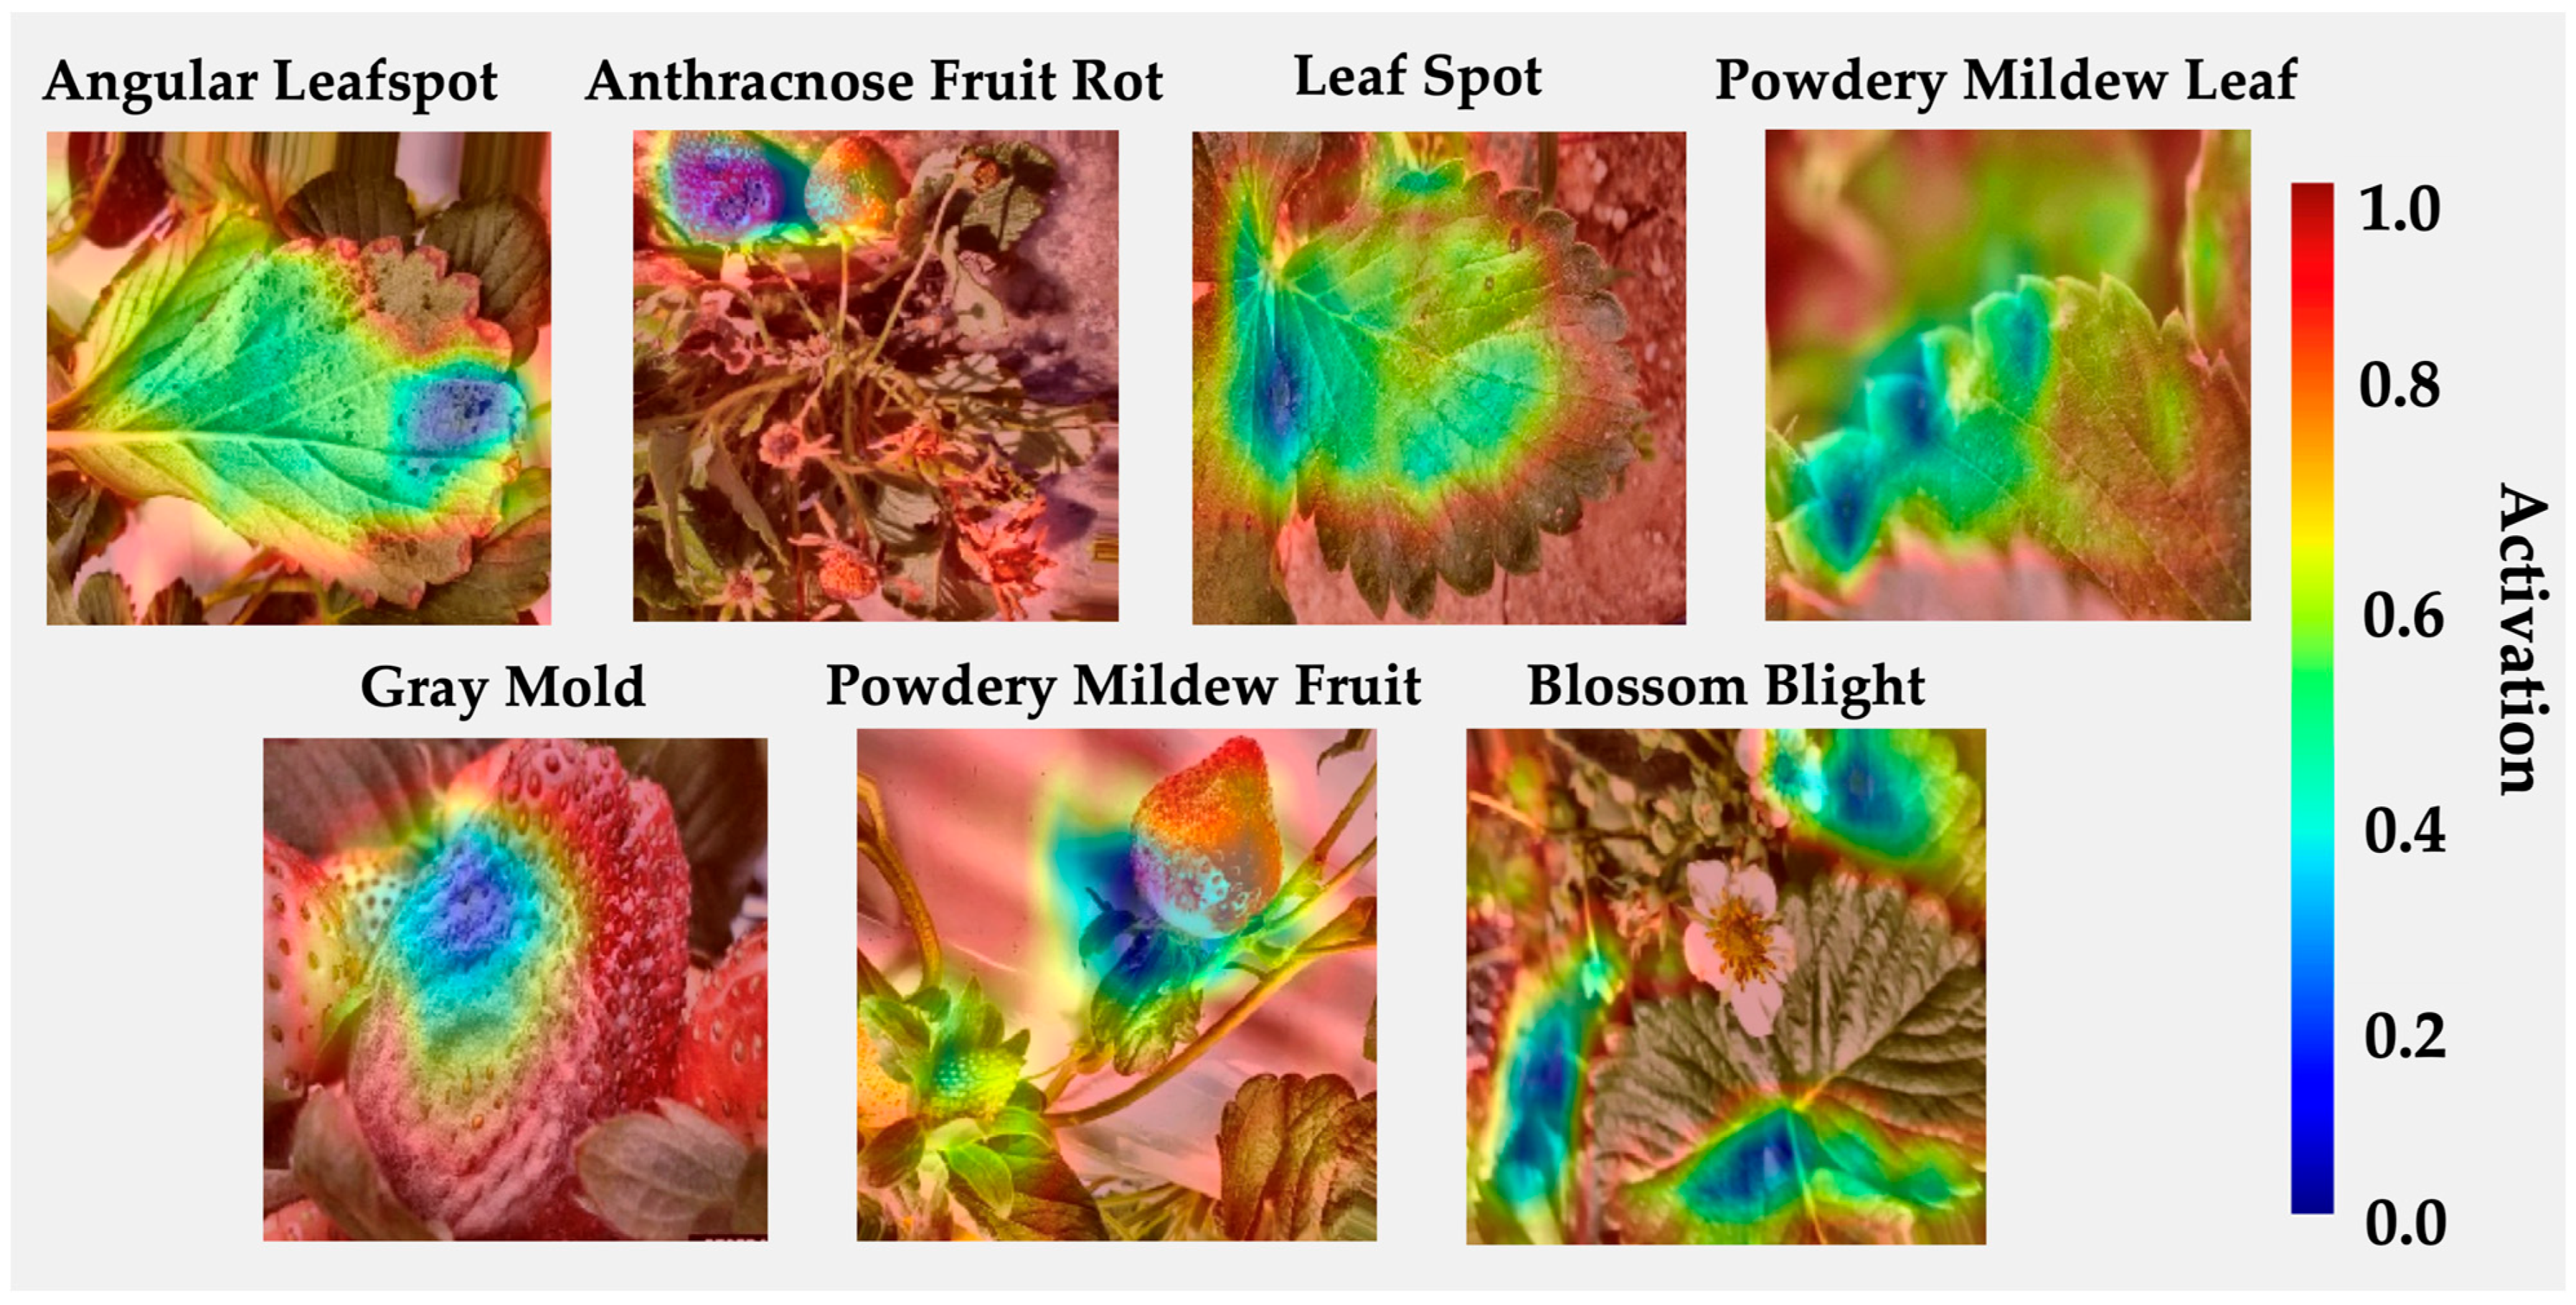
To provide deeper insight into the internal reasoning of the proposed Light-MobileBerryNet, we employed Grad-CAM to visualize class-discriminative regions across the seven disease categories (Figure 7). The activation intensity ranges from blue (low) to red (high), denoting the spatial contribution of specific leaf or fruit areas to the network’s final decision. For angular leafspot and leaf spot, high activations concentrate along necrotic margins and chlorotic halos, while for anthracnose fruit rot and gray mold, the model attends to central decayed tissues and sporulating lesions on the fruit surface. In powdery mildew leaf and powdery mildew fruit, activations are localized over the whitish mycelial growth regions, indicating the network’s ability to distinguish superficial infections from background texture. Blossom blight responses align closely with petal necrosis and proximal leaf chlorosis, evidencing generalization to heterogeneous floral structures.
To validate these qualitative observations, a quantitative correspondence analysis was conducted between Grad-CAM heatmaps and expert-annotated disease regions from Afzaal et al. work [32]. The dataset provides expert-defined infection severity levels—Level 1 (low–mid infection) and Level 2 (high infection)—derived from lesion spread, visual severity, and tissue maturity, with JSON annotations enabling direct overlap metrics. CAMs were normalized to [ 0 , 1 ] and binarized using a fixed per-image threshold τ ; heatmaps were resized to the annotation resolution before overlap computations. The resulting quantitative scores are summarized in Table 6, which reports the Intersection-over-Union (IoU), Dice coefficient, Pointing Game accuracy, and Energy In metrics for two expert-defined infection severity levels:
IoU = A p A g A p A g
Dice = 2 A p A g A p + A g
Pointing   Game = N h i t s N t o t a l
E i n ( % ) = i A g CAM i i CAM i × 100
where A p and A g denote the binarized Grad-CAM region and the expert lesion mask, respectively; N hits is the number of images whose maximum CAM activation lies inside the expert mask; N total is the number of evaluated images; and C A M i is the activation intensity at pixel i .
These results support a consistent alignment between attention regions and expert-identified lesions, with slightly higher localization for mild infections (level 1). The moderate decline at level 2 is expected under increased occlusion, color blending, and lesion coalescence at advanced stages. Pointing Game > 56% indicates that peak Grad-CAM activations frequently coincide with the pathological core of the lesion, reinforcing the claim that the model focuses on biologically meaningful regions.

5. Discussion

Our findings demonstrate that high-performing recognition of strawberry leaf diseases can be achieved with architectures that are orders of magnitude lighter than conventional deep networks. This challenges the prevailing assumption that near-perfect accuracy in plant pathology inevitably requires large-scale models with tens of millions of parameters. By delivering 96.6% accuracy with fewer than one million parameters, Light-MobileBerryNet shows that compact, interpretable CNNs can approach state-of-the-art performance while remaining deployable in the low-power, offline environments where growers most urgently need them [1,9,10,19].
The comparative analysis underscores this trade-off. Architectures such as MobileNetV3-Small and EfficientNet-V2L achieved excellent classification in the test set, yet their size and computational demands restrict their real-world applicability. In contrast, Light-MobileBerryNet compresses this functionality into just 2 MB, reducing the barrier for mobile and edge implementation. These results echo recent reports in plant phenotyping and strawberry pathology, where deeper CNNs set the performance ceiling but also highlight the growing demand for lightweight, field-ready alternatives [10,17].
Interpretability adds another dimension of value. Grad-CAM maps confirmed that the proposed model consistently attended to biologically meaningful regions such as necrotic lesions in gray mold, powdery textures of mildew, and blight-affected petals, rather than background noise [10,26]. This capacity for visual explanation not only supports scientific validation but also fosters user trust, which is critical if models are to be adopted by farmers with limited technical training. Compared with hyperspectral pipelines that rely on specialized sensors, our RGB-based approach provides a lower-cost and more accessible route to disease monitoring without sacrificing transparency [27].
At the same time, certain limitations must be acknowledged. The relatively lower recall for powdery mildew fruit reflects the difficulty of detecting subtle texture cues that overlap with natural leaf structures [17,32]. Although the expanded seven-class dataset increases variability compared with the previous three-class configuration, it still does not fully represent the complexity of open-field conditions. In real agricultural environments, performance may decline due to uncontrolled illumination, partial occlusions from overlapping leaves or fruits, soil interference, and camera noise [48]. These factors have been shown to degrade classification accuracy in related studies and highlight the need for broader, more heterogeneous datasets and field validation campaigns that capture such variability. Further testing under real farm conditions will be essential to verify model robustness and adaptability beyond controlled greenhouse imagery [1,10,20,33].
Looking forward, several research directions emerge. First, the demonstrated efficiency makes Light-MobileBerryNet a strong candidate for offline mobile applications, allowing farmers to diagnose diseases directly in the field without reliance on connectivity. Second, expanding the taxonomy beyond the seven target classes to include angular leaf scorch, additional powdery mildew forms (cenicilla), blossom blight, leaf scorch, and healthy leaves would increase robustness and practical value [1,5,18]. Third, further optimization through pruning and post-training quantization could compress the model even further, enabling faster inference on low-cost smartphones or embedded systems, for example, TinyML [45,49,50]. Integrating real-world data acquisition campaigns under variable environmental and lighting conditions would strengthen external validity and guide future model calibration for field deployment.
Finally, future work could explore multimodal extensions that combine conventional RGB imaging with complementary modalities such as thermal or hyperspectral data. Integrating additional spectral or temperature information may enhance the model’s ability to detect early-stage infections or stress conditions that are not visually apparent in RGB imagery alone [14,27]. Such multimodal fusion approaches could further improve robustness under complex environmental conditions and support earlier, more reliable disease diagnosis in precision agriculture.
In summary, Light-MobileBerryNet provides a concrete demonstration that accurate, interpretable, and computationally efficient models are possible for strawberry leaf disease recognition. While heavier architectures still define the absolute upper bound of performance, the proposed approach offers a pragmatic balance between accuracy and deployability, bridging the gap between laboratory benchmarks and field-ready tools for precision agriculture.

6. Conclusions

Light-MobileBerryNet demonstrates that high accuracy and interpretability in strawberry disease recognition can be achieved without resorting to heavy, resource-intensive architectures. With only 0.53 million parameters and a 2 MB footprint, the model achieves a 96.6% accuracy while maintaining transparency through visual interpretability (Grad-CAM), proving that compact CNNs can remain both reliable and practical for real-world agricultural use.
Beyond its strong classification performance, Light-MobileBerryNet contributes three key advances: (1) it provides an efficient architecture optimized for mobile and edge deployment; (2) it balances accuracy, inference speed, and model size, reducing computational barriers for adoption in low-resource environments; and (3) it demonstrates that interpretable lightweight models can deliver field-relevant insights by highlighting biologically meaningful lesion regions.
Future work will focus on expanding the dataset to include additional diseases and healthy leaf samples, conducting field validations under variable environmental and lighting conditions, and implementing the model on mobile and embedded hardware platforms using TinyML or TensorFlow Lite to assess real-time performance and energy efficiency. These steps will help bridge the gap between laboratory research and scalable, farmer-accessible tools for precision agriculture.

Author Contributions

Conceptualization, R.O.-O. and A.G.-O.; methodology, R.O.-O., A.G.-O. and L.T.; software, A.G.-O., R.O.-O. and D.F.-D.; validation, R.O.-O., A.G.-O., K.L.P.-N. and L.T.; formal analysis, R.O.-O., A.G.-O. and A.Y.R.G.; investigation, R.O.-O., A.G.-O., D.F.-D. and A.Y.R.G.; resources, R.O.-O., L.T., A.Y.R.G. and D.F.-D.; data curation, A.G.-O., R.O.-O. and K.L.P.-N.; writing—original draft preparation, R.O.-O., A.G.-O. and A.Y.R.G.; writing—review and editing, R.O.-O., A.G.-O., L.T. and K.L.P.-N.; visualization, A.G.-O., R.O.-O. and D.F.-D.; supervision, R.O.-O. and A.Y.R.G.; project administration, R.O.-O., A.G.-O. and L.T.; funding acquisition, R.O.-O., D.F.-D. and L.T. All authors have read and agreed to the published version of the manuscript.

Funding

This research was funded by Tecnológico Nacional de México (TecNM), grant number 22298.25-P.

Data Availability Statement

The dataset used in this study, Strawberry Disease Detection Dataset, is publicly available on Kaggle at https://www.kaggle.com/datasets/usmanafzaal/strawberry-disease-detection-dataset (Accessed on 30 August 2025).

Acknowledgments

This work was developed in the framework of the international network “Red Internacional de Control y Cómputo Aplicados” supported by the TecNM. Additionally, the fourth author acknowledges support from CONAHCYT (SECIHTI, Mexico).

Conflicts of Interest

The authors declare no conflicts of interest.

Abbreviations

The following abbreviations are used in this manuscript:
σSigmoid activation function
βScaling parameter of the Swish activation
δReLU activation function
λRegularization coefficient in the loss function
ARSAgricultural Research Service
BNBatch Normalization
CLAHEContrast Limited Adaptive Histogram Equalization
CNNsConvolutional Neural Networks
ECAEfficient Channel Attention
FNFalse negatives
FPFalse positives
FLOPsFloating–point operations
FPSFrames per second
GAPGlobal Average Pooling
GPUGraphics Processing Unit
H, WSpatial height and width of the feature map
IoUIntersection-over-Union
IRInverted Residual
KKernel size of convolution (e.g., 3 × 3)
MNumber of input channels in a convolutional layer
MACsMultiply–Accumulate Operations
MCCMatthews Correlation Coefficient
MLPMultilayer Perceptron
NNumber of output channels in a convolutional layer
PRPrecision–Recall
rReduction ratio in the SE (Squeeze-and-Excitation) bottleneck
RGBRed–Green–Blue
ROC-AUCReceiver Operating Characteristic–Area Under the Curve
SESqueeze-and-Excitation
tExpansion factor in inverted-residual block
tMExpanded number of channels after applying the factor t
TBTerabyte
TNTrue negatives
TPTrue positives
W1, W2Weight matrices in the SE attention mechanism
y, ŷGround truth and predicted class probability vectors
xInput activation or feature map
YOLOYou Only Look Once

References

  1. Karki, S.; Basak, J.K.; Tamrakar, N.; Deb, N.C.; Paudel, B.; Kook, J.H.; Kim, H.T. Strawberry disease detection using transfer learning of deep convolutional neural networks. Sci. Hortic. 2024, 332, 113241. [Google Scholar] [CrossRef]
  2. Saha, R.; Shaikh, A.; Tarafdar, A.; Majumder, P.; Baidya, A.; Bera, U.K. Deep learning-based comparative study on multi-disease identification in strawberries. In Proceedings of the 2024 IEEE Silchar Subsection Conference (SILCON), Silchar, India, 15–17 November 2024; IEEE: Piscataway, NJ, USA, 2024; pp. 1–6. [Google Scholar]
  3. Venkatesh, R.; Vijayalakshmi, K.; Geetha, M.; Bhuvanesh, A. Optimized deep belief network for multi-disease classification and severity assessment in strawberries. J. Anim. Plant Sci. 2025, 35, 482–497. [Google Scholar] [CrossRef]
  4. Jiang, H.; Xue, Z.P.; Guo, Y. Research on plant leaf disease identification based on transfer learning algorithm. J. Phys. Conf. Ser. 2020, 1576, 012023. [Google Scholar] [CrossRef]
  5. Parameshwari, V.; Brundha, A.; Gomathi, P.; Gopika, R. An intelligent plant leaf syndrome identification derived from pathogen-based deep learning algorithm by interfacing IoT in smart irrigation system. In Proceedings of the 2nd Int. Conf. on Artificial Intelligence and Machine Learning Applications (AIMLA), Tiruchengode, India, 15–16 March 2024; IEEE: Piscataway, NJ, USA, 2024; pp. 1–7. [Google Scholar]
  6. Kaushik, A.; Attri, S.H.; Chauhan, S.S. Elucidating deep transfer learning approach for early plant disease detection through spot and lesion analysis. In Proceedings of the 3rd International Conference on Disruptive Technologies (ICDT), Greater Noida, India, 7–8 March 2025; IEEE: Piscataway, NJ, USA, 2025; pp. 1145–1150. [Google Scholar]
  7. Adiga, A.; Gagandeep, N.K.; Prabhu, A.A.; Pai, H.; Kumar, R.A. Comparative analysis on deep learning models for plant disease detection. In Proceedings of the International Conference on Emerging Technologies in Computer Science for Interdisciplinary Applications (ICETCS), Bengaluru, India, 22–23 April 2024; IEEE: Piscataway, NJ, USA, 2024; pp. 1–6. [Google Scholar]
  8. Wang, W.; Chen, W.; Xu, D.; An, Y. Diseased plant leaves identification by deep transfer learning. In Artificial Intelligence Technologies and Applications; Chen, C., Ed.; IOS Press: Amsterdam, The Netherlands, 2024. [Google Scholar]
  9. Aybergüler, A.; Arslan, E.; Kayaarma, S.Y. Deep learning-based growth analysis and disease detection in strawberry cultivation. In Proceedings of the 2023 Innovations in Intelligent Systems and Applications Conference (ASYU), Sivas, Turkey, 11–13 October 2023; IEEE: Piscataway, NJ, USA, 2023; pp. 1–5. [Google Scholar]
  10. Wang, J.; Li, Z.; Gao, G.; Wang, Y.; Zhao, C.; Bai, H.; Li, Q. BerryNet-lite: A lightweight convolutional neural network for strawberry disease identification. Agriculture 2024, 14, 665. [Google Scholar] [CrossRef]
  11. Shang, C.; Wu, F.; Wang, M.; Gao, Q. Cattle behavior recognition based on feature fusion under a dual attention mechanism. J. Vis. Commun. Image Represent. 2022, 85, 103524. [Google Scholar] [CrossRef]
  12. Singh, R.; Sharma, N.; Gupta, R. Strawberry leaf disease detection using transfer learning models. In Proceedings of the IEEE 2nd Int. Conf. on Industrial Electronics: Developments & Applications (ICIDeA), Imphal, India, 29–30 September 2023; IEEE: Piscataway, NJ, USA, 2023; pp. 341–346. [Google Scholar]
  13. Hu, X.; Xu, T.; Wang, C.; Zhu, H.; Gan, L. Domain generalization method of strawberry disease recognition based on instance whitening and restitution. Smart Agric. 2025, 7, 124–135. [Google Scholar]
  14. Jiang, Q.; Wu, G.; Tian, C.; Li, N.; Yang, H.; Bai, Y.; Zhang, B. Hyperspectral imaging for early identification of strawberry leaves diseases with machine learning and spectral fingerprint features. Infrared Phys. Technol. 2021, 118, 103898. [Google Scholar] [CrossRef]
  15. Tumpa, S.B.; Halder, K.K. A comparative study on different transfer learning approaches for identification of plant diseases. In Proceedings of the Int. Conf. on Next-Generation Computing, IoT and Machine Learning (NCIM), Gazipur, Bangladesh, 16–17 June 2023; IEEE: Piscataway, NJ, USA, 2023; pp. 1–6. [Google Scholar]
  16. Das, S.; Karna, H.B.; Das, S.; Hazra, R. Disease detection in plant leaves using transfer learning. In Proceedings of the First Int. Conf. on Electronics, Communication and Signal Processing (ICECSP), New Delhi, India, 8–10 August 2024; IEEE: Piscataway, NJ, USA, 2024; pp. 1–6. [Google Scholar]
  17. Wang, J.; Li, J.; Meng, F. Recognition of strawberry powdery mildew in complex backgrounds: A comparative study of deep learning models. AgriEngineering 2025, 7, 182. [Google Scholar] [CrossRef]
  18. Pertiwi, S.; Wibowo, D.H.; Widodo, S. Deep learning model for identification of diseases on strawberry (Fragaria sp.) plants. Int. J. Adv. Sci. Eng. Inf. Technol. 2023, 13, 1342–1348. [Google Scholar] [CrossRef]
  19. Dong, C.; Zhang, Z.; Yue, J.; Zhou, L. Automatic recognition of strawberry diseases and pests using convolutional neural network. Smart Agric. Technol. 2021, 1, 100009. [Google Scholar] [CrossRef]
  20. Shin, J.; Chang, Y.K.; Heung, B.; Nguyen-Quang, T.; Price, G.W.; Al-Mallahi, A. A deep learning approach for RGB image-based powdery mildew disease detection on strawberry leaves. Comput. Electron. Agric. 2021, 183, 106042. [Google Scholar] [CrossRef]
  21. Li, G.; Jiao, L.; Chen, P.; Liu, K.; Wang, R.; Dong, S.; Kang, C. Spatial Convolutional Self-Attention-Based Transformer Module for Strawberry Disease Identification under Complex Background. Comput. Electron. Agric. 2023, 212, 108121. [Google Scholar] [CrossRef]
  22. Aghamohammadesmaeilketabforoosh, K.; Nikan, S.; Antonini, G.; Pearce, J.M. Optimizing Strawberry Disease and Quality Detection with Vision Transformers and Attention-Based Convolutional Neural Networks. Foods 2024, 13, 1869. [Google Scholar] [CrossRef] [PubMed]
  23. Nguyen, H.T.; Tran, T.D.; Nguyen, T.T.; Pham, N.M.; Nguyen Ly, P.H.; Luong, H.H. Strawberry Disease Identification with Vision Transformer-Based Models. Multimed. Tools Appl. 2024, 83, 73101–73126. [Google Scholar] [CrossRef]
  24. Chen, M.; Zou, W.; Niu, X.; Fan, P.; Liu, H.; Li, C.; Zhai, C. Improved YOLOv8-based segmentation method for strawberry leaf and powdery mildew lesions in natural backgrounds. Agronomy 2025, 15, 525. [Google Scholar] [CrossRef]
  25. Alhwaiti, Y.; Khan, M.; Asim, M.; Siddiqi, M.H.; Ishaq, M.; Alruwaili, M. Leveraging YOLO deep learning models to enhance plant disease identification. Sci. Rep. 2025, 15, 7969. [Google Scholar] [CrossRef]
  26. Kim, H.; Kim, D. Deep-learning-based strawberry leaf pest classification for sustainable smart farms. Sustainability 2023, 15, 7931. [Google Scholar] [CrossRef]
  27. Ou, Y.; Yan, J.; Liang, Z.; Zhang, B. Hyperspectral imaging combined with deep learning for the early detection of strawberry leaf gray mold disease. Agronomy 2024, 14, 2694. [Google Scholar] [CrossRef]
  28. Xu, M.; Yoon, S.; Jeong, Y.; Park, D.S. Transfer learning for versatile plant disease recognition with limited data. Front. Plant Sci. 2022, 13, 1010981. [Google Scholar] [CrossRef]
  29. Ochoa-Ornelas, R.; Gudiño-Ochoa, A.; García-Rodríguez, J.A.; Uribe-Toscano, S. A robust transfer learning approach with histopathological images for lung and colon cancer detection using EfficientNetB3. Healthc. Anal. 2025, 7, 100391. [Google Scholar] [CrossRef]
  30. Ochoa-Ornelas, R.; Gudiño-Ochoa, A.; García-Rodríguez, J.A.; Uribe-Toscano, S. Enhancing early lung cancer detection with MobileNet: A comprehensive transfer learning approach. Franklin Open 2025, 10, 100222. [Google Scholar] [CrossRef]
  31. Ochoa-Ornelas, R.; Gudiño-Ochoa, A.; García-Rodríguez, J.A. A hybrid deep learning and machine learning approach with Mobile-EfficientNet and Grey Wolf Optimizer for lung and colon cancer histopathology classification. Cancers 2024, 16, 3791. [Google Scholar] [CrossRef]
  32. Afzaal, U.; Bhattarai, B.; Pandeya, Y.R.; Lee, J. An instance segmentation model for strawberry diseases based on Mask R-CNN. Sensors 2021, 21, 6565. [Google Scholar] [CrossRef]
  33. Narla, V.L.; Suresh, G.; Rao, C.S.; Awadh, M.A.; Hasan, N. A multimodal approach with firefly-based CLAHE and multiscale fusion for enhancing underwater images. Sci. Rep. 2024, 14, 27588. [Google Scholar] [CrossRef]
  34. Islam, T.; Hafiz, M.S.; Jim, J.R.; Kabir, M.M.; Mridha, M.F. A systematic review of deep learning data augmentation in medical imaging: Recent advances and future research directions. Healthc. Anal. 2024, 5, 100340. [Google Scholar] [CrossRef]
  35. Gao, X.; Xiao, Z.; Deng, Z. High accuracy food image classification via vision transformer with data augmentation and feature augmentation. J. Food Eng. 2024, 365, 111833. [Google Scholar] [CrossRef]
  36. Sunkari, S.; Sangam, A.; Raman, R.; Rajalakshmi, R. A refined ResNet18 architecture with Swish activation function for diabetic retinopathy classification. Biomed. Signal Process. Control 2024, 88, 105630. [Google Scholar] [CrossRef]
  37. Javanmardi, S.; Ashtiani, S.H.M. AI-Driven Deep Learning Framework for Shelf Life Prediction of Edible Mushrooms. Postharvest Biol. Technol. 2025, 222, 113396. [Google Scholar] [CrossRef]
  38. Ramachandran, P.; Zoph, B.; Le, Q.V. Searching for Activation Functions. arXiv 2017, arXiv:1710.05941. [Google Scholar] [CrossRef]
  39. Hu, J.; Shen, L.; Sun, G. Squeeze-and-Excitation Networks. In Proceedings of the IEEE Conference on Computer Vision and Pattern Recognition (CVPR), Salt Lake City, UT, USA, 18–23 June 2018; IEEE: Piscataway, NJ, USA, 2024; pp. 7132–7141. [Google Scholar]
  40. Howard, A.G.; Zhu, M.; Chen, B.; Kalenichenko, D.; Wang, W.; Weyand, T.; Andreetto, M.; Adam, H. MobileNets: Efficient Convolutional Neural Networks for Mobile Vision Applications. arXiv 2017, arXiv:1704.04861. [Google Scholar] [CrossRef]
  41. Sandler, M.; Howard, A.; Zhu, M.; Zhmoginov, A.; Chen, L.C. MobileNetV2: Inverted Residuals and Linear Bottlenecks. In Proceedings of the IEEE Conference on Computer Vision and Pattern Recognition (CVPR), Salt Lake City, UT, USA, 18–23 June 2018; IEEE: Piscataway, NJ, USA, 2024; pp. 4510–4520. [Google Scholar]
  42. Tummala, S.; Kadry, S.; Nadeem, A.; Rauf, H.T.; Gul, N. An explainable classification method based on complex scaling in histopathology images for lung and colon cancer. Diagnostics 2023, 13, 1594. [Google Scholar] [CrossRef]
  43. Nobel, S.N.; Afroj, M.; Kabir, M.M.; Mridha, M.F. Development of a cutting-edge ensemble pipeline for rapid and accurate diagnosis of plant leaf diseases. Artif. Intell. Agric. 2024, 14, 56–72. [Google Scholar] [CrossRef]
  44. Mittapalli, P.S.; Tagore, M.R.N.; Reddy, P.A.; Kande, G.B.; Reddy, Y.M. Deep Learning-Based Real-Time Object Detection on Jetson Nano Embedded GPU. In Microelectronics, Circuits and Systems: Select Proceedings of Micro2021; Springer Nature: Singapore, 2023; pp. 511–521. [Google Scholar]
  45. Mayo, D.; Cummings, J.; Lin, X.; Gutfreund, D.; Katz, B.; Barbu, A. How Hard Are Computer Vision Datasets? Calibrating Dataset Difficulty to Viewing Time. Adv. Neural Inf. Process. Syst. 2023, 36, 11008–11036. [Google Scholar]
  46. Ochoa-Ornelas, R.; Gudiño-Ochoa, A.; García-Rodríguez, J.A.; Uribe-Toscano, S. Lung and colon cancer detection with InceptionResNetV2: A transfer learning approach. J. Res. Dev. 2024, 10, e11025113. [Google Scholar] [CrossRef]
  47. Gudiño-Ochoa, A.; García-Rodríguez, J.A.; Ochoa-Ornelas, R.; Ruiz-Velazquez, E.; Uribe-Toscano, S.; Cuevas-Chávez, J.I.; Sánchez-Arias, D.A. Non-invasive multiclass diabetes classification using breath biomarkers and machine learning with explainable AI. Diabetology 2025, 6, 51. [Google Scholar] [CrossRef]
  48. Tamrakar, N.; Paudel, B.; Karki, S.; Deb, N.C.; Arulmozhi, E.; Kook, J.H.; Kim, H.T. Peduncle Detection of Ripe Strawberry to Localize Picking Point Using DF-Mask R-CNN and Monocular Depth. IEEE Access 2025, 13, 1–12. [Google Scholar] [CrossRef]
  49. Gudiño-Ochoa, A.; García-Rodríguez, J.A.; Ochoa-Ornelas, R.; Cuevas-Chávez, J.I.; Sánchez-Arias, D.A. Noninvasive Diabetes Detection through Human Breath Using TinyML-Powered E-Nose. Sensors 2024, 24, 1294. [Google Scholar] [CrossRef] [PubMed]
  50. Samanta, R.; Saha, B.; Ghosh, S.K. TinyML-on-the-Fly: Real-Time Low-Power and Low-Cost MCU-Embedded On-Device Computer Vision for Aerial Image Classification. In Proceedings of the 2024 IEEE Space, Aerospace and Defence Conference (SPACE), Oxford, UK, 8–10 July 2024; IEEE: Piscataway, NJ, USA, 2024; pp. 194–198. [Google Scholar]
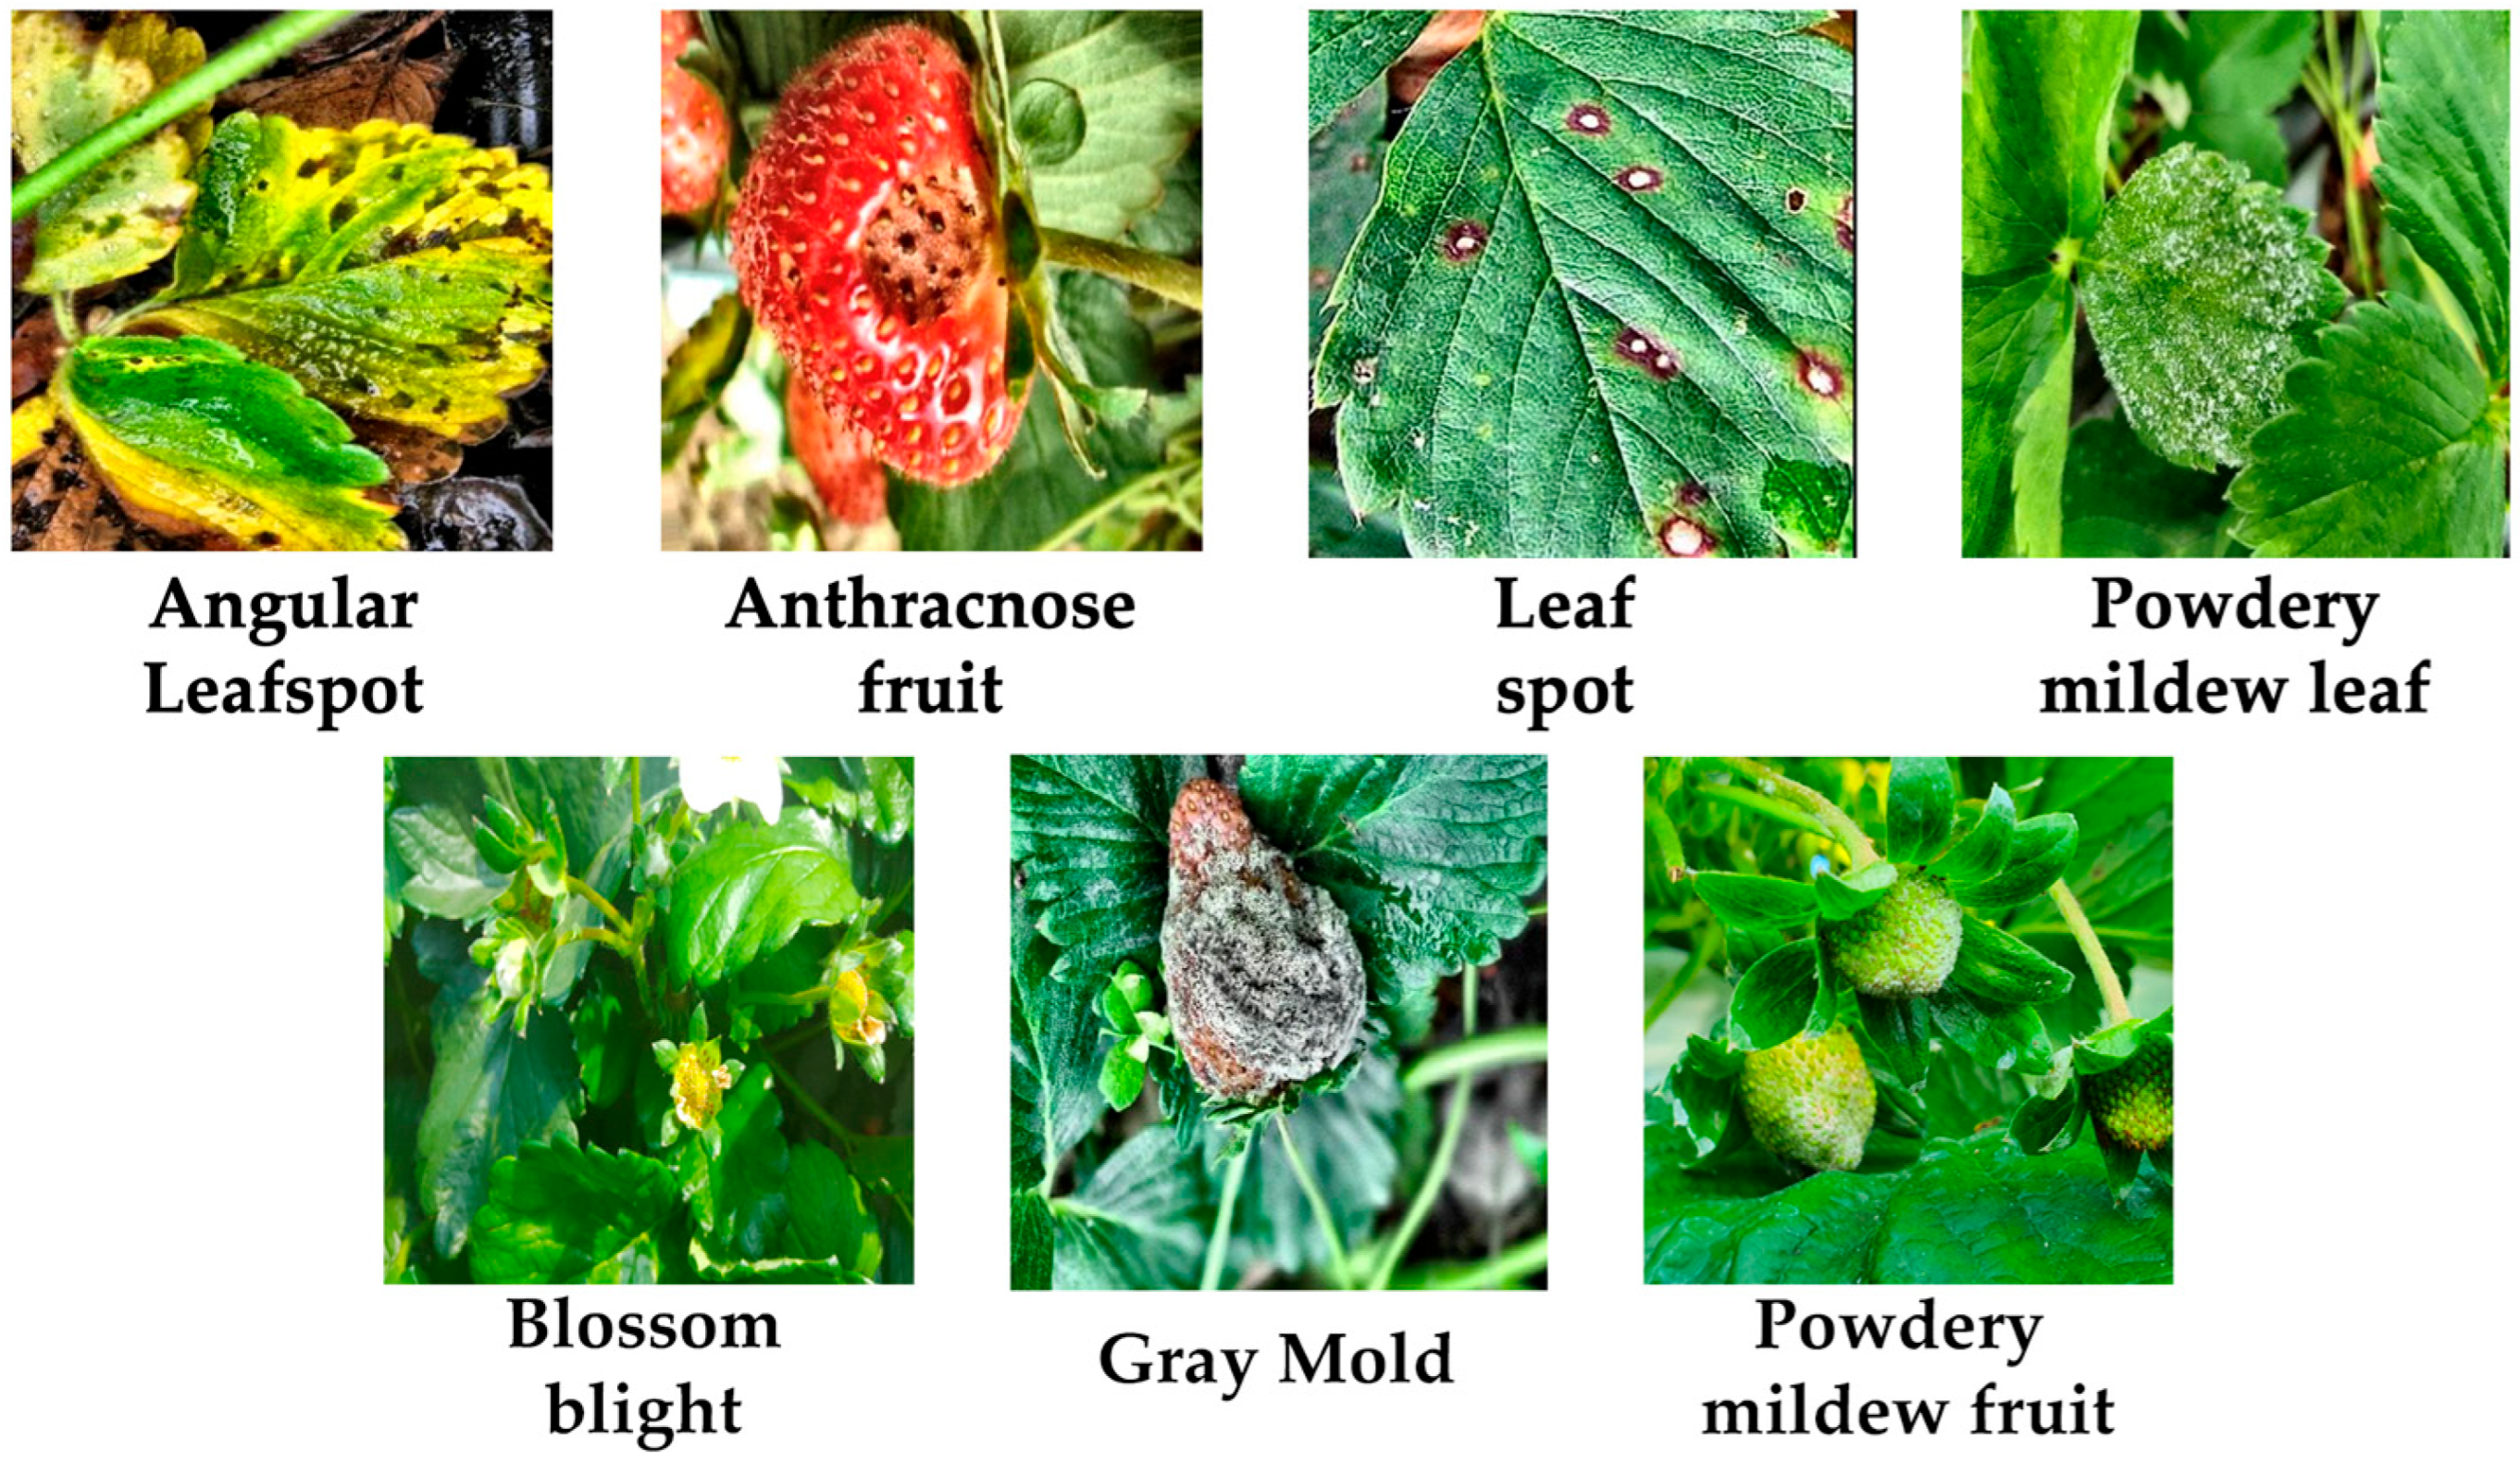
Figure 1. Representative examples of the seven strawberry disease classes used in this study extracted from the strawberry disease detection dataset.
Agriengineering 07 00355 g001
Figure 2. Schematic overview of the proposed Light-MobileBerryNet architecture for seven-class strawberry disease recognition.
Agriengineering 07 00355 g002
Figure 3. Training dynamics of Light-MobileBerryNet over 30 epochs. (a) Training and validation loss curves; (b) Training and validation accuracy curves.
Agriengineering 07 00355 g003
Figure 4. Confusion matrices for Light-MobileBerryNet across different evaluation settings. (a) Test set; (b) train set; (c) all datasets.
Agriengineering 07 00355 g004aAgriengineering 07 00355 g004b
Figure 5. ROC and precision–recall curves for Light-MobileBerryNet on the test set. (a) Receiver operating characteristic curves; (b) Precision-Recall curves.
Agriengineering 07 00355 g005
Figure 6. Accuracy–complexity trade-off across models. Light-MobileBerryNet achieves competitive accuracy with the lowest parameter count.
Agriengineering 07 00355 g006
Figure 7. Grad-CAM visualizations for each disease category. Heatmaps highlight the symptomatic regions driving model predictions, confirming alignment with biologically relevant features.
Agriengineering 07 00355 g007
Table 1. Architecture of Light-MobileBerryNet.
StageOperatorExp. t C i n C o u t KernelStrideSE
StemConv-BN-ReLU-7 16 3 × 3 2-
B1IR (Swish)116 16 3 × 3 1
B2 IR (Swish)616 24 3 × 3 2
B3IR (Swish)624 24 3 × 3 1
B4 IR (Swish)624 32 3 × 3 2
B5IR (Swish)632 32 3 × 3 1
B6IR (Swish)632 64 3 × 3 2
B7IR (Swish)664 64 3 × 3 1
B8IR (Swish)664 96 3 × 3 1
HeadConv1 × 1-Swish-96 576 1 × 1 1-
GAP + FC + Drop-576 128---
Classifier (Softmax)-128 7---
Skip if s = 1 and C in = C out .
Table 2. Class-wise performance (Precision, Recall, and F1-score) for the test, training, and full dataset.
DatasetClassPrecisionRecallF1-Score
TestBlossom Blight1.0001.0001.000
Gray Mold0.9170.9360.926
Powdery Mildew Fruit0.9570.8980.927
Angular Leafspot0.9900.9520.971
Anthracnose Fruit Rot0.9671.0000.983
Powdery Mildew Leaf0.9890.9780.983
Leaf Spot0.9290.9870.957
TrainBlossom Blight1.0000.9980.999
Gray Mold0.9770.9980.987
Powdery Mildew Fruit0.9970.9730.985
Angular Leafspot0.9960.9970.996
Anthracnose Fruit Rot0.9971.0000.998
Powdery Mildew Leaf1.0000.9970.998
Leaf Spot0.9970.9980.998
AllBlossom Blight1.0000.9990.999
Gray Mold0.9670.9920.979
Powdery Mildew Fruit0.9920.9630.977
Angular Leafspot0.9940.9920.993
Anthracnose Fruit Rot0.9931.0000.996
Powdery Mildew Leaf0.9980.9950.996
Leaf Spot0.9910.9970.994
Table 3. Global evaluation metrics for the test, training, and full dataset.
DatasetAccuracyPrecisionRecallF1-ScoreMCC
Test0.9660.9660.9660.9660.960
Train0.9950.9950.9950.9940.994
All0.9910.9910.9910.9910.989
Table 4. Ablation study of the proposed architecture. The MACs and FLOPs results are per image.
ArchitectureParams (M)Size (MB)MACs
(M)
FLOPs
(M)
FPSLatency (ms)AccuracyPrecisionRecallF1-ScoreMCC
Proposed (Swish, 8 IR blocks)0.5322.03143.97287.94131.857.580.9660.9660.9660.9660.960
ReLU instead of Swish0.5332.03139.89279.78157.436.350.9010.9130.9010.9030.886
7 IR blocks instead of 80.3721.42127.16254.33124.758.020.9570.9610.9570.9580.950
Expansion factor 4 instead of 60.3531.3591.21182.43159.266.280.9410.9440.9410.9420.934
Table 5. Comparative performance of Light-MobileBerryNet and baseline models on the test set (values in bold correspond to the proposed model). The MACs and FLOPs are per image; latency corresponds to per-image inference time.
ModelParams (M)Size (MB)MACs (M)FLOPs (M)FPSLatency (ms)AccuracyPrecisionRecallF1-ScoreMCC
EfficientNet-V2L118.08450.4412,309.3424,618.68≈6.5≈153.80.9760.9770.9760.9760.967
EfficientNet-V2M53.48204.035406.7210,813.44≈12.3≈81.30.9750.9760.9750.9750.966
EfficientNet-V2S20.6778.832877.195754.38≈18.9≈52.90.9740.9750.9740.9740.964
MobileNetV3-Small1.094.1659.60119.21205.294.870.97420.97540.97420.97440.970
Xception21.3981.624569.029138.04≈13.3≈75.00.9730.9740.9720.9720.962
EfficientNet-B311.1842.66992.991985.98219.2130.020.9690.9690.9690.9690.964
EfficientNet-B04.3816.72401.46802.93215.9825.760.9680.9680.9680.9650.963
EfficientNet-B764.76247.065264.8110,529.62≈11.5≈86.90.9700.9770.9690.9690.962
Light-
MobileBerryNet
0.532.03143.97287.94131.857.580.9660.9660.9670.9690.960
DenseNet1217.3027.872851.115702.23≈20.1≈49.70.9570.9590.9560.9570.943
NASNetMobile4.5517.34573.881147.77≈85.5≈11.70.9520.9550.9520.9530.939
DenseNet16913.0849.883380.196760.38≈17.0≈58.80.9490.9510.9490.9490.935
ResNet5024.1292.023877.577755.15≈14.8≈67.60.9410.9450.9410.9410.921
MobileNetV22.599.89307.59615.19210.3113.020.9370.9400.9370.9370.926
ResNet10143.19164.767599.1815,198.36≈9.8≈101.90.9270.9300.9260.9260.905
MobileNetV3-Large3.2512.39224.25448.50124.568.030.9250.9300.9250.9250.913
Table 6. Quantitative interpretability metrics (IoU, Dice, Pointing Game, and Energy In) of Grad-CAM maps for Light-MobileBerryNet under two expert-defined infection severity levels.
LevelInfection SeverityIoU (Mean)Dice (Mean)Pointing Game (%)Energy In (%)IoU ≥ 0.30 (%)IoU ≥ 0.50 (%)Images
Level 1Low-Mid0.3660.50258.2547.3462.1430.58206
Level 2High0.3200.43256.4244.6354.7531.66537
Disclaimer/Publisher’s Note: The statements, opinions and data contained in all publications are solely those of the individual author(s) and contributor(s) and not of MDPI and/or the editor(s). MDPI and/or the editor(s) disclaim responsibility for any injury to people or property resulting from any ideas, methods, instructions or products referred to in the content.