Abstract
Driving wheel slippage in agricultural tractors is influenced by soil moisture, density, and penetration resistance. These surface variations reflect post-tillage composition, enabling dynamic mapping via Remotely Piloted Aircraft (RPAs). This study evaluated ballast recommendations based on soil surface data and slippage percentages, correlating added wheel weights at different speeds for a tractor-reversible plow system. Six 94.5 m2 quadrants were analyzed for slippage monitored by RPA (Mavic3M-RTK) pre- and post-agricultural operation overflights and soil sampling (moisture, density, penetration resistance). A 2 × 2 factorial scheme (F-test) assessed soil-surface attribute correlations and slippage under varying ballasts (52.5–57.5 kg/hp) and speeds. Results showed slippage ranged from 4.06% (52.5 kg/hp, fourth reduced gear) to 11.32% (57.5 kg/hp, same gear), with liquid ballast and gear selection significantly impacting performance in friable clayey soil. Digital Elevation Model (DEM) and spectral indices derived from RPA imagery, including Normalized Difference Red Edge (NDRE), Normalized Difference Water Index (NDWI), Bare Soil Index (BSI), Green–Red Vegetation Index (GRVI), Visible Atmospherically Resistant Index (VARI), and Slope, proved effective. The approach reduced tractor slippage from 11.32% (heavy ballast, 4th gear) to 4.06% (moderate ballast, 4th gear), showing clear improvement in traction performance. The integration of indices and slope metrics supported ballast adjustment strategies, particularly for secondary plowing operations, contributing to improved traction performance and overall operational efficiency.
1. Introduction
Agriculture is a foundational activity for human survival and economic development [1]. Over the centuries, agricultural systems have evolved significantly, particularly in the wake of industrialization and technological innovation [2]. Mechanization of field operations has increased productivity, reduced manual labor, and enabled more precise execution in agricultural practices [3]. Mechanization, therefore, plays a vital role in ensuring global food security [4].
Among the various machines employed in agriculture, the tractor holds a central position due to its versatility and ability to power a wide range of implements [5]. Tractors are indispensable for soil preparation, planting, fertilization, and harvesting [6]. However, their efficiency and effectiveness depend heavily on how well they interact with the soil [7]. Inappropriate use or configuration can lead to excessive fuel consumption, soil degradation, and reduced operational efficiency [8]. One of the key factors influencing tractor performance is wheel slippage. Optimizing tractor settings, including ballast distribution, gear selection, and tire pressure, plays a decisive role in reducing fuel consumption, soil compaction, and operational costs. Proper adjustment of these parameters is essential to maximize traction efficiency while maintaining soil quality [9].
Wheel slippage refers to the loss of traction between the tractor’s driving wheels and the soil surface, resulting in the wheels rotating faster than the forward movement of the tractor [10]. This phenomenon is influenced by several parameters, such as soil texture, moisture content, compaction level, slope, tire type, tire pressure, ballast weight, and gear selection [11]. Slippage affects fuel efficiency, operational speed, and soil compaction, all of which have direct implications for crop productivity and sustainability [12].
Numerous studies have highlighted the importance of optimizing tractor settings to reduce slippage [13]. Proper ballasting, for instance, increases the weight on the drive wheels and improves traction, but excessive ballast can cause soil compaction and energy losses [14]. Similarly, selecting an appropriate gear ensures the balance between speed and torque [15]. The challenge lies in achieving an optimal configuration that maximizes traction while minimizing negative impacts on the soil [16].
In Brazil, where diverse soil types and climatic conditions prevail, understanding the dynamics of tractor performance under different field conditions is essential [17]. Regional studies that evaluate the interaction between ballast, gear selection, and soil parameters are necessary to provide practical recommendations for farmers and equipment operators [18]. Such localized knowledge can help reduce input costs, improve operational planning, and promote sustainable agricultural practices [19]. Beyond crop monitoring, Remotely Piloted Aircrafts (RPAs) have been increasingly applied in agricultural engineering to map soil variability, assess compaction, support machinery optimization, and guide precision mechanization strategies, providing high-resolution datasets that were previously inaccessible [20].
This study was conducted to evaluate the slippage behavior of a 4 × 2 front-wheel-assist (FWA) agricultural tractor during plowing operations with a reversible disc plow. The objective of this study was to evaluate ballast recommendations based on slippage data and surface variability mapped by RPAs, identifying the optimal combination of ballast and gear settings under specific field conditions. The findings are expected to contribute to the rational use of agricultural machinery and guide decision-making in mechanized soil preparation.
2. Materials and Methods
2.1. Experimental Area and Soil Conditions
The field experiment was carried out at the Federal University of the Jequitinhonha and Mucuri Valleys (UFVJM), Unaí Campus, Minas Gerais, Brazil (16°26′19.30″ S, 46°54′7.21″ W; elevation 615 m). The region has a humid tropical climate (Aw), characterized by two well-defined seasons [21], with annual precipitation around 1200 mm and an average air temperature of 24 °C [22].
Meteorological data were obtained from the automatic weather station located at ICA–UFVJM, covering the period from 10 to 31 October 2023, which includes the dates of soil sampling and tractor operations. The dataset comprised daily values of maximum, minimum, and average air temperature (°C), relative humidity (%), precipitation (mm), and reference evapotranspiration (ET0 in mm), calculated using the Penman–Monteith method. During this period, total precipitation reached 130 mm, with a significant rainfall event of 34.8 mm recorded on October 29, which notably increased soil moisture levels. The mean air temperature was 26.2 °C, while ET0 totaled 127.45 mm. Relative humidity averaged between 47.6% (minimum) and 82.3% (maximum) throughout the evaluation period.
The soil of the experimental area is a Nitossolo Vermelho (Typic Rhodic Nitisol), with high clay content and good drainage [23]. Physical characterization of the soil was performed prior to field operations. Soil samples were collected using 5 × 5 cm volumetric rings to determine bulk density, gravimetric and volumetric moisture, and penetration resistance. Moisture was calculated by oven drying samples at 105 °C, and resistance to penetration was measured with a impact penetrometer Stolf, Araras, São Paulo, Brazil, with data converted to MPa.
2.2. Machinery, Ballast, and Implement Configuration
The tractor used in this study was a New Holland TT4.75, a 4 × 2 front-wheel-assist (FWA) model with a nominal engine power of 75 hp (Figure 1A). The machine is equipped with a three-cylinder diesel engine, 3.9-L displacement, indirect injection system, and water cooling. Its transmission features 12 forward and 4 reverse gears with synchronized shuttle shift, and a category II three-point hitch with a maximum hydraulic lift capacity of 2600 kg. The tractor’s weight, without ballast, is approximately 2900 kg, and its dimensions measure 3.67 m in length, 1.99 m in width, and 2.53 m in height to the top of the ROPS. It is fitted with bias-ply diagonal tires 18.4–30 on the rear axle and 12.4–24 on the front, with recommended operating pressures of 22 psi rear and 26 psi front, adjusted based on load and terrain.
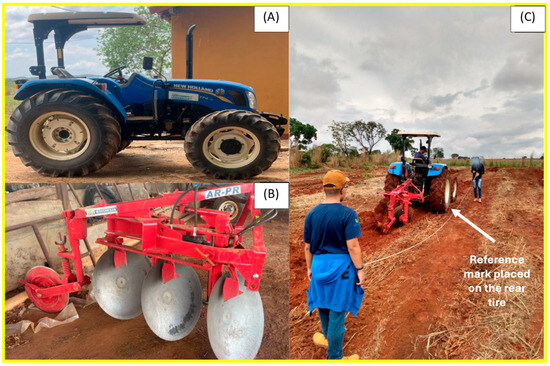
Figure 1.
(A) New Holland TT4.75 tractor with ballast configuration (front weights: 240 kg; rear water tanks: 270 L/tire). (B) Marchesan AR-PR reversible plow with 710 mm discs and adjustable arms. (C) Slip test procedure.
The reversible disc plow used was a Marchesan AR-PR model, consisting of three smooth discs with a diameter of 28 inches (710 mm), mounted at a variable angle to promote effective soil inversion and residue incorporation (Figure 1B). Each disc is supported by independently articulated arms with adjustable spacing, enabling a working width of approximately 1.20 m and depth of up to 30 cm. The total mass of the implement is around 460 kg. It is designed for conventional tillage in clayey or medium-textured soils, and requires moderate traction effort.
Two ballasting levels were tested: 52.5 kg/hp (3937.5 kg) and 57.5 kg/hp (4312.5 kg), representing moderate and high ballast configurations, respectively. The ballast included 270 L of water per rear tire (equivalent to 270 kg each) and front weights totaling 240 kg, adjusted according to the required load distribution. The percentage of added ballast relative to the tractor’s unladen weight was approximately 35% for the 52.5 kg/hp setup and 48% for the 57.5 kg/hp setup. The ballast configuration aimed to optimize tractive performance while avoiding excess soil compaction, based on manufacturer guidelines and traction theory.
The gears selected for evaluation were the 3rd and 4th reduced gears, offering theoretical forward speeds of 4.2 km/h and 5.6 km/h, respectively. These speeds are suitable for heavy-duty soil preparation with moderate to high traction demand. A Garmin eTrex 20× GPS device mounted on the tractor allowed verification of operational speed consistency and trajectory alignment.
In sequence, a standardized slippage test was carried out by applying a reference mark to the rear tire and measuring the distance traveled during three complete rotations, both with and without the plow engaged (Figure 1C). This procedure enabled the calculation of slippage (%) using the equation proposed by Mialhe [24], as described in Section 2.3. The resulting values were used to evaluate the traction efficiency under each combination of gear and ballast, as well as in relation to the spatial variability in soil physical conditions.
2.3. Experimental Design and Field Procedures
The experiment was conducted using a 2 × 2 factorial design, with analysis based on the F-test. The evaluated factors were gear selection, third and fourth reduced gears, and ballast weight: 52.5 kg/hp and 57.5 kg/hp. Each treatment combination was applied three times, totaling twelve repetitions. The objective was to assess the interaction between these factors and their effects on tractor wheel slippage.
The experimental area measured 53 m in length and 14.6 m in width. It was subdivided into six quadrants of 94.5 m2 each, arranged in three longitudinal strips of 15 m (with 4-m separations) and two transversal strips of 6.3 m (with a 2-m gap between them). The demarcation of the quadrants was performed using measuring tape and wooden stakes, ensuring accurate physical boundaries. Prior to the beginning of the experimental operations, all surface straw residues were removed from the area.
Within each quadrant, twelve random points were marked for data collection. Two distinct mechanical operations were conducted using a tractor. In the odd-numbered quadrants (1, 3, and 5), the tractor was operated in fourth reduced gear with a ballast of 57.5 kg/hp at a working speed of 5.11 km/h. In the even-numbered quadrants (2, 4, and 6), the operation was performed in third reduced gear with a ballast of 52.5 kg/hp and a speed of 3.45 km/h, corresponding to the 4th and 3rd reduced gears, respectively. These speeds were chosen because they represent typical operational ranges for heavy tillage, balancing traction demand and field efficiency. All procedures were carried out under friable soil conditions, which were considered suitable for the implements used in the field.
The treatment arrangement allowed for the comparison of operational performance under distinct gear and ballast conditions across well-defined plots. A schematic representation of the experimental layout, including dimensions and the positioning of odd and even quadrants, is shown in Figure 2.
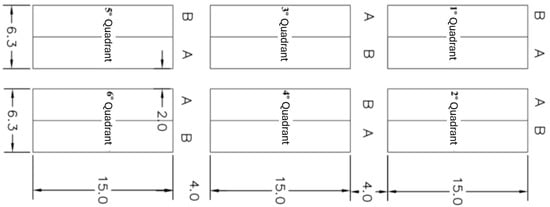
Figure 2.
Experimental layout showing quadrants for different test conditions: Section A (Strip 2): Quadrants 2, 4, 6 (52.5 kg/hp ballast, 3rd reduced gear); Section B (Strip 1): Quadrants 1, 3, 5 (57.5 kg/hp ballast, 4th reduced gear).
2.4. Data Collection, Processing and Statistical Analysis
Operational data such as forward speed, soil adherence, and visual slippage were manually and digitally recorded during treatments. Data were consolidated in spreadsheets and analyzed using Sisvar 5.6 software [25]. Analysis of variance (ANOVA) was conducted to assess the main effects of ballast and gear as well as their interaction. When significant differences (p < 0.05) were detected, Tukey’s test was applied for mean comparisons. Prior to ANOVA, assumptions of normality and homogeneity of variances were tested to validate the application of parametric statistics.
2.5. Aerial Survey and Digital Elevation Model Generation
To support terrain analysis, aerial images were collected using a DJI Mavic 3 Enterprise Multispectral remotely piloted aircraft equipped with a multispectral sensor (Figure 3A). The flight was conducted at an altitude of 20 m and a speed of 2.0 m/s, capturing 234 images at a spatial resolution (GSD) of 1.02 cm/pixel. The aircraft is equipped with GNSS modules (GPS, Galileo, BeiDou, GLONASS) and an RTK system that provides horizontal and vertical accuracy of ±0.1 m (Figure 3B). The aircraft’s stabilization system ensured image quality and positional consistency during acquisition.
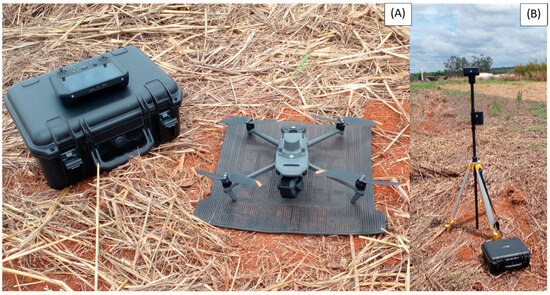
Figure 3.
Equipment used for image acquisition and georeferencing. (A) DJI Mavic 3 Multispectral with controller and case. (B) GNSS DJI D-RTK2 base station for precise positioning.
The multispectral camera contains a 1/2.8″ CMOS sensor with 5 MP resolution, a 73.91° field of view, 25 mm focal length, and an f/2.0 aperture. The sensor acquires data in four spectral bands: green (560 nm), red (650 nm), red edge (730 nm), and near-infrared (860 nm). Images were saved in TIFF format with a resolution of 2592 × 1944 pixels, meeting the spectral and spatial requirements for precise mapping and surface modeling.
Post-processing was performed using Pix4DMapper 4.5.6 to generate orthomosaics and radiometrically corrected reflectance maps. The Digital Elevation Model (DEM) was subsequently generated and refined using Agisoft PhotoScan Professional (v1.4.4), and all spatial analyses were conducted in a GIS environment to extract topographic attributes and evaluate field conditions. This methodological approach ensured a comprehensive evaluation of slippage behavior under realistic agricultural field conditions. The inclusion of detailed soil characterization, controlled ballasting, and standardized operating procedures allowed for reproducibility of results and application to similar mechanized tillage scenarios in clayey soils under tropical climates.
2.6. Remote Sensing and Morphometric Indicators
Spectral indices (SPI), generally a single number obtained from the spectral reflectance of two or more wavebands, are believed to improve remote sensing data interpretation [26]. Several of these indices obtained from RS images have been successfully used for mapping soil exposure changes [27,28]
In this study, six indices were computed using imagery acquired by a DJI Mavic platform equipped with a multispectral camera that does not include the blue band, which is a common limitation in compact systems. The indices (Table 1) were adapted to the available spectral bands, specifically Green, Red, Red Edge, and Near-Infrared, and were calculated using the R programming language. The selected indices include the Normalized Difference Red Edge Index (NDRE), Normalized Difference Water Index (NDWI), Bare Soil Index (BSI), Green–Red Vegetation Index (GRVI), Visible Atmospherically Resistant Index (VARI), and Slope, the latter derived from the DEM using GIS functions, where terrain analysis calculated angular variation in degrees for each cell. The DEM was generated from RS imagery processed in Pix4DMapper, refined in Agisoft PhotoScan, and then analyzed in R software to extract slope values.

Table 1.
Spectral and Topographic Indices.
3. Results
3.1. Variations in Soil Physical Attributes
The variability in soil physical properties across the experimental quadrants is a determining factor for understanding the performance of traction during tillage operations. Table 2 summarizes the gravimetric moisture content (U), volumetric moisture content (θ), and soil bulk density (Ds) for each quadrant, while Table 3 presents the soil penetration resistance (PR) values converted into megapascals (MPa).
Table 2.
Soil moisture and bulk density data for each experimental quadrant.
Table 3.
Average soil penetration resistance (PR) per quadrant.
The highest gravimetric moisture was found in Q5 (32%), followed closely by Q6 (31%), while the lowest value was observed in quadrants 2 and 3 (26%). In terms of volumetric moisture, Q5 again showed the highest value (38%), indicating a combination of high water content and moderate compaction.
Bulk density values varied significantly, from 1231.54 kg/m3 in Q1 (the highest) to 890.29 kg/m3 in Q6 (the lowest). These differences indicate zones of potential compaction, particularly in Q1 and Q3, and more friable conditions in Q6. High bulk density generally indicates reduced porosity, which may result in greater traction resistance during soil operations.
Regarding soil resistance to penetration, results are presented in Table 3, as the average of three repetitions per quadrant. The data were calculated based on the number of impacts per 10 cm depth, according to the Stolf [29] methodology, and then converted to megapascals (MPa).
The highest mean PR was observed in Q1 (3.82 MPa), in agreement with its high bulk density, reinforcing the correlation between compacted structure and resistance to implement penetration. Conversely, Q4 showed the lowest mean PR (2.20 MPa), consistent with its moderate moisture and relatively lower density.
Notably, Q5, despite its elevated gravimetric moisture (32%) and moderate bulk density (1185.7 kg/m3), exhibited considerable variation in soil penetration resistance (2.05–4.07 MPa). This behavior may be attributed to transient surface saturation resulting from the 34.8 mm rainfall recorded on 29 October, just prior to the field trial, as reported in Section 2.1. Given the low evapotranspiration rates and high atmospheric humidity observed during the period, excess water likely remained in the soil profile, increasing plasticity and reducing internal cohesion. These conditions tend to diminish the soil’s shear strength and bearing capacity, leading to nonlinear responses in traction performance and slippage.
3.2. Statistical Significance of Gear and Ballast Weight on Slippage
The results of the analysis of variance (ANOVA), presented in Table 4, reveal the statistically significant influence (p < 0.05) of gear selection (G), ballast weight (W), and their interaction (G × W) on the variation in slippage observed during plowing operations. This highlights that ballast had the strongest effect on slip variation, but its impact depended on gear choice, confirming the importance of analyzing treatment combinations rather than factors in isolation. The detailed performance outcomes are presented in Section 3.3.
Table 4.
ANOVA for slippage percentage based on gear and ballast.
Analysis of variance (ANOVA) revealed significant effects (p < 0.05) of all sources of variation analyzed on the slip percentage. Weight (W) showed the largest effect (MS = 93.52; p = 0.00%), followed by the interaction between gear and weight (G × W; MS = 8.40; p = 1.56%) and gear alone (G; MS = 4.81; p = 0.45%). The experimental block also showed a significant influence (MS = 1.03; p = 17.18%), indicating variations in the test conditions. The coefficient of variation (CV = 9.30%) demonstrated good experimental precision, validating the reliability of the results obtained. The significance observed in the interaction term (G × W) suggests that the effect of ballast weight on slippage is not constant across different gear selections, reinforcing the need for context-specific adjustments in field operations.
3.3. Comparative Slippage Performance
The mean values of wheel slippage for each treatment are shown in Table 5.
Table 5.
Mean values of wheel slippage (%) as a function of different gears and ballast weights.
The worst performance was observed with 57.5 kg/hp in 4th gear, reaching 11.32%, while the best performance occurred with 52.5 kg/hp in 4th gear, resulting in 4.06% slippage. Interestingly, the heavier ballast did not improve traction as expected, indicating that over-ballasting under moist and compacted conditions may exacerbate slippage rather than reduce it.
While it is common to associate greater ballast with better soil grip due to increased downward force on drive wheels, the data suggest a threshold beyond which additional weight leads to diminishing returns, particularly in friable, moisture-retaining clay soils.
3.4. Spectral and Terrain Indices
The Vegetation and Topographic indices were computed using the formulas shown in Section 2.6 (Table 1). To evaluate the spatial variability in vegetation, soil exposure, moisture conditions, and terrain morphology across the experimental field, six key indices were analyzed: NDRE (Normalized Difference Red Edge), NDWI (Normalized Difference Water Index), BSI (Bare Soil Index), GRVI (Green-Red Vegetation Index), VARI (Visible Atmospherically Resistant Index), and Slope. The results are presented in Table 6 and Figure 4.
Table 6.
Mean values of selected spectral and terrain indices for each quadrant.
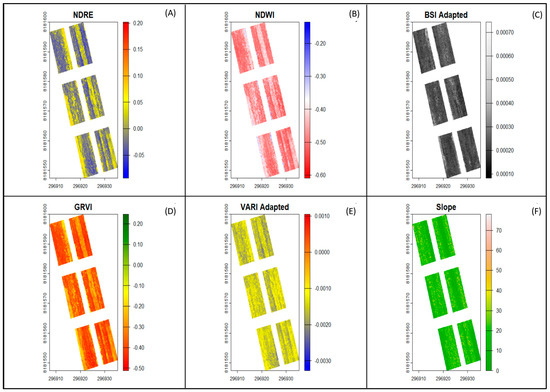
Figure 4.
Spatial distribution of key spectral and terrain indices across the experimental field: (A) NDRE—Normalized Difference Red Edge; (B) NDWI—Normalized Difference Water Index; (C) BSI—Bare Soil Index; (D) GRVI—Green-Red Vegetation Index; (E) VARI—Visible Atmospherically Resistant Index; (F) Slope (degrees).
The NDRE, which uses red-edge and near-infrared reflectance to detect chlorophyll content and early vegetation stress, presented low values in most quadrants, with the highest in Q3 (0.0034) and the lowest in Q2 (–0.0143). These values suggest low vegetative vigor, consistent with a transitional or fallow phase in the crop cycle (Figure 4A).
The NDWI, sensitive to moisture in vegetation and surface soil, showed uniformly negative values, indicating low water content or bare soil presence. Quadrant 6 had the lowest NDWI (–0.477), while Q5 showed the highest (–0.455), consistent with field observations and precipitation history (Figure 4B).
The BSI, designed to emphasize bare soil exposure, showed minimal variation across quadrants, with slightly elevated values in quadrants 1 and 2, indicating greater exposure or less biomass cover (Figure 4C).
The GRVI, a simple index contrasting green and red reflectance, also revealed consistent patterns of low to moderate vegetation presence. Values ranged from –0.368 in quadrant 2 to –0.342 in quadrant 3, confirming that biomass was sparse or partially degraded (Figure 4D). The VARI, which enhances vegetation detection in RGB imagery under varying atmospheric conditions, showed similarly low variation, but slightly higher values in quadrant 3 (–0.00147) and lower in quadrant 2 (–0.00165) (Figure 4E).
Finally, the slope, derived from elevation data, varied from 13.50° (Q6) to 14.52° (Q3), indicating mild topographic variation. This variable is important for interpreting traction dynamics and water flow, particularly in mechanized operations (Figure 4F). The mean values of each index per quadrant are summarized in Table 6, and the spatial distributions are illustrated in Figure 4.
4. Discussion
The comprehensive analysis of soil physical properties, mechanized operation efficiency, and spectral/terrain indices in this study provides critical insights into the spatial variability and management requirements of the experimental field.
The results revealed a clear relationship between soil physical properties in the different quadrants, particularly regarding the interaction between bulk density, moisture content, and water content. Soil bulk density values varied significantly among the studied quadrants, reflecting distinct compaction conditions. According to Jones et al. [30] and Paltineanu et al. [31], soils with a bulk density (Ds) > 1.75 g/cm3 are considered compacted, while values between 1.40–1.75 g/cm3 indicate moderate compaction, and Ds < 1.40 g/cm3 characterize slightly compacted soils. In this study, 50% of the quadrants (Q2, Q4, Q6) presented low compaction (Ds < 1.40 g/cm3), while the others (Q1, Q3, Q5) exhibited moderate compaction (1.20–1.23 g/cm3), with no records of high compaction (Ds > 1.75 g/cm3). These differences demarcate critical zones, such as Q1 and Q3, which approach the upper limit for moderate compaction, and more friable areas, such as Q6.
High soil density is often associated with reduced porosity, which can increase penetration resistance and limit root development [32,33]. The results revealed a clear relationship between density, moisture, and water content: quadrants with moderate compaction (Q1, Q3, Q5) had higher water contents (θ = 32–38%), suggesting that the lower porosity in these locations favored water retention. However, the exception observed in Q6—low density (0.89 g/cm3) despite high moisture content (31%)—indicates the influence of other factors, such as organic matter content or textural heterogeneity.
These findings corroborate previous studies on the complex relationship between compaction and water dynamics in agricultural soils [34], but highlight the importance of considering spatial variability, even in apparently homogeneous areas [35]. Although current compaction levels do not represent severe restrictions on root growth, continuous monitoring is essential, especially in quadrants such as Q1 and Q3, where density approaches critical limits. The absence of extreme compaction suggests that appropriate management practices can prevent physical degradation, but identifying local factors (e.g., organic matter, cultivation history) is crucial to guide differentiated management strategies.
The data revealed a consistent relationship between penetration resistance (PR) and bulk density, with quadrants Q1 (mean PR = 3.82 MPa) and Q5 (maximum PR = 4.07 MPa) presenting the highest values for both parameters. This correlation reinforces the understanding that soils with a more compacted structure offer greater resistance to implement penetration, as observed in previous studies [36]. Particularly noteworthy is the case of Q1, which combined the highest mean PR (3.82 MPa) with high bulk density (1.23 g/cm3), suggesting the formation of a compacted layer that can restrict root development and increase energy demands in agricultural operations [37].
In contrast, Q4 showed the lowest and most consistent values (1.85–2.68 MPa), associated with its lower bulk density and moderate moisture content. This condition can be attributed to transient water saturation resulting from the 34.8 mm of rainfall recorded immediately before the tests, as detailed in Section 2.1. As demonstrated by [38] excess water in the soil profile reduces internal cohesion and shear strength, explaining the lower RP values in this quadrant.
These differences have important practical implications: soils such as Q1 will require greater traction force, increasing wheel slippage and fuel consumption, while areas such as Q4, although less energy-intensive, may be more susceptible to compaction under heavy traffic in wet conditions [39]. This spatial variability reinforces the need for differentiated management strategies to optimize operational efficiency and minimize impacts on soil structure.
The ANOVA results conclusively demonstrate that ballast is the most critical factor in controlling slippage during plowing operations, explaining the largest portion of the observed variation. This finding corroborates previous studies that emphasize the importance of adequate tractor balancing for optimizing traction [40]. The significant interaction between gear and weight (G × W) suggests that integrated adjustment strategies are more effective than isolated adjustments, allowing simultaneous gains in operational performance and energy efficiency. Additionally, the non-significant block effect (p = 17.18%) indicates that the replication structure of the experimental design did not introduce substantial variability, validating the factorial arrangement used and confirming the consistency across plots. The significant influence of the experimental block highlights the importance of considering natural soil variability, reinforcing the need for prior mapping with RPAs for accurate decisions.
The low CV (9.30%) confirms the reliability and precision of the experimental setup, while the p-values suggest potential reductions of up to 20% in slippage with appropriate technical adjustments. According to Gomes et al. [41], CV values below 10% in field trials are indicative of high experimental accuracy and minimal uncontrolled variation, supporting the robustness of the findings.
When analyzing sliding performance, the results demonstrate the strong interaction between gear selection and ballast weight on wheel slip during tillage operations. The heaviest ballast configuration (57.5 kg/hp) consistently produced greater wheel slip (mean of 11.32%) compared to moderate ballast (mean of 4.06%), regardless of gear selection (p < 0.05). This suggests that excess ballast may increase wheel slip rather than improve traction, particularly when operating in 4th gear, where wheel slip reached 11.32%. This implies that the effects of gearing and ballast cannot be optimized independently, since the performance of one depends on other level.
Third gear performed best with both ballast levels, maintaining slip below 8.5%, which is in line with the findings of Kichler et al. [42] who demonstrated that lower gear selections improve power transfer efficiency. Notably, moderate ballast (52.5 kg/hp) maintained acceptable slip levels (4.06–4.47%) in both gears, suggesting that this configuration may offer the best compromise between traction and operational efficiency for the tested soil conditions. The results indicate that increasing ballast weight contributed to greater efficiency, particularly in fourth gear, which exhibited the highest efficiency under heavy ballast conditions. This reinforces the importance of adjusting the ballast to the gear used, since higher gears, when combined with greater ballast, result in better operational performance.
These findings are consistent with Lontseva et al. [43], who emphasize that correct ballast configuration, combined with appropriate gear selection, reduces losses due to excessive slippage and improves the utilization of the tractor’s power. The improperly calculating ballast weight can lead to wasted fuel and operating time. According to the authors, wheel slip is a key indicator for correct ballast adjustment. When ballast is insufficient, there is reduced traction efficiency, increased drive wheel slip, and, consequently, higher fuel consumption [44]. On dry, firm soils, ideal wheel slip varies between 6% and 12%, while on moist or prepared soils, values between 10% and 15% are acceptable [15,45]
The analysis of spectral and terrain indices across the experimental field revealed a landscape characterized by low vegetation vigor, limited moisture availability, and minimal topographic variation. These conditions directly influence the performance and efficiency of mechanized operations as described by Pinon et al. [46]. The consistently negative NDRE and NDWI values indicate a predominance of areas with sparse vegetation or fallow conditions, reflecting low photosynthetic activity and reduced surface moisture content, in agreement with [47]. This interpretation is further supported by the low GRVI and VARI values, which show only slight variation among quadrants but confirm the limited presence of biomass and vegetation cover, consistent with [48].
The BSI values were slightly higher in quadrants 1 and 2, suggesting greater soil exposure in these areas, which can affect rolling resistance and tire traction during soil preparation, as noted by Ribeiro et al. [49]. The slope index varied moderately, ranging from 13.5 to 14.5 degrees, indicating a relatively uniform terrain. According to Macdonald et al. [50], this level of variation may influence surface water runoff and moisture distribution, particularly during rainfall events. Overall, Q3 stands out with slightly more favorable values in NDRE, NDWI, and GRVI, suggesting a marginally healthier area, while Q2 and Q6 present the worst indicators. These findings emphasize the importance of using a combination of spectral and morphometric indices to assess the spatial variability of key attributes relevant to the planning and adjustment of field mechanized operations. This study has some limitations. The results are restricted to a single soil type (clayey Nitisol) and to one experimental season under tropical conditions, which may limit broader generalization. In addition, the analysis of RPA-derived indices and tractor performance was descriptive, without statistical modeling, which reduces predictive capacity. Future research should validate these findings in different soils, seasons, and operational scales, and include more robust correlation analyses to strengthen the conclusions.
5. Conclusions
The use of Remotely Piloted Aircraft (RPA) allowed the mapping of spatial variability in soil surface conditions through spectral indices such as the Normalized Difference Red Edge (NDRE), Normalized Difference Water Index (NDWI), Bare Soil Index (BSI), Green–Red Vegetation Index (GRVI), and slope. These indicators showed consistent alignment with field-measured attributes, including bulk density (ranging from 890 to 1231 kg/m3), penetration resistance (2.20–3.82 MPa), and soil moisture.
The RPA-derived indicators reflected differences in tractor performance. For example, quadrants with higher compaction and bare soil exposure (Q1 and Q3) presented greater traction demand and higher slippage. In contrast, the best operational efficiency was observed with the combination of third reduced gear and moderate ballast (52.5 kg/hp), resulting in the lowest slippage (4.06%), compared with the highest slippage of 11.32% under heavy ballast in 4th gear.
It is therefore concluded that geospatial information derived from RPA imagery can support localized ballast and gear adjustments, reducing slippage and improving traction efficiency. This approach enhances precision mechanization strategies and supports decision-making under variable soil and surface conditions.
Author Contributions
Conceptualization, L.S.S., L.G.M.d.S. and J.M.d.S.; methodology, M.A.Z. and L.S.S.; validation, L.S.S., A.C.M.F. and F.T.; formal analysis, E.F.d.F.e.S. and A.M.d.R.F.J.; investigation, T.G.F.d.S.; data curation, L.G.M.d.S. and J.M.d.S.; writing—original draft preparation, L.S.S., L.G.M.d.S. and J.M.d.S.; writing—review and editing, E.F.d.F.e.S. and A.M.d.R.F.J. and M.A.Z.; visualization, F.T.; supervision, L.S.S. and T.G.F.d.S.; project administration, L.S.S.; funding acquisition, L.S.S. and T.G.F.d.S. All authors have read and agreed to the published version of the manuscript.
Funding
This research was funded by FAPEMIG APQ, grant number 00509-24.
Data Availability Statement
The dataset is available upon request from the authors. The data collected by our team for the research can be requested by other researchers for both primary and secondary studies. There are no restrictions on data sharing.
Acknowledgments
The authors gratefully acknowledge the technical support provided by the Institute of Agricultural Sciences (ICA) of the Federal University of the Jequitinhonha and Mucuri Valleys (UFVJM) for granting access to the experimental farm and laboratory facilities. Special thanks to the NEMA research group for their assistance with field data collection and equipment operation. A.M.d.R.F.J. acknowledges support from the São Paulo Research Foundation—FAPESP (grant 2025/19074-1). Furthermore, we would like to thank the anonymous reviewers for their constructive comments that greatly improved this manuscript.
Conflicts of Interest
The authors declare no conflicts of interest.
References
- Gamage, A.; Gangahagedara, R.; Gamage, J.; Jayasinghe, N.; Kodikara, N.; Suraweera, P.; Merah, O. Role of Organic Farming for Achieving Sustainability in Agriculture. Farming Syst. 2023, 1, 100005. [Google Scholar] [CrossRef]
- Albiero, D.; de Paulo, R.L.; Junior, J.C.F.; Santos, J.d.S.G.; Melo, R.P. Agriculture 4.0: A Terminological Introduction. Rev. Cienc. Agron. 2020, 51, e20207737. [Google Scholar] [CrossRef]
- Daum, T. Mechanization and Sustainable Agri-Food System Transformation in the Global South. A Review. Agron. Sustain. Dev. 2023, 43, 16. [Google Scholar] [CrossRef]
- Fang, D.; Chen, J.; Wang, S.; Chen, B. Can Agricultural Mechanization Enhance the Climate Resilience of Food Production? Evidence from China. Appl. Energy 2024, 373, 123928. [Google Scholar] [CrossRef]
- Lanças, K.P.; Filho, A.C.M.; dos Santos Moura, M.; de Jesus Damasceno, F.A.; Balestrin, D.R. Agricultural Tractor Test. Rev. Cienc. Agron. 2020, 51, e20207750. [Google Scholar] [CrossRef]
- Wang, Y.; Zeng, S. From Planting to Harvesting: The Role of Agricultural Machinery in Crop Cultivation. Agriculture 2025, 15, 1101. [Google Scholar] [CrossRef]
- Yang, T.; Siddique, K.H.M.; Liu, K. Cropping Systems in Agriculture and Their Impact on Soil Health-A Review. Glob. Ecol. Conserv. 2020, 23, e01118. [Google Scholar] [CrossRef]
- Ferreira, C.S.S.; Seifollahi-Aghmiuni, S.; Destouni, G.; Ghajarnia, N.; Kalantari, Z. Soil Degradation in the European Mediterranean Region: Processes, Status and Consequences. Sci. Total Environ. 2022, 805, 150106. [Google Scholar] [CrossRef]
- Al-Shammary, A.A.G.; Caballero-Calvo, A.; Fernández-Gálvez, J. Evaluating the Performance of a Novel Digital Slippage System for Tractor Wheels Across Varied Tillage Methods and Soil Textures. Agriculture 2024, 14, 1957. [Google Scholar] [CrossRef]
- Moinfar, A.; Shahgholi, G.; Gilandeh, Y.A.; Kaveh, M.; Szymanek, M. Investigating the Effect of the Tractor Driving System Type on Soil Compaction Using Different Methods of ANN, ANFIS and Step Wise Regression. Soil Tillage Res. 2022, 222, 105444. [Google Scholar] [CrossRef]
- Shahgholi, G.; Moinfar, A.; Khoramifar, A.; Maciej, S.; Szymanek, M. Investigating the Effect of Tractor’s Tire Parameters on Soil Compaction Using Statistical and Adaptive Neuro-Fuzzy Inference System (ANFIS) Methods. Agriculture 2023, 13, 259. [Google Scholar] [CrossRef]
- Mohieddinne, H.; Yatskul, A.; Ugarte, C.; Thibaut, J.; Guidet, J.; Ritz, S. Trade-off between Agronomical and Energetical Performances during Barley Sowing Varying Adjustable Parameters in a Tractor-Tire-Tool System. Soil Tillage Res. 2023, 226, 105582. [Google Scholar] [CrossRef]
- Kazenwadel, B.; Graf, M.; Michiels, L.; Geimer, M. Operating Point Optimization of Agricultural Tractor–Implement Combinations as Constraint Optimization Problem. Eng 2025, 6, 27. [Google Scholar] [CrossRef]
- Kumar, S.; Noori, M.T.; Pandey, K.P. Performance Characteristics of Mode of Ballast on Energy Efficiency Indices of Agricultural Tyre in Different Terrain Condition in Controlled Soil Bin Environment. Energy 2019, 182, 48–56. [Google Scholar] [CrossRef]
- Kim, W.S.; Lee, D.H.; Kim, Y.J.; Kim, Y.S.; Park, S.U. Estimation of Axle Torque for an Agricultural Tractor Using an Artificial Neural Network. Sensors 2021, 21, 1989. [Google Scholar] [CrossRef]
- Jensen, T.A.; Antille, D.L.; Tullberg, J.N. Improving On-Farm Energy Use Efficiency by Optimizing Machinery Operations and Management: A Review. Agric. Res. 2025, 14, 15–33. [Google Scholar] [CrossRef]
- Russini, A.; Schlosser, J.F.; de Farias, M.S. Estimation of the Traction Power of Agricultural Tractors from Dynamometric Tests. Cienc. Rural 2018, 48, e20170532. [Google Scholar] [CrossRef]
- Zimmermann, G.G.; Savi, D.; Auler, A.C.; Neto, L.S.; Jasper, S.P. Effect of Hydraulic and Solid Ballast on Agricultural Tractor Performance. Rev. Cienc. Agron. 2022, 53, e20217963. [Google Scholar] [CrossRef]
- Gamage, A.; Gangahagedara, R.; Subasinghe, S.; Gamage, J.; Guruge, C.; Senaratne, S.; Randika, T.; Rathnayake, C.; Hameed, Z.; Madhujith, T.; et al. Advancing Sustainability: The Impact of Emerging Technologies in Agriculture. Curr. Plant Biol. 2024, 40, 100420. [Google Scholar] [CrossRef]
- Karunathilake, E.M.B.M.; Le, A.T.; Heo, S.; Chung, Y.S.; Mansoor, S. The Path to Smart Farming: Innovations and Opportunities in Precision Agriculture. Agriculture 2023, 13, 1593. [Google Scholar] [CrossRef]
- Alvares, C.A.; Stape, J.L.; Sentelhas, P.C.; De Moraes Gonçalves, J.L.; Sparovek, G. Köppen’s Climate Classification Map for Brazil. Meteorol. Z. 2013, 22, 711–728. [Google Scholar] [CrossRef]
- Naime, J.; da Motta, P.E.F.; da Silva, D.C.; Simão, M.L.R.; dos Santos, A.J.R. Solos e Avaliação Do Potencial Agrossilvipastoril Das Microrregiões Paracatu e Unaí-Minas Gerais; Empresa de Pesquisa Agropecuária de Minas Gerais: Belo Horizonte, Brazil, 2014. [Google Scholar]
- Santos, H.G.; Jacomine, P.K.T.; dos Anjos, L.H.C.; de Oliveira, V.Á.; Lumbreras, J.F. Sistema Brasileiro de Classificação de Solos; Embrapa: Brasília, Brazil, 2018; ISBN 9788570358004. [Google Scholar]
- Mialhe, L.G. Máquinas Agrícolas: Ensaios & Certificação. Fealq 1996, 722. Available online: https://repositorio.usp.br/item/000913730 (accessed on 30 July 2025).
- Ferreira, D.F. SISVAR: A computer analysis system to fixed effects split plot type designs. Rev. Bras. Biom. 2019, 37, 529–535. [Google Scholar] [CrossRef]
- Verstraete, M.M.; Pinty, B. Designing Optimal Spectral Indexes for Remote Sensing Applications. IEEE Trans. Geosci. Remote Sens. 2022, 34, 1254–1265. [Google Scholar] [CrossRef]
- Zhu, S.; Cui, N.; Jin, H.; Jin, X.; Guo, L.; Jiang, S.; Wu, Z.; Lv, M.; Chen, F.; Liu, Q.; et al. Optimization of Multi-Dimensional Indices for Kiwifruit Orchard Soil Moisture Content Estimation Using UAV and Ground Multi-Sensors. Agric. Water Manag. 2024, 294, 108705. [Google Scholar] [CrossRef]
- Khose, S.B.; Mailapalli, D.R. Spatial Mapping of Soil Moisture Content Using Very-High Resolution UAV-Based Multispectral Image Analytics. Smart Agric. Technol. 2024, 8, 100467. [Google Scholar] [CrossRef]
- Stolf, R. Theory and Test of Formulas for Transforming Impact Penetrometer Data in Soil Resistance. Rev. Bras. Ciência Solo 1991, 2, 229–235. [Google Scholar]
- Jones, R.J.A.; Spoor, G.; Thomasson, A.J. Vulnerability of Subsoils in Europe to Compaction: A Preliminary Analysis. Soil Tillage Res. 2003, 73, 131–143. [Google Scholar] [CrossRef]
- Paltineanu, C.; Calciu, I.; Vizitiu, O. CHARACTERIZING SOILS COMPACTION BY USING PACKING DENSITY AND COMPACTION DEGREE INDICES. Soil Sci. 2015, 49, 54–71. [Google Scholar]
- Êkansson, I.H.; Lipiec, J. A Review of the Usefulness of Relative Bulk Density Values in Studies of Soil Structure and Compaction. Soil Tillage Res. 2000, 53, 71–85. [Google Scholar] [CrossRef]
- Panagos, P.; De Rosa, D.; Liakos, L.; Labouyrie, M.; Borrelli, P.; Ballabio, C. Soil Bulk Density Assessment in Europe. Agric. Ecosyst. Environ. 2024, 364, 108907. [Google Scholar] [CrossRef]
- Faloye, O.T.; Ajayi, A.E.; Zink, A.; Fleige, H.; Dörner, J.; Horn, R. Effective Stress and Pore Water Dynamics in Unsaturated Soils: Influence of Soil Compaction History and Soil Properties. Soil Tillage Res. 2021, 211, 104997. [Google Scholar] [CrossRef]
- O’Connor, D. Soil Compaction Dependence on Sub-Field Spatial Soil Constraint Variability; Project Report; University of Southern Queensland: Toowoomba, Australia, 2022; Available online: https://sear.unisq.edu.au/51877/ (accessed on 10 September 2025).
- Liu, K. Parameters Optimisation of Agricultural Machinery for Soil Compaction Mitigation and Crop Yield Enhancement. 2024. Available online: https://www.research.unipd.it/handle/11577/3508890 (accessed on 10 September 2025).
- Braga, S.E.; Rolim Neto, F.C.; de Almeida, B.G.; de Almeida, C.D.G.C.; de Paulo Silva, V.; Wanderley, R.A.; Rizzi Neto, E. Resistencia Do Solo à Penetração de Raízes No Solo: Uma Revisão Da Literature. Cad. Pedagógico 2024, 21, e3750. [Google Scholar] [CrossRef]
- Silva, I.N.; Indraratna, B.; Nguyen, T.T.; Rujikiatkamjorn, C. Shear Behaviour of Subgrade Soil with Reference to Varying Initial Shear Stress and Plasticity Index. Acta Geotech. 2022, 17, 4207–4216. [Google Scholar] [CrossRef]
- Lepore, E.; Schmidt, O.; Fenton, O.; Tracy, S.; Bondi, G.; Wall, D.P. Traffic Induced Compaction and Physical Quality of Grassland Soil under Different Soil Moisture Deficits. Soil Tillage Res. 2024, 244, 106205. [Google Scholar] [CrossRef]
- Lebedev, A.; Shuliak, M.; Lebedev, S.; Khalin, S.; Haidai, T.; Kholodov, A.; Pirogov, V.; Shaposhnyk, V. Determining conditions for providing maximum traction efficiency of tractor as part of a soil tillage unit. East.-Eur. J. Enterp. Technol. 2024, 1, 6–14. [Google Scholar] [CrossRef]
- Gomes, M.A.B.; de Sousa Bulhões, L.O. Diffusion Coefficient of H+ at Nb2O5 Layers Prepared by Thermal Oxidation of Niobium. Electrochim. Acta 1990, 35, 765–768. [Google Scholar] [CrossRef]
- Kichler, C.M.; Fulton, J.P.; Raper, R.L.; McDonald, T.P.; Zech, W.C. Effects of Transmission Gear Selection on Tractor Performance and Fuel Costs during Deep Tillage Operations. Soil Tillage Res. 2011, 113, 105–111. [Google Scholar] [CrossRef]
- Lontseva, I.; Sennikov, V. Improving the Efficiency of Combine Harvesters. In Fundamental and Applied Scientific Research in the Development of Agriculture in the Far East (AFE-2021); Muratov, A., Ignateva, S., Eds.; Lecture Notes in Networks and Systems; Springer: Cham, Switzerland, 2022; Volume 353, pp. 123–145. [Google Scholar] [CrossRef]
- Pranav, P.K.; Pandey, K.P.; Tewari, V.K. Digital Wheel Slipmeter for Agricultural 2WD Tractors. Comput. Electron. Agric. 2010, 73, 188–193. [Google Scholar] [CrossRef]
- Bulgakov, V.; Aboltins, A.; Beloev, H.; Nadykto, V.; Kyurchev, V.; Adamchuk, V.; Kaminskiy, V. Maximum Admissible Slip of Tractor Wheels without Disturbing the Soil Structure. Appl. Sci. 2021, 11, 6893. [Google Scholar] [CrossRef]
- Pinon, T.B.M.; de Mendonça, A.R.; da Silva, G.F.; Effgen, E.M.; Rodrigues, N.M.M.; Fernandes, M.M.; Sansevero, J.B.B.; de Almeida, C.T.; Dias, H.M.; Gonçalves, F.G.; et al. Biodiversity from the Sky: Testing the Spectral Variation Hypothesis in the Brazilian Atlantic Forest. Remote Sens. 2024, 16, 4363. [Google Scholar] [CrossRef]
- Serrano, J.; Shahidian, S.; da Silva, J.M. Evaluation of Normalized Difference Water Index as a Tool for Monitoring Pasture Seasonal and Inter-Annual Variability in a Mediterranean Agro-Silvo-Pastoral System. Water 2019, 11, 62. [Google Scholar] [CrossRef]
- Motohka, T.; Nasahara, K.N.; Oguma, H.; Tsuchida, S. Applicability of Green-Red Vegetation Index for Remote Sensing of Vegetation Phenology. Remote Sens. 2010, 2, 2369–2387. [Google Scholar] [CrossRef]
- Ribeiro, P.G.; Martins, G.C.; Gastauer, M.; da Silva Junior, E.C.; Santos, D.C.; Frois Caldeira Júnior, C.; Cavalcante, R.B.L.; dos Santos, D.S.; Carneiro, M.A.C.; Valadares, R.B.d.S.; et al. Spectral and Soil Quality Index for Monitoring Environmental Rehabilitation and Soil Carbon Stock in an Amazonian Sandstone Mine. Sustainability 2022, 14, 597. [Google Scholar] [CrossRef]
- Macdonald, J.A.; Barnard, D.M.; Mankin, K.R.; Miner, G.L.; Erskine, R.H.; Poss, D.J.; Mehan, S.; Mahood, A.L.; Mikha, M.M. Topographic Position Index Predicts Within-Field Yield Variation in a Dryland Cereal Production System. Agronomy 2025, 15, 1304. [Google Scholar] [CrossRef]
Disclaimer/Publisher’s Note: The statements, opinions and data contained in all publications are solely those of the individual author(s) and contributor(s) and not of MDPI and/or the editor(s). MDPI and/or the editor(s) disclaim responsibility for any injury to people or property resulting from any ideas, methods, instructions or products referred to in the content. |
© 2025 by the authors. Licensee MDPI, Basel, Switzerland. This article is an open access article distributed under the terms and conditions of the Creative Commons Attribution (CC BY) license (https://creativecommons.org/licenses/by/4.0/).