1. Introduction
Apples are among the most widely cultivated fruits globally, with world production exceeding 86 million tons annually [
1]. In Kazakhstan, apple breeding has a long tradition: the Kazakh Research Institute of Fruits and Vegetables has been engaged in developing new cultivars for nearly a century, resulting in 66 varieties officially included in the State Register [
2]. Among them, the Aport apple holds a unique position due to its historical, cultural, and economic importance. Market data indicate that the price of Aport apples in Almaty is on average twice as high as that of common international varieties such as Golden Delicious, Starkrimson, or Fuji, underlining its strong consumer demand and added value.
Each apple variety can be distinguished by morphological characteristics such as shape, color, size, and texture. For example, fruit diameter for commercial varieties typically ranges from 60 to 90 mm, with large-fruited cultivars like Aport reaching up to 120 mm [
3]. Coloration also serves as an important feature: some cultivars are characterized by uniform red or yellow tones, while others exhibit striped or spotted patterns. Texture-related traits, such as firmness and juiciness, are equally relevant, as they influence both consumer preference and industrial processing suitability. These parameters provide measurable criteria for varietal differentiation and form the basis for computer vision-based recognition systems.
Modern research in plant biology has increasingly applied computer vision and artificial intelligence for fruit variety recognition. Methods are typically divided into three groups: morphological analysis (shape, size, color) [
4,
5,
6,
7], spectral and chemical composition analysis [
8,
9,
10], and machine learning-based digital image processing [
11,
12,
13,
14,
15,
16,
17,
18]. In particular, convolutional neural networks (CNNs) such as AlexNet, VGG, GoogLeNet, SqueezeNet, and YOLO have been successfully tested on tasks ranging from quality grading to disease detection in apples and other crops [
19,
20,
21,
22,
23,
24]. Reported accuracies often exceed 90%, although many studies are limited by dataset size or controlled acquisition conditions. However, research specifically targeting Kazakhstan apple varieties is extremely limited, leaving a gap in localized digital recognition methodologies.
Algorithms and numerical methods for determining the parameters of apple fruits based on computer image processing have been developed, which increase the productivity and accuracy of quantitative assessment of weight, color, and shape for the automatic sorting of apples into commercial classes in accordance with the requirements of standards [
4,
11]. In most studies determining the quality of apples using computer vision, fruits are classified by quality into categories according to their size [
11,
12], color [
13,
14], and shape, as well as for the presence of defects [
15,
16,
17,
18], but research on Kazakh apple varieties is very limited.
The remarkable growth in the use of artificial intelligence (AI) in many applications and areas of life, including smart agriculture, has led to many studies focusing on image identification and classification using deep learning methods [
13,
19,
20]. Many studies have addressed the approach of transfer learning [
21,
22,
23], using GoogLeNet, AlexNet, YOLO-V3, SqueezeNet, VGG, and more.
Focusing on the use of transfer learning, Ibarra-Pérez et al. [
21] analyzed different CNN architectures to identify the phenological stages of plants, such as beans. They compared the performances of AlexNet, VGG19, SqueezeNet, and GoogLeNet, concluding that GoogLeNet was the best performing, reaching an accuracy of 96.71%.
Rady et al. [
23] analyzed the ability of deep neural networks that underwent transfer learning to classify the grade of stamped cotton cultivars (Egyptian cotton fibers). They used five convolutional neural networks (CNNs)—AlexNet, GoogLeNet, SqueezeNet, VGG16, and VGG19—and concluded that AlexNet, GoogLeNet, and VGG19 outperformed the others, reaching F1-Scores ranging from 40.0 to 100% depending on the cultivar type.
In another study, Yunong at al. [
24] proposed the use of AlexNet, VGG, GoogLeNet, and YOLO-V3 models for anthracnose lesion detection on apple fruits. First, the CycleGAN deep learning method was adopted to extract the features of healthy apples and anthracnose apples and to produce anthracnose lesions on the surface of healthy apple images. Compared with traditional image augmentation methods, this method greatly enriches the diversity of the training dataset and provides plentiful data for model training. Based on data augmentation, DenseNet was adopted in their research to substitute the lower-resolution layers of the YOLO-V3 model.
Li et al. [
13] carried out apple quality identification and classification to grade apples from real images containing complicated disturbance information—backgrounds similar to the surface of the fruits—into three quality categories. The authors developed and trained a CNN-based identification architecture for apple sample images. They compared the overall performance of the proposed CNN-based architecture, the Google Inception v3 model, and the HOG/GLCM + traditional SVM method, obtaining accuracies of 95.33%, 91.33%, and 77.67%, respectively.
As mentioned earlier, each apple variety has its own unique taste and characteristics, but the fruits often have a similar texture, color, and appearance to the naked human eye. Determining the exact apple variety is important for agronomists, gardeners, and farmers to properly care for the apple tree and take into account the growth and yield characteristics of each variety. Modern advances in computer image processing and artificial intelligence make it possible to solve this problem. In [
25], a digital methodology for determining the main characteristics of apples through the analysis of digital images is presented, but a digital methodology for recognizing the varietal affiliation of apples is missing.
The aim of this study is to develop a method for automatic recognition of Kazakh-stan apple varieties using color imaging, computer vision, and deep neural networks with transfer learning. The proposed approach complements earlier methodologies for apple quality assessment [
25] and, for the first time, addresses varietal identification of local Kazakh cultivars. The outcomes are expected to support both scientific applications (breeding and digital phenotyping) and practical tasks such as the design of automated fruit-sorting machines for industrial use.
2. Materials and Methods
2.1. Apple Sample Collection and Digital Image Acquisition
The objects of this study were five varieties of apples from Kazakhstan: Aport Alexander, Aynur, Sinap Almaty, Nursat, and Kazakhskij Yubilejnyj.
We selected the currently most popular apple varieties on the local market. The activities of production and grading of these varieties, which also includes sorting, have a significant impact in economic terms.
The samples were collected in the pomological garden of the Talgar branch of the Kazakh Research Institute of Fruit and Vegetable Growing (GPS coordinates: 43.238949, 76.889709).
Stratified sampling of the apples was carried out to ensure representativeness and coverage of the variability of the entire population. The selected apple varieties included typical fruit specimens, taking into account the color, size, weight, and shape of each sample. Then, based on the main criteria of visual integrity, ripeness, and lack of defects, sample fruits were selected. A total of 250 fruit specimens were examined, 50 fruits from each variety, which corresponds to the required sample size to ensure statistical reliability at a significance level of α = 0.25.
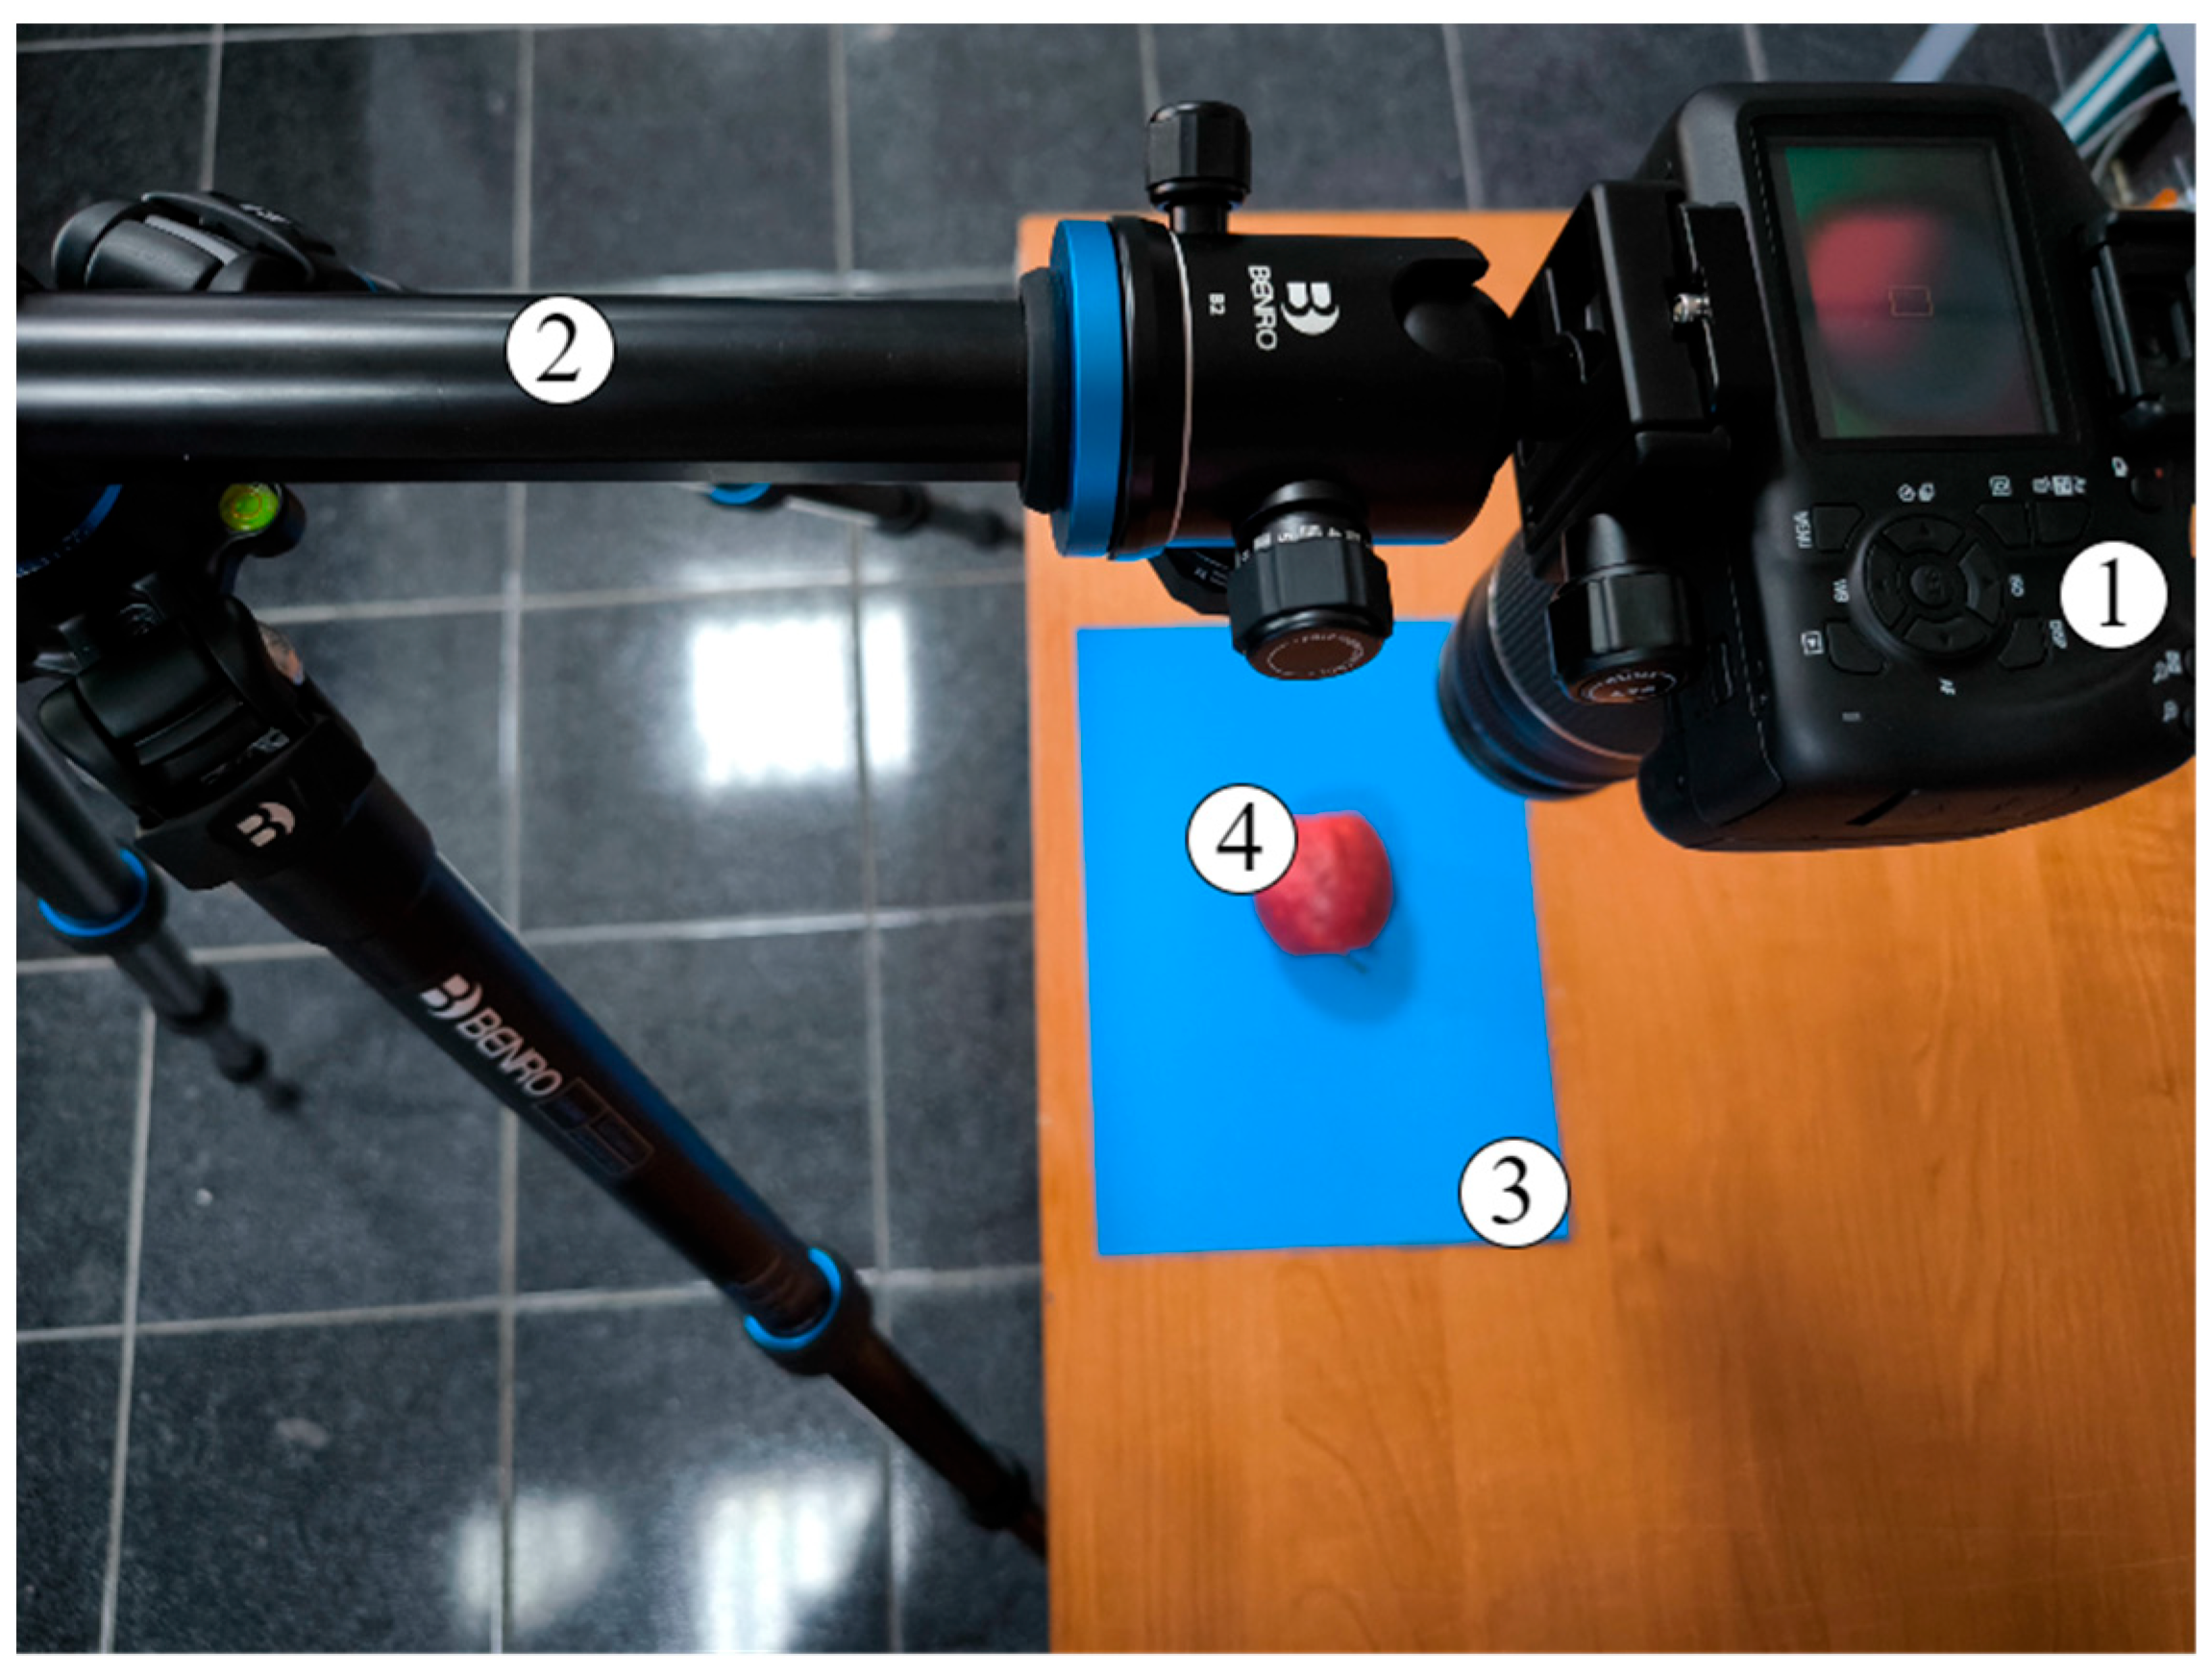
Digital images of the fruits were obtained under controlled lighting and background conditions, as shown in
Figure 1.
To obtain high-quality images of the studied objects (4), a stationary vertical (top-down) photography setup was used in this work, as shown in
Figure 1. The setup is based on a Canon EOS 4000D digital SLR camera (Canon Inc., Tokyo, Japan) (1), a tripod with a horizontal bar Benro SystemGo Plus (Benro Image Technology Industrial Co., Ltd., Tanzhou Town Zhongshan City, China) (2), and a solid blue background (3), placed on a flat surface. This type of configuration is widely used in the construction of computer vision systems, digital sorting of agricultural products, and preparation of training samples for subsequent analysis. The camera with an EF-S 18–55 mm f/3.5–5.6 III lens shoots with a resolution of 18 megapixels, using an APS-C CMOS matrix (22.3 mm × 14.9 mm). To minimize distortion and ensure high detail, shooting was performed at a focal length of 55 mm. The camera was fixed strictly vertically on a horizontal rod of the tripod using a ball head and a quick-change plate. The shooting mode was set to Manual, with manual focus (MF) on the central area of the object. The exposure parameters were selected experimentally: an ISO sensitivity of 100–200 units to reduce digital noise; a shutter speed from 1/60 to 1/125 s; and an aperture of f/8 to ensure uniform sharpness throughout the depth of the object. The white balance was set manually using gray cardboard or the preset “daylight” setting (Daylight, 5500 K). The photos were taken in RAW format (for subsequent processing and analysis) and also duplicated in JPEG for quick viewing. The tripod with a horizontal retractable rod allows the camera to be fixed strictly above the object, ensuring stability and repeatability of the conditions. The adjustable height and rotation mechanism allow precise adjustment of the distance between the lens and the shooting surface, which, in this case, was about 50 cm. The tripod is equipped with a built-in level, which is used to correct the horizontal position of the camera and prevent distortion of the frame. A plain blue A4 background made of matte paper that does not create glare was placed on the working surface. The choice of blue color is due to its high contrast with the color of the fruits and the lack of intersections in the color spectrum with objects, which contributes to more accurate segmentation and subsequent processing of the image. The exact center of the frame was occupied by the studied object—in this case, an apple fruit. Each fruit was positioned in the same orientation with symmetry control, which ensures standardization of the photographic material. The scene was illuminated using diffuse daylight or a pair of LED sources with a color temperature of 5500 K and a color rendering index (CRI) of over 90. The light panels were positioned symmetrically on both sides at an angle of 45° to the surface, ensuring uniform illumination and minimizing shadows. This approach improves the visual highlighting of object contours and increases the accuracy of the parameters extracted during digital processing.
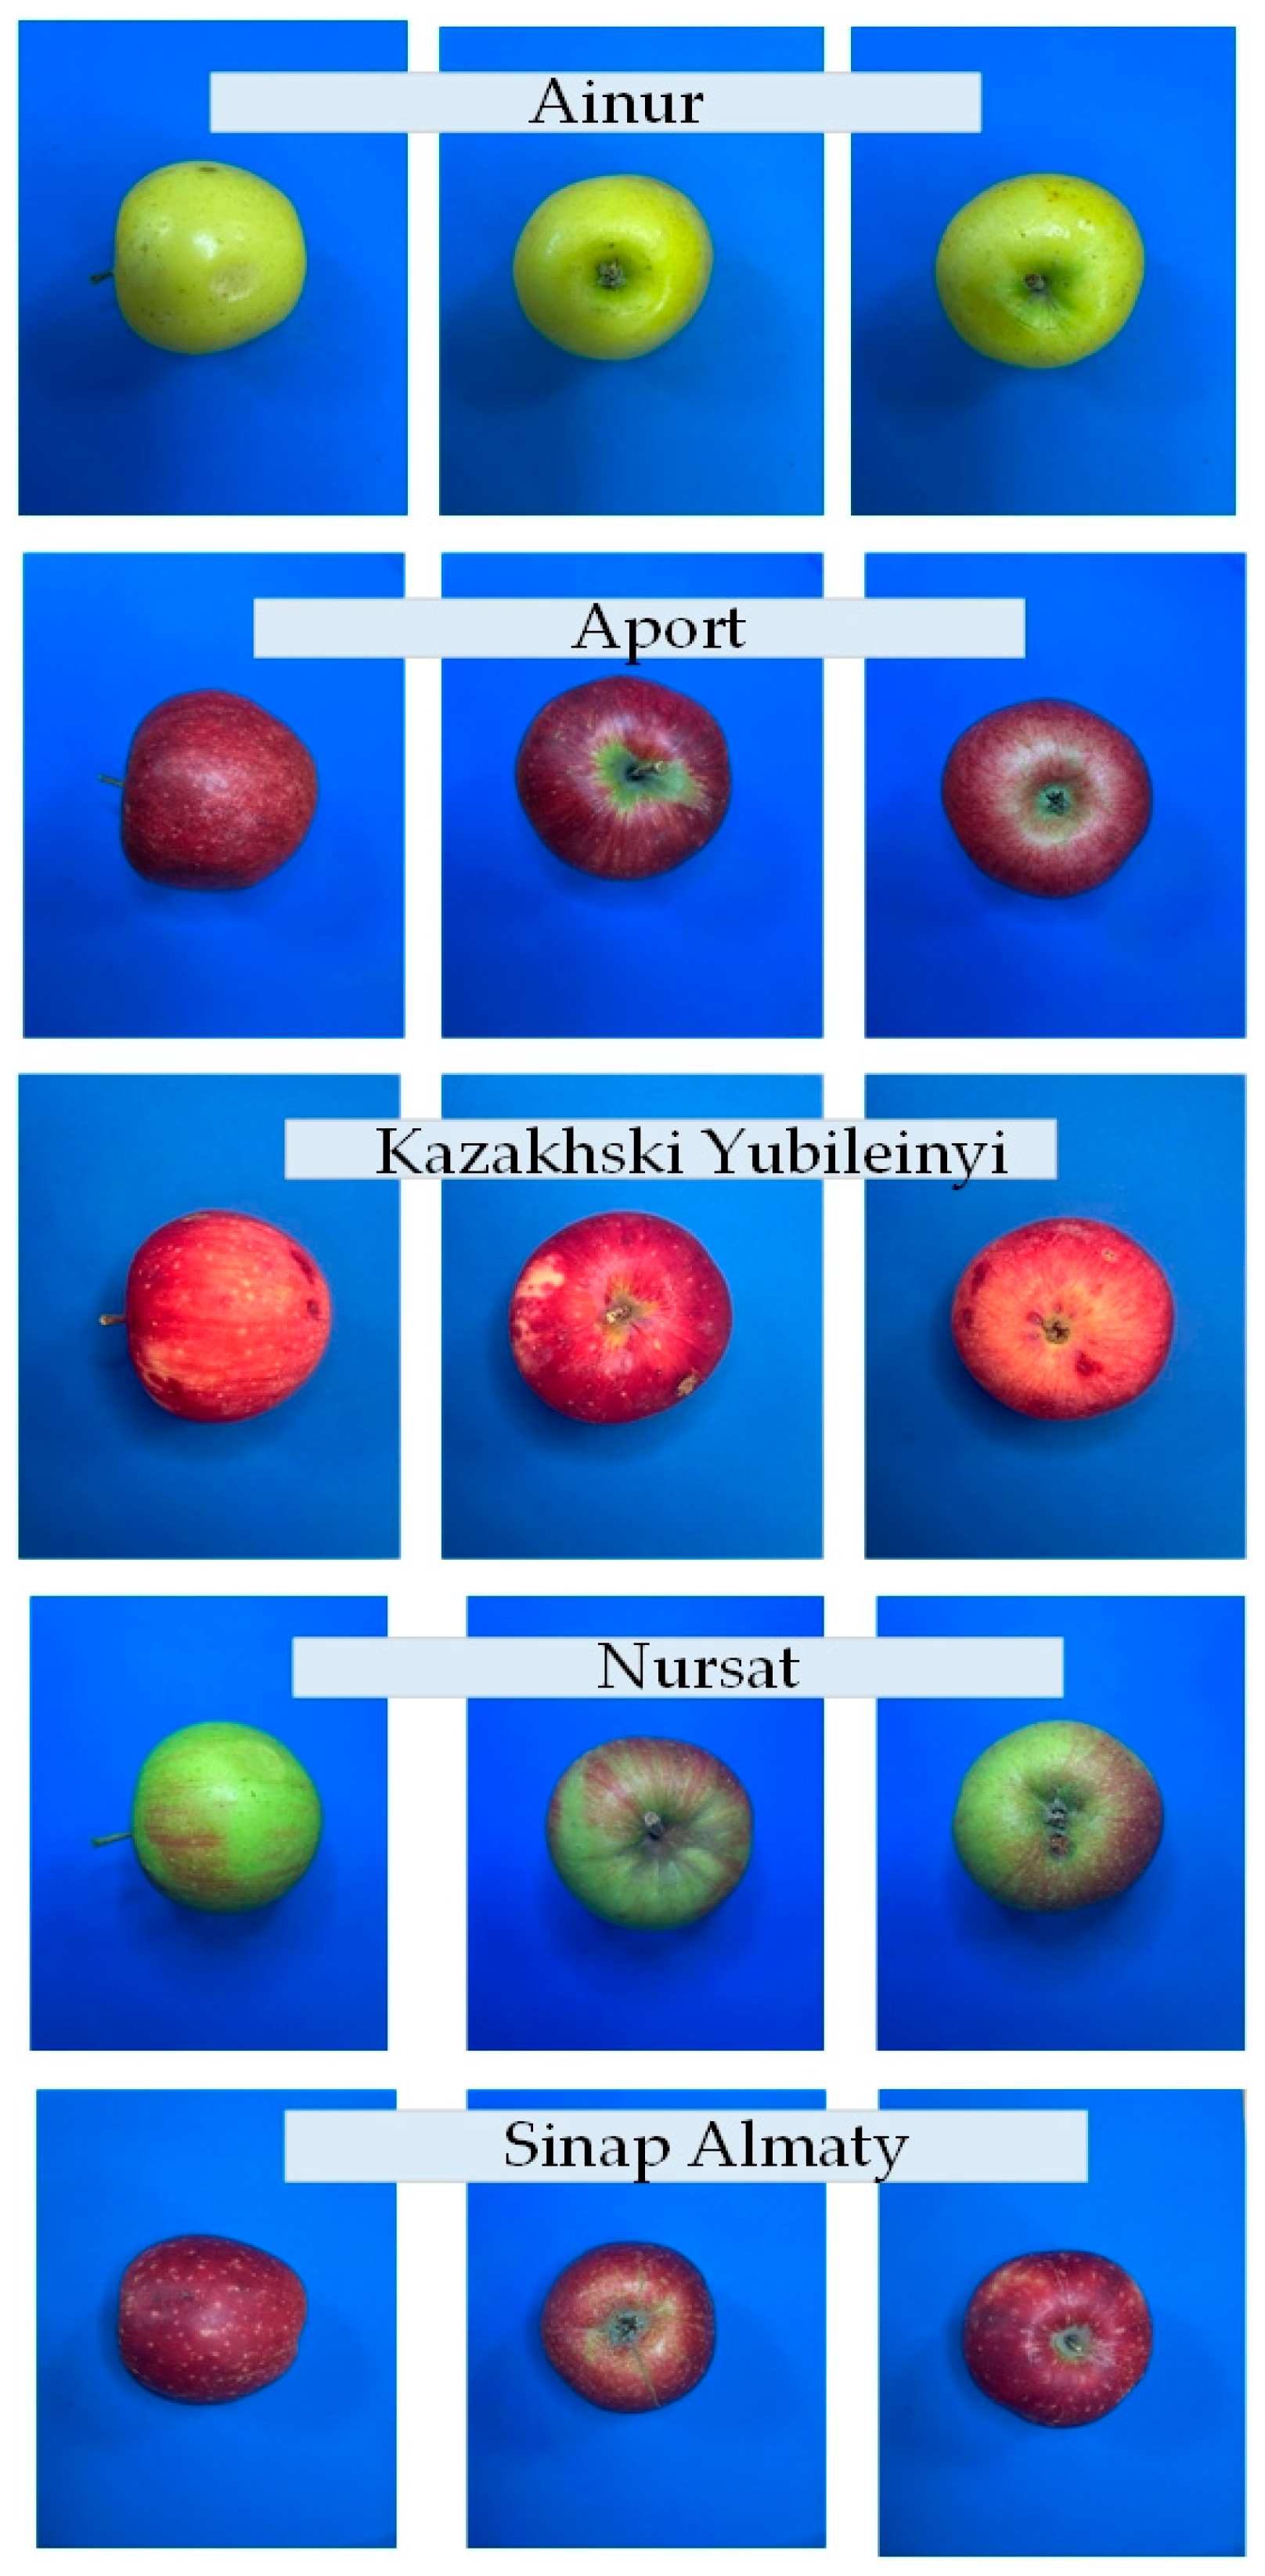
Each object was photographed serially. The camera was started with a two-second timer, which eliminates image blurring from pressing the button. After each frame, the photo was saved in the camera’s memory and subsequently transferred to the computer using a card reader. All images were marked with the date and sample number and saved in a separate directory for easier inspection and analysis. Each apple was photographed in 3 different positions, as shown in
Figure 2. The obtained images are in the RGB color space and have a resolution of 960 × 1280 pixels. The obtained images served as the basis for subsequent extraction of digital characteristics of the fruits. Image processing was performed using MATLAB software. Using the described setup allows for standardization of the shooting process and ensures high data reproducibility, which is especially important in the context of scientific research, development of algorithms for automatic sorting, and preparation of training samples for machine vision models.
2.2. Deep Learning Model Parameters and Training Setting for Identification
The use of convolutional neural networks (CNNs) and deep learning networks in particular is based on their current popularity as one of the most prominent research trends. Their considerable success is determined by many advantages—automatic detection of significant features; the weight sharing feature, which reduces the number of trainable network parameters; enhanced generalization; robustness against overfitting; and easier large-scale network implementation [
26]. The selection of an appropriate deep learning method was based on a review of studies conducted by other authors working on similar tasks [
21]. Employing a pre-trained model in cases where data samples are insufficient or lacking is very useful. This saves costly computational power and is time-saving, and a pre-trained model can also assist with network generalization and speed up the convergence. Model architecture is a critical factor in improving the performance of different applications. Pre-trained CNN models, e.g., SqueezeNet and GoogLeNet, have been trained on large datasets such as ImageNet for image recognition purposes, so they have considerable success and are suitable for the present task [
23].
SqueezeNet is based on AlexNet and has fewer parameters than GoogLeNet and similar performance accuracy. This is achieved by introducing the fire module that uses 1 × 1 filters instead of 3 × 3 and reducing the number of input channels to 3 × 3 filters by using the fire module that contains 1 × 1 filters that feed into an augmented layer with a mixture of 1 × 1 and 3 × 3 filters [
23,
27]. The input image size according to the requirements for SqeezeNet is 227 × 227.
GoogLeNet uses the Inception block technology, which integrates different convolutional algorithms and filter sizes into a single layer. This makes the model simpler, as the number of required computational parameters and processes is reduced, and shorter computational time is achieved. Compared to other CNN architectures that are available, such as AlexNet or VGG, this model has a significantly smaller total number of parameters [
22,
28]. The input image size for GoogLeNet is 224 × 224, and its architecture consists of 27 deep layers. This architecture is suitable for studying the task shown in this article.
In this study, two pre-trained CNNs, SqueezeNet and GoogLeNet, were fine-tuned and trained using a transfer learning approach in Matlab to identify different types of apple varieties. For the needs of this study, certain elements of SqueezeNet and GoogLeNet were modified to be able to recognize 5 classes of objects corresponding to the five varieties of apples.
In deep learning, the optimizer, also known as a solver, is an algorithm used to update the parameters (weights and biases) of the model. For training the network models, three different optimization algorithms were tested consecutively—Stochastic Gradient Descent with moment solver (Sgdm), the Adam optimization algorithm (Adam solver), and Root-Mean-Square Propagation (RMSprop)—and a comparison of network performance was achieved.
Gradient Descent can be considered the most popular among the class of optimizers in deep learning. SGD with heavy-ball momentum (SGDM) is a solver with a wide range of applications due to its simplicity and great generalization, having been applied in many machine learning tasks, and it is often applied with dynamic step sizes and momentum weights tuned in a stage-wise manner. This optimization algorithm uses calculus to consistently modify the values and achieve the local minimum [
29].
The Adam optimizer expands the classical stochastic gradient descent procedure by considering the second moment of the gradients. The procedure calculates the uncentered variance of the gradients without subtracting the mean.
Root-Mean-Square Propagation is an adaptive learning rate optimization algorithm used in training deep learning models. It is designed to address the limitations of basic gradient descent and other adaptive learning rate methods by adjusting the learning rate for each parameter based on the magnitude of recent gradients. This helps stabilize training and improve convergence speed, particularly in cases with non-stationary objectives or varying gradient magnitudes.
Other hyperparameters for training the convolutional neural networks (CNNs) in this study include Initial Learning Rates of 0.0001, 0.0002, 0.00025, 0.0003, 0.00035, 0.0004, and 0.0005 and a Learning Rate Drop Factor of 0.1.
The models were trained for 30 epochs, with a validation rate of 50. Proportions of 70% and 30% of all images from all apple varieties were divided into training and validation sets, respectively, with the input image sets shuffled in each epoch with training and validation. Additionally, the input image sets were randomly augmented using the functions of the MATLAB Deep Network Designer application—the images were rotated with a random angle from −90 to +90 degrees and scaled by a random factor from 1 to 2. Augmenting the input sets allows the trained networks to be invariant to distortions in the image data.
The output network was set to the best Validation Loss. Normalization of the input data was also included.
Retraining of the different CNNs was performed on a TREND Sonic computer running a Windows 11 Pro 64-bit operating system with the following specifications: CPU: 13th-generation Intel® Core™ i7-13700F/2.10 GHz; GPU: NVIDIA Ge-Force RTX 3070, 8 GB; memory: 64 GB. The implementation of transfer learning and the subsequent classification tasks included in this study were performed using MATLAB R2023b a (MathWorks, Natick, MA, USA). The transfer training of networks was performed using Deep Learning Toolbox. For further analysis, the Experiment Manager in Matlab was also used.
2.3. Evaluation Metrics
Currently, a wide range of metrics are used in classification tasks to evaluate the performance of CNN models, which allow for numerical evaluation of the performance of the models. A number of True Positives (TPs), True Negatives (TNs), False Positives (FPs), and False Negatives (FNs) are used to calculate the performance of the models. These cases represent the combinations of true and predicted classes in classification problems. A complex metric called the confusion matrix contains the total number of samples TP + TN + FP + FN for each class. For multi-class classification, the confusion matrix is (N × N), where each row is the actual class and each column is the predicted class. The confusion matrix allows specific metrics to be calculated such as Accuracy, Recall, and Precision. The confusion matrix results are classified as shown in
Table 1 [
29].
In this study, Accuracy, Precision, and Recall were used as the metrics for network performance evaluation, calculated by the following equations [
21]:
Accuracy is the relation between the number of correct predictions and the total number of predictions made, as calculated by Equation (1).
Precision measures the proportion of correct predictions made by the model, more precisely, the number of items correctly classified as positive out of the total number of items identified as positive. Mathematically, precision is represented in Equation (2).
Recall calculates the proportion of correctly identified cases as positive from a total of True Positives, as described in Equation (3).
In this study, the trained CNNs SqueezeNet and GoogLeNet were compared as a function of the metrics Accuracy, Precision, and Recall. Additionally, the influence of the Initial Learning Rate (ILR) parameter and the network-tuning algorithm was investigated.
2.4. Algorithm for Digital Identification of Different Types of Apples by Deep Learning Techniques
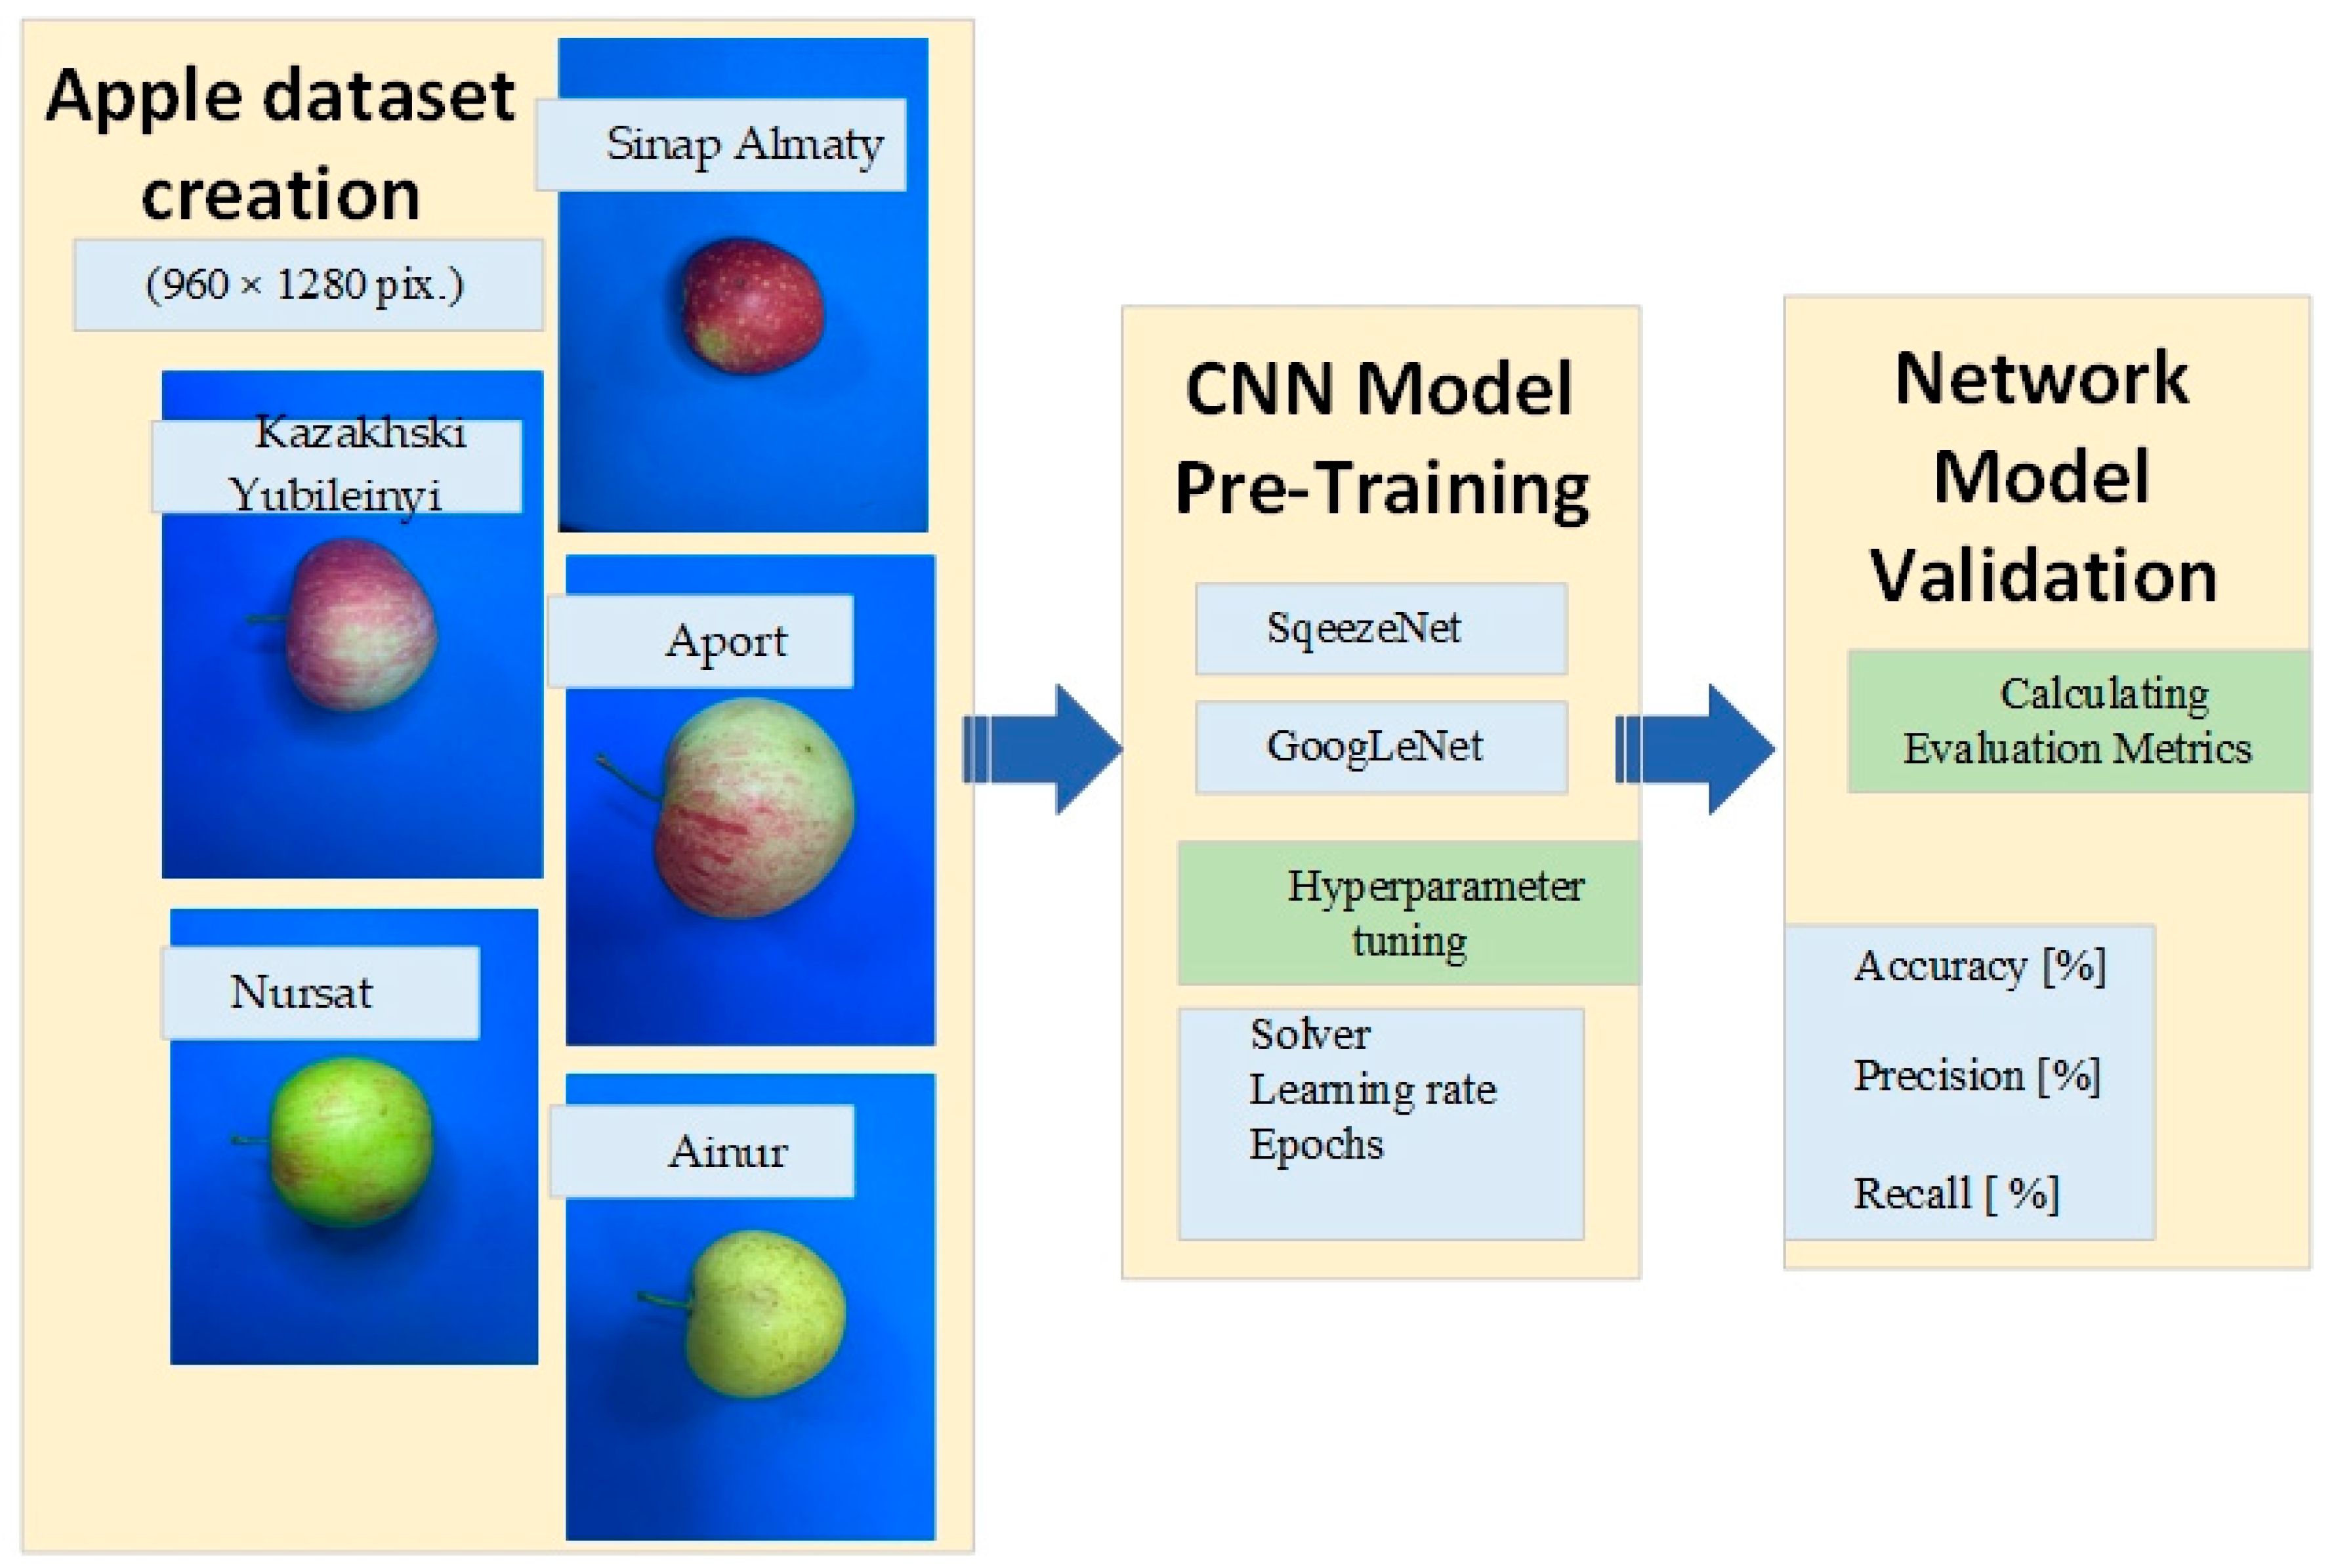
The data processing algorithm was developed and is shown in
Figure 3.
The basic procedure for creating a model for the digital identification of apple varieties is described in three stages (
Figure 3). First, a sensor based on standard CCD technology is used to capture color images of apples with a resolution of 960 × 1280 pixels. The next stage involves building a test sample of images for each variety and training two types of deep learning networks, with different settings of the optimization algorithm, solver, and Initial Learning Rate. The third stage involves evaluating the performance of the networks and selecting the most suitable model. This is performed on the basis of three basic metrics for network evaluation, Accuracy, Precision, and Recall, which are calculated when identifying the variety of images from validation samples.
3. Results
3.1. Network Performance Results
In this study, two pre-trained CNNs, SqueezeNet and GoogLeNet, were fine-tuned using different Initial Learning Rates (ILRs) of 0.0001, 0.0002, 0.00025, 0.0003, 0.00035, 0.0004, and 0.0005 and three network tuning algorithms: Stochastic Gradient Descent with moment solver (Sgdm), the Adam optimization algorithm (Adam), and Root-Mean-Square Propagation (RMSprop). The performance of the networks was evaluated by analyzing the values of Training Accuracy (TA), Training Loss (TL), Validation Accuracy (VA), Validation Loss (VL), and confusion matrix. The networks were trained in 1900 iterations and 30 epochs.
In the context of deep learning, Training Accuracy shows how well the model performs on the data it was trained on, indicating whether the model is learning patterns from the training set. Validation Accuracy shows how well the model generalizes to unseen data (the validation set), which is a more reliable indicator of whether the model is actually learning meaningful patterns rather than just memorizing (overfitting) the training data. Accuracy is a measure of classification performance, while the Loss function is a measure of optimization progress. The loss function values, e.g., cross-entropy loss, are dimensionless, usually between 0 and a few units. A perfect classifier would have a loss close to 0.
Table 2 shows the minimum, maximum, and average values for the indicators Training Accuracy, Training Loss, Validation Accuracy, and Validation Loss when training and validating SqueezeNet and GoogLeNet using the three solver algorithms—Sgdm, Adam, and RMSprop. When recognizing the five classes of objects corresponding to the five varieties of apples, a very high Training Accuracy was obtained for both tested networks. For SqueezeNet, Training Accuracy has values between 90.91% and 100% and Training Loss has values between 0.0002 and 0.1166. For GoogLeNet, the Training Accuracy is between 91.67% and 100% and Training Loss is between 0.0002 and 0.0240. It can be concluded that GoogLeNet gives slightly better results in its training, since it has fewer losses.
The obtained values for Validation Accuracy are also very high, over 90%, in the range of 90.33% to 97.00% for SqueezeNet and 91.33% to 98.00% for GoogLeNet. It can also be concluded from the results in
Table 2 that when using RMSprop solver for both studied networks, the obtained Validation Accuracy is sufficiently high, with the smallest Validation Loss.
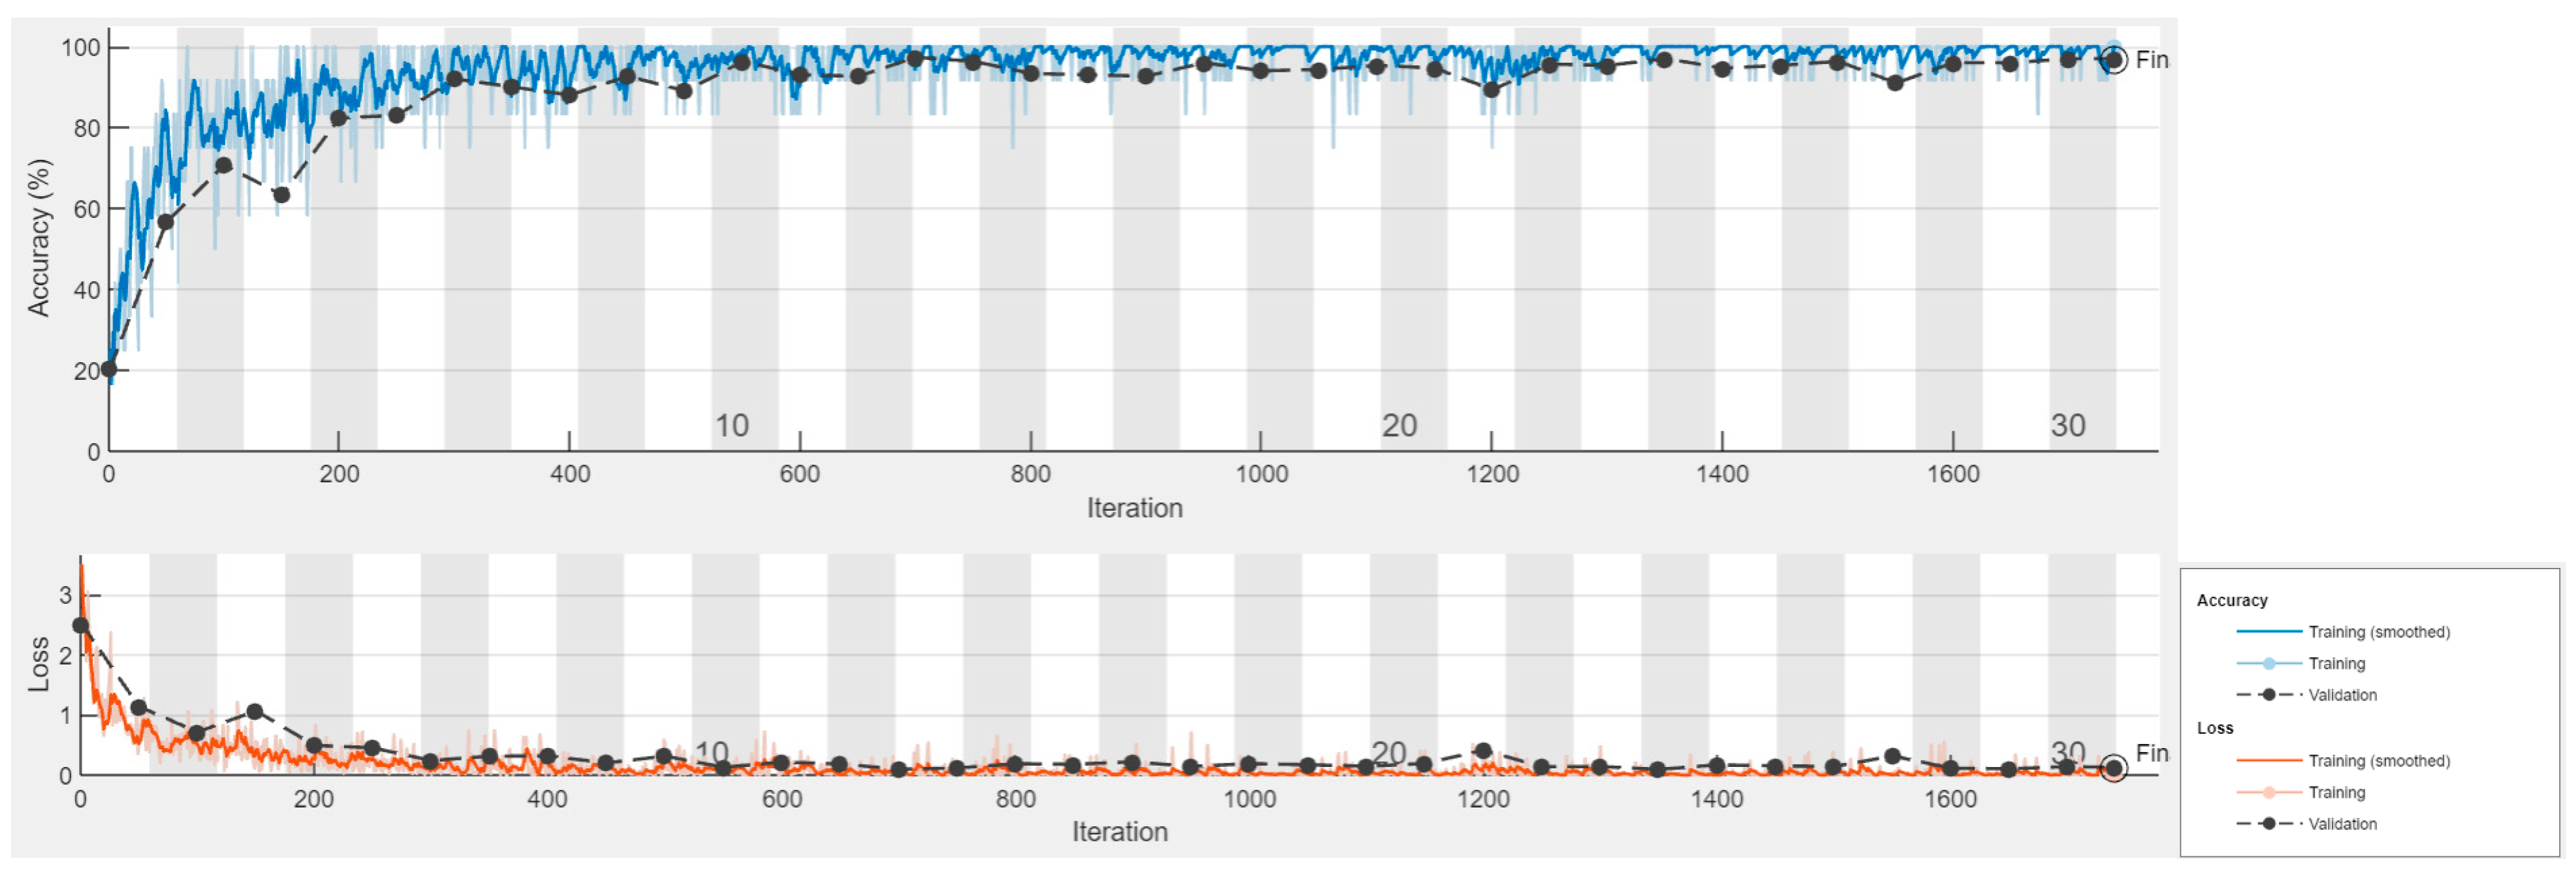
Figure 4 shows the training plots for SqueezeNet with solver Sgdm at an average change in ILR of 0.0003, and
Figure 5 shows the graph from the training of GoogLeNet with the same ILR settings. It can be seen that even after the 400th iteration, the Training Accuracy for both networks retains values above 80% and the graphs have stable convergence. From the results obtained, it can be concluded that after the 20th epoch, there are no significant changes in the accuracy and loss results, and 30 epochs of training and 1900 iterations are completely sufficient to properly train the networks to recognize the five apple varieties from the present study.
3.2. Network Parameter Comparison
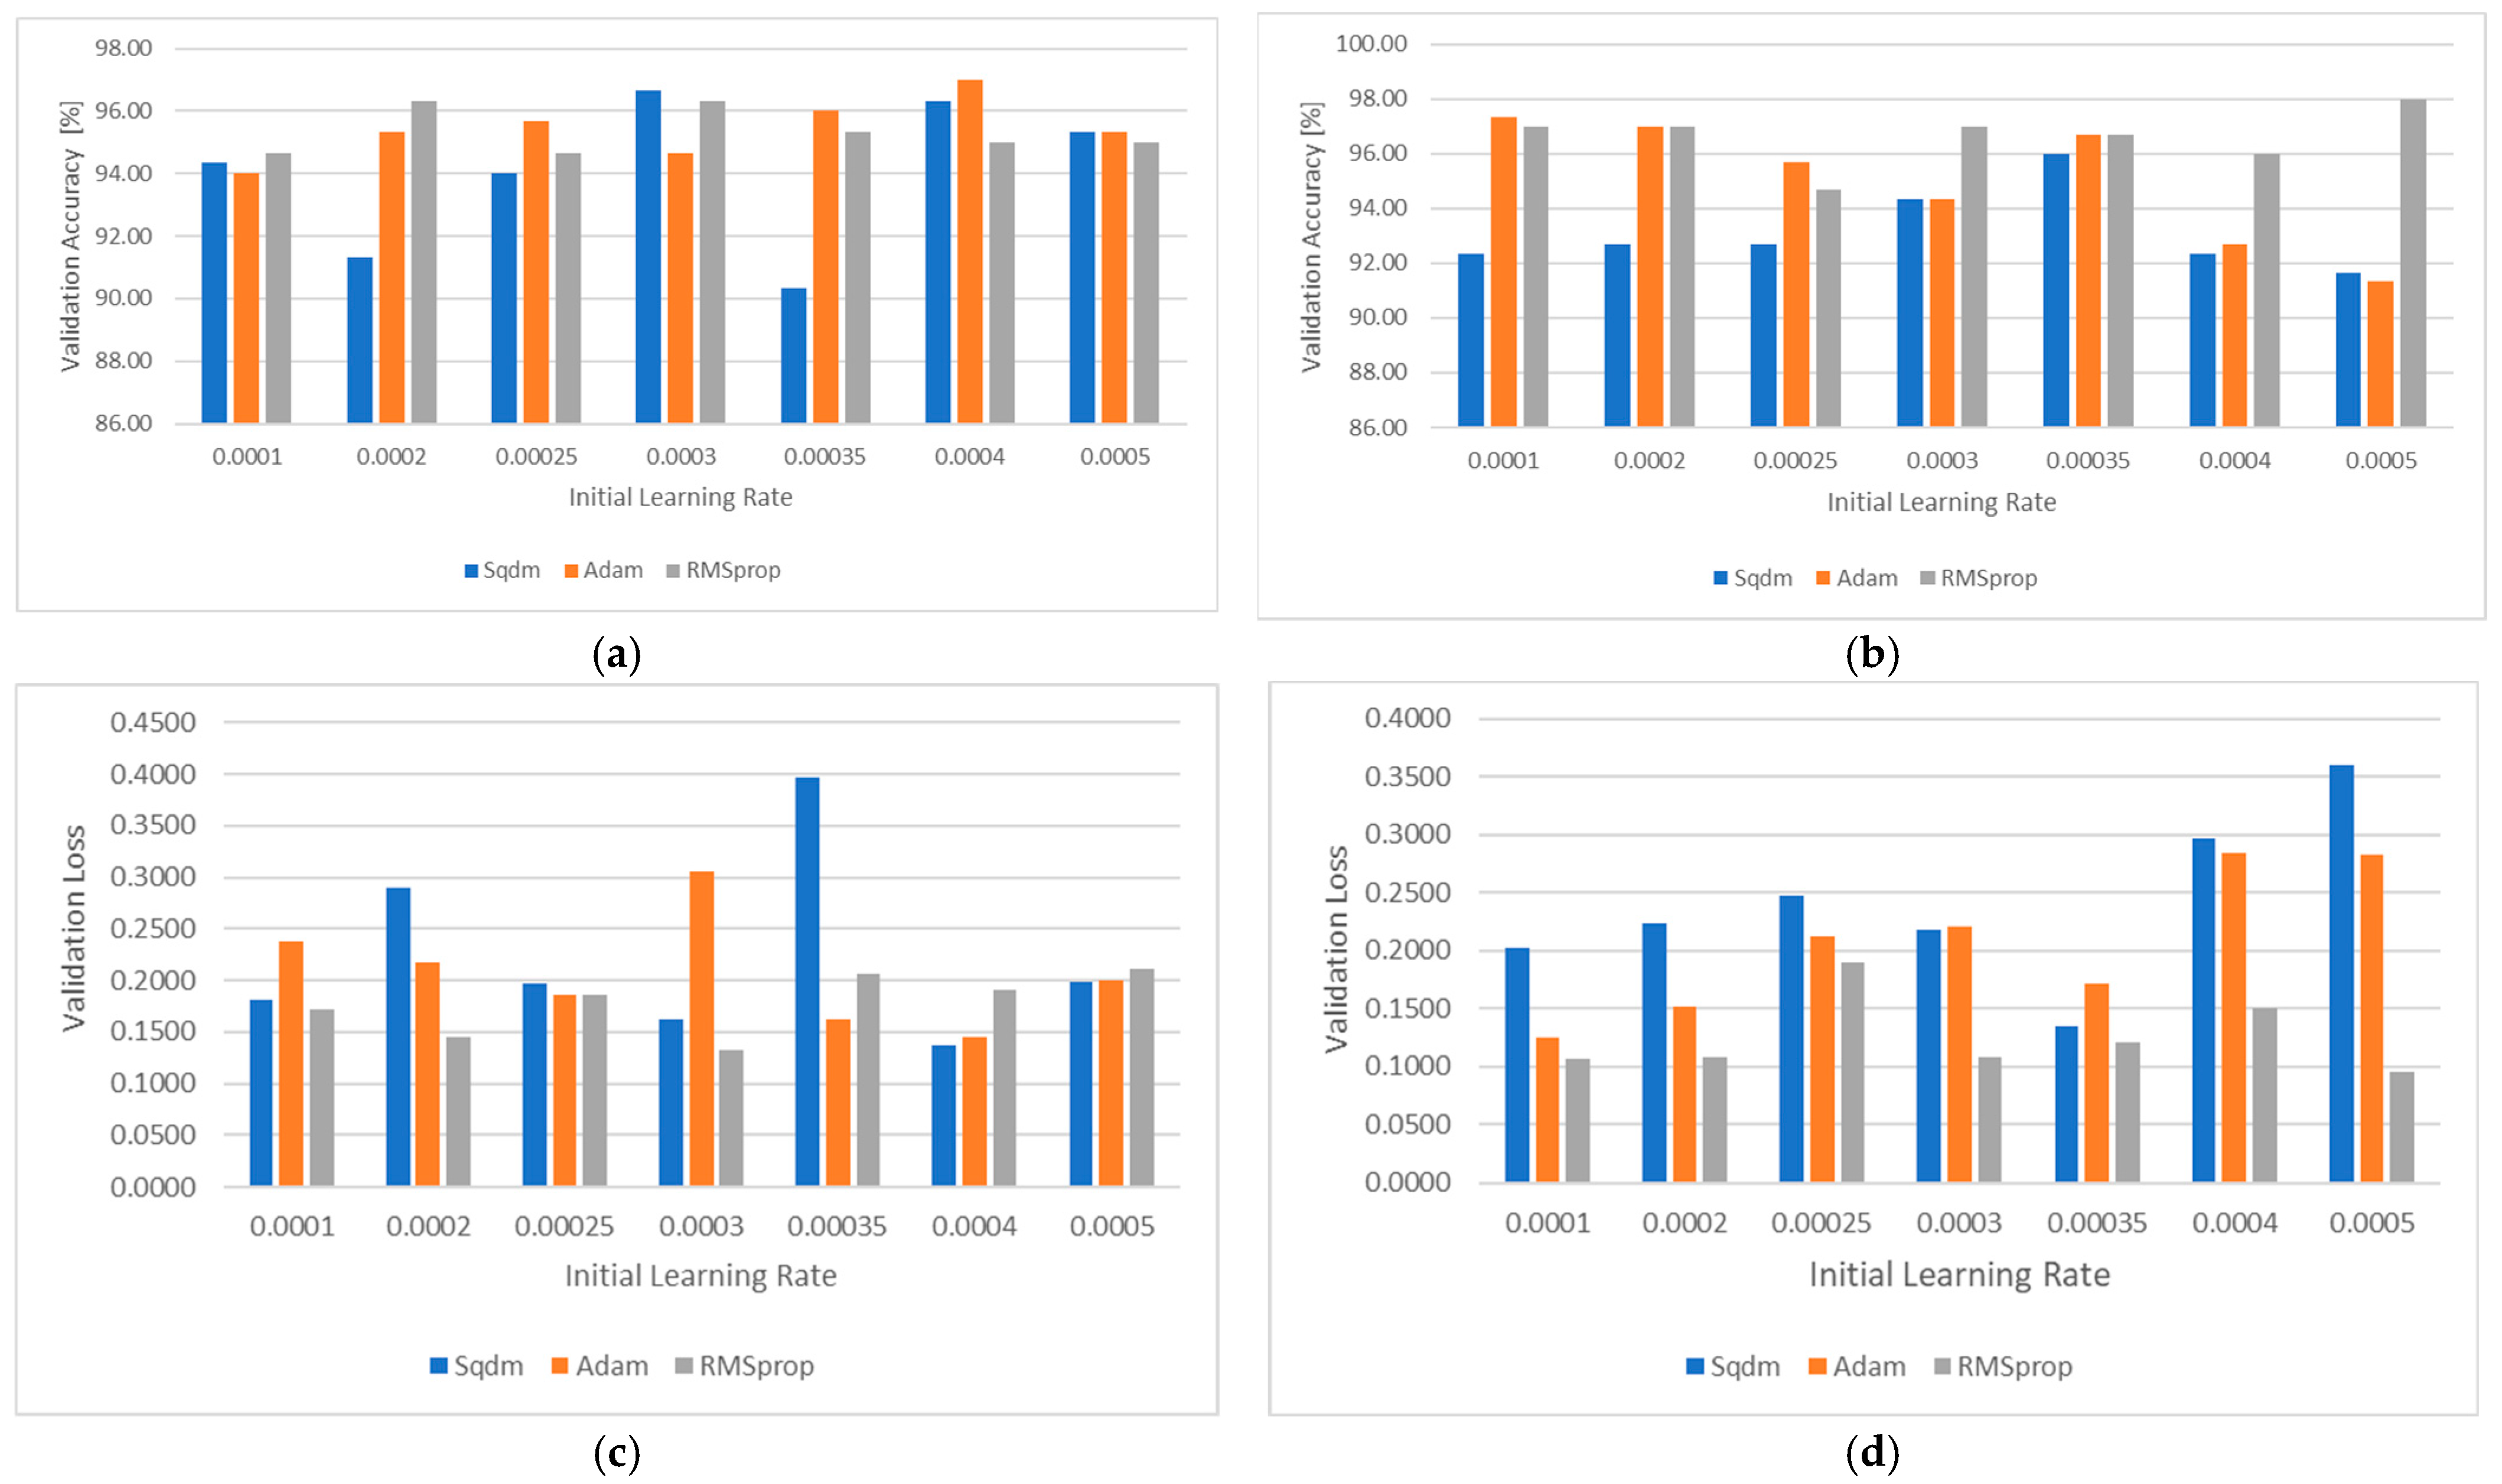
Figure 6 graphically shows the values of the Validation Accuracy [%] and Validation Loss parameters for SqueezeNet (
Figure 6a) and GoogLeNet (
Figure 6b) in more detail for each of the seven tested settings of the Initial Learning Rate parameter.
The obtained results show that Validation Accuracy varies from 90 to 98% for all values of the change in ILR for both networks. The results regarding Validation Loss range from 0.1 to 0.4 for both networks.
The Validation Accuracy for both algorithms Adam and RMSprop are similar, regardless of the values of the change in ILR for SqueezeNet, while for GoogLeNet, this is observed only for the RMSprop algorithm. Regarding Validation Loss, all three solver algorithms show a dependence on the values of Initial Learning Rate.
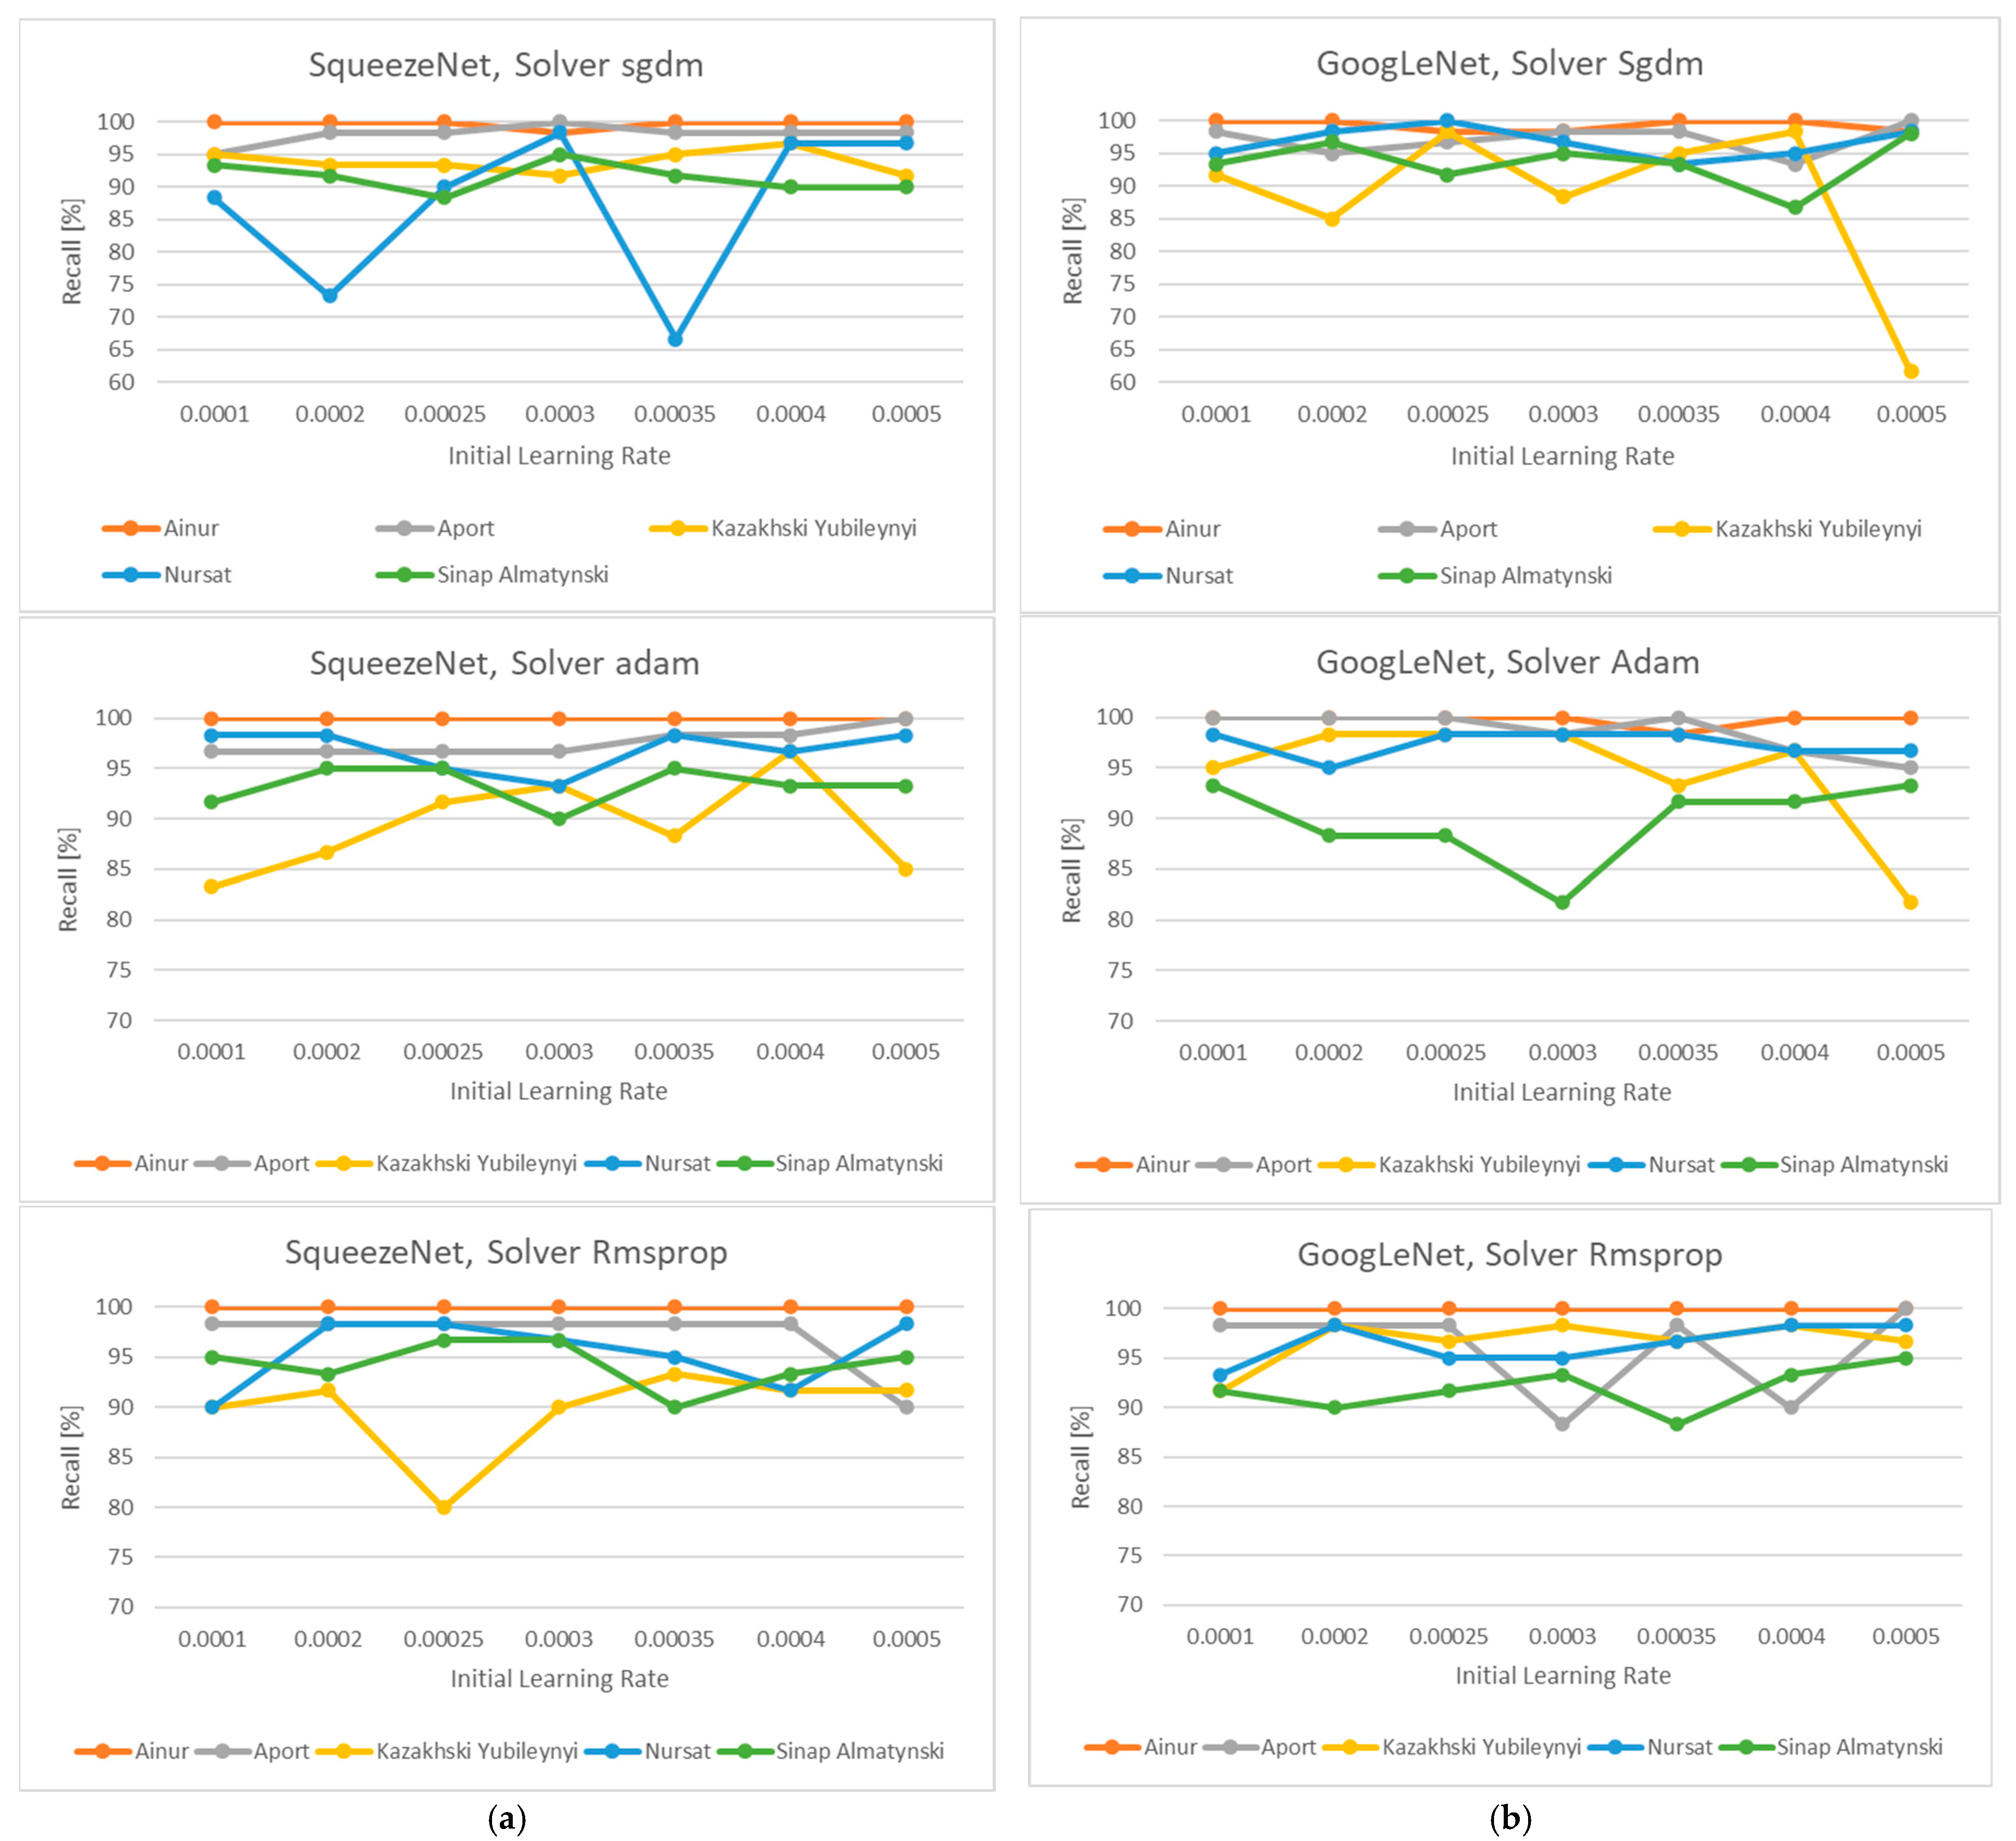
The figures below graphically show the values of the Recall [%] parameter for SqueezeNet (
Figure 7a) and GoogLeNet (
Figure 7b). According to the Recall indicator for SqueezeNet, the varieties Ainur and Aport are not sensitive to changes in the ILR. These two varieties are also not significantly affected by the SqueezeNet tuning algorithm. For GoogLeNet, Ainur, Aport, and Nursat are the varieties that are less sensitive to changes in the ILR, while Kazakhski Yubileyinyi and Sinap Almaty are affected to a greater extent by changes in the ILR. For GoogLeNet, the tuning algorithm has a slightly more pronounced effect on the Recall parameter values overall.
3.3. Performance Data of the Best Deep Learning Network Models for Classification of the Five Kazakhstan Apple Varieties
Table 3 systematizes the evaluation indicators Accuracy (%), Precision (%), and Recall (%) of the networks from the validation sample. These indicators are calculated based on the number of samples that are TP (True Positive), TN (True Negative), FP (False Positive), and FN (False Negative), which are part of the known confusion matrix for more than two classes of objects [
29]. When using Confusion matrices in tasks with more than two classes (multiple classes), the concept of “positive” and “negative” classes from binary classification is replaced by the multiple classes. In a multi-class confusion matrix, the results for the classified samples are interpreted in the following way: by the class to which each element is predicted to belong, by columns, and by rows depending on its true class. Thus, the diagonal elements contain those that were correctly classified (the predicted class coincides with the true class—True Positive), while the off-diagonal elements show the number of incorrectly classified elements. In a multi-class confusion matrix, it can be seen whether there are classes that are constantly confused with each other. In such a case, it would be advisable to train the network with additional samples from these classes in order to increase the overall accuracy.
Table 3 systematizes and shows the values of the evaluation indicators of SqueezeNet and GoogLeNet using the selected best Initial Learning Rate settings for the three solver algorithms. In terms of Accuracy, the values vary between 97.67% and 100%. The highest accuracy is for the Ainur variety, 100%, with GoogLeNet and the Adam and RMSprop solvers, and the lowest, 97.67%, is for the Sinap Almatynski variety, with GoogLeNet and the Sgdm solver. For the Precision indicator, the values range from 90.9 to 100%, with the highest values of 100% obtained for the Kazakhski Yubileyinyi variety, with four variants and settings of the two networks, and the lowest obtained for the Aport variety. For the Recall indicator, the highest values of 100% are obtained for the Ainur variety with five variants and settings of the networks, and the lowest is obtained for the Kazakhski Yubileyinu variety. In general, higher accuracy is demonstrated when using GoogLeNet for all varieties.
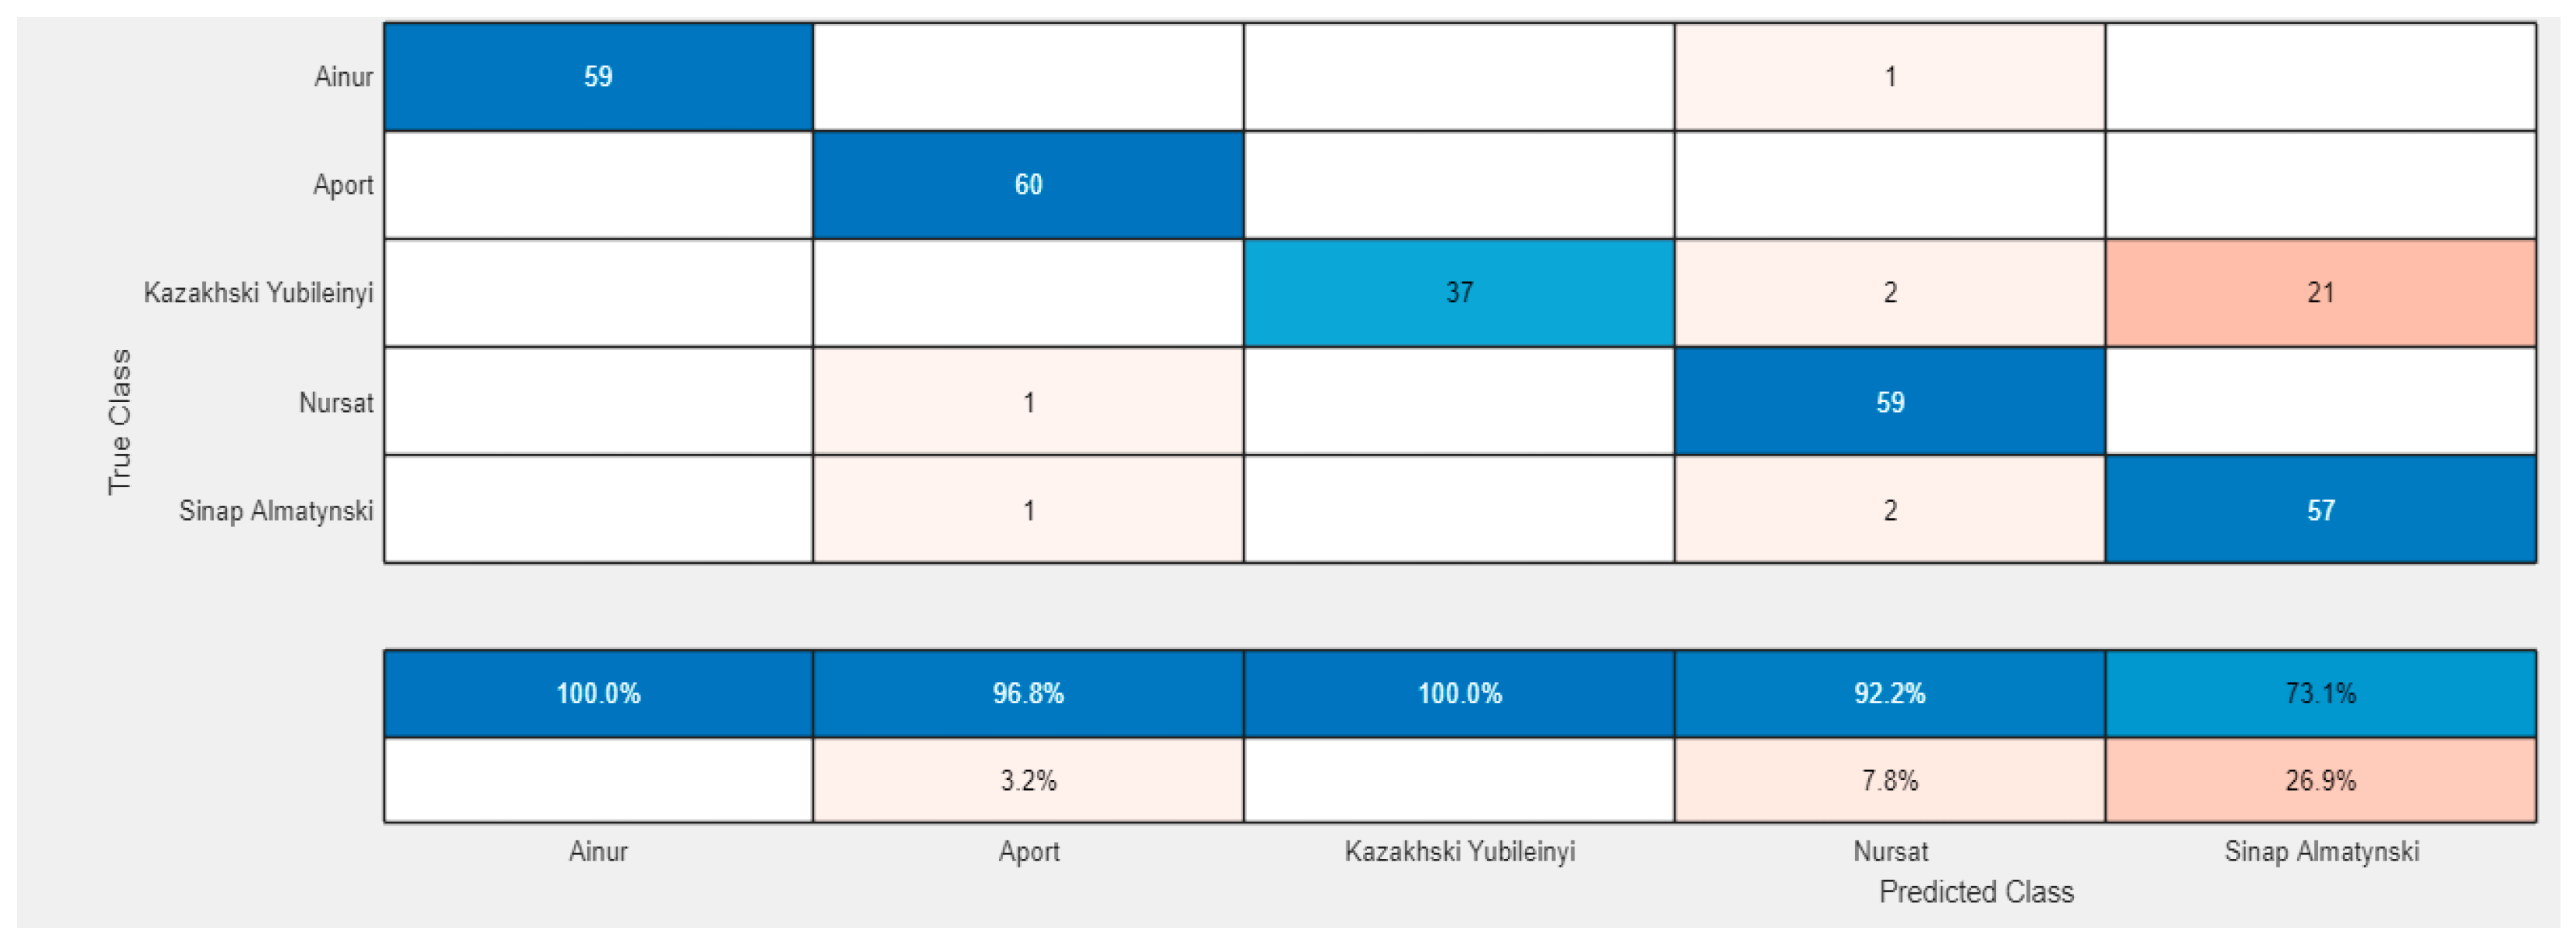
Figure 8 and
Figure 9 show Confusion matrices for the two networks, which obtained the best accuracy indicators for the validation samples, respectively, for SqueezeNet with solver Sgdm and ILR = 0.0003 (
Figure 8) and for GoogLeNet with the RMSprop optimization algorithm and ILR = 0.0005 (
Figure 9).
From the figures shown above, it can be seen that the most False Positive samples are recognized by the Aport variety, followed by the Sinap Almaty variety. The Ainur and Nursat varieties are distinguished well enough from the others, being recognized at 100%, with not a single incorrectly recognized sample with SqueezeNet, with solver Sgdm and ILR = 0.0003, while with GoogLeNet with the RMSprop optimization algorithm and ILR = 0.0005, 100% recognition is achieved by Ainur and Kazakhski Yubileynyi. The following figures,
Figure 10 and
Figure 11, show Confusion matrices for other networks, which obtained the lowest accuracy indicators of the validation samples.
Figure 10 shows the matrix for SqueezeNet, with solver Sgdm and ILR = 0.00035, where the Precision for two of the varieties—Ainur and Aport—does not exceed 80 and 83.1%, respectively.
In GoogLeNet with the Sgdm optimization algorithm and ILR = 0.0005 (
Figure 11), the low Validation Accuracy is mainly due to the poor recognition of the samples from the Sinap Almaty variety with only 73.10% Precision and from the Nursat variety with 92.20% Precision, while the recognition is good for the other three varieties. For GoogLeNet shown in
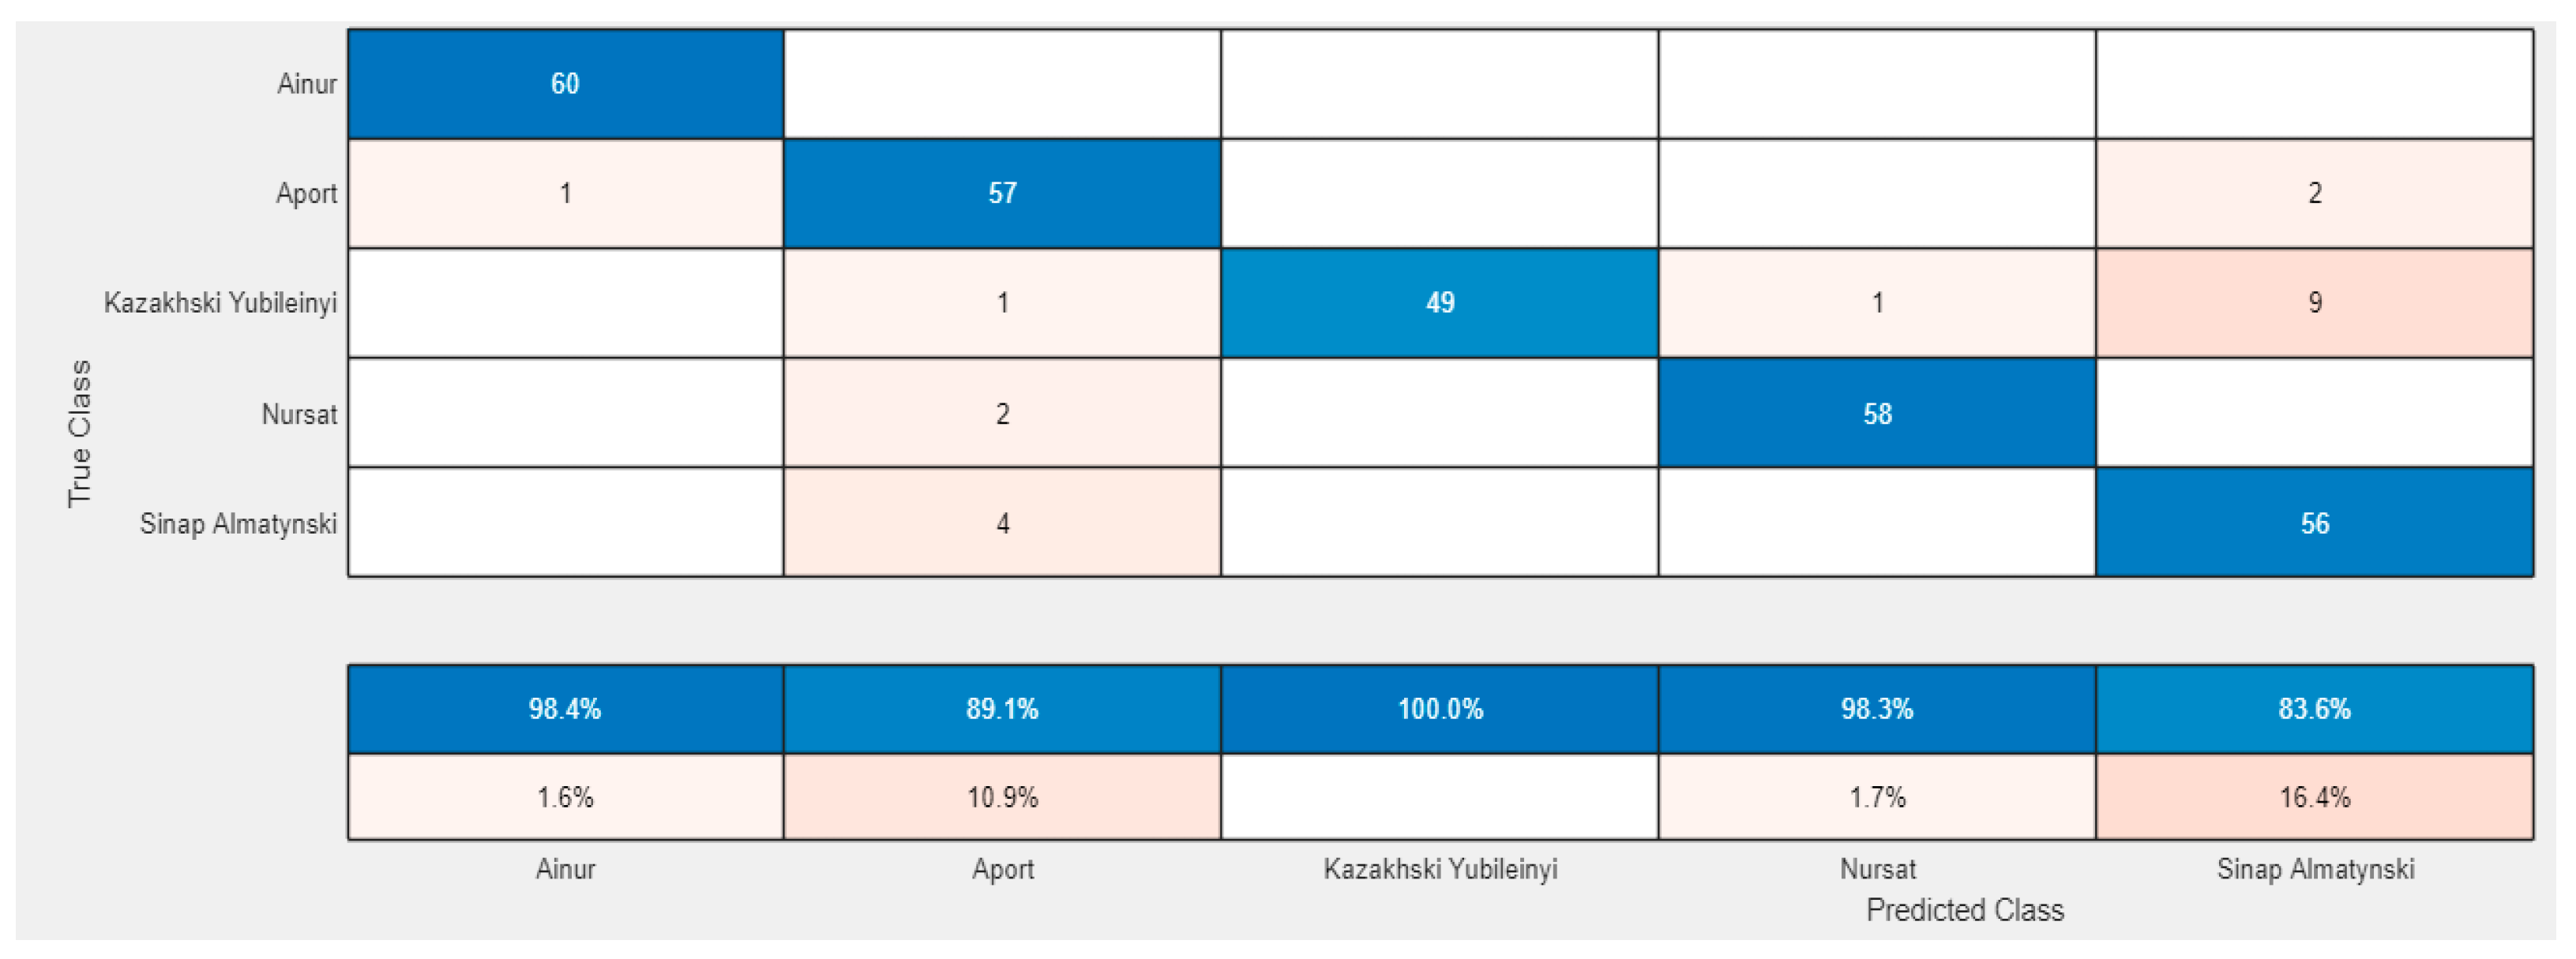
Figure 12, GoogLeNet with the Adam optimization algorithm, and ILR = 0.0005 (
Figure 12), the Precision for four of the varieties is reduced: 98.40%, 89.10%, 98.3%, and 83.6% for the Aynur, Aport, Nursat, and Sinap Almaty varieties, respectively.
4. Discussion
Performance data of the best deep learning network models for classification of the five Kazakhstan apple varieties, with the corresponding solver tuning algorithms and Initial Learning Rate values, are presented in
Table 4. The variety that showed the best recognition is the Aynur variety, obtaining values of 100% for Accuracy, Precision, and Recall. The remaining four varieties are also recognized with a very high accuracy of over 98.67%.
A review of the literature on the subject showed that no research has been reported on an algorithm for classifying apples into different varieties. In [
30], a detailed review of the research and applications of various deep learning neural networks for the recognition of targets such as apples, mainly under natural conditions, is made, with the recognition precision ranging from 85.7 to 97%.
The proposed approach for recognizing the varietal affiliation of apples using deep learning neural networks is suitable for the analyzed apple varieties and could be easily implemented and used under industrial conditions for sorting fruits. The achieved recognition accuracy meets the requirements in the field.
The practical contribution of the research is the potential integration of the developed method into industrial fruit-sorting systems, thereby increasing productivity, objectivity, and precision in post-harvest processing. The main limitation of this study is the relatively small dataset and the use of controlled laboratory image acquisition conditions. Future research will focus on expanding the dataset, testing the models under real production environments, and exploring more advanced deep learning architectures to further improve recognition performance.
5. Conclusions
Increased requirements for fruit quality and the growth of apple production in Kazakhstan require the use and implementation of new technologies in the classification of apples by varietal affiliation.
The analysis of the literature confirms that new deep learning techniques are precise, with high accuracy, and are increasingly used in the assessment of quality and classification of agricultural products.
The developed approach for the identification of five varieties of Kazakh apples using deep learning techniques achieved a 100% correct classification of fruits for the Ainur variety with GoogLeNet using solver RMSprop and ILR = 0.0005. For the varieties Aport, Kazakhski Yubileinyi, and Nursat, one of the three network evaluation indicators achieved 100% accuracy, and for Sinap Almatynski, all three indicators had values equal to or above 95%. For varieties Ainur, Aport, Kazakhski Yubileinyi, and Sinap Almatynski (with the highest optimal accuracy values), GoogLeNet was the best, with the following settings: solver RMSprop and ILR = 0.0005. SqeezeNet was only suitable for variety Nursat, with the following settings: solver Sgdm and ILR = 0.0003.
The experimental studies showed that 30 training epochs and 1900 iterations are quite sufficient to properly train the networks for recognizing the five apple varieties from this study.
The proposed approach could be implemented in automated machines for sorting apples by variety, which will increase their productivity and process functionality.
The obtained additionally trained CNNs can successfully complement the methodology developed in [
25] for assessing the quality indicators of apples and serve as the basis for the development of a compact tool for assessing the quality and varietal affiliation of apples.
