Article

Productivity Modeling and Analysis of Mono- and Bifacial PV Panels Under Different Weather Conditions and Reflection Surfaces for Application in the Agriculture Sector

Faculty of Electrical Engineering, Technical University of Sofia, 1756 Sofia, Bulgaria
*
Author to whom correspondence should be addressed.
AgriEngineering 2025, 7(10), 319; https://doi.org/10.3390/agriengineering7100319
Submission received: 15 July 2025 / Revised: 17 September 2025 / Accepted: 18 September 2025 / Published: 24 September 2025

Abstract

The production of electricity from photovoltaics (PV) in the agricultural sector is expanding considerably, driven by ecological concerns and continuous technological development. Additionally, growing constraints on the use of arable land for PV energy production requires increased energy production per unit area of panels. Bifacial panels are one of the highest performing PV solutions currently available. The subject of this paper is the productivity modeling of mono- and bifacial PV panels. The aim is to develop a physically based model for PV productivity without the use of commercial software. For this purpose, Durisch’s model is modified and adapted for bifacial panels and the necessary empirical parameters are determined. The developed model was validated experimentally. A comparison of the performance of the front and rear side of a bifacial panel is presented. The influence of the type of reflective surface is also investigated. The productivity and efficiency of monocrystalline monofacial and bifacial panels are also compared. The experiments were carried out in real conditions typical of a temperate continental climate for the latitude of Sofia, Bulgaria under different meteorological conditions.

1. Introduction

Some of the most significant challenges humanity faces in the 21st century include climate change, environmental protection, ecological electricity production and access to it, the security of food supply and availability and access to water. The agricultural sector is affected by all these factors, and increasing production while taking into account the above issues is vital [1].
Renewable energy sources, with their low carbon footprint and proven distributed generation capability [2], are a logical choice for meeting electricity needs on farms. Photovoltaic technology has established itself as the preferred technology in the last decades. The exponential growth of installed PV capacity worldwide [3] is also driven by:
  • The decreasing levelized cost of energy (LCOE) of the PV installations [4];
  • The increasing efficiency of solar-to-electricity conversion technologies [5].
The ambition to reduce the areas of cultivated arable land occupied by PV [6] is counterbalanced by greater energy needs [7]. There are several options available for overcoming this problem:
  • Using agrivoltaics [8];
  • Increasing the efficiency of the photovoltaic generator.
In 1981/2. Goetzberger and Zastrow [9] introduced the idea of the dual use of land, with the so-called agriphotovoltaics or agrivoltaics. The term describes PV installed at the height of several meters over cultivated crops. Since then, photovoltaics have been integrated into different types of agricultural buildings, powering the needs of different consumers. Examples of such applications are: placement on greenhouses [10]; in dairy farms [11,12]; for product cooling and storage devices [13]; in poultry and animal husbandry [14]; for energy, food and irrigation [15], etc. The use of robots [16], information, communication and monitoring equipment, including drones [17], is also rapidly becoming common among consumers. It is important to emphasize that, among the many users of electricity in the agricultural sector, modern technological developments also require the inclusion of storage devices and charging stations.
Based on the widespread use of PV in agriculture, some authors have proposed an expansion of the meaning of the word agrivoltaic [15]. Without going into complex semantic considerations, this paper uses the term “agrivoltaics” for PVs installed over cultivated land, while the terms “photovoltaics” and “PV generators” are used for all other applications.
Among the PV technologies with increased efficiency, those that do not require complicated support structures (trackers, concentrators, etc.) with higher maintenance costs, have an advantage.
Considering the above, bifacial panels combine the advantages of both options. They can use classical designs but also harvest energy with their rear surface, which increases their efficiency. An additional advantage is their positioning at a certain height above the ground when used as agrivoltaics, due to the increased reflected solar irradiance incident on their rear surface. Furthermore, the study of Maniscalco et al. [18] shows that the use of bifacial panels has a positive impact on the environment, and the study of Jamil et al. [19] systematizes the benefits that are observed for different agricultural crops.
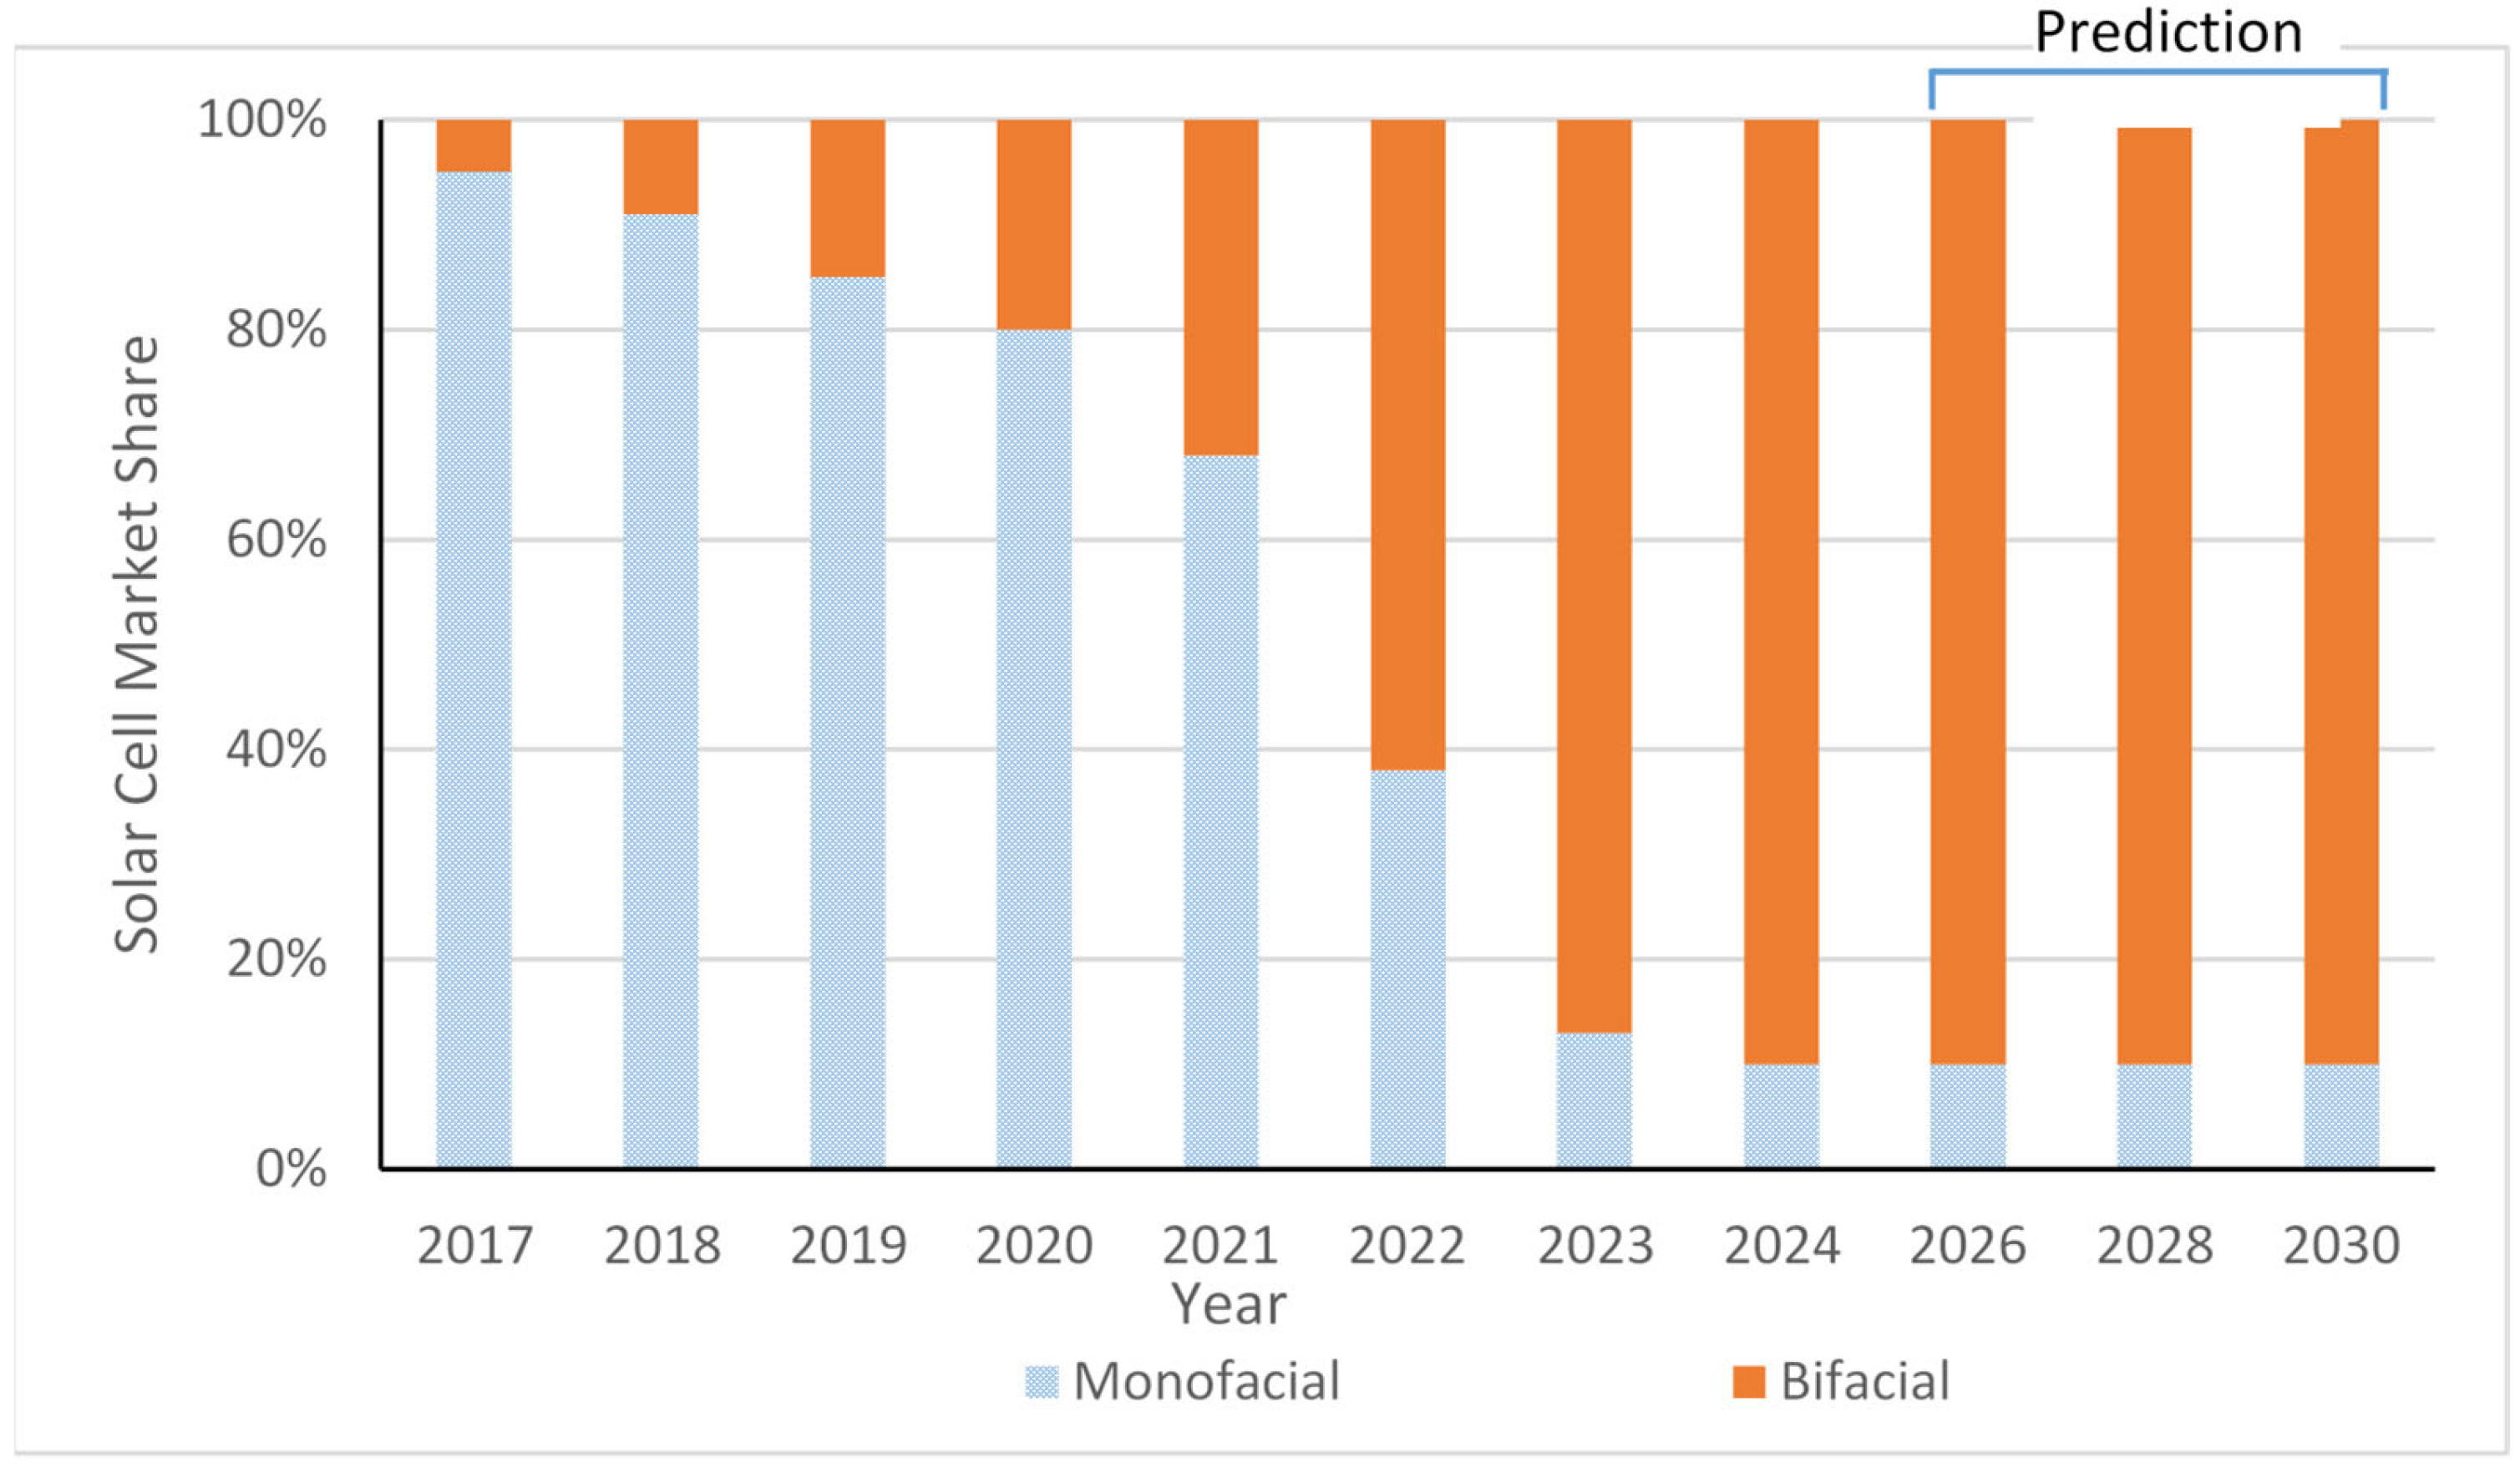
Although a relatively new technology, bifacial panels are attracting a lot of interest, with installations worldwide steadily increasing (Figure 1) [20]. Their market share has been growing compared to monofacial panels (Figure 2) [21], with an estimated 90% market share as early as 2024 [22].
A growing interest in bifacial panels has been observed not only by installers but also by renewable energy researchers, as confirmed by the increasing number of publications [18]. High-quality reviews of different aspects of the research and use of bifacial panels have been done by Kopecek et al. [23] and by Mouhib et al. [24]. The papers discuss different approaches to modeling solar irradiance used by the bifacial panels, their electrical production and their temperature, as well as the technologies used to produce these panels. Different applications of bifacial panels in agriculture, as well as on water surfaces are also shown. In [23], it is shown that the use of bifacial panels can increase the electricity yield by 30% and in some cases even 40%. The next part presents a brief overview of articles, thematically relevant to the present study.
Estimating the expected energy from bifacial panel installation is important for their owners because it provides information about the likely return on investment and possible risks. This information helps in obtaining loans from banking institutions [23]. Thus, the modeling of bifacial panels is extremely important and has been the subject of various studies, with different authors focusing on different aspects related to the performance of the panels.
Solar irradiance is the primary energy resource for PV panels in general. In the case of bifacial panels, there is also a need to determine the solar irradiance incident on the back of the panel, which makes the classical approaches for conversion of measured solar irradiance inapplicable. Patel et al. [25] present a decomposition of the horizontal irradiance into its components, then determine the irradiance from the back through geometric techniques. Using this decomposition, the authors of [25] propose optimal tilt angles of the panels for different latitudes. A similar approach is used by Riaz et al. [26] in their simulation study of bifacial panels in a vertical position with an east/west orientation and in a south orientation with a tilt of 40°. The object of their study is the influence of the panel density on the solar irradiance incident on the ground, and the received irradiance is compared with the needs of different agricultural crops. Cha et al. [27] apply geometrical techniques to determine the irradiance from the back using the solar irradiance from the front, estimated by astronomical equations and air mass without considering cloud cover. Other authors use off-the-shelf software such as Radiance [28,29] or pvlib-python [30]. The study of Asgharzadeh et al. [29] is interesting because it considers the influence of the panels’ inclinations, their heights relative to the ground, and the albedo on the energy yield. The main conclusions of the authors are that for larger systems the tilt of the panels should be greater, and that the influence of panels’ height on the energy yield decreases significantly after 1 m.
Modeling the output power of PV panels is a problem for which a solution was first proposed in 1981 [31] and which researchers continue to explore. A common approach for modeling output power of bifacial PV panels is to apply already established models for monofacial panels to bifacial ones. Abe et al. [32], for example, defined the panel efficiency, by adapting the Durisch’s model [33] for application to tracker-positioned bifacial panels and concentration panels, by using data from an experimental setup situated in the Renewable Energy Laboratory of the University of Corsica in Ajaccio, Corsica, France [32]. Mannino et al. [34] determine the required parameters of two models, specifying current and voltage at the point of maximum power using regression techniques in an experimental study of bifacial panels with southern orientation and an inclination of 37.5° in Catania, Italy. Bouchakour et al. [35] investigate analytical and empirical models, based on current and voltage, using real data from Terrassa, Spain. The study shows better behavior of the analytical model for bifacial panels, while the empirical one is more accurate for monofacial panels. One-diode and two-diode models are considered by Ahmed et al. [36], who use mathematical optimization to determine the required parameters. The study shows better performance of the two-diode model in the case of bifacial panels. Some authors use simpler models. For example, Yakubu et al. [37] apply the efficiency at Standard Test Conditions (STC) given by the manufacturers without considering the influence of temperature and irradiance on it. Another possibility is to use the deviation of solar irradiance from STC to determine the efficiency [27]. Deotti et al. [38] conducted an evaluation of fourteen PV efficiency and power calculation models across four PV technologies. Their analysis showed that Durisch’s model [33] consistently demonstrated the highest accuracy for all PV technologies.
The literature also features a number of papers that do not create models, but only use them, for example, through off-the-shelf software, to perform their simulation studies. Some of them were already referenced above while others will be discussed below. Li et al. [39] use different libraries (Ladybug, Honeybee, etc.) in a multiobjective optimization of an innovative vertical use of bifacial panels as canopies of an office building in Shenzhen, China. The optimization criteria considered are: minimum building power consumption from external sources, fastest return on investment and best building illumination. For all of them, the optimization results show significant improvements.
Ayadi et al. [40] used the System Advisor Model (SAM) software (version 2023.12.17) to compare 100 MW installations located in 6 deserts around the world. For each location, three installations with bifacial panels were considered: fixed-orientation, single-axis and dual-axis tracker. Three parameters are examined by the authors of [40]—the energy production, the performance ratio and the profit. Their results show that dual-axis installations have the highest energy production, fixed installations have the best performance ratio, and single-axis installations are the most profitable. The paper claims that photovoltaic panels have a beneficial impact on climate and land, which is an additional argument for the application of agrivoltaic conception.
Jacobsen et al. [41] investigated a more atypical application of bifacial panels in simulation—an east-west orientation with concentrating mirrors on both sides. Different trajectories of solar rays obtained with different space filling between the concentrators and the panel are considered.
PVsyst® is a very popular and high-quality software, which makes it applicable for simulation studies. For example, Cosgun et al. [42] compared installations of 1 MWp monofacial or bifacial panels deployed on the surface of a water basin, using version 7.3 of the software, and bifacial panels have a clear advantage over conventional panels. A considerably larger study has been carried out with the version 7.2. of the software by Zhang et al. [43], who analyzed the influence of different parameters on the energy yield and on the performance ratio when comparing monofacial and bifacial panels of identical dimensions. The influence of albedo, bifaciality factor, ground cover ratio, panels’ height, incidence angle modifier, temperature coefficient, series resistance, short circuit current and open circuit voltage was investigated. The results show relatively little influence of the parameters used, but provide guidance for possible optimization of the installation.
Another group of studies includes those in which simulation results are compared with experimental results. Lee et al. [44] present results from an experimental setup in South Korea with south-facing inclined bifacial panels and those with a vertical position with different azimuths, which are compared with a PVsyst simulation. The comparison shows non-negligible differences between experimental and simulation results. An interesting observation is that vertical panels can generate up to 89% of their rated power (in January). This percentage decreases with increasing sun height, with a minimum of 60.4% observed in July.
The paper of Santos de Araújo et al. [45] discusses different techniques with artificial intelligence to control trackers with bifacial panels. The proposed algorithm behaves very well in cloudy days as the resulting energy is almost 8% more than commercially available algorithms. Experimental data from trackers in northeastern Brazil are used for the comparison.
Perhaps the most extensive study in this group is that of Riedel-Lyngskær et al. [46]. Therein, the authors compared simulation results from eight software products: PVsyst (7.0.5), MoBiDiG Hybrid (RT), MoBiDiG VF (0.2.4), bifacialvf (0.1.7), PlantPredict (8.7.0), pvfactors (1.4.1), SAM (2020.2.29) and SolarFarmer (1.0.187.0), with results from their experimental setup in Roskilde, Denmark. The panels are mounted either on a fixed tilt or on a horizontal uniaxial tracker. Comparisons show that most software does not allow a good estimation of the irradiance from the back of the panel, but estimates the DC output of the installation very well.
In the last group of studies, we have summarized those that present only experimental results. This group is the largest, and we have discussed below only some of the available papers.
Zdyb and Sobczyński [47] present results from a 12.5 kWp installation in Rzeszów, Poland, comparing monocrystalline and polycrystalline monofacial panels and bifacial panels located on a flat roof with a bitumen coating. Different performance indicators of a photovoltaic system were used. For most, the bifacial panels have an advantage, while the polycrystalline panels have an advantage only in January and December.
A comparison of monofacial and bifacial panels has also been made by Pike et al. [48]. The real meteorological conditions of Alaska, USA were used, without additional reflective surfaces, but instead relying on land in summer and snow in winter. The panels used in the comparison have a south orientation and an inclination of 60°. In addition, there are two panels with a vertical positioning and orientation to the east and to the west. The results show that the bifacial panels offer 13–27% higher energy production.
An interesting study, with particular relevance to the application of PV arrays in agriculture, was performed in Ongjin-Gun, Republic of Korea [49]. Six fields of grapevines, 3 control and 3 with different technologies of PV panels were considered. The panels were placed on existing canopies to protect the plantations. Here, the comparison between technologies is not accurate due to their different orientations, but the usefulness of the paper lies in the study of the impact of the panels on yields. The results show that there is a delay in grape coloration for the vines under the panels, but the final result does not show deviation from the control fields—not only visually but also in terms of sugar content. The authors explain this by the fact that the temperature is higher under the panels, which is favorable and compensates for the lower illumination.
Studies of bifacial panels under real-world conditions in Korea have also been reported in [50,51]. The first paper considers three setups, two with south facing and 37° inclination and one vertical with east-west orientation. The main conclusions of their study are the 1.7% increase of energy produced when the reflecting surface area is doubled and the identified shading in the vertical installation. In the second paper, the bifacial installations are fixed south-facing with a 30° tilt and a single-axis tracker, and a comparison is made with similarly sited monofacial panels. The installations with the bifacial panels generate 10–20% more energy with a concrete reflective surface and 25–45% more energy with a white one. The studied tracker is only beneficial in summer due to its horizontal axis.
Mahmood et al. [52] investigated the benefits of using reflective TiO2 coating through an experiment in the real conditions of Taxila, Pakistan. The results show an increase in efficiency of about 3%, reaching up to 18.1% for the panels studied. An interesting finding is that small benefits (0.24%) are observed even for monofacial panels.
A comparison of monofacial and bifacial panels was also conducted in Milan, Italy [53]. A glossy reflective surface was used. With its help, the energy output was increased within 4.3–7.8%. This paper addresses the influence of the support structure in the case of bifacial panels. In the experimental setup, a classical support structure was used, which shades part of the cells from the back of the panel. The authors show that a small displacement of the cross bars can have a significant impact on the panel performance.
In their study, Bowersox and TamizhMani [54] consider the impact of different types of reflective surfaces mounted immediately behind the bifacial panel, using only the light penetrating between the panels for reflection. Their experimental setup is located in Phoenix, USA. In the case of matte reflective surfaces, 5% more energy is obtained than if there is no reflective surface, while in the case of glossy surfaces a 10% gain is obtained.
Carbone and Borrello [55] justify and investigate the use of bifacial panels mounted on a single-axis tracker as a shading structure for transparent rooftops. The main conclusion of the authors is that better results, considering energy production and shading, are obtained when using more densely spaced trackers, despite the possibility of mutual shading. This conclusion for energy production contradicts other researchers’ results for fixed structures.
Cabral et al. [56] replace the flat mirrors from the concentrator studied in [40] with a parabolic one. They use the Tonatiuh software (2.0) for solar analysis, but investigate the horizontal and vertical position of the concentrator at the solar laboratory at the University of Gävle, Sweden in real conditions. The results obtained confirm the feasibility of using this concept in real conditions.
Abdallah et al. [57] compare monocrystalline monofacial and bifacial panels under laboratory and real-world conditions in Doha, Qatar. The panels were located on a flat roof with gravel coating. The bifacial panels show better performance. The possibility of placing them vertically is highlighted, which reduces the need to clean the panels, which consequently reduces the cost of the system. A similar conclusion has been made in a study in Mumbai, India [58].
Laboratory testing of bifacial panels is reported in [59,60]. In the first paper, the variation of short circuit current, open circuit voltage, power, fill factor and efficiency at different ratios of front and rear irradiance are investigated. The second paper investigates 4 bifacial panels of different technologies with increased front irradiance, with double-sided panel illumination, and with frontal illumination combined with reflective surface on the back of the panel.
In light of the identified gaps in the literature—such as the limited availability of diverse and accessible models for evaluating the performance of bifacial PV panels, the insufficient comparative analysis of the impact of various reflective surfaces, and the lack of experimental studies conducted under real meteorological conditions specific to Southeast Europe—this study aims to contribute both methodologically and practically to the field. While many existing studies rely on commercial simulation tools or focus on specific aspects of bifacial panel behavior, there remains a need for a simplified, physically grounded model that can be applied without the use of proprietary software and still deliver reliable performance predictions.
To address this, the present work proposes a modified version of the original Durisch’s model [33], adapted to account for the dual-sided nature of bifacial panels by independently modeling the energy contributions of the front and rear surfaces. The model is designed to be both analytically tractable and experimentally verifiable, requiring only a limited set of empirical coefficients that can be derived from real-world measurements. The experimental validation is carried out using a dedicated photovoltaic research platform located in Sofia, Bulgaria, which provides a representative setting for temperate continental climates. The platform enables precise monitoring of panel performance under varying solar irradiance, temperature, and seasonal conditions.
Furthermore, the study systematically investigates the influence of four different reflective surfaces. By combining model development with experimental validation and practical performance evaluation, the study offers a comprehensive framework for assessing the feasibility and efficiency of mono- and bifacial PV systems in real-world agricultural applications.

2. Materials and Methods

2.1. Experimental Platform

This study uses results obtained from an Experimental Platform for Photovoltaic Research, located in the “Laboratory of Renewable Energy Sources—Electrical Aspects” at the Technical University of Sofia, Bulgaria (N 42°39′28.581″; E 23°21′12.678″). The installation site is characterized by a temperate continental climate. The photovoltaic system has a relatively small AC capacity of 3 kW, making it suitable for studying systems without densely arranged panel rows [47]. A block diagram of the PV system is shown in Figure 3.

2.1.1. PV Generator

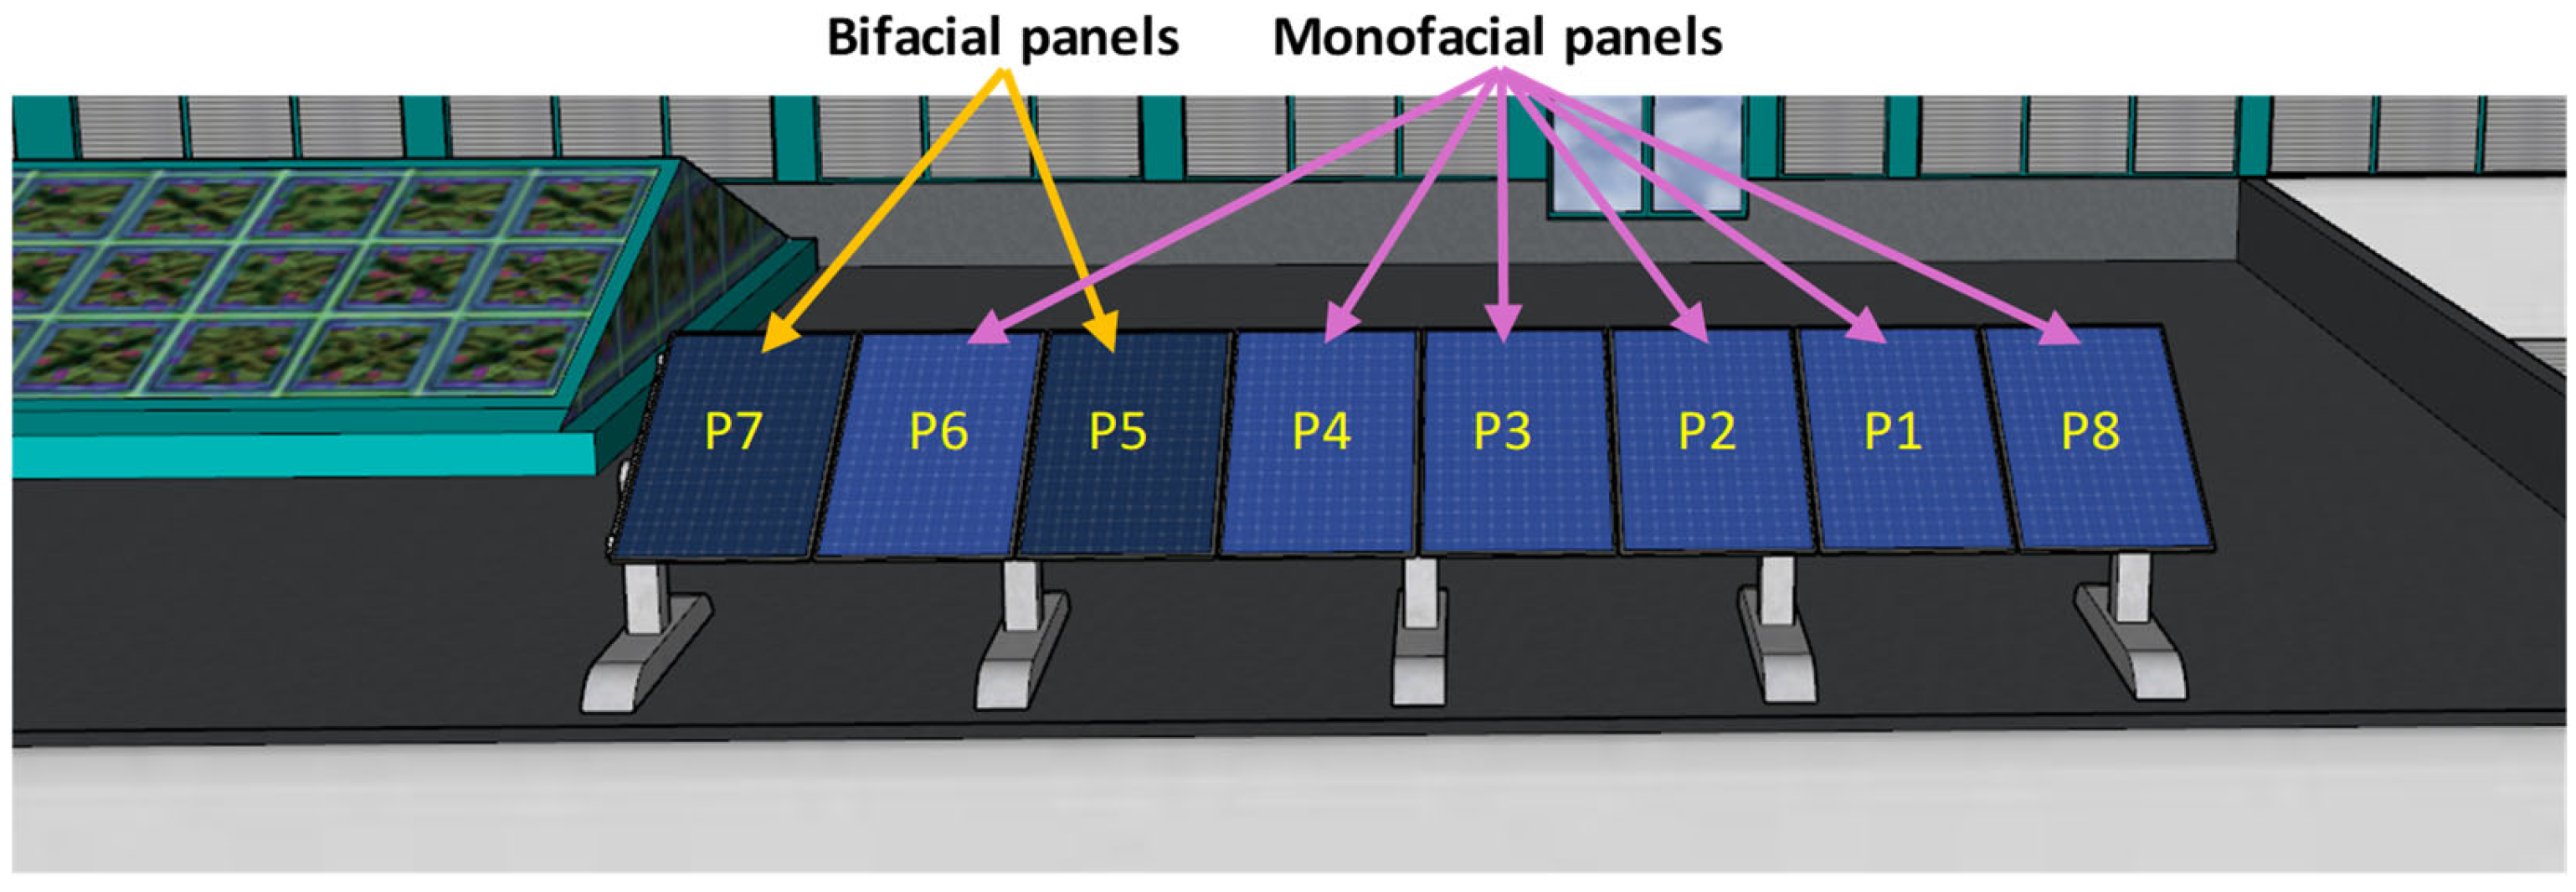
The installation consists of 8 panels—six of them are monofacial monocrystalline PERC panels OPTONICA FV410-A1 produced by OPTONICALED Co. Ltd., Guangzhou, China with a power rating of 410 Wp, and two are bifacial monocrystalline SMBB TopCon half-cut double glass panels SUNRISE SR-54M430NHLPro produced by Sunrise Energy Co. Ltd., Changzhou Jiangsu, China with a power rating of 430 Wp. Thus, the total installed capacity is 3.32 kWp. Some of the technical specifications of the panels used are summarized in Table 1.
The panels are south-facing with a tilt angle of 35°, which is optimal for the Sofia region. They are mounted on a specialized structure that allows for tilt adjustment and ensures no shading on the rear side of the bifacial panels. The panels are positioned 1 m above the ground, which is the threshold beyond which the impact of height on energy production decreases [30].
The two bifacial panels are located at the western end of the row, with a monofacial panel placed between them. A 3D visualization of the photovoltaic generator, viewed from the south, is presented in Figure 4.

2.1.2. Power Converters

Each panel in the PV system is connected to a DC optimizer (O on Figure 3), which is specifically designed to work with the inverter used, as shown in Figure 3. These DC-DC converters perform two functions: the first is to ensure maximum power point operation for each panel, and the second is to measure panel performance data, which is transmitted to the inverter.
Using technology with an individual optimizer for each panel and a single central inverter provides the following advantages:
  • The ability to use panels with different power ratings in one PV system, while ensuring practically independent operation of each panel at its maximum power point. In this case, it allows for the study of panel performance in various configurations—simultaneous operation of monofacial and bifacial panels; operation of bifacial panels using only the front side or only the rear side; operation with the rear side facing the sun and the front side shaded, etc.
  • The optimizers measure and record the electrical operating parameters of each individual panel. The data is transmitted to the inverter and then to a cloud-based storage system.
  • All panels operate under identical meteorological conditions, making comparisons between their performance accurate.
  • There is the possibility for quick repositioning of the panels, enabling efficient experimentation.
The optimizers used in the experimental platform are of type SolarEdge S500B produced by SolarEdge Technologies Inc., Herzliya, Israel with a rated power of 500 W, a maximum input current of 15 A, and a maximum output voltage of 80 V. The conversion efficiency of these optimizers reaches 99.5%, which allows losses during data processing to be considered negligible.
The DC to AC conversion is performed by a single-phase grid-tied inverter SolarEdge SE3000H produced by SolarEdge Technologies Inc., Herzliya, Israel with a rated output power of 3 kW, rated output voltage 220/230 VAC, maximum continuous output current 14 A, nominal input voltage 380 VDC, maximum input current 9 ADC and maximum efficiency of 99.2%. The advantage of this type of inverter is the absence of internal DC-DC conversion, which contributes to a maximum efficiency of 99.2%. Additionally, its compatibility with DC optimizers enables the collection of data from them.

2.1.3. Monitoring System

The monitoring system consists of two parts. The first collects meteorological data, and the second gathers electrical measurements from the system. The first part is based on the SMA Webbox datalogger and three solar radiation sensors SMA SensorBox produced by SMA Solar Technology AG, Niestetal, Germany, with accuracy of ±8% and a resolution of 1 W/m2. They have been calibrated using a PYRAsense LPS02M00 spectrally flat class B pyranometer produced by Senseca Italy Srl, Selvazzano Dentro, Italy, with measuring range 0–4000 W/m2, Spectral range (50%) 283–2800 nm, long-term instability < |±1|%, non-linearity < |±1|%, spectral error < |±0.5|%. The pyranometer is factory calibrated. For temperature measurements, compatible temperature sensors are connected to the SensorBoxes. The following parameters are measured with a 15 min time step and include:
  • Horizontal solar irradiance;
  • Solar irradiance on the front plane of the bifacial panels;
  • Solar irradiance on the rear plane of the bifacial panels;
  • Panel temperature;
  • Ambient temperature.
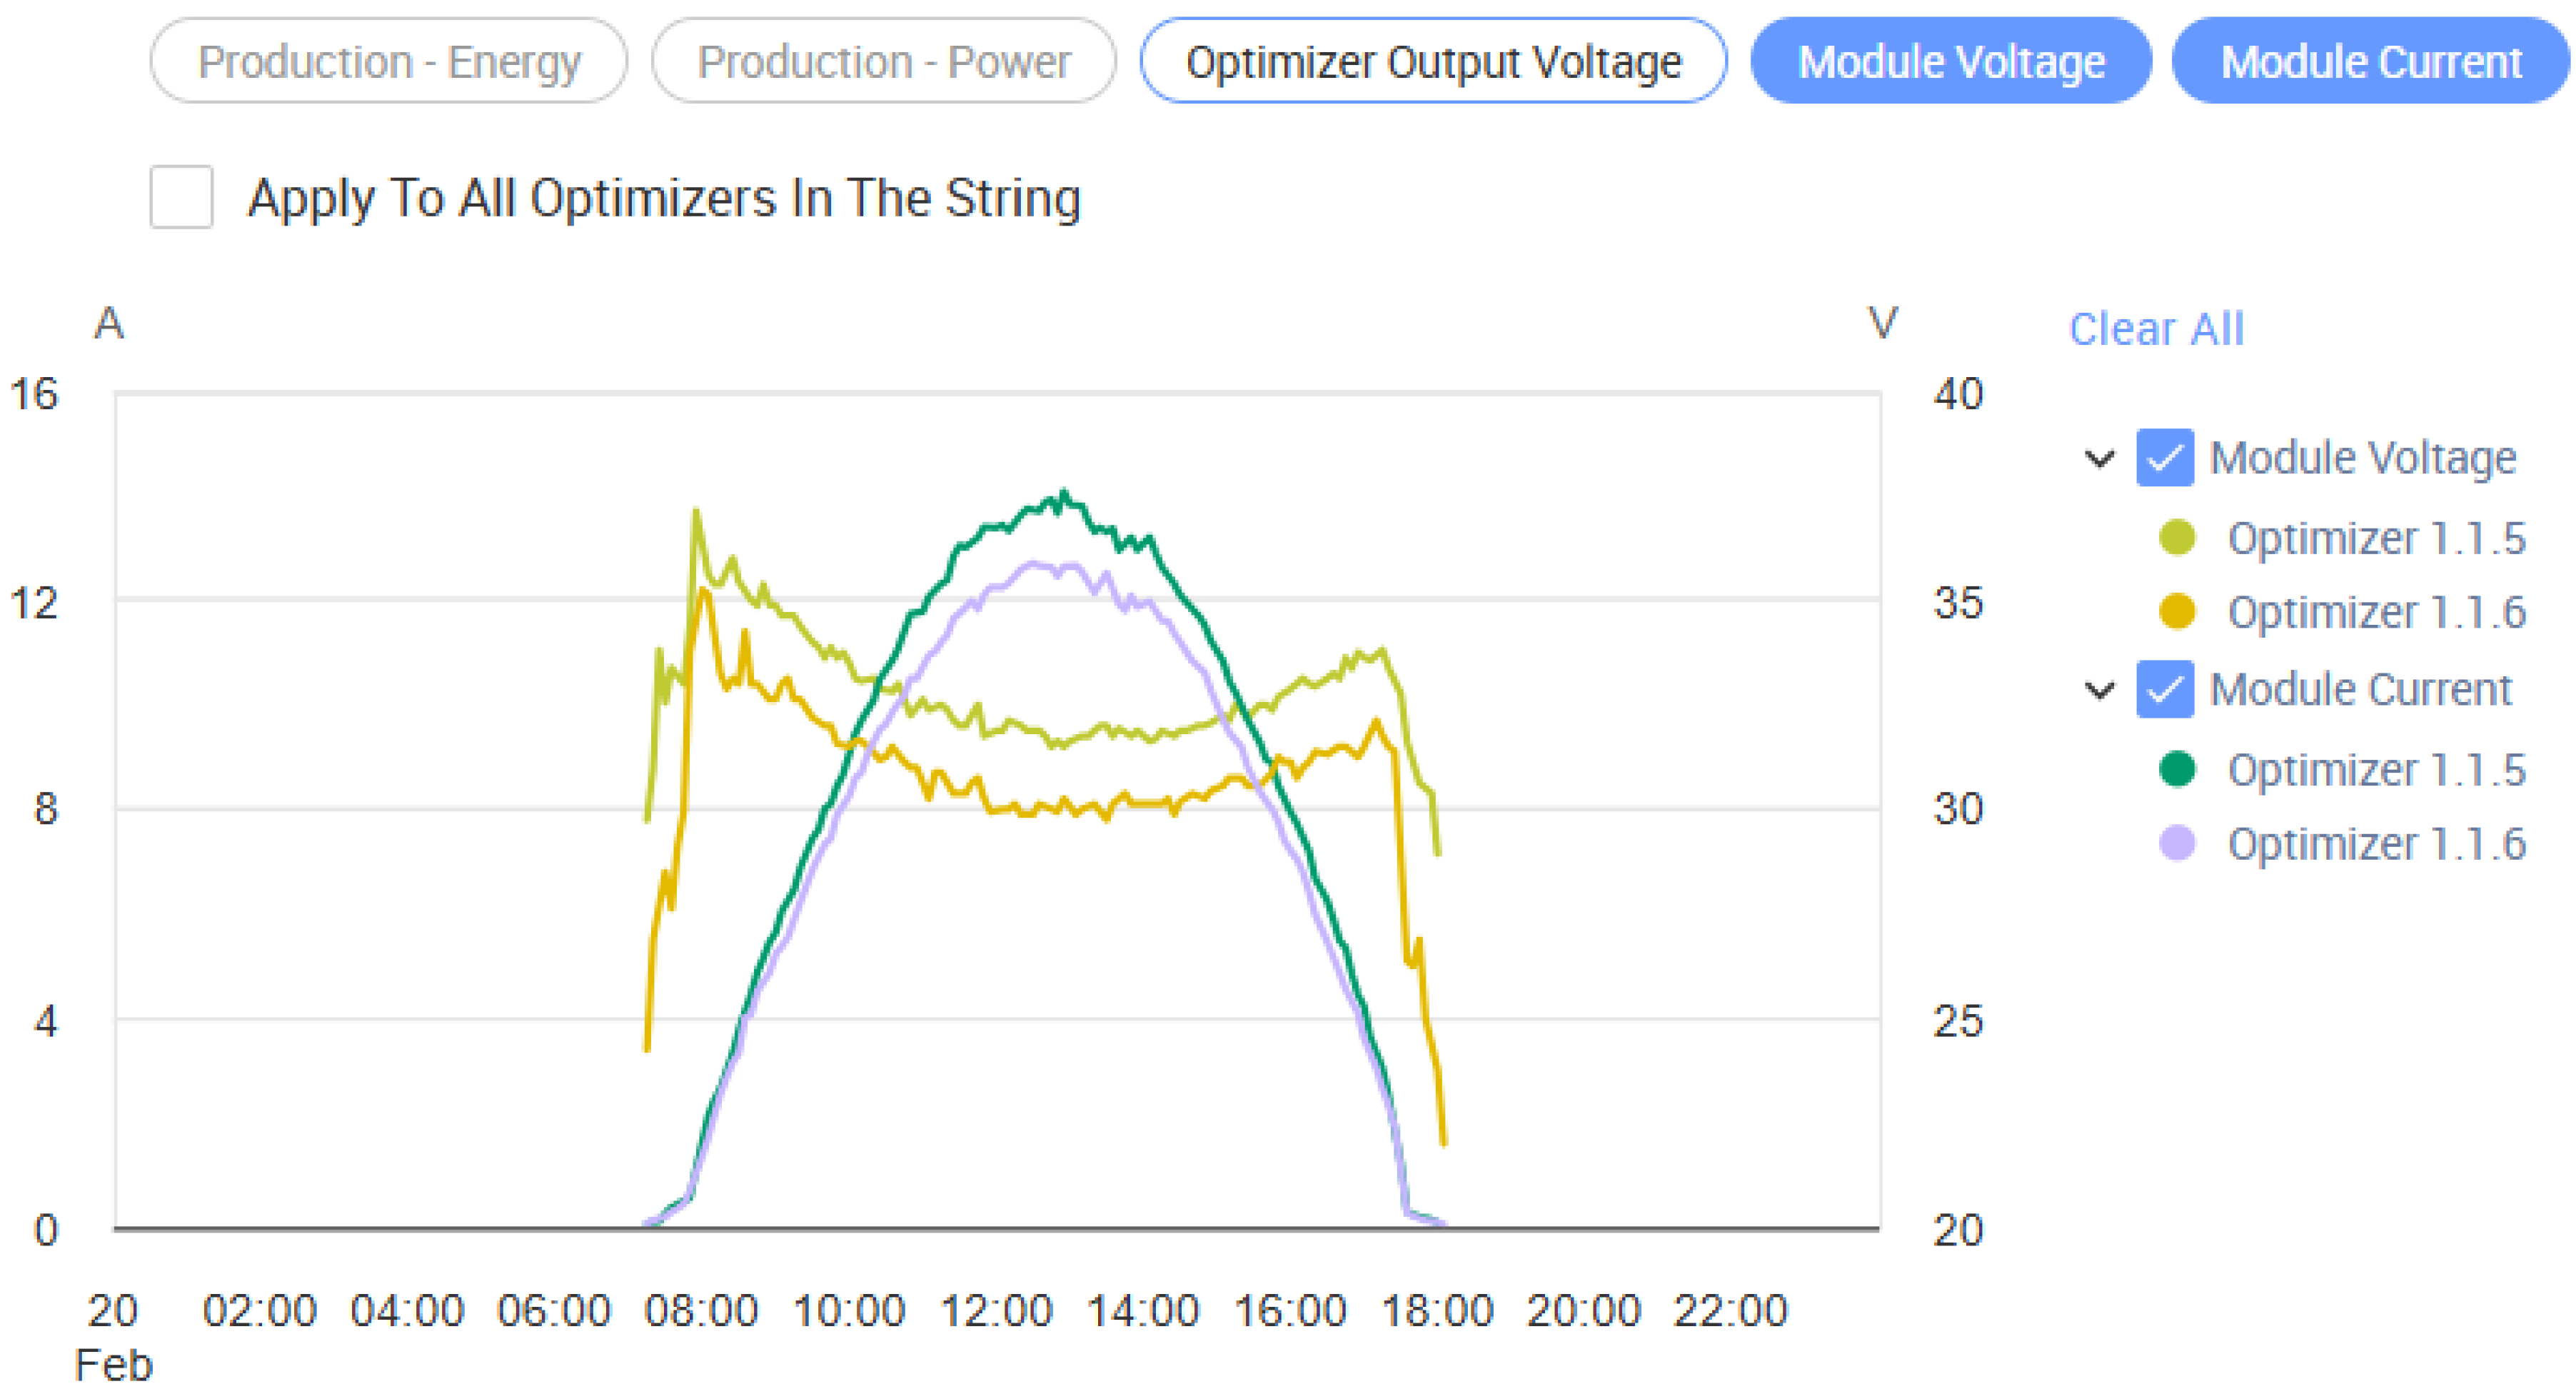
The second part of the monitoring system is handled by the inverter, which measures parameters on both the DC side and AC side, as well as collects data measured by the DC optimizers. The parameters measured by the optimizers include: panel voltage, panel current, optimizer power, and optimizer output voltage. According to the producer SolarEdge, direct measurements like voltage and current have a tolerance of ±2.5%, while derived values like power and energy, which are calculated from multiple direct measurements, have a tolerance of ±5%. This information is fully sufficient to monitor the performance of each panel under the given meteorological conditions.
The parameters are measured every 15 min and are transmitted via an internet connection to the manufacturer’s cloud, whose interface allows users to consult the archive of various electrical parameters—both for the entire system and for individual panels. The measured data can be exported in CSV format for further analysis. Figure 5 shows an example of data collected by optimizers and stored on the cloud.

2.1.4. Reflection Surfaces

In the experimental platform, four different reflective surface coverings were used beneath the bifacial panels to assess their impact on solar irradiance reflected onto the rear side of the panels, and consequently, on the amount of energy produced. The coverings are:
  • White nonwoven geotextile (WNG);
  • Green artificial grass (GAG);
  • Patinated sheet metal (PSM);
  • Shiny aluminum foil (SAF).
The nonwoven geotextile can be considered a simulation of a snow-covered surface, as well as an option where grass coverage beneath the panels is not desired. The artificial grass simulates a realistic low grass cover in terms of reflected solar irradiation. The remaining two coverings have characteristics close to reflective roofing materials and simulate the integration of panels into the built environment of a farm. Albedo properties of used reflective surfaces, found in the literature, are summarized in Table 2. In the present study the albedo of the reflective surface is not used in modeling. Table 2 is given only for information.
The different reflective characteristics of the four coverings were determined experimentally and are presented in the section with experimental results. Figure 6 shows a collage of photos of the experimental platform with the various surface coverings.

3. Productivity Modeling of Mono- and Bifacial PV Panels

3.1. Original Durisch’s Model for PV Panels Efficency

Based on the conclusions presented in the Introduction, the authors’ method determines panel efficiency ηPV, using Durisch’s model as the basis for further work. The original Durisch’s model enables the calculation of the efficiency of a given photovoltaic panel as a function of the solar irradiance in the plane of the panel, the cell temperature and air mass:
η P V = p × q × G a G a r e f + G a G a r e f m First   component × 1 + r × T c T c r e f + s × A M A M 0 + A M A M 0 u Second   component .
where: Ga is the solar irradiance in the panels’ plane, Tc—cell temperature, AM—air mass density, Garef—reference solar irradiance, Tcref—reference cell temperature and AM0—reference air mass; p, q, m, r, s and u are empirical coefficients specific to each PV panel type.
The model in (1) includes two components:
  • First, one that accounts for the influence of irradiance Ga on the efficiency with “weighting”coefficients p, q, and m;
  • Second, one that considers the cell temperature Tc and air mass AM influence on the efficiency by “weighting”coefficients r, s and u.
The empirical coefficients are derived through an experimental and computational procedure applied to specific series of panels, which are manufactured using a defined technology by a particular producer. Once determined for a specific PV panel type, these coefficients remain constant and do not depend on operating conditions.
The model has no limitations related to the time step of the calculations, nor to the spectral composition of Ga. These assumptions are used in further analysis in this paper.
The original Durisch model can provide high accuracy in predicting the performance of PV panels, however, it suffers from the following drawbacks:
  • The model is relatively complex;
  • Requires information about the exact location of the PV installation and the use of mathematical expressions to calculate air mass (AM);
  • The coefficients must be determined on a daily basis, following which the average value of each coefficient is to be calculated;
  • It is necessary to determine six empirical coefficients, which are not independent from each other, given that the influence of one coefficient can be compensated by adjusting another.

3.2. Proposed Productivity Modeling of Monofacial PV Panels

To address these challenges, a new form of the efficiency model from (1) is proposed:
η P V = p × q × G a G a r e f + G a G a r e f m First   component × 1 + r × T c T c r e f Second   component .
In this modified model, the second component is modified by eliminating the influence of air mass and the influence of temperature on efficiency is represented as a difference rather than a ratio of temperatures. It has been shown in [65] that the impact of air mass on panel performance is relatively small and can be neglected with an acceptable degradation in accuracy. In Equation (2), the coefficient r has a clear physical meaning and represents the relative change in efficiency and respectively power [1/°C] with respect to the reference efficiency or power, which is obtained at the reference temperature Tcref. This approach is more user friendly and aligns with the method used by PV panel manufacturers to account for temperature effects.
In the proposed modified Model (2), the first component is exactly equal to the panel’s efficiency at the reference cell temperature Tcref because when Tc = Tcref, the second component of Expression (2) equals 1.
While the model does not imply any restrictions on the value of the reference temperature, in practice, the reference temperature is commonly set to 25 °C, as defined by the Standard Test Conditions for PV panel testing [66]. In the PV panel efficiency Model (2), the reference solar irradiance Garef can take any value, but it is typically assumed to be 1000 W/m2 to match the STC. Under reference conditions Garef = 1000 W/m2 and Tcref = 25°C, the panel efficiency from the model should match the efficiency under STC.
The advantages of the proposed new form of the efficiency model are:
  • It is less complex than the original Model (1);
  • It has only four coefficients to be determined;
  • The coefficients can be found using data for different days across the year without the need to know the exact geographical location of the studied PV panels;
  • The influence of cell temperature on panel efficiency is clearly distinguished from the influence of solar irradiance.
Using the obtained efficiency, the electrical power P generated by the PV panel is calculated by the following formula:
P = η P V × G a × S .
where: S is the panel surface area.
The energy E produced by the PV panel is calculated with the formula:
E = 0 t i P d t .
where: ti is the time interval over which the energy is calculated—hour, day, week.
When using discrete time values, the energy is calculated as the sum of the energy over each discretized time interval:
E = j = 1 N P j Δ t .
where: Pj is the power during the j-th time interval, Δt is the time step used for discretization, N is the number of intervals in the entire time period.
While the procedure described above is well adapted to monofacial panels, in the case of bifacial panels there is a problem with the mathematical representation of efficiency and contribution of each panel side.

3.3. Proposed Productivity Modeling of Bifacial PV Panels

In the current study, the authors propose a new performance model for bifacial PV panels, which relies on separate efficiency models for each side of the panel. It is assumed that both sides of the bifacial PV panel contribute independently to the total generated power. The total power output of the panel P, is then determined as the sum of the power generated by the front side Pfront and the rear side Prear:
P = P f r o n t + P r e a r = η P V F × G a F × S + η P V R × G a R × S .
where: ηPVF is the efficiency of the front side, ηPVR—the efficiency of the rear side, GaF—solar irradiance on the front side of the panel, GaR—irradiance on the rear side of the panel.
Each side of the panel has its own efficiency model, defined by Equation (2), with distinct coefficients tailored to the front and rear surfaces. By combining the efficiency models with the power calculation, the total power output under specific operating conditions is expressed by:
P = p F × q F × G a F G a r e f + G a F G a r e f m F × 1 + r F × ( T c T c r e f ) × G a F × S + + p R × q R × G a R G a r e f + G a R G a r e f m R × 1 + r R × ( T c T c r e f ) × G a R × S ,
where: the model coefficients for the front side are denoted with the subscript F, and those for the rear side with the subscript R.
Combining (5) and (6) the energy for bifacial panel becomes:
E = j = 1 N P f r o n t j + P r e a r j Δ t .
The proposed method for determining the power output of bifacial PV panels differs significantly from the approach used in [32], where the original efficiency Model (1) is applied by substituting the solar irradiance in the panel plane with the combined irradiance received on both sides of the panel. It also diverges from the methodology in [27,37], which estimates the power output for each side of a bifacial panel based on the standard test condition (STC) power and the ratio of actual irradiance to 1000 W/m2. The model in [27,37] assumes constant efficiency, independent of both irradiance and temperature. Furthermore, the proposed efficiency model is different from that in [65], where the temperature dependence is represented differently and the model is limited to monofacial PV panels.
In further analysis it is assumed that the cell temperature Tc is the same for both the front and rear sides and the cell temperature is equal to the measured panel temperature as in [27,32,37].

3.4. Determination of Efficiency Model Coefficients Fom Mono- and Bifacial PV Panels

As mentioned above, the proposed model requires the determination of 4 or 8 coefficients respectively for mono- and bifacial panels. In this study, the model coefficients are determined from experimental data, which include:
  • solar irradiance in the front and rear plane of the bifacial panels,
  • power output from the panels,
  • cell temperature.
The authors propose an approach in which the temperature coefficient r is first extracted from experimental data obtained from the experimental platform described in Section 2. The values are recorded with time steps of 15 min. Experimental data on the power output of the panels at similar irradiance levels but different temperatures are used for the following procedure. To enable comparison and determine the temperature dependence, the measured values of generated power PGa are normalized to a given irradiance value Ganorm:
P G a n o r m = P G a G a × G a n o r m ,
where: PGanorm is the power the panel would produce at the solar irradiance Ganorm, PGa—is the measured power of the panel at the actual irradiance Ga.
Here, the fact is used that when solar irradiance values exceed approximately 500 W/m2 and vary within a relatively small range (e.g., 300 W/m2) the panel’s efficiency remains nearly constant with respect to irradiance and depends mainly on temperature [32,33,63]. As the coefficient r is constant, the value, obtained from the following calculation, is applied across the entire range of Ga.
To minimize the influence of the Ga value when determining r, the range of solar irradiance under which the experimental data were obtained is divided into two regions: from oт 500 to 800 W/m2 and from 800 to 1100 W/m2. The measured power of the PV panel is normalized to two solar irradiance values: Ganorm1 = 1000 W/m2 and Ganorm2 = 800 W/m2. In principle, both values can be chosen arbitrarily, as this does not affect the final result. The first value, 1000 W/m2, is selected because it is the standard testing condition under which panels are tested, allowing comparison with the panel power specified by the manufacturer. The second value, 800 W/m2, is chosen because it corresponds to the solar irradiance level under NOCT (Nominal Operating Cell Temperature), enabling comparisons with those manufacturer-provided data as well.
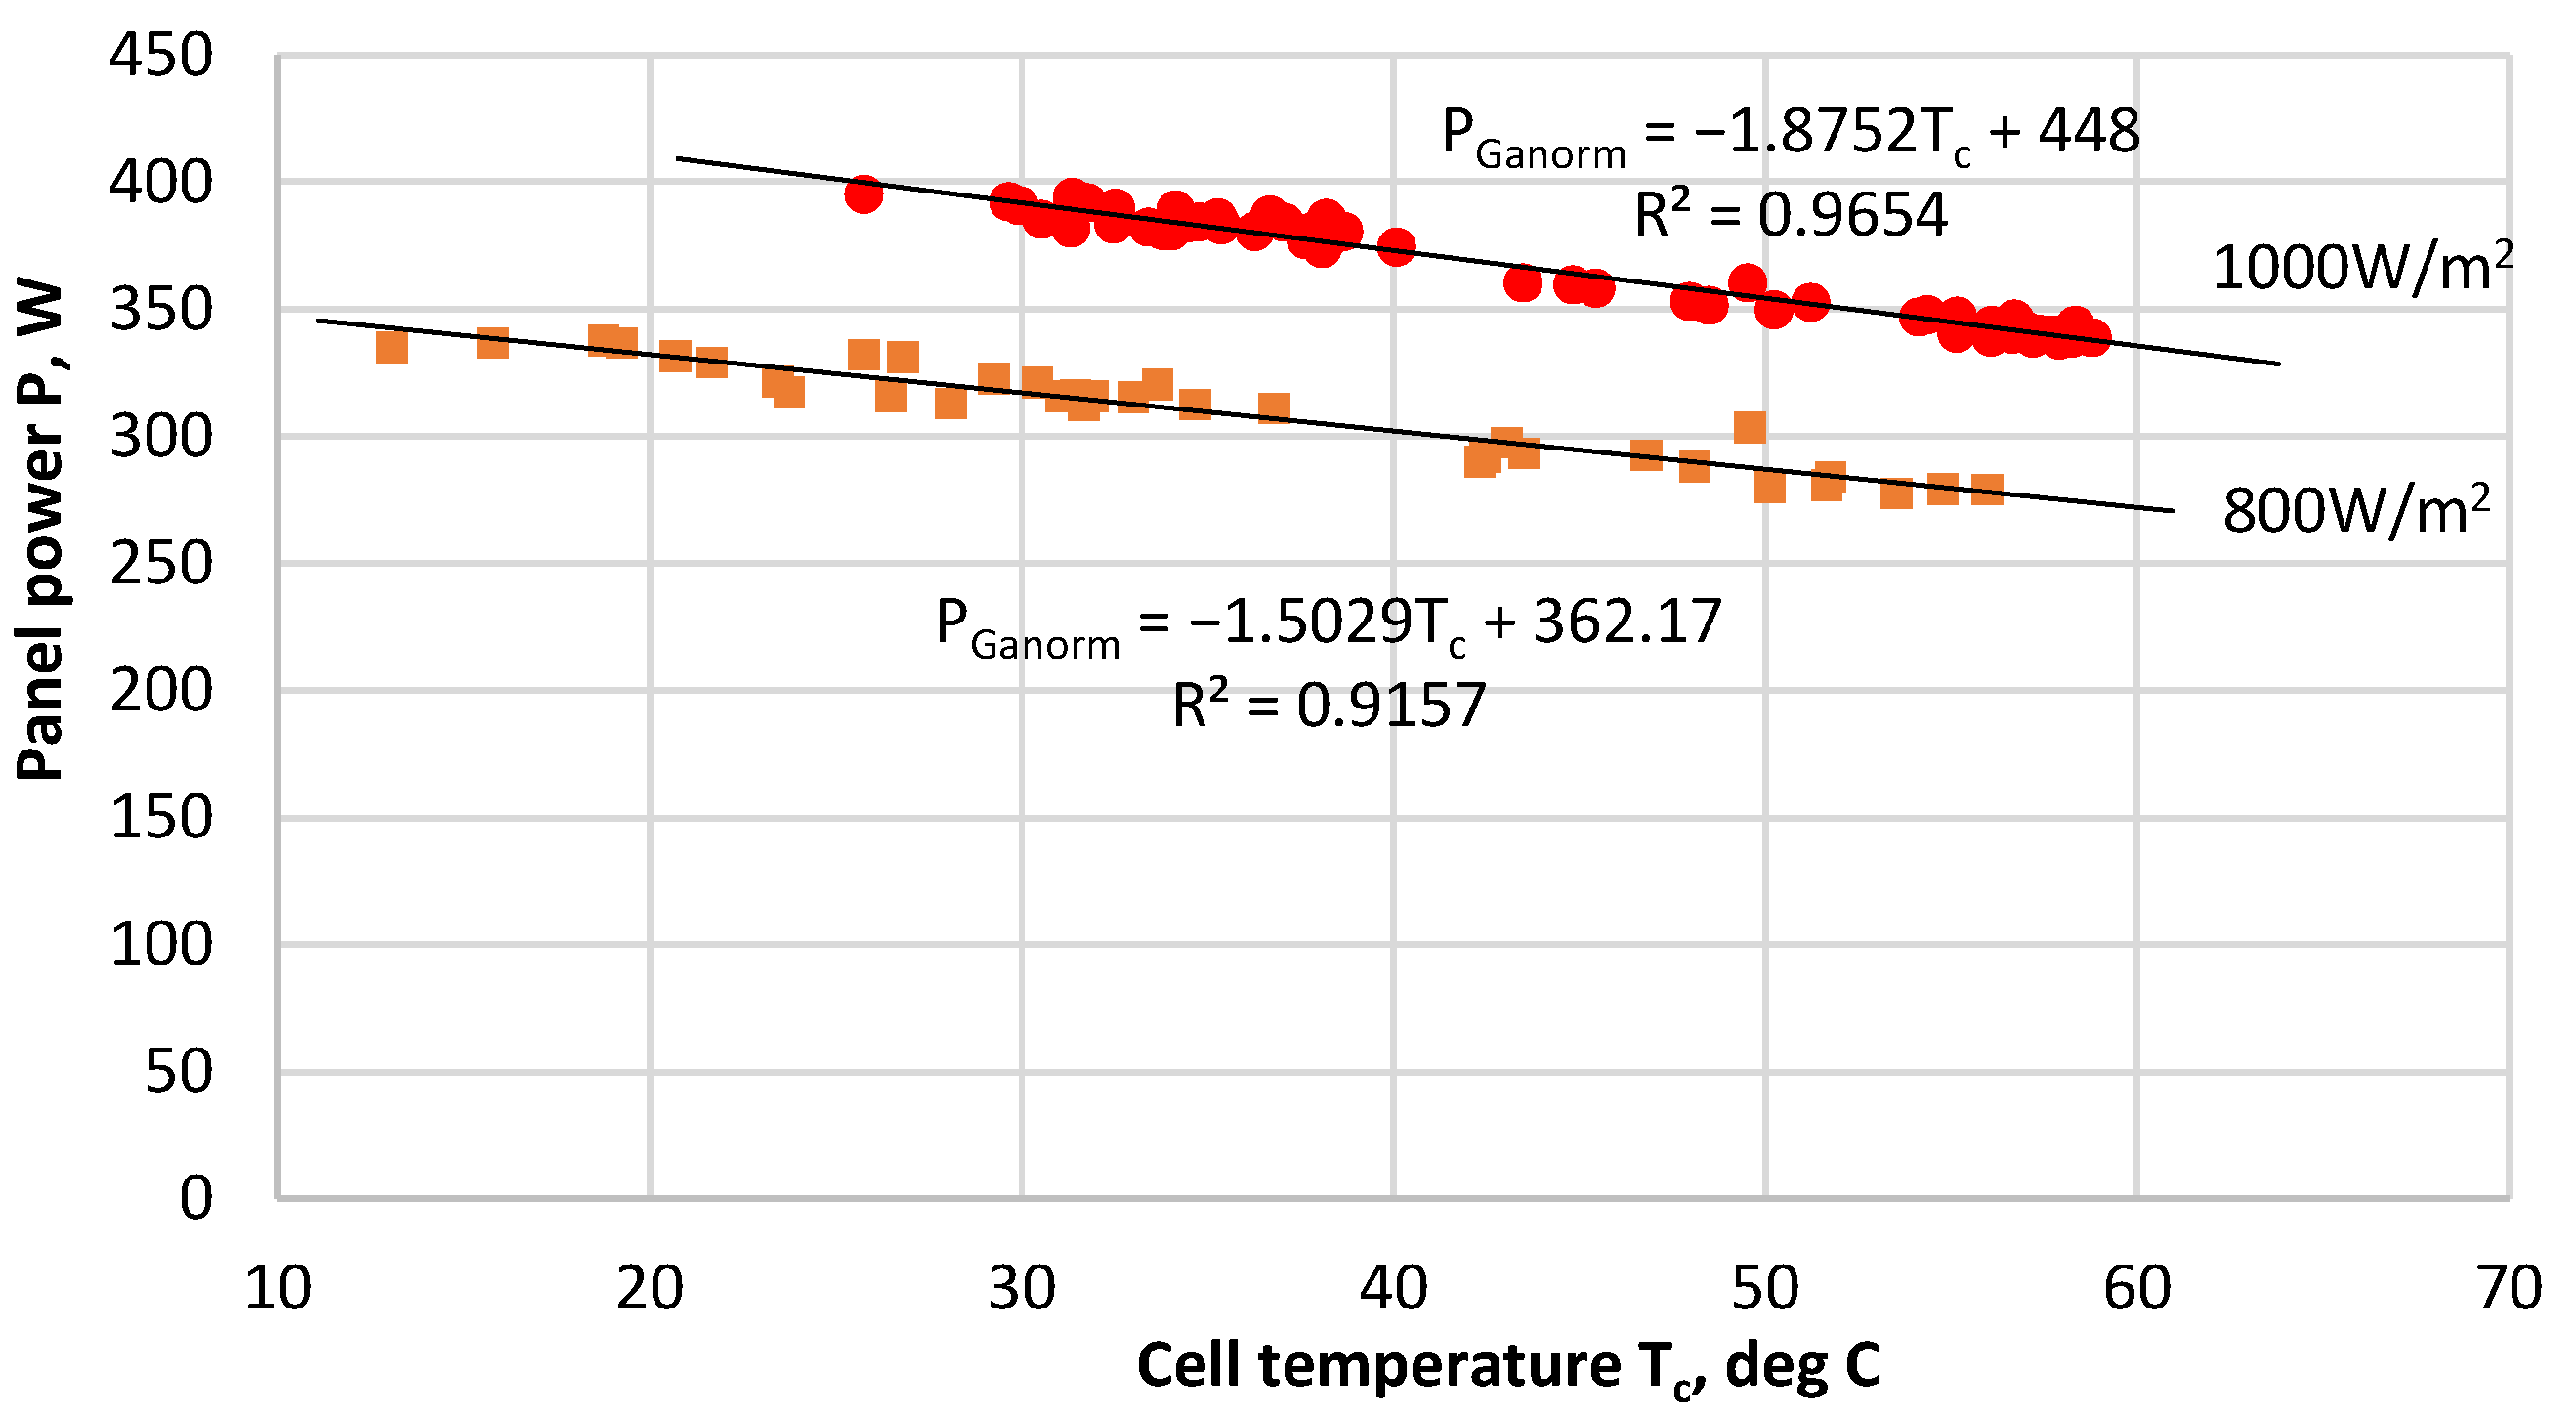
The normalized power values PGanorm are plotted against the cell temperature for the two solar irradiance values in a common coordinate system. The points are approximated with straight lines, as shown in Figure 7. The purpose of the graph is to illustrate that the power generated by the PV panel depends only on the cell temperature, since the solar irradiance value at which this power was obtained is constant: 800 or 1000 W/m2.
The resulting equations for the approximating straight lines in Figure 7 have the form:
P G a n o r m = n × T c + k ,
where: n is the slope (change in power per °C) and k is the intercept (power at 0 °C) at given solar irradiance value Ganorm (800 W/m2 or 1000 W/m2).
The values of n and k obtained from data fitting in Figure 7 are:
  • For solar irradiance Ganorm = 800 W/m2: n = −1.5029, k = 362.17;
  • For solar irradiance Ganorm = 1000 W/m2: n = −1.8752, k = 448.
The panel power can also be calculated from the Expressions (2) and (3) at the same solar irradiance value Ga (800 W/m2 or 1000 W/m2) and an arbitrary cell temperature Tc:
P = η P V × G a × S = p × q × G a G a r e f + G a G a r e f m × G a × S × 1 + r × ( T c T c r e f ) P T c r e f = p q G a G a r e f + G a G a r e f m × G a × S × 1 ,
where: PTcref is the panel power at the solar irradiance Ga and the reference cell temperature Tcref because when Tc = Tcref the term 1 + r × (Tc − Tcref) = 1.
The expression for the panel power resulting from (11) is:
P = P T c r e f × 1 + r × ( T c T c r e f ) ,
Next, the Equations (10) and (11) are taken at the same constant solar irradiance Ga = 800 W/m2 or 1000 W/m2. Further, it is considered that the powers calculated from (10) and (12) are equal at given Tc because the mathematical model must produce the same result as the fitting equation of experimental data:
P = PGanorm for Ga = Ganorm = 800 W/m2 or 1000 W/m2.
The temperature coefficient r is then expressed from (12) as follows:
r = P P T c r e f P T c r e f × ( T c T c r e f ) .
From Equation (10) for Ganorm = 800 W/m2 or 1000 W/m2 the powers are expressed as follows for Tc and Tcref:
P = n × T c + k and   P T c r e f = n × T c r e f + k .
Expressions (15) are substituted into (14), resulting in:
r = n × T c + k n × T c r e f k ( n × T c r e f + k ) × ( T c T c r e f ) = n n × T c r e f + k .
where: Tcref = 25 °C.
This is the final expression for the calculation of temperature coefficient r from equations of fitting lines in Figure 7.
It should be noted that both values r and n are negative and reflect the decrease in the efficiency and produced power of the PV panel as the cell temperature increases at constant solar irradiance. The coefficient n indicates the power reduction in absolute units [W/°C], while the coefficient r represents the relative change in power [1/°C] with respect to the reference value PTcref, which is obtained at the reference temperature Tcref.
For the model, the average value of the coefficient r from the two approximations—at solar irradiance levels of 1000 W/m2 and 800 W/m2—was used.
Next step requires determining the coefficients p, q, and m from the first component of Expression (2). To achieve this, the model uses the dataset of measured panel power values P(Ga, Tc) —corresponding to the respective irradiance and cell temperature. These values are normalized to the reference temperature Tcref = 25 °C using the previously determined temperature coefficient r:
P T c r e f = P 1 + r × ( T c T c r e f )
where: PTcref is the calculated panel power that would be obtained if the cell temperature were at the reference value Tcref.
Next, the panel efficiency is calculated using the generated power, the solar irradiance, and the panel area S:
η P V T c r e f = P T c r e f S × G a
The set of points ηPVTcref(Ga) is fitted with the function:
η P V T c r e f = p × q × G a G a r e f + G a G a r e f m .
at Garef = 1000 W/m2.
In Equation (19), the temperature-dependent component is omitted because the efficiency is calculated at the reference temperature, where the second part of Expression (2) equals 1. Through curve fitting, the values of the coefficients p, q, and m are determined—these are the parameters that allow the analytical function to best match the set of efficiency data points.
Using experimental data and the procedure described above, the values of the unknown coefficients in the efficiency model were determined for the monofacial panels, as well as separately for the front and rear sides of the bifacial panels. Data from only four days across different seasons of the year were used—each day was sunny but featured significantly different temperatures. This approach ensures a wide range of solar irradiance and panel temperatures, which contributes to maximizing the accuracy of the model.
The determination of the temperature coefficient for the monofacial panel was shown in Figure 7.
To obtain the necessary data for determining the efficiency model coefficients for both the front and rear sides of bifacial panels using the above-presented procedure for monofacial panel the following experiment was conducted. One bifacial panel was positioned with its front side facing the sun, while its rear side was covered with an opaque material. The second bifacial panel was oriented with its rear side facing the sun, and its front side was similarly covered. Using a data acquisition system, the following parameters were measured with steps of 15 min: solar irradiance in the plane of the panels on the sun-facing side, the power output of each panel, and the panel temperatures. Simultaneously, the same data were collected for the monofacial panels. This experimental setup enables the separation of the bifacial panel performance into front and rear contributions, forming the foundation of the developed mathematical model.
Figure 8 shows the results of the fitting of the PV power values for the front and rear sides of the bifacial panel, from which the temperature coefficient r is determined.
The values of the temperature coefficients obtained from Equation (16) and the linear fitting in Figure 7 and Figure 8 for the monofacial panel and for the front and rear sides of the bifacial panel are presented in Table 3.
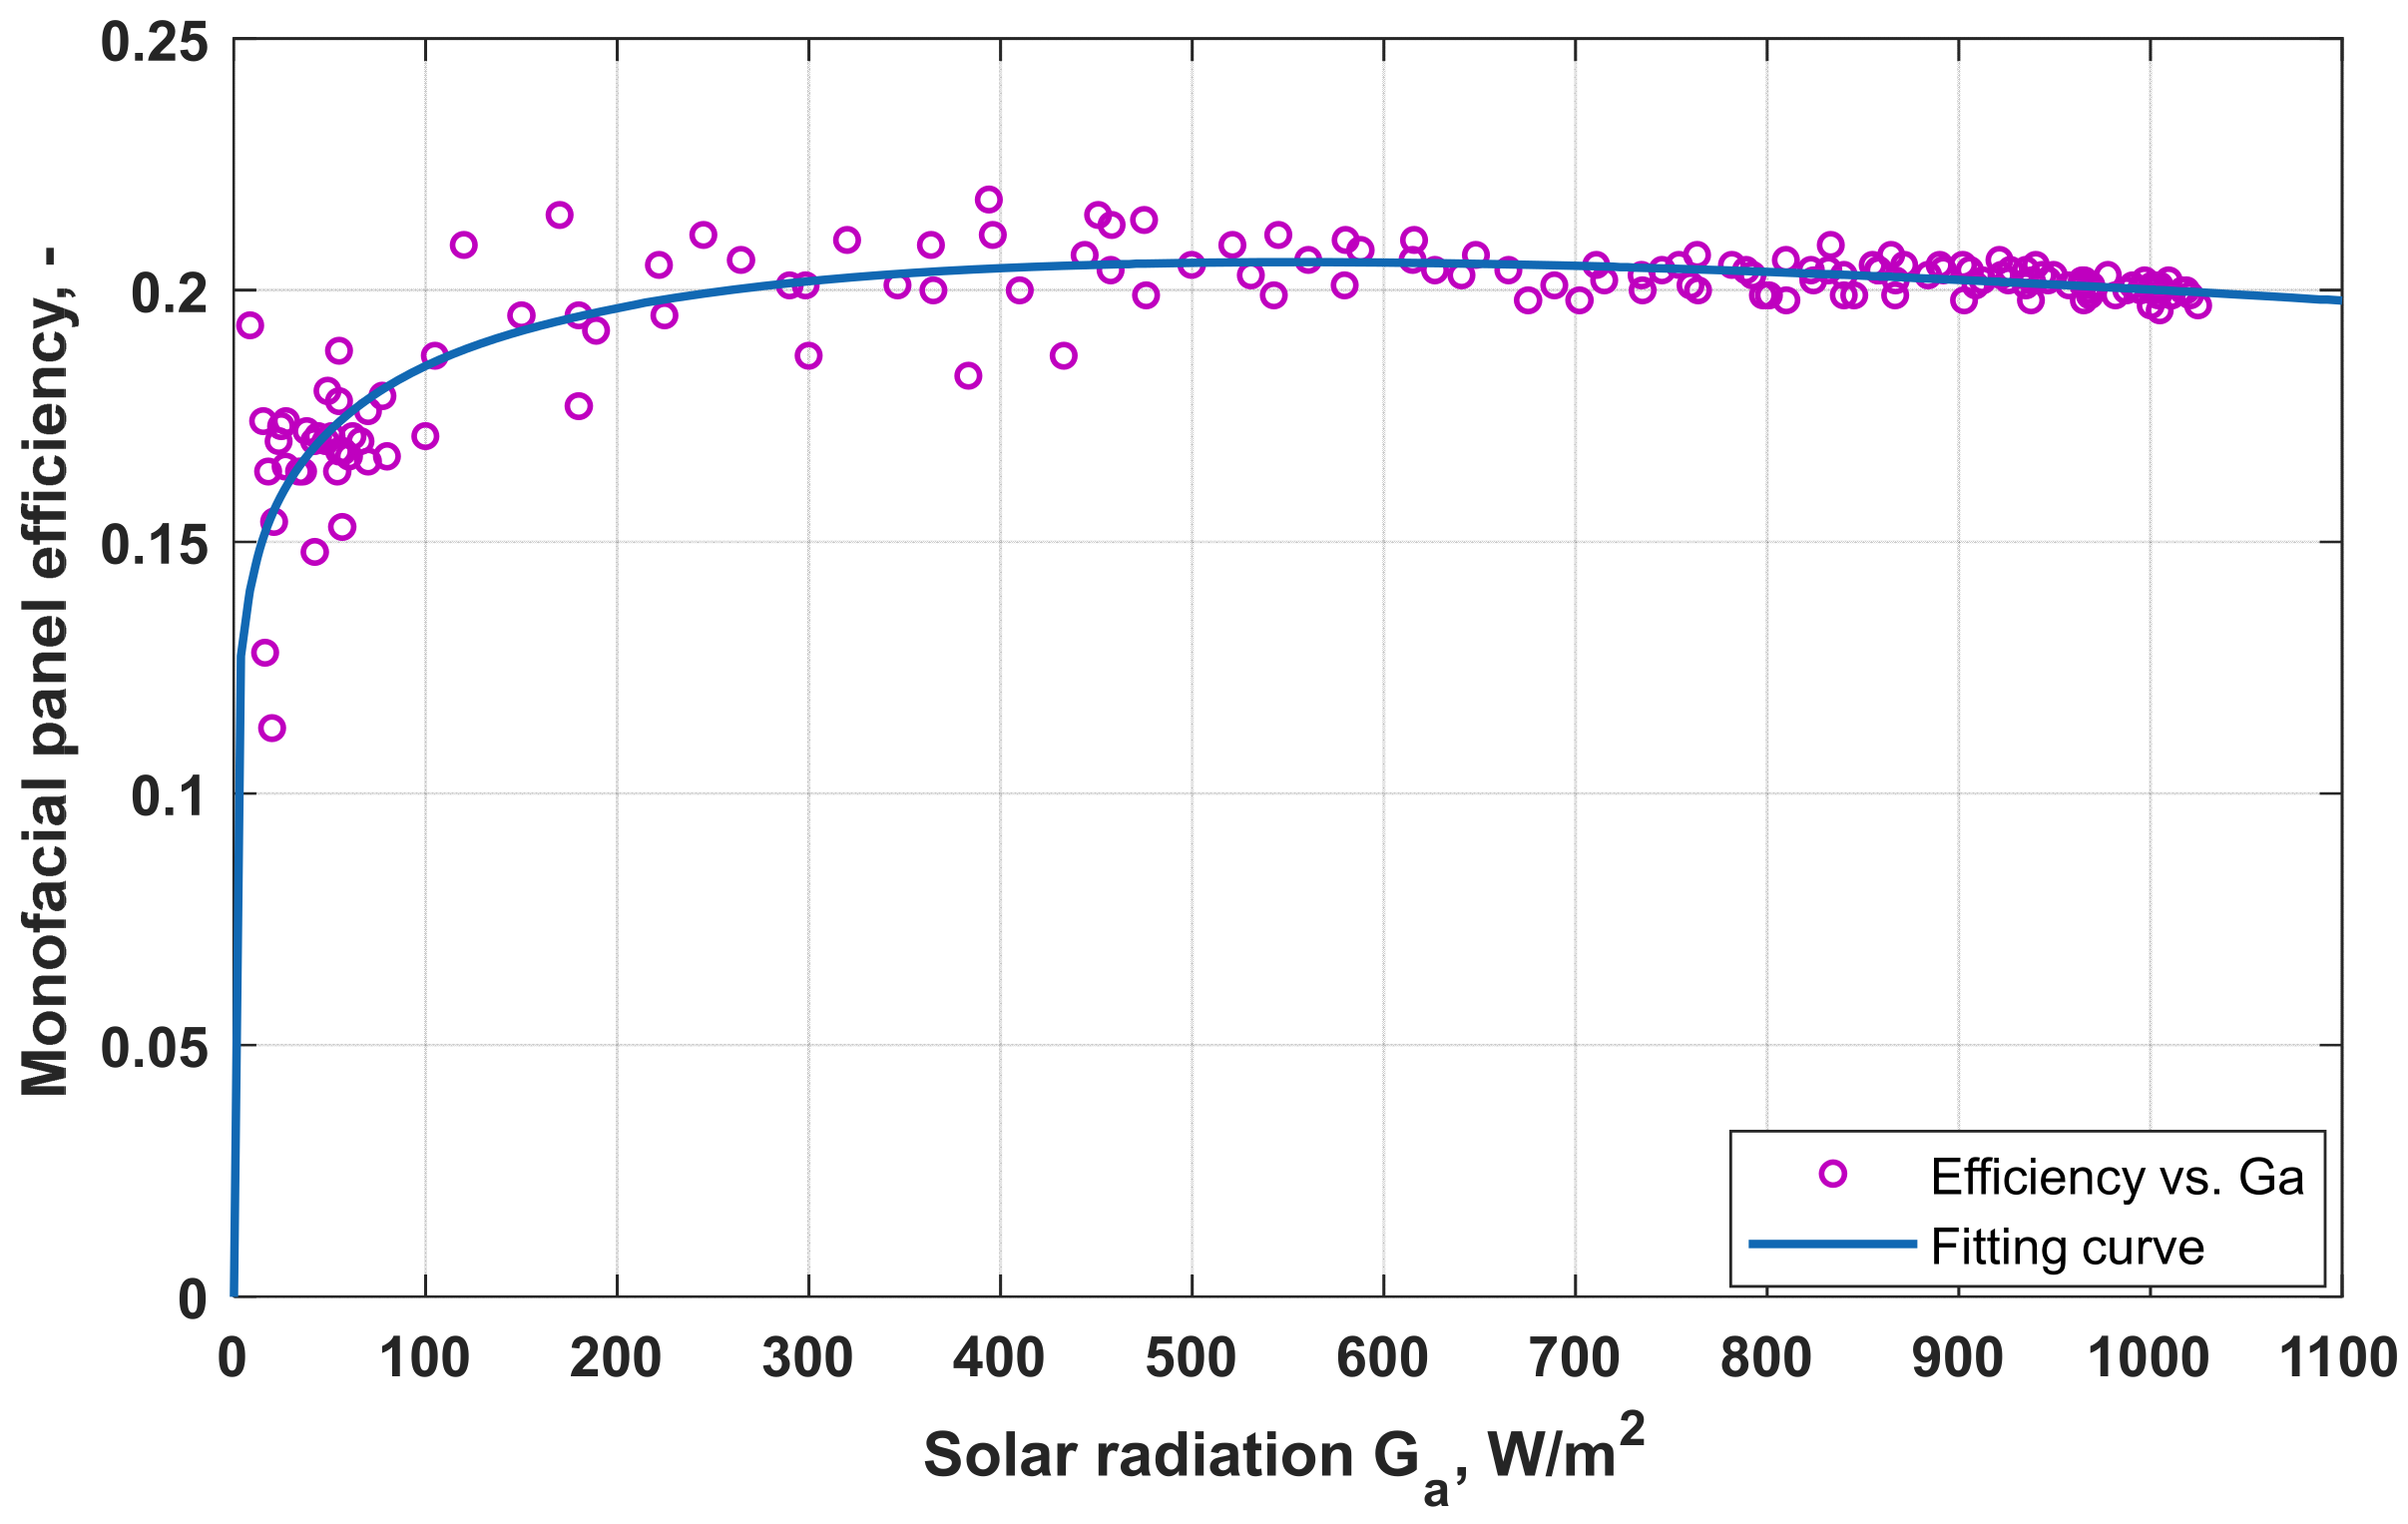
The remaining coefficients p, q, and m were determined by fitting the panel efficiency data—recalculated to a reference temperature of 25 °C—using the function ηPVTcr(Ga), defined in Equation (19). The fitting was performed using the Curve Fitting app from the MATLAB R2022b Curve Fitting Toolbox, MathWorks, Natick, MA, USA, where the desired function was manually entered in Custom Equation mode. Figure 9 shows the determination of the model coefficients for the monofacial PV panel. The RMSE for this fitting is 0.004781, and RRMSE is around 2.4%.
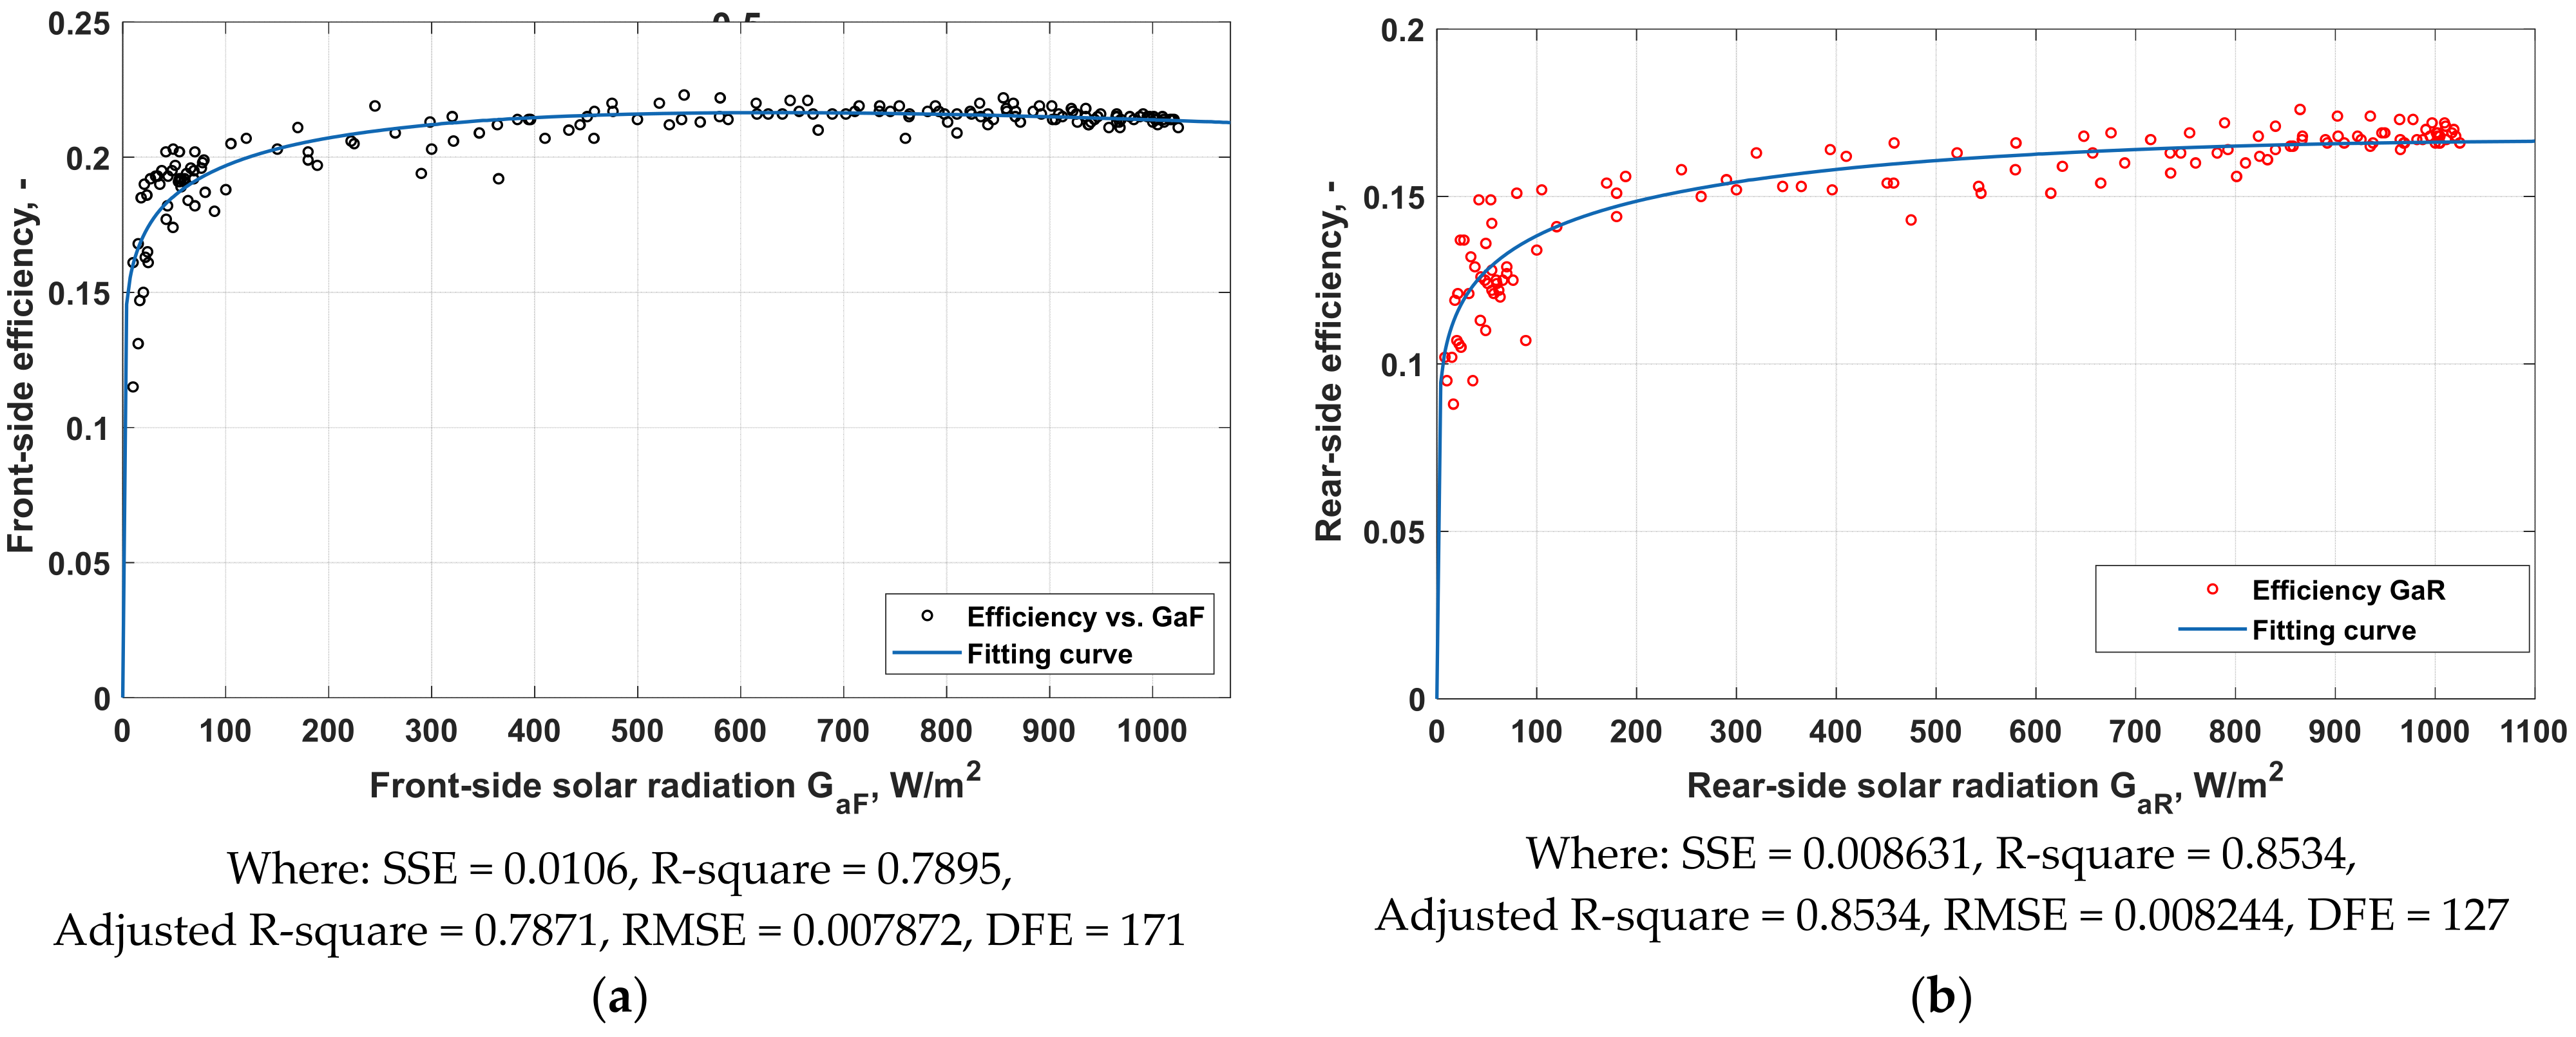
This procedure was carried out for the monofacial panels, as well as separately for the front and rear sides of the bifacial PV panels. Figure 10 presents the fitting of the efficiency data for the front and rear sides of the bifacial panels for determining the coefficients p, q, and m in the efficiency Model (2).
The obtained values of the efficiency model coefficients for the front and rear sides of the bifacial panels and for the monofacial panels are presented in Table 4.
The development of the proposed model for evaluation of productivity of mono and bifacial PV panels follows a structured methodology:
  • Experimental data must be available for the front and rear sides of the bifacial panel separately, including generated PV power, irradiance on each side, and panel temperature.
  • Appropriate days are selected from the data set, prioritizing those with significant variation in panel temperature and solar irradiance. Typically, these are days from summer and winter in Bulgaria.
  • The data for PV power and solar irradiance are divided into two subsets: 500–800 W/m2 and 800–1100 W/m2 and PV power values are normalized to 800 and 1000 W/m2 using Equation (9).
  • The normalized PV power values are plotted against solar irradiance and linear regression is applied to both subsets to obtain fitting equations.
  • The temperature coefficient r is calculated using Equation (16).
  • All measured PV power values are normalized to a reference temperature of 25 °C using the calculated temperature coefficient and Equation (17).
  • Panel efficiency is calculated using Equation (18).
  • Efficiency values are plotted against solar irradiance, and the data are fitted using Equation (19) to determine the coefficients p, q, and m.
  • This procedure is applied separately to the front and rear sides of the bifacial panel.
  • The final expression for the total power generation of the bifacial panel is the sum of the front and rear contributions, as given by Equation (7).
An important advantage of the proposed model is that there are no limitations related to the geographical location or the orientation of the panels. The model has no limitations related to the time step of the calculations, nor to the spectral composition of irradiation Ga. The model is applicable as long as the irradiance on the front and rear surfaces of the panel and its temperature are known. The procedure for derivation of coefficients in the model proposed here is clearer and easier compared to models based on the original Durisch model.

3.5. Evaluation Parameters

In Section 4, the accuracy of the developed models is assessed, and various energy performance characteristics of the bifacial panels are compared under different reflective surfaces. Therefore, the criteria used for these evaluations and comparisons are presented below.
The parameter used to evaluate the accuracy of the productivity Model (7) is the Relative Root Mean Square Error (RRMSE), calculated as:
RRMSE = ( y i x i / N e X 2 ) ,
where yi and xi are the calculated and measured values of the compared quantities, respectively; X is the mean value of the measured quantity; and Ne is the number of measured values.

4. Model Validation and Experimental Results

The following section presents a series of experimental studies conducted using the previously described platform, along with the validation of the theoretical model developed to assess the productivity of monofacial and bifacial photovoltaic panels.

4.1. Behavior Experimental Evaluation of Mono- and Bifacial PV Panels and of Various Reflecting Surfaces

Figure 11 shows the results from 12 February 2025 for all panels of the system. Figure 11a presents the measured weather conditions, while Figure 11b shows the resulting daily energies of the different panels with a shiny aluminum foil on the surface under the panels, to ensure reflected solar irradiance on the rear side of the bifacial panels. The bifacial panels (P5 and P7) have a clear advantage over the monofacial panels. The difference between the two bifacial panels is only 28 Wh, indicating that in small installations the influence of panel position is only slightly pronounced. The P2 panel is a monofacial panel with the front side facing the reflecting surface, which determines the significantly lower daily energy produced. The purpose of the inverted monofacial panel is for control measurement of solar irradiance from the rear side of the bifacial panels.
The collected data in the experiment, described in Section 3.5, were also used to calculate the bifaciality factor of the studied bifacial PV panels (Prear/Pfront) under real-world operating conditions. Figure 12 illustrates the ratio of power generated by the rear side to that of the front side of the bifacial panel when both sides are exposed to the same tilted global solar irradiance. The left subfigure depicts the variation of this ratio throughout a single day (6 March 2025). The right subfigure presents the ratio as a function of solar irradiance, using data collected over multiple days. The results shown in Figure 12 allow for the conclusion that the rear side of the studied bifacial panels produce between 67% and 83% of the power of its front side when it is oriented to the Sun.
Different reflective surfaces were used in the experimental studies presented in the following sections. Figure 13 shows the variations of the reflected incident solar irradiation on the rear side of the panels for different reflective surfaces as a function of solar irradiance at the front surface of the panels. These results show that the highest reflectance is obtained for the white nonwoven geotextile, followed by the shiny aluminum foil. The patinated sheet metal and the green artificial grass are the coatings with the lowest reflectance (with the sheet metal having a slight advantage).

4.2. Experimental Methods and Model Validation

In Section 3, the modelling of the bifacial PV panel was presented using models to calculate the power generated by the front and rear sides of the panel (Equation (7)). Section 3.5 describes an experiment that obtained data on the power generated on both sides of the bifacial panels under identical conditions—solar irradiance and panel temperature. The results of this experiment are presented in Figure 14.
Figure 14a shows the variation of power generated by:
  • the front side of the first bifacial panel with covered rear side (P5);
  • the rear side of the second bifacial panel facing the sun (P7), with covered front side;
  • and the monofacial panel, located between them (P6).
Figure 14b presents the same per unit quantities relative to the rated power of the respective panel, taking into account the effect of temperature on the generated power. The conversion of the powers to per unit values was performed in two steps:
  • the generated power is corrected against the standard temperature of 25 °C by the temperature coefficient r using Equation (16).
  • the resulting values are aligned to the rated power of the panels Prat—410 W for the monofacial panel (P6) and 430 W for the bifacial panel (P5):
p o w e r _ p u = P T c r e f P r a t .
Temperature correction in the power calculation described above is necessary, as the bifacial panels (P5 and P7) exhibit temperatures up to 12 °C higher than the monofacial panel (P6), as shown in Figure 14a. This temperature difference is due to the sides of the bifacial panels, that are not directly exposed to sunlight, being covered, which restricts airflow and leads to less effective cooling of the cells.
Figure 14b shows that after the power of the monofacial panel is referred, it matches the power of the front side of the bifacial panel. According to Equation (6) the output power of the bifacial panel PBF can be represented as a sum of front and rear powers and consequently, the bifacial panel rear power is represented as:
P r e a r = P B F P f r o n t .
The front power can be obtained by the power of reference monofacial panel P(P6):
P f r o n t = P ( P 6 ) × P r a t ( P 5 ) P r a t ( P 6 ) ,
where Prat(P6) is the rated power of the monofacial panel (P6), Prat(P5) is the rated power of the bifacial panel (P5).
The Equations (22) and (23) allow the separation of front and rear side powers of bifacial panel given a known total bifacial panel power and monofacial panel power.
To validate the experimental method for determining the front side power from the overall measured power of bifacial panel, presented above, an additional experiment was conducted in which the panel (P5) operated in normal conditions while the rear side of the second bifacial panel (P7) was covered with an opaque, non-reflective surface. This ensured that the panel (P7) generated power solely from its front side, enabling a direct comparison with the reference monofacial panel.
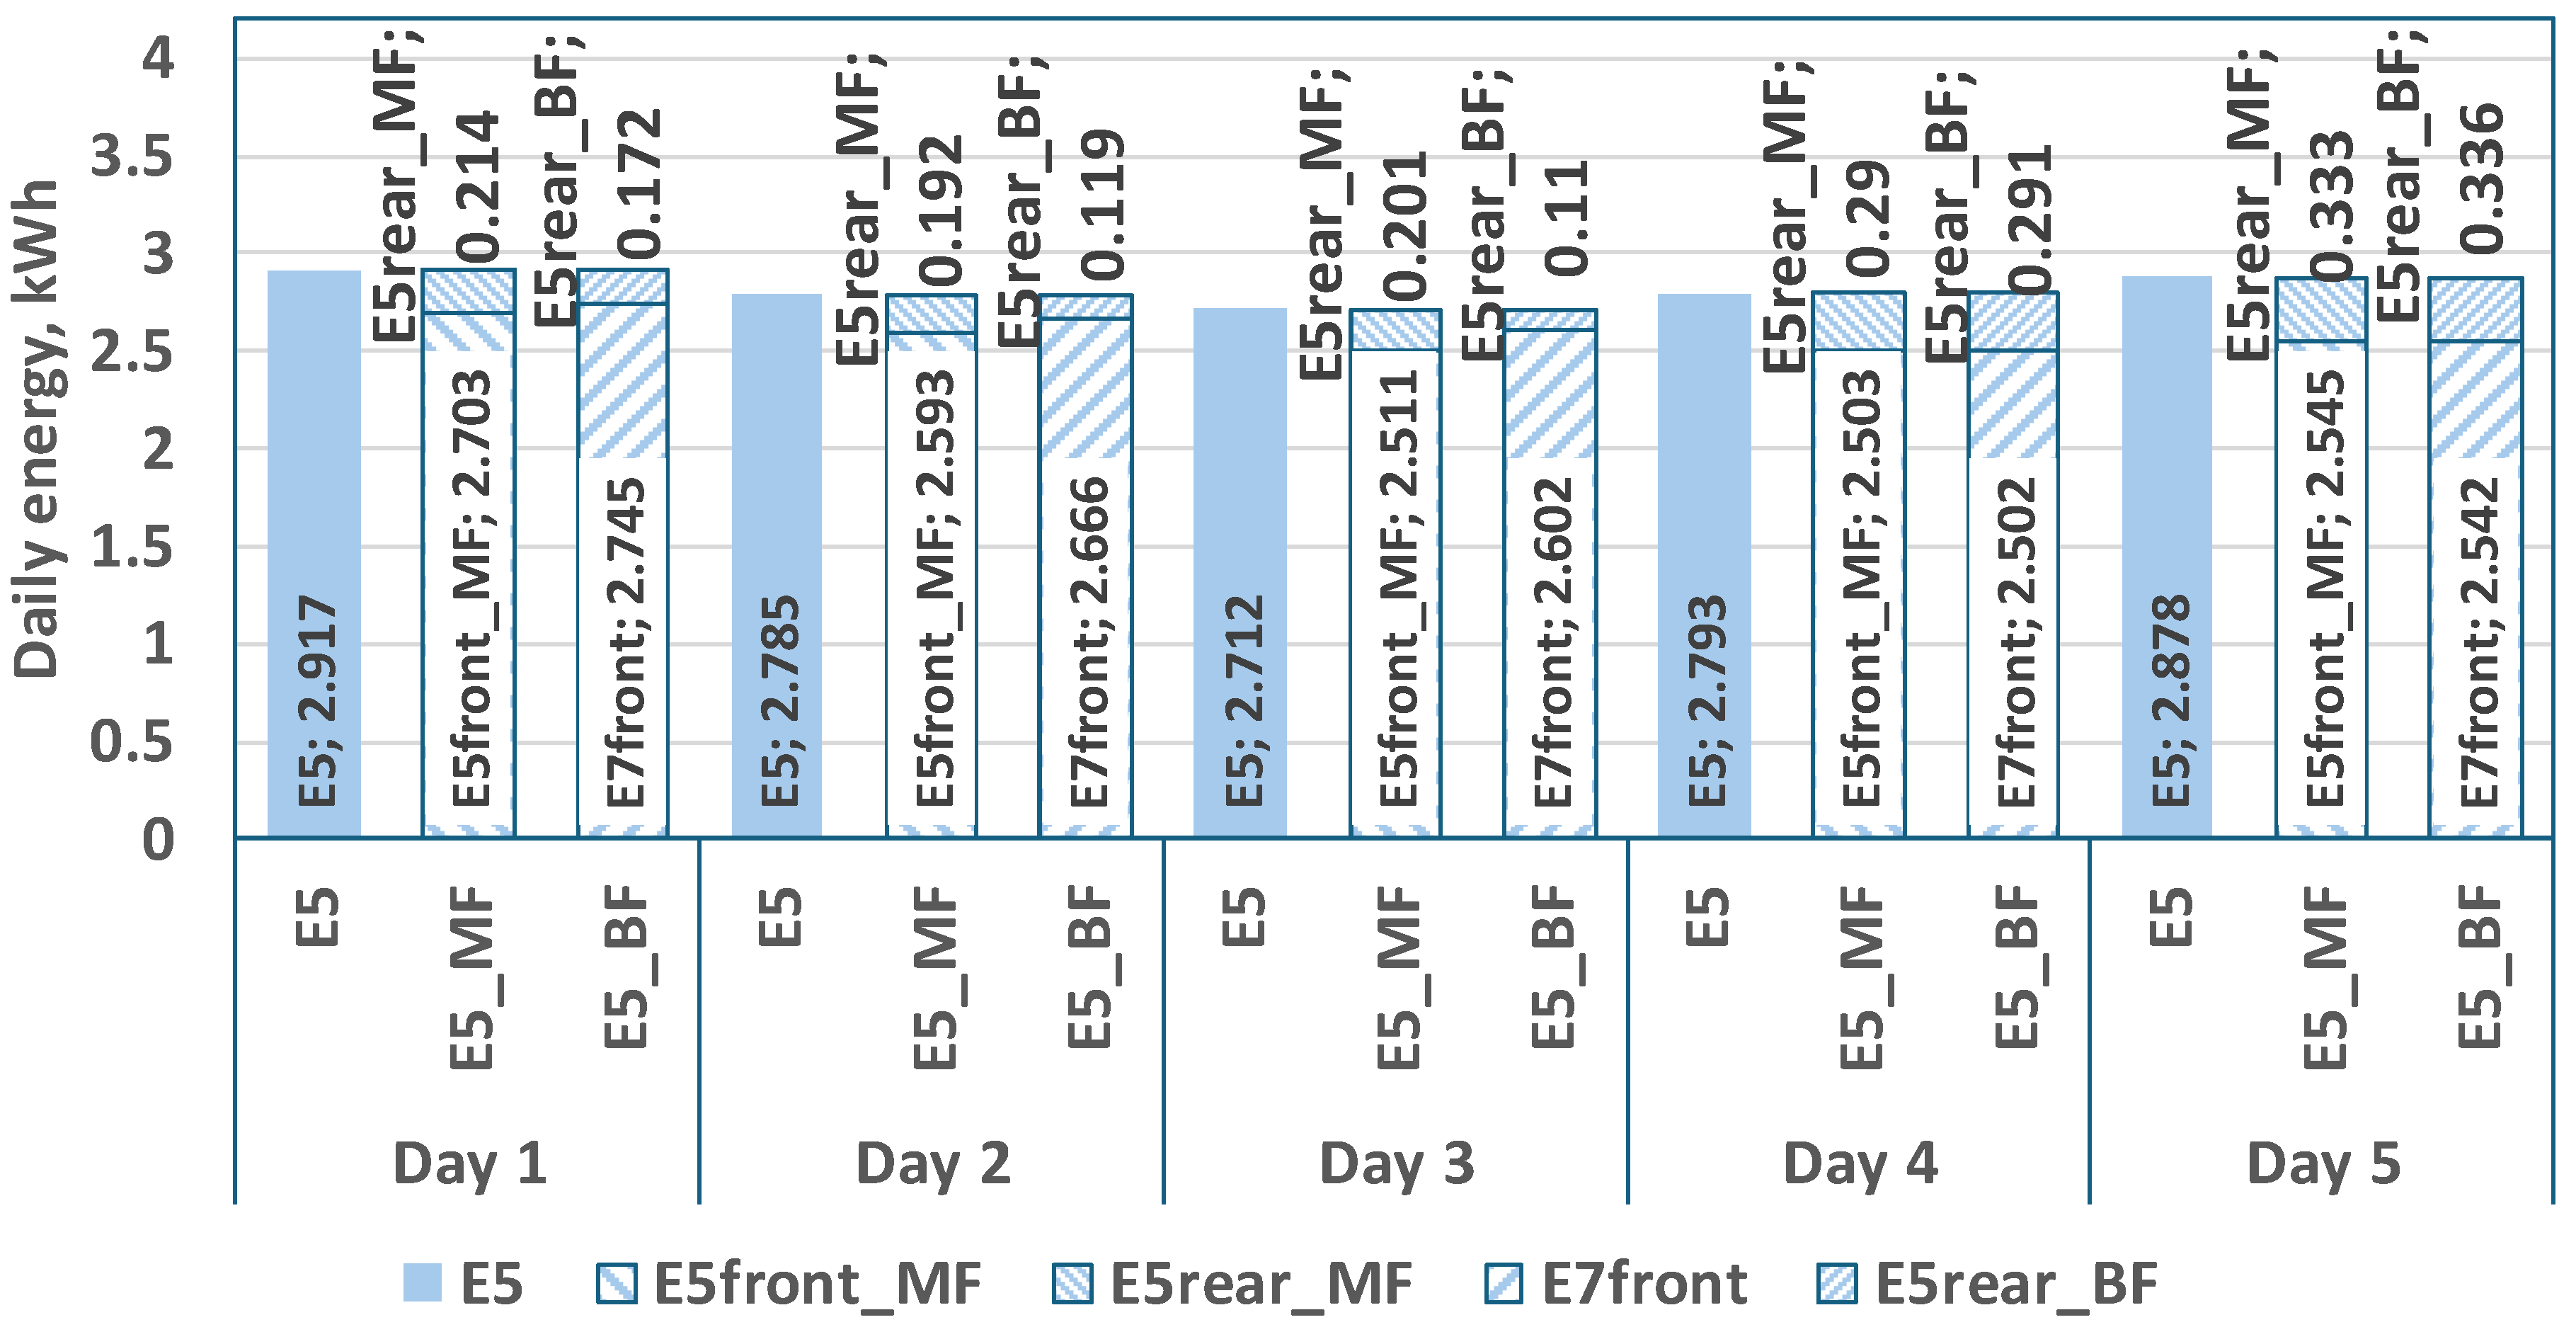
Figure 15 presents the results of this experiment, conducted over five days across different months. The figure displays the separation of daily energy output of the bifacial panel (P5) using two methods described above via simultaneous measurements. The Equations (6), (22) and (23) are also valid for the produced energies by the PV panels. In Figure 15 are shown:
  • Measured daily energy production of the bifacial panel (E5) operating under normal conditions with both sides illuminated.
  • Separated daily energy using monofacial reference panel (E5_MF): The bar represents the sum of front-side energy derived from the monofacial panel (E5front_MF) calculated by (23) and rear-side energy (E5rear_MF), calculated as the difference between E5 and E5front_MF according to (22).
  • Separated daily energy using bifacial panel with covered rear side (E5_BF): The same as the second method, but the front-side energy (E7front) is measured from the second bifacial panel with its rear side obscured.
The numbers in the bars represent the values of the respective daily energy in kWh. The separation of daily energy of bifacial PV panel on its front and rear side components on Figure 15 allows to compare the estimated front-side energy obtained using the monofacial reference and the covered bifacial panel.
The results show good alignment of the method with the referenced monofacial panel with the measured front side power. Observed deviations range from 3.5% (on day 3) to −0.1% (on day 5). This confirms that the method of determining the front-side energy of bifacial panels using the energy output of a reference monofacial panel is sufficiently accurate. For this reason, the method is adopted in the subsequent analyses presented in this paper. Moreover, this approach is more general, as it does not impose constraints on the monofacial panel’s power, provided both panels operate under identical solar irradiance.
It should be noted that since rear side energy represents only 5–12% of total bifacial output, its estimation is highly sensitive to the front side part. Some minor deviations (in the range of ± 0.1 kWh per day) in front side energy can lead to disproportionately large relative errors in the rear side results. The considered separation of both sides aims to evaluate both components of the proposed model. The goal of the proposed model is to determine the overall production of the bifacial panel on the basis of two measured solar irradiations (front and rear sides), which is achieved with satisfactory precision as presented below.
Validation of the developed productivity models for the bifacial panel (front and rear sides) and the monofacial panel was carried out through comparisons between calculated and experimentally measured power outputs under identical solar irradiance and panel temperature conditions.
Figure 16 shows the model validation results for a sunny day and Figure 17—for a cloudy day, both using a reflective surface of patinated sheet metal. Sub-figure (a) shows the measured meteorological conditions, i.e., solar irradiance on the front and rear sides of the bifacial panel, ambient and panel temperatures. Subfigure (b) compares the experimental and calculated power values for the monofacial panel. Subfigures (c) and (d) relate to the bifacial panel, for the front and rear sides separately, (c), and the whole panel, (d), respectively.
The results show good agreement between the calculations and the experimental data, regardless of panel type. For a sunny day (23 September 2024, Figure 16) the relative root mean square error RRMSE is 7.06% for the monofacial panel and 7.55% for the bifacial one. For the cloudy day (18 September 2024, Figure 17) the RRMSE values are 8.73% for the monofacial and 4.83% for the bifacial panel.
Figure 18 shows a comparison between the measured and calculated daily energy for the two days. The analysis covers the monofacial panel (P6), the bifacial panel (P5), and its front (P5front) and rear (P5rear) sides. The results confirm the good accuracy of the model.
More extensive results from the analysis of the performance of bifacial PV panels at different reflecting surfaces and a comparison of the performance of bifacial and monofacial panels under identical conditions are presented below.
The analysis is performed for the four different reflecting surfaces during the four seasons, typical for Bulgaria—summer, autumn, winter and spring. Figure 19 shows the comparison between the measured and calculated values of the daily energy for: shiny aluminum foil (a), white nonwoven geotextile (b), green artificial grass (c) and patinated sheet metal (d). Each subfigure contains groups of eight bars that allow comparison between measured (with suffix “_m”) and calculated (with suffix “_c”) values for the monofacial panel P6 (E6), the bifacial panel P5 (E5), and its front (E5_f) and rear (E5_r) sides. The comparison shows that the calculated values are close to the measured values for all surfaces and all seasons. The root mean square error for the total daily energy produced is 3.85% for the monofacial panel and 4.01% for the bifacial panel. The errors on produced energies and RRMSE errors for the produced power are summarized in Table 5.
Using the same days and measurements, a comparative analysis is performed of the energy produced by the monofacial and the two bifacial panels. The results are presented in Figure 20, where the normalized daily energies of the three panels in kWh/kW are compared for each reflecting surface and different seasons. The diamond shape in the chart below indicates the gain that the bifacial panel (P5) has relative to the monofacial panel (P6) Gain_b = 100 × (E5 − E6)/E5 [%] while the circles indicate the position-based gain that the outermost bifacial panel (P7) has relative to the internally placed bifacial panel (P5) Gain_p = 100 × (E7 − E6)/E6 [%].
The bifacial panels produce more than the monofacial panel, confirming the expectation of better performance. Their advantage is greatest with the white nonwoven geotextile which realizes the greatest gain (between 11.59 and 12.68%), followed by the shiny aluminum foil, while the green artificial grass and the patinated sheet metal have worst gain (with small advantage of the second one). The figure shows that the advantage of the outermost bifacial panel is not significant (up to 2.5%) and depends on the reflective surface, with an increase in Gain_p as the reflectance improves. An interesting phenomenon is observed for PSM coverage, since here the inner panel has an advantage. A possible explanation lies in the uneven distribution and degree of patination of the sheet metal, and the fact that the sheet metal is corrugated. This analysis allows us to recommend the use of white or shiny coatings whenever possible to increase the energy produced by the bifacial panels.
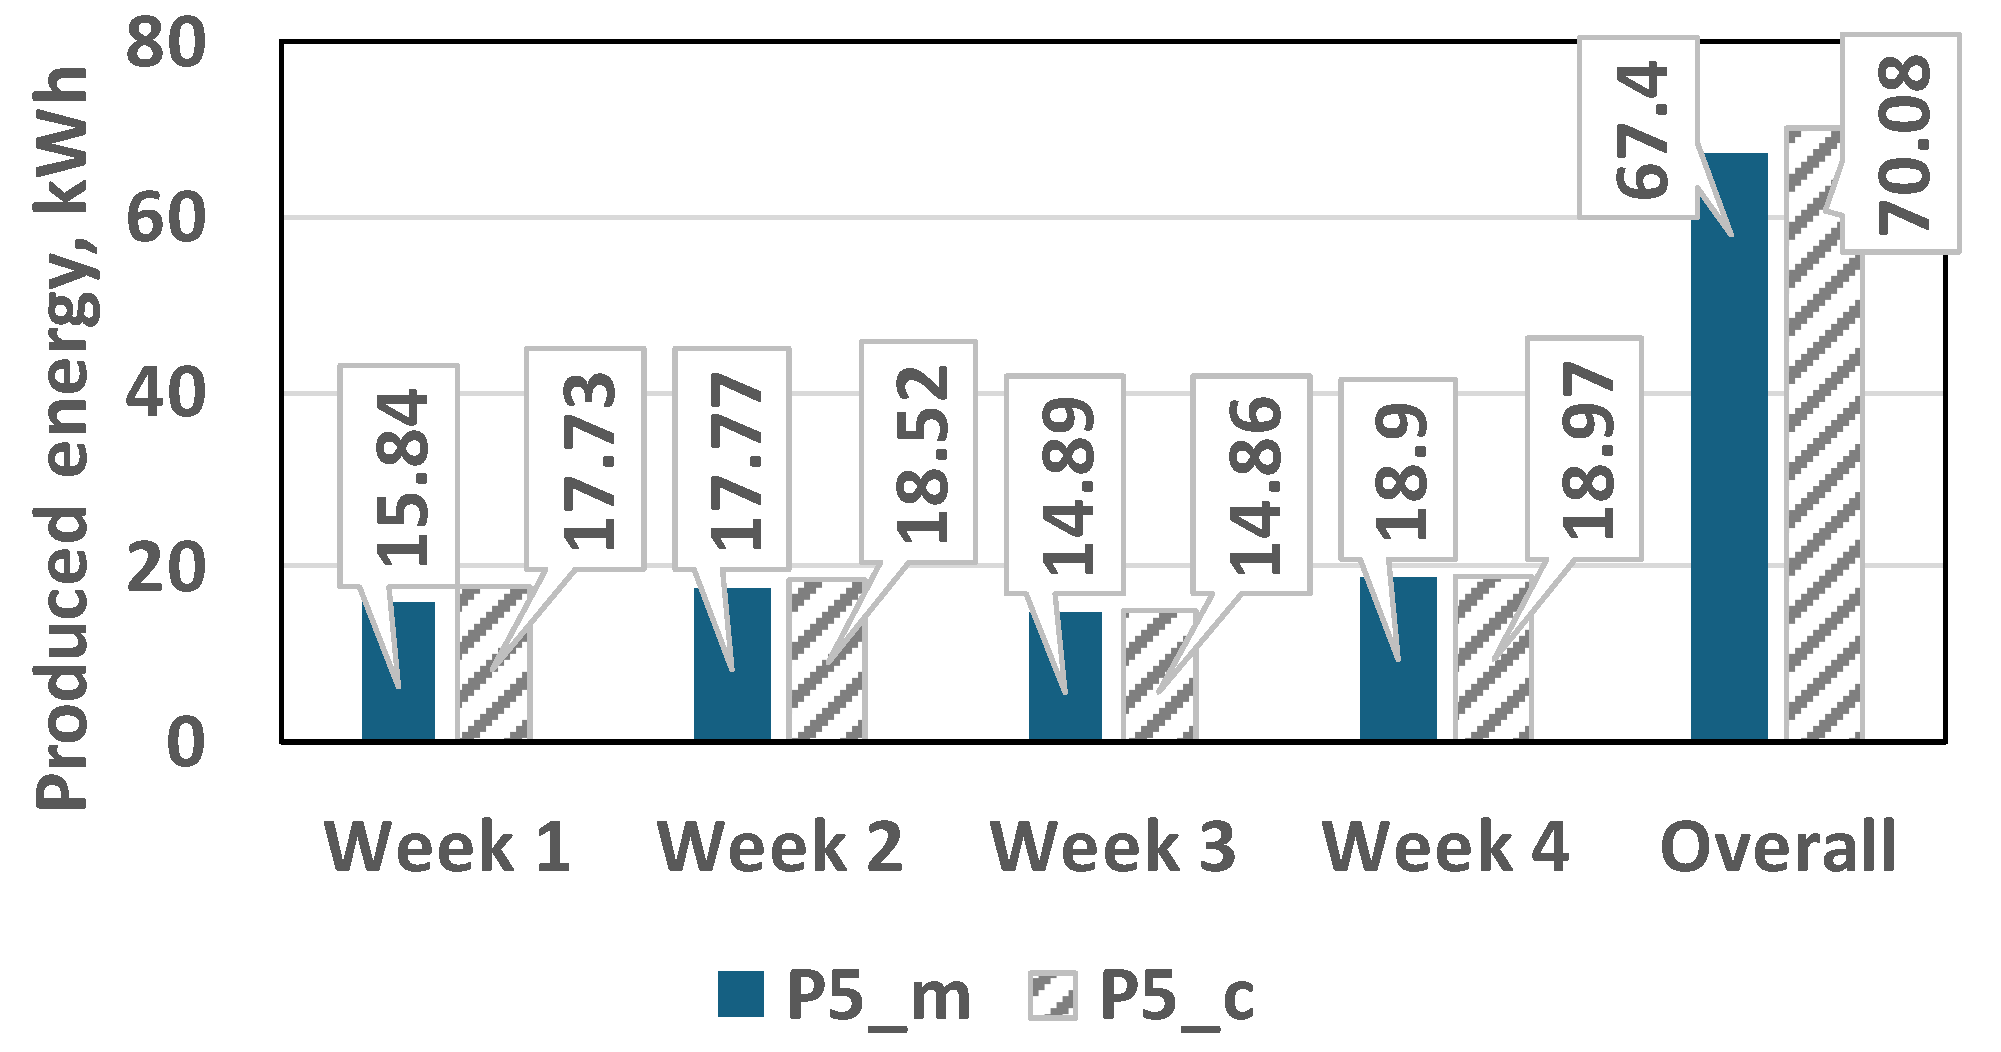
The results in Figure 20 show that the white nonwoven geotextile is the most efficient reflective surface among the ones studied. That is why an additional performance analysis of the bifacial PV panel with WNG was performed using data for four different weeks in different seasons during the year: 19–25 July 2024, 27 September–3 October 2024, 4–10 February 2025, and 15–21 June 2025. Figure 21 shows the comparison between the measured and calculated energy for each week individually and for the sum of the four weeks. Larger deviations are observed in the weeks that have days with rapid and large changes in solar irradiance.

5. Discussion

The original experimental PV platform developed in this study enables simultaneous testing of monofacial and bifacial panels under identical conditions. With individual optimizers for each panel, various bifacial configurations can be evaluated, allowing detailed data collection and deeper experimental analysis to support theoretical modeling.
The experimental results presented in this study confirm the validity and practical applicability of the proposed modified Durisch’s model for both monofacial and bifacial PV panels. The development of the proposed model follows a structured methodology as described in Section 3.
An important advantage of the proposed model is that there are no limitations on time step, geographical location and orientation of the panels. The model is applicable as long as the solar/reflected irradiance on the front and rear surfaces of the panel and its temperature are known. It can be used for estimating the PV energy production for different time periods—from minutes to weeks and months as it is demonstrated in Figure 21. A key strength of the model is its ability to isolate and independently model the front and rear contributions of bifacial panels, providing a robust framework for productivity prediction and optimization. To leverage this advantage, an original approach is proposed for separating the experimentally obtained power and energy of the front and rear sides of bifacial panels using a reference monofacial panel.
The model demonstrates good accuracy for calculating the PV panels’ power under varying meteorological conditions, with RRMSE values below 8% on sunny days (Figure 16) and below 9% under cloudy conditions (Figure 17).
For daily energy production, the model shows errors between −7.08% and +5.90% for monofacial panels and between −4.68% and +10.11% for bifacial panels across the four seasons.
A comparison with results from other authors is presented below.
The models used in [27,37] for determining the power output and energy production of bifacial panels are simple and essentially identical. The results obtained using the model described in these papers for the days shown in Figure 16 and Figure 17 are as follows: the RRMSE for the generated power of monofacial panels is 21.5% on a sunny day and 29.9% on a cloudy day, while for the bifacial panel it is 18.3% on a sunny day and 22.9% on a cloudy day. In [35], a significantly more complex electrical model was used to determine power output, resulting in reported errors for monofacial panels of 1.2% on a sunny day and 8% on a cloudy day, and for bifacial panels, errors ranged from 0.6% to 2.9% on sunny days and from 4.5% to 18.5% on cloudy days. However, the model in [34] has not been validated for different seasons. In [32], where another modification of Durisch model was used, the reported error is 3.33% but only for the panel efficiency.
The errors obtained using the model proposed in this paper are 7.06% and 8.73% for monofacial panels, and 7.55% and 4.83% for bifacial panels. These results demonstrate that the accuracy of the proposed model surpasses that of simpler models and is comparable to the accuracy of more complex models for determining the power output and performance of mono- and bifacial PV panels. The significant difference in accuracy compared to the models in [27,37] is primarily due to their omission of the impact of cell temperature on the generated power.
The model’s accuracy is primarily determined by the precision of PV power and irradiance measurements. While measurements are generally reliable at irradiance levels above 500 W/m2, their uncertainty increases significantly below 200 W/m2 [66], resulting in greater variability in efficiency values (Figure 9 and Figure 10). Since the rear side of bifacial panels most often operates within this low-irradiance range, the model exhibits larger deviations under such conditions. Temperature, by contrast, has a relatively minor effect on efficiency, and with a typical measurement error of 2–3 °C, its influence on the model’s accuracy is negligible.
This level of precision is particularly notable given the model’s simplicity and the fact that it operates independently of commercial simulation software.
The study also revealed that the rear side of the examined bifacial panels used for experiments delivered between 67% and 83% (with an average of 75%) of the power generated by the front side, when both sides are exposed to the same global solar irradiance. The values for bifaciality reported by other authors are: 83% in [27], 70% in [35] and 90% in [51]. A possible explanation for these differences is that the panels are produced by a different technology and have different physical configurations of the rear side. This result shows that the rear side of studied bifacial panels has lower productivity compared to some other bifacial panel types.
The experiments also underscore the significant impact of the reflective surface beneath the panels. Among the tested materials, white nonwoven geotextile and shiny aluminum foil give the highest rear-side irradiance, with the geotextile performing slightly better. These results align with expectations based on surface albedo and confirm the importance of surface selection in bifacial PV system design, particularly in agricultural settings.
A comparative analysis between bifacial and monofacial panels under identical conditions shows a clear advantage for bifacial panels. Depending on the reflective surface used, bifacial panels generated between 7% and 12% more energy. The biggest gain for bifacial panels productivity is yielded by white nonwoven geotextile which increases the energy production by 12% on average, while the shiny aluminum foil gives 10%, the PSM—8.2% and GAG—7.1%. These values are consistent with results reported by other authors. For example, in [67], a 14.4% increase was observed with white nonwoven fabric and 11.1% with artificial grass. In [37], an increase ranging from 6.54% to 12.44% across different months was reported. The study in [35] showed a 9.56% increase in bifacial panel output compared to monofacial panels when a white-painted reflective surface was used. The larger difference in the case of artificial grass can be attributed to the fact that the GAG used in [67] is lighter in color and has better reflective properties than the grass used in this study.
These results confirm higher productivity of bifacial panels and their potential for better performance under different real conditions.

6. Conclusions

This study presents a physically grounded, experimentally validated model for predicting the performance of mono- and bifacial PV panels under real-world conditions. The modified Durisch’s model, adapted to separately account for the front and rear irradiance of bifacial panels, offers a practical and accurate alternative to commercial simulation tools. Key conclusions include:
  • The model is not subject to restrictions related to the position of the panels and is feasible provided that the solar irradiance in the plane of the front and rear sides of the panel is known.
  • The proposed model demonstrates consistently good accuracy across a wide range of operating conditions, reflective surfaces, and seasons.
  • The reflective surface type has a substantial impact on rear-side irradiance, with white non-woven geotextile and shiny aluminum foil providing the best results.
  • Bifacial panels consistently outperform monofacial panels in energy yield, confirming their suitability for agricultural and hybrid energy systems.
The developed experimental platform and models can support feasibility studies and system design for PV installations in agricultural environments, particularly where software-independent, cost-effective modeling is desired.
The model can be applied in future research focused on the optimal placement, orientation, reflecting surfaces and structural integration of agrivoltaic systems, as well as photovoltaic installations at livestock farms, auxiliary buildings, sheds, irrigation systems, charging stations, and similar infrastructure. From an electrical engineering perspective, the model is suitable for analyzing photovoltaic system performance in both autonomous (off-grid) and grid-connected modes. Additionally, it supports studies involving hybrid energy systems that incorporate storage solutions and biogas installations.

Author Contributions

Conceptualization, V.L. and L.S.; methodology, V.L. and Z.Z.; software, I.B.; validation, I.B., L.S. and Z.Z.; investigation, V.M.; resources, V.M.; data curation, I.B.; writing—original draft preparation, L.S. and Z.Z.; writing—review and editing, V.L.; supervision, L.S. and V.L.; project administration, L.S.; funding acquisition, L.S. All authors have read and agreed to the published version of the manuscript.

Funding

This research was funded by the Bulgarian National Science Fund grant № KП-06-Н77/2 project “Research and optimization of hybrid system with renewable energy sources for power supply of livestock farm”.

Institutional Review Board Statement

Not applicable.

Informed Consent Statement

Not applicable.

Acknowledgments

The authors thanks to the Bulgarian National Science Fund grant № KП-06-Н77/2 project “Research and optimization of hybrid system with renewable energy sources for power supply of livestock farm”.

Conflicts of Interest

The authors declare no conflicts of interest. The funders had no role in the design of the study; in the collection, analyses, or interpretation of data; in the writing of the manuscript; or in the decision to publish the results.

Abbreviations and Symbols

The following abbreviations and symbols are used in this manuscript:
AMkg/m3Air mass density
AM0, kg/m3Reference air mass
DFEDegree of Freedom in the Error
E, WhEnergy produced by the PV panel
E5, WhDaily energy production of the bifacial panel P5
E5_BF, WhSeparated daily energy using bifacial panel with covered rear side
E5_c, WhCalculated daily energy for the bifacial panel (P5)
E5_f_c, WhCalculated daily energy for the front side of the bifacial panel (P5)
E5_f_m, WhMeasured daily energy for the front side of the bifacial panel (P5)
E5_m, WhMeasured daily energy for the bifacial panel (P5)
E5_MF, WhSeparated daily energy using monofacial reference panel
E5_r_c, WhCalculated daily energy for the rear side of the bifacial panel (P5)
E5_r_m, WhMeasured daily energy for the rear side of the bifacial panel (P5)
E5front_MF, WhFront-side energy, derived from the monofacial panel
E5rear_MF, WhRear-side energy
E6_c, WhCalculated daily energy for the monofacial panel (P6)
E6_m, WhMeasured daily energy for the monofacial panel (P6)
E7front, WhFront-side energy, measured from the second bifacial panel with its rear side obscured
Ga, W/m2Solar irradiance in the panels’ plane
GaF, W/m2Solar irradiance on the front side of the panel
GAGGreen Artificial Grass
Gain bGain of the bifacial over the monofacial panel
Gain pGain of the externally placed bifacial panel P7 over the internally placed one P5
GaR, W/m2Irradiance on the rear side of the panel
Garef, W/m2Reference solar irradiance
k Intercept (power at 0 °C) at given solar irradiance value Ganorm
LCOE, $/kWhLevelized Cost Of Energy
N Number of intervals in the entire time period
n Slope (change in power per °C) at given solar irradiance value Ganorm
NeNumber of measured values
NOCTNominal Operating Cell Temperature
P, WElectrical power generated by the PV panel
P(P6), WPower of reference monofacial panel P6
p, q, m, r, s, uEmpirical unitless coefficients specific to each PV panel type
PBF, WOutput power of the bifacial panel
pF, qF, mF, rFModel unitless coefficients for the front side
Pfront, WPower generated by the front side
PGa, WMeasured power of the panel at the actual irradiance Ga
PGanorm, WPower the panel would produce at the solar irradiance Ganorm
Pj, WPower during the j-th time interval
pR, qR, mR, rRModel unitless coefficients for the rear side
Prat, WRated power of the panels
Prat(P5), Wrated power of the bifacial panel (P5)
Prat(P6), WRated power of the monofacial panel (P6)
Prear, WPower generated by the rear side
PSMPatinated Sheet Metal
PTcref, WPanel power at the solar irradiance Ga and the reference cell temperature Tcref
PVPhotovoltaic
RMSERoot Mean Square Error
RRMSE, %Relative Root Mean Square Error
S, m2Panel surface area
SAFShiny aluminum foil
SSESum of Squared Errors
STCStandard Test Conditions
Tc, °CCell temperature
Tcref, °CReference cell temperature
ti, s, min, h, etc.Time interval over which the energy is calculated
WNGWhite Nonwoven Geotextile
X , W or WhMean value of the measured quantity
xi, W or WhMeasured values of the compared quantities
yi, W or WhCalculated values of the compared quantities
Δt s, min or h etc.Time step used for discretization
ηPVEfficiency of a given photovoltaic panel
ηPVFEfficiency of the front side
ηPVREfficiency of the rear side
ηPVTcrefPanel efficiency at the reference cell temperature Tcref

References

  1. Food and Agriculture Organization of the United Nations. An issues note produced for the G20 Presidency of the Kingdom of Saudi Arabia. In Water and Agriculture; Food and Agriculture Organization of the United Nations: Rome, Italy, 2021. [Google Scholar]
  2. Tian, J.; Culley, S.A.; Maier, H.R.; Zecchin, A.C. Is renewable energy sustainable? Potential relationships between renewable energy production and the Sustainable Development Goals. NPJ Clim. Action 2024, 3, 35. [Google Scholar] [CrossRef]
  3. REN 21. Renewables 2024 Global Status Report: Global Overview, REN 21 Report. Available online: https://www.ren21.net/gsr-2024/ (accessed on 19 February 2025).
  4. Osama, A.; Tina, G.M.; Mannino, G.; Cucuzza, A.V.; Bizzarri, F. Experimental and Numerical Performance Assessment of East-West Bifacial Photovoltaic Floating System in Freshwater Basins. IEEE Access 2024, 12, 141425–141447. [Google Scholar] [CrossRef]
  5. NREL, Best Research—Cell Efficiency Chart. Available online: https://www.nrel.gov/pv/cell-efficiency.html (accessed on 21 February 2025).
  6. IEA PVPS. Annual Report 2023. Available online: https://iea-pvps.org/wp-content/uploads/2024/05/PVPS_Annual_Report_2023_v4-6.pdf (accessed on 25 February 2025).
  7. Rokicki, T.; Perkowska, A.; Klepacki, B.; Bórawski, P.; Bełdycka-Bórawska, A.; Michalski, K. Changes in Energy Consumption in Agriculture in the EU Countries. Energies 2021, 14, 1570. [Google Scholar] [CrossRef]
  8. Trommsdorff, M.; Dhal, I.S.; Özdemir, Ö.E.; Ketzer, D.; Weinberger, N.; Rösch, C. Agrivoltaics: Solar Power Generation and Food Production. In Solar Energy Advancements in Agriculture and Food Production Systems; Gorjian, S., Campana, P.E., Eds.; Academic Press: Cambridge, MA, USA, 2022; pp. 159–210. [Google Scholar] [CrossRef]
  9. Goetzberger, A.; Zastrow, A. On the Coexistence of Solar-Energy Conversion and Plant Cultivation. Int. J. Sol. Energy 1982, 1, 55–69. [Google Scholar] [CrossRef]
  10. Waller, R.; Kacira, M.; Magadley, E.; Teitel, M.; Yehia, I. Evaluating the Performance of Flexible, Semi-Transparent Large-Area Organic Photovoltaic Arrays Deployed on a Greenhouse. AgriEngineering 2022, 4, 969–992. [Google Scholar] [CrossRef]
  11. Höhendinger, M.; Krieg, H.-J.; Dietrich, R.; Rauscher, S.; Hartung, C.; Stumpenhausen, J.; Bernhardt, H. Requirements and Economic Implications of Integrating a PV-Plant-Based Energy System in the Dairy Production Process. AgriEngineering 2023, 5, 2196–2215. [Google Scholar] [CrossRef]
  12. Neto, A.J.S.; Lopez, D.C.; Nascimento, S.T. Potential of Grid-Connected Photovoltaic Systems in Brazilian Dairy Farms. AgriEngineering 2022, 4, 122–133. [Google Scholar] [CrossRef]
  13. Ndukwu, M.C.; Usoh, G.; Akpan, A.; Akuwueke, L.; Ecop, I. Development of a Small Dual-Chamber Solar PV-Powered Evaporative Cooling System for Fruit and Vegetable Cooling with Techno-Economic Assessment. AgriEngineering 2024, 6, 2553–2576. [Google Scholar] [CrossRef]
  14. Gomez-Soto, D. Integration of Crops, Livestock, and Solar Panels: A Review of Agrovoltaic Systems. Agronomy 2024, 14, 1824. [Google Scholar] [CrossRef]
  15. Anusuya, K.; Vijayakumar, K.; Leenus, J.M.; Manikandan, S. Agrophotovoltaics: Enhancing Solar Land Use Efficiency for Energy-Food-Water Nexus. Renew. Energy Focus 2024, 50, 100600. [Google Scholar] [CrossRef]
  16. Sasaya, S.; Liangling, Y.; Hoshino, Y.; Noguchi, T. Development of an Automatic Harvester for Wine Grapes by Using Three-Axis Linear Motion Mechanism Robot. AgriEngineering 2024, 6, 4203–4219. [Google Scholar] [CrossRef]
  17. Bastos, K.M.; Barcelos, J.P.; Orioli, G.F.; Nascimento, S.T. Use of Drones for Trough Reading, Animal Counting, and Production Monitoring in Feedlot Systems. AgriEngineering 2024, 6, 4460–4475. [Google Scholar] [CrossRef]
  18. Maniscalco, M.P.; Longo, S.; Miccichè, G.; Cellura, M.; Ferraro, M. A Critical Review of the Environmental Performance of Bifacial Photovoltaic Panels. Energies 2024, 17, 226. [Google Scholar] [CrossRef]
  19. Jamil, U.; Bonnington, A.; Pearce, J.M. The Agrivoltaic Potential of Canada. Sustainability 2023, 15, 3228. [Google Scholar] [CrossRef]
  20. IEA PVPS. Best Practices for the Optimization of Bifacial Photovoltaic Tracking Systems. Available online: https://iea-pvps.org/key-topics/best-practices-for-the-optimization-of-bifacial-photovoltaic-tracking-systems/ (accessed on 7 March 2025).
  21. Braga, D.S.; Kazmerski, L.L.; Cassini, D.A.; Camatta, V.; Diniz, A.S.A.C. Performance of Bifacial PV Modules under Different Operating Conditions in the State of Minas Gerais, Brazil. Renewable. Energy Environ. Sustain. 2023, 8, 23. [Google Scholar] [CrossRef]
  22. VDMA. International Technology Roadmap for Photovoltaic (ITRPV). Available online: https://www.vdma.org/international-technology-roadmap-photovoltaic (accessed on 6 March 2025).
  23. Kopecek, R.; Libal, J. Bifacial Photovoltaics 2021: Status, Opportunities and Challenges. Energies 2021, 14, 2076. [Google Scholar] [CrossRef]
  24. Mouhib, E.; Micheli, L.; Almonacid, F.M.; Fernández, E.F. Overview of the Fundamentals and Applications of Bifacial Photovoltaic Technology: Agrivoltaics and Aquavoltaics. Energies 2022, 15, 8777. [Google Scholar] [CrossRef]
  25. Patel, M.T.; Khan, M.R.; Sun, X.; Alam, M.A. A Worldwide Cost-Based Design and Optimization of Tilted Bifacial Solar Farms. Appl. Energy 2019, 247, 467–479. [Google Scholar] [CrossRef]
  26. Riaz, M.H.; Imran, H.; Butt, N.Z. Optimization of PV Array Density for Fixed Tilt Bifacial Solar Panels for Efficient Agrivoltaic Systems. In Proceedings of the 2020 47th IEEE Photovoltaic Specialists Conference (PVSC), Calgary, AB, Canada, 15 June–21 August 2020; pp. 1349–1352. [Google Scholar] [CrossRef]
  27. Cha, H.L.; Bhang, B.G.; Park, S.Y.; Choi, J.H.; Ahn, H.K. Power Prediction of Bifacial Si PV Module with Different Reflection Conditions on Rooftop. Appl. Sci. 2018, 8, 1752. [Google Scholar] [CrossRef]
  28. Asgharzadeh, A.; Deline, C.; Stein, J.; Toor, F. A Comparison Study of the Performance of South/North-Facing vs East/West-Facing Bifacial Modules under Shading Condition. In Proceedings of the 2018 IEEE 7th World Conference on Photovoltaic Energy Conversion (WCPEC), Waikoloa, HI, USA, 10–15 June 2018; pp. 1730–1734. [Google Scholar] [CrossRef]
  29. Asgharzadeh, A.; Marion, B.; Deline, C.; Hansen, C.; Stein, J.S.; Toor, F. A Sensitivity Study of the Impact of Installation Parameters and System Configuration on the Performance of Bifacial PV Arrays. IEEE J. Photovolt. 2018, 8, 798–805. [Google Scholar] [CrossRef]
  30. Mikofski, M.A.; Darawali, R.; Hamer, M.; Neubert, A.; Newmiller, J. Bifacial Performance Modeling in Large Arrays. In Proceedings of the 2019 IEEE 46th Photovoltaic Specialists Conference (PVSC), Chicago, IL, USA, 16–21 June 2019; pp. 1282–1287. [Google Scholar] [CrossRef]
  31. Evans, D.L. Simplified Method for Predicting Photovoltaic Array Output. Sol. Energy 1981, 27, 555–560. [Google Scholar] [CrossRef]
  32. Abe, C.F.; Notton, G.; Faggianelli, G.-A.; Dias, J.B.; Wander, P.R. Adapting the Durisch Model for Bifacial Silicon and High Concentration Multijunction Photovoltaic Modules Efficiency Prediction. Renew. Energy 2025, 238, 122034. [Google Scholar] [CrossRef]
  33. Durisch, W.; Bitnar, B.; Mayor, J.C.; Kiess, H.; Lam, K.H.; Close, V. Efficiency model for photovoltaic modules and demonstration of its application to energy yield estimation. Sol. Energy Mater. Sol. Cells 2007, 91, 79–84. [Google Scholar] [CrossRef]
  34. Mannino, G.; Tina, G.M.; Jiménez-Castillo, G.; Cacciato, M.; Bizzarri, F.; Canino, A. Nonlinear and Multivariate Regression Models of Current and Voltage at Maximum Power Point of Bifacial Photovoltaic Strings. Sol. Energy 2024, 269, 112357. [Google Scholar] [CrossRef]
  35. Bouchakour, S.; Valencia-Caballero, D.; Luna, A.; Roman, E.; Boudjelthia, E.A.K.; Rodríguez, P. Modelling and Simulation of Bifacial PV Production Using Monofacial Electrical Models. Energies 2021, 14, 4224. [Google Scholar] [CrossRef]
  36. Ahmed, E.M.; Aly, M.; Mostafa, M.; Rezk, H.; Alnuman, H.; Alhosaini, W. An Accurate Model for Bifacial Photovoltaic Panels. Sustainability 2023, 15, 509. [Google Scholar] [CrossRef]
  37. Yakubu, R.O.; Ankoh, M.T.; Mensah, L.D.; Quansah, D.A.; Adaramola, M.S. Predicting the Potential Energy Yield of Bifacial Solar PV Systems in Low-Latitude Region. Energies 2022, 15, 8510. [Google Scholar] [CrossRef]
  38. Deotti, L.; Silva Júnior, I.; Honório, L.; Marcato, A. Empirical Models Applied to Distributed Energy Resources—An Analysis in the Light of Regulatory Aspects. Energies 2021, 14, 326. [Google Scholar] [CrossRef]
  39. Li, C.; Zhang, W.; Liu, F.; Li, X.; Wang, J.; Li, C. Multi-Objective Optimization of Bifacial Photovoltaic Sunshade: Towards Better Optical, Electrical and Economical Performance. Sustainability 2024, 16, 5977. [Google Scholar] [CrossRef]
  40. Ayadi, O.; Rinchi, B.; Al-Dahidi, S.; Abdalla, M.E.B.; Al-Mahmodi, M. Techno-Economic Assessment of Bifacial Photovoltaic Systems under Desert Climatic Conditions. Sustainability 2024, 16, 6982. [Google Scholar] [CrossRef]
  41. Jakobsen, M.L.; Thorsteinsson, S.; Behrensdorff Poulsen, P.; Rødder, P.M.; Rødder, K. Vertical Reflector for Bifacial PV-Panels. In Proceedings of the 2016 IEEE 43rd Photovoltaic Specialists Conference (PVSC), Portland, OR, USA, 5–10 June 2016; pp. 2678–2681. [Google Scholar] [CrossRef]
  42. Cosgun, A.E.; Demir, H. Investigating the Effect of Albedo in Simulation-Based Floating Photovoltaic System: 1 MW Bifacial Floating Photovoltaic System Design. Energies 2024, 17, 959. [Google Scholar] [CrossRef]
  43. Zhang, C.; Shen, H.; Liu, H. The Influence of the Installation Condition and Performance of Bifacial Solar Modules on Energy Yield. Energies 2023, 16, 7396. [Google Scholar] [CrossRef]
  44. Lee, S.-M.; Lee, E.-C.; Lee, J.-H.; Yu, S.-H.; Heo, J.-S.; Lee, W.-Y.; Kim, B.-S. Analysis of the Output Characteristics of a Vertical Photovoltaic System Based on Operational Data: A Case Study in Republic of Korea. Energies 2023, 16, 6971. [Google Scholar] [CrossRef]
  45. Santos de Araújo, J.V.; de Lucena, M.P.; da Silva Netto, A.V.; Gomes, F.d.S.V.; Oliveira, K.C.d.; de Souza Neto, J.M.R.; Cavalcante, S.L.; Morales, L.R.V.; Villanueva, J.M.M.; Macedo, E.C.T.d. Solar Tracking Control Algorithm Based on Artificial Intelligence Applied to Large-Scale Bifacial Photovoltaic Power Plants. Sensors 2024, 24, 3890. [Google Scholar] [CrossRef] [PubMed]
  46. Riedel-Lyngskær, N.; Berrian, D.; Alvarez Mira, D.; Aguilar Protti, A.; Poulsen, P.B.; Libal, J.; Vedde, J. Validation of Bifacial Photovoltaic Simulation Software against Monitoring Data from Large-Scale Single-Axis Trackers and Fixed Tilt Systems in Denmark. Appl. Sci. 2020, 10, 8487. [Google Scholar] [CrossRef]
  47. Zdyb, A.; Sobczyński, D. An Assessment of a Photovoltaic System’s Performance Based on the Measurements of Electric Parameters under Changing External Conditions. Energies 2024, 17, 2197. [Google Scholar] [CrossRef]
  48. Pike, C.; Whitney, E.; Wilber, M.; Stein, J.S. Field Performance of South-Facing and East-West Facing Bifacial Modules in the Arctic. Energies 2021, 14, 1210. [Google Scholar] [CrossRef]
  49. Cho, J.; Park, S.M.; Park, A.R.; Lee, O.C.; Nam, G.; Ra, I.-H. Application of Photovoltaic Systems for Agriculture: A Study on the Relationship between Power Generation and Farming for the Improvement of Photovoltaic Applications in Agriculture. Energies 2020, 13, 4815. [Google Scholar] [CrossRef]
  50. Jang, J.; Lee, K. Practical Performance Analysis of a Bifacial PV Module and System. Energies 2020, 13, 4389. [Google Scholar] [CrossRef]
  51. Park, H.; Chang, S.; Park, S.; Kim, W.K. Outdoor Performance Test of Bifacial n-Type Silicon Photovoltaic Modules. Sustainability 2019, 11, 6234. [Google Scholar] [CrossRef]
  52. Mahmood, K.; Hussain, A.; Arslan, M.; Tariq, B. Experimental Investigation of Impact of Cool Roof Coating on Bifacial and Monofacial Photovoltaic Modules. Eng. Proc. 2023, 45, 38. [Google Scholar] [CrossRef]
  53. González-Moreno, A.; Mazzeo, D.; Dolara, A.; Ogliari, E.; Leva, S. Outdoor Performance Comparison of Bifacial and Monofacial Photovoltaic Modules in Temperate Climate and Industrial-like Rooftops. Appl. Sci. 2024, 14, 5714. [Google Scholar] [CrossRef]
  54. Bowersox, D.; TamizhMani, G. Design and Construction of Controlled Back Reflectors for Bifacial Photovoltaic Modules. In Proceedings of the 2018 IEEE 7th World Conference on Photovoltaic Energy Conversion (WCPEC), Waikoloa, HI, USA, 10–15 June 2018; pp. 1735–1740. [Google Scholar] [CrossRef]
  55. Carbone, R.; Borrello, C. A Building-Integrated Bifacial and Transparent PV Generator Operated by an “Under-Glass” Single Axis Solar Tracker. Energies 2023, 16, 6350. [Google Scholar] [CrossRef]
  56. Cabral, D.; Hayati, A.; Gomes, J.; Gorouh, H.A.; Nasseriyan, P.; Salmanzadeh, M. Experimental Electrical Assessment Evaluation of a Vertical n-PERT Half-Size Bifacial Solar Cell String Receiver on a Parabolic Trough Solar Collector. Energies 2023, 16, 2007. [Google Scholar] [CrossRef]
  57. Abdallah, A.A.; Kivambe, M.; Aïssa, B.; Figgis, B.W. Performance of Monofacial and Bifacial Silicon Heterojunction Modules under Desert Conditions and the Impact of PV Soiling. Sustainability 2023, 15, 8436. [Google Scholar] [CrossRef]
  58. Bhaduri, S.; Kottantharayil, A. Mitigation of Soiling by Vertical Mounting of Bifacial Modules. IEEE J. Photovolt. 2019, 9, 240–244. [Google Scholar] [CrossRef]
  59. Kim, S.M.; Jung, S.H.; Choi, R.-W.; Kim, Y.B.; Kang, M.G.; Sonp, H.-E.; Choi, G.-S. A Study of Performance Characterization with Rear Light Source in Conventional Bifacial Solar Cells. In Proceedings of the 2017 IEEE 44th Photovoltaic Specialist Conference (PVSC), Washington, DC, USA, 25–30 June 2017; pp. 2723–2727. [Google Scholar] [CrossRef]
  60. Newman, B.K.; Carr, A.J.; Jansen, M.J.; Goma, E.G.; Kloos, M.J.H.; de Groot, K.M.; van Aken, B.B. Comparison of Bifacial Module Measurement Methods with Optically Optimized Bifacial Modules. In Proceedings of the 2018 IEEE 7th World Conference on Photovoltaic Energy Conversion (WCPEC), Waikoloa, HI, USA, 10–15 June 2018; pp. 3593–3597. [Google Scholar] [CrossRef]
  61. Xie, Y.; Wang, F.; Xu, C.; Yue, X.; Yang, S. Applying Artificial Cover to Reduce Melting in Dagu Glacier in the Eastern Qinghai-Tibetan Plateau. Remote Sens. 2023, 15, 1755. [Google Scholar] [CrossRef]
  62. The Engineering ToolBox. Materials—Light Reflecting Factors. Available online: https://www.engineeringtoolbox.com/light-material-reflecting-factor-d_1842.html (accessed on 11 August 2025).
  63. Kaarsberg, T.; Akbari, H. Cool Roofs Cool the Planet; Home Energy Magazine: Berkeley, CA, USA, 2006; pp. 38–41. Available online: https://eta-publications.lbl.gov/sites/default/files/HomeEnergy06%20(Cool%20Roofs%20Cool%20the%20Planet).pdf (accessed on 11 August 2025).
  64. Yaghoobian, N.; Kleissl, J.; Krayenhoff, E.S. Modeling the Thermal Effects of Artificial Turf on the Urban Environment. J. Appl. Meteorol. Climatol. 2010, 49, 332–345. [Google Scholar] [CrossRef]
  65. Zarkov, Z.; Stoyanov, L.; Kanchev, H.; Milenov, V.; Lazarov, V. Study of Photovoltaic Systems’ Performances with Different Module Types. Mater. Sci. Forum 2016, 856, 279–284. [Google Scholar] [CrossRef]
  66. IEC 61215-1:2021; Terrestrial Photovoltaic (PV) Modules—Design Qualification and Type Approval—Part 1: Test Requirements. IEC: Geneva, Switzerland, 2021.
  67. Seo, Y.; Park, H.; Yoo, Y.; Kim, M.; Oh, S.-Y.; Alhammadi, S.; Chang, S.; Park, S.-H.; Lee, J.; Mun, S.; et al. Effect of Front Irradiance and Albedo on Bifacial Gain in 1 8kW Bifacial Silicon Photovoltaic System. In Proceedings of the 2019 IEEE 46th Photovoltaic Specialists Conference (PVSC), Chicago, IL, USA, 16–21 June 2019; pp. 1298–1301. [Google Scholar] [CrossRef]
Figure 1. Growth of worldwide bifacial installations.
Agriengineering 07 00319 g001
Figure 2. Market share of bifacial panels.
Agriengineering 07 00319 g002
Figure 3. Bloc diagram of the experimental platform.
Agriengineering 07 00319 g003
Figure 4. 3D visualization of the PV generator with mixed bifacial (marked as P5 and P7) and monofacial panels (marked as P1, P2, P3, P4, P6 and P8).
Agriengineering 07 00319 g004
Figure 5. SolarEdge webserver optimizer data for current and voltage of two panels: bifacial (1.1.5) and monofacial (1.1.6) for one day.
Agriengineering 07 00319 g005
Figure 6. Picture collage of the experimental PV system with different reflecting surfaces.
Agriengineering 07 00319 g006
Figure 7. Determination of the temperature coefficient r for monofacial PV panel by fitting experimental data on the generated power of a monofacial panel, normalized to a solar irradiance value of 800 or 1000 W/m2.
Agriengineering 07 00319 g007
Figure 8. Determination of the temperature coefficient r for: (a) the front side of the bifacial panel; (b) the rear side of the bifacial panel, exposed to the same solar radiation as the front side.
Agriengineering 07 00319 g008
Figure 9. Determination of the coefficients p, q and m from the calculated efficiency at a reference temperature of 25 °C for the monofacial panel based on efficiency values through fitting with the function from the proposed Model (16). Where: SSE = 0.00354, R-square = 0.9193, Adjusted R-square = 0.9183, RMSE = 0.004781, DFE = 155. SSE—sum of squared errors and DFE—the degree of freedom in the error.
Agriengineering 07 00319 g009
Figure 10. Determination of the coefficients p, q and m from the calculated efficiency at a reference temperature of 25 °C for: (a) the front side of the bifacial panel; (b) the rear side of the bifacial panel.
Agriengineering 07 00319 g010
Figure 11. Experimental results for 12 February 2025: (a) Front and rear solar irradiances and ambient and bifacial module temperatures; (b) Daily energy productions for the different panels.
Agriengineering 07 00319 g011
Figure 12. Variation of the ratio between the powers of rear and front sides of the bifacial panel: (a) For one day; (b) For multiple days in function of solar irradiance in the panel plane.
Agriengineering 07 00319 g012
Figure 13. Variation of the rear side reflected solar irradiance as a function of the incident solar irradiance on the panels’ plane for different reflecting surfaces.
Agriengineering 07 00319 g013
Figure 14. Experimental results for: (a) generated power and module temperature for monofacial and bifacial panels (P5 faces the sun and its rear side is covered, while the rear side of P7 faces the sun and its front side is covered) in real units, and (b) referenced to the rated power and taking into account the module temperature.
Agriengineering 07 00319 g014
Figure 15. Comparison of two methods for separation of bifacial panel energy to front and rear energy for five days from different months. In the graph are shown: (E5) measured daily energy production of the bifacial panel; (E5_MF)—separation of daily energies using monofacial reference panel; (E5_BF)—separation of daily energies using covered bifacial panel.
Agriengineering 07 00319 g015
Figure 16. Model validation with experimental data for sunny day (23 September 2024): (a) Front and rear irradiances and ambient and module temperatures; (b) Comparison of experimental and calculated data for monofacial panel; (c) The same comparison for front and rear sides of the bifacial panel and (d) for the whole bifacial panel.
Agriengineering 07 00319 g016
Figure 17. Model validation with experimental data for a cloudy day (18 September 2024): (a) Front and rear irradiances and ambient and module temperatures; (b) Comparison of experimental and calculated data for a monofacial panel; (c) The same comparison for front and rear sides of the bifacial panel and (d) for the whole bifacial panel.
Agriengineering 07 00319 g017
Figure 18. Comparison of the measured and calculated produced daily energy for monofacial (P6), bifacial panel (P5) and the front (P5front) and rear (P5rear) components of the bifacial panel.
Agriengineering 07 00319 g018
Figure 19. Comparison of measured (suffix “_m”) and calculated (suffix “_c”) daily energies for the monofacial panel P6 (E6), the bifacial panel P5 (E5), its front (E5_f) and rear (E5_r) side for days in different season for four reflecting surfaces: (a) Shiny aluminum foil; (b) White nonwoven geotextile; (c) Green artificial grass and (d) Patinated sheet metal. The number in the data label is the energy for the corresponding bar.
Agriengineering 07 00319 g019
Figure 20. Comparison of the experimental normalized daily energy of monofacial (P6), internally placed bifacial (P5) and externally placed bifacial (P7) panels for different seasons and reflecting surfaces as well as the gain of the bifacial over the monofacial panel (Gain_b) and the gain of the externally placed bifacial panel P7 over the internally placed one P5 (Gain_p).
Agriengineering 07 00319 g020
Figure 21. Comparison of measured and calculated produced energy by the bifacial panel for four weeks separately and their sum.
Agriengineering 07 00319 g021
Table 1. Main parameters of the PV panels used in the study.
ParameterMonofacial
OPTONICA
FV410-A1
Bifacial
SUNRISE
SR-54M430NHLPro
Maximum power, W410430
Open circuit voltage, V37.3038.58
Short circuit current, A13.9314.25
Maximum power voltage, V31.4031.88
Maximum power current, A13.0613.49
Number of cells108108
Module efficiency (front side), %21.0022.03
Table 2. Albedos of the used reflective surfaces.
Reflective SurfaceAlbedoReference
WNG0.39–0.71[61]
SAF0.55–0.75[62]
PSM0.15–0.25[63]
GAG0.1–0.25[64]
Table 3. Values of the temperature coefficient r.
Coefficient rAt 1000 W/m2 At 800 W/m2Average
Monofacial panel r−0.00467−0.00463−0.00465
Front side rF−0.00341−0.00365−0.00353
Rear side rB−0.00312−0.00294−0.00303
Table 4. Values of the efficiency model coefficients for the monofacial panel and for the front and rear sides of the bifacial panel.
Monofacial panelr = −0.00465p = 0.2514q = −0.2040m = 0.1216
Front side of BF panelrF = −0.00353pF = 0.2507qF = −0.1471mF = 0.0969
Rear side of BF panelrR = −0.00303pR = 0.1847qR = −0.1003 mR = 0.1201
Table 5. Comparison of Daily energy error in [%] and RRMSE for power in [%] for the monofacial panel (P6) and bifacial panel (P5) for days in different season for four reflecting surfaces.
Shiny Aluminum FoilWhite Nonwoven Geotextile
PanelSummerAutumnWinterSpringSummerAutumnWinterSpring
Error P6, %3.15−0.74−4.75−0.961.970.00−4.680.38
RRMSE P6, %8.433.395.933.425.153.665.733.64
Error P5, %3.86−1.71−7.08−1.223.302.24−3.360.94
RRMSE P5, %8.703.517.813.545.395.125.355.11
Green Artificial GrassPatinated Sheet Metal
Error P6, %4.17−0.513.65−0.861.67−1.475.31−1.77
RRMSE P6, %8.463.499.483.525.413.189.073.19
Error P5, %0.47−5.41−1.26−5.93−1.36−5.241.15−5.18
RRMSE P5, %5.386.0911.386.133.365.936.485.95
Disclaimer/Publisher’s Note: The statements, opinions and data contained in all publications are solely those of the individual author(s) and contributor(s) and not of MDPI and/or the editor(s). MDPI and/or the editor(s) disclaim responsibility for any injury to people or property resulting from any ideas, methods, instructions or products referred to in the content.