Article

SCS-YOLO: A Lightweight Cross-Scale Detection Network for Sugarcane Surface Cracks with Dynamic Perception

1
School of Information Science and Technology, Yunnan Normal University, Kunming 650500, China
2
Southwest United Graduate School, Kunming 650500, China
3
Faculty of Geography, Yunnan Normal University, Kunming 650500, China
4
Key Laboratory of Resources and Environmental Remote Sensing for Universities in Yunnan Kunming, Kunming 650500, China
5
Center for Geospatial Information Engineering and Technology of Yunnan Province, Kunming 650500, China
*
Author to whom correspondence should be addressed.
AgriEngineering 2025, 7(10), 321; https://doi.org/10.3390/agriengineering7100321
Submission received: 19 August 2025 / Revised: 22 September 2025 / Accepted: 25 September 2025 / Published: 1 October 2025

Abstract

Detecting surface cracks on sugarcane is a critical step in ensuring product quality control, with detection precision directly impacting raw material screening efficiency and economic benefits in the sugar industry. Traditional methods face three core challenges: (1) complex background interference complicates texture feature extraction; (2) variable crack scales limit models’ cross-scale feature generalization capabilities; and (3) high computational complexity hinders deployment on edge devices. To address these issues, this study proposes a lightweight sugarcane surface crack detection model, SCS-YOLO (Surface Cracks on Sugarcane-YOLO), based on the YOLOv10 architecture. This model incorporates three key technical innovations. First, the designed RFAC2f module (Receptive-Field Attentive CSP Bottleneck with Dual Convolution) significantly enhances feature representation capabilities in complex backgrounds through dynamic receptive field modeling and multi-branch feature processing/fusion mechanisms. Second, the proposed DSA module (Dynamic SimAM Attention) achieves adaptive spatial optimization of cross-layer crack features by integrating dynamic weight allocation strategies with parameter-free spatial attention mechanisms. Finally, the DyHead detection head employs a dynamic feature optimization mechanism to reduce parameter count and computational complexity. Experiments demonstrate that on the Sugarcane Crack Dataset v3.1, compared to the baseline model YOLOv10, our model achieves mAP50:95 to 71.8% (up 2.1%). Simultaneously, it achieves significant reductions in parameter count (down 19.67%) and computational load (down 11.76%), while boosting FPS to 122 to meet real-time detection requirements. Considering the multiple dimensions of precision indicators, complexity indicators, and FPS comprehensively, the SCS—YOLO detection framework proposed in this study provides a feasible technical reference for the intelligent detection of sugarcane quality in the raw materials of the sugar industry.

1. Introduction

Sugarcane, as the world’s fifth-largest cash crop [1], holds irreplaceable industrial value in the sugar industry [2], biofuel sector [3], and food processing field [4]. Throughout the entire sugarcane cultivation and harvesting cycle, factors such as drought stress [5], waterlogging stress [6], nutrient imbalance [7], climatic conditions [8], mechanical damage [9], and extreme temperature fluctuations [10] can easily cause structural cracks in the cane surface. This issue has evolved into a major challenge facing the global sugar industry. First, cracks directly degrade cane appearance and raw material quality, initially reducing refined sugar yield. Second, cracks serve as oviposition pathways for stem borers [11] and bacterial infection sites [12], indirectly accelerating raw material loss and increasing processing costs—resulting in annual yield losses of 23–38% [13]. Finally, uneven crack distribution and significant manual inspection errors hinder precise sugarcane grading, substantially diminishing market value. These direct and indirect issues have become a bottleneck constraining the high-quality development of the sugar industry [14].
Addressing the aforementioned industry challenges, developing high-precision sugarcane surface crack detection technology holds significant importance. This technology enables the precise identification of minute surface cracks during the early growth stages of sugarcane, establishing a dynamic crack monitoring system. Based on detection data, it facilitates targeted adjustments to pesticide application rates and irrigation frequency, allowing for human intervention to suppress crack formation. Throughout the entire growth cycle from maturity to harvest, this technology enables quantitative assessment of damage severity. Crack grading guides harvesting sequence, provides a reference for post-harvest quality classification, and delivers objective, precise quantitative crack data to establish scientific quality grading criteria. This technology can reduce the yield losses caused by sugarcane cracking at the source, ensure the stability of the global sugar supply chain, and promote the high-quality development of the sugarcane industry.
Traditional surface crack detection in sugarcane primarily relies on two approaches: manual visual inspection [15] and semi-automated methods based on image processing [16]. Among these, manual visual inspection is constrained by environmental factors and operator experience, resulting in low efficiency and high costs, making it difficult to meet the demands of large-scale production [17]. Traditional image processing methods, exemplified by edge detection [18] and threshold segmentation [19], struggle to handle interference from lighting variations [20] and shadow changes [21] in complex backgrounds [22] or low-contrast scenarios [23]. The loss of target geometric features [24] often causes the failure of multi-scale crack feature fusion [25]. Furthermore, the imbalance between model parameter requirements [26] and the computational power of edge devices [27] hinders efficient deployment [28].
In recent years, with the rapid advancement of deep learning technologies in computer vision [29], object detection methods based on convolutional neural networks (CNNs) [30] and the YOLO (You Only Look Once) series [31] have gained widespread application in agriculture [32], offering new solutions for the automated detection of surface cracks in sugarcane. However, CNN models exhibit high computational complexity [33], posing significant challenges for deployment on resource-constrained edge devices [34]. Furthermore, CNN models demonstrate poor real-time efficiency when processing high-resolution images, making it difficult to achieve real-time monitoring in practical applications for sugarcane surface crack detection [35]. Compared to CNN models, YOLO models have garnered widespread attention for their efficient detection speed and high accuracy [36]. In 2016, Redmon et al. introduced YOLOv1 [37], the inaugural network in the YOLO series, followed by YOLOv3 in 2017, which balanced speed and precision [38]. By 2020, Bochkovskiy et al. proposed YOLOv5 [39], achieving significantly enhanced detection efficiency over previous versions. In 2022, Li et al. introduced YOLOv6 [40], eliminating the need for anchor boxes. It features a more streamlined detection head and employs label allocation strategies alongside the SIOU loss function to further enhance detection precision. In 2023, the Ultralytics team open-sourced the YOLOv8 code [41]. YOLOv8 supports image classification, object detection, and instance segmentation tasks, offering advantages such as high detection speed, precision, multi-task capability, ease of deployment, and automatic hyperparameter tuning. In 2024, researchers from Tsinghua University introduced YOLOv10 [42], which introduced a training method without NMS and optimized model components. Compared to YOLOv8, YOLOv10 significantly reduced the number of parameters and FLOPS while maintaining equivalent performance. Subsequently, the Ultralytics team proposed YOLOv11, utilizing an improved backbone and neck architecture to achieve more precise object detection while optimizing detection efficiency and speed [43].
In the field of object detection, the YOLO series of models has become the preferred choice for detection tasks due to its outstanding real-time performance. However, when applied to the specific scenario of detecting surface cracks on sugarcane, existing YOLO architectures face three critical challenges: First, the morphological features of sugarcane cracks typically exhibit a high aspect ratio with fibrous, irregular topologies. Existing feature extraction mechanisms are prone to losing the local texture features of slender cracks, leading to high model false-negative rates. Second, cracks exhibit significant size variation. The original YOLO model employs a fixed feature fusion architecture based on preset parameters, limiting its feature sensitivity range. This prevents adaptive matching of contextual information across multi-scale cracks, making it difficult to accommodate cracks of different sizes [44] and resulting in low detection precision. Finally, in practical engineering deployment within the sugar industry, the original YOLO model typically requires substantial computational resources, failing to meet the dual demands of lightweight models and real-time processing on edge devices [45]. These challenges collectively form the core obstacles hindering the industrialization of sugarcane crack detection technology.
To address these complex challenges in sugarcane surface crack detection, this study innovatively proposes the SCS-YOLO detection framework. By optimizing the overall YOLOv10 architecture and introducing novel local modules, it achieves a breakthrough balance between detection precision and computational efficiency. SCS-YOLO features the following core innovations:
  • Multi-scale Receptive Field Attention Bottleneck Module (RFAC2f): To address feature loss in slender cracks and multi-scale crack issues, it innovatively integrates the receptive field-level attention mechanism of RFA convolutions with the multi-branch structure of C2f. This provides the model with enhanced spatial feature perception and cross-scale feature fusion capabilities, making it suitable for detecting slender, low-contrast, multi-scale targets like sugarcane cracks.
  • Dynamic Spatial Attention Mechanism (DSA): Deeply integrates dynamically generated convolutional kernels with a parameter-free spatial attention mechanism to capture overall contour features of sugarcane surfaces while focusing on crack texture details. This module enhances the feature extraction network’s ability to capture information from diverse perspectives, improving the model’s modeling capability for the spatial distribution of multi-scale crack features.
  • Dynamic Detection Head Optimization Strategy: Addressing issues in traditional YOLO series detection heads—feature loss, inadequate multi-scale adaptation, and computational redundancy—by replacing them with DyHead. This achieves multi-scale feature adaptive fusion through attention weight allocation and dynamic convolution, enhancing spatial perception of elongated crack features while improving computational efficiency and reducing model parameters and computational load.
The SCS-YOLO network accurately identifies surface cracks on sugarcane in complex environments, enabling early warning and crack monitoring to reduce industry losses. Its lightweight nature adapts to computational constraints of edge devices, advancing mechanization and intelligence in sugarcane cultivation while providing critical technical support for establishing a digital quality control system for the sugarcane industry.

2. Data Preprocessing

2.1. Experimental Data Acquisition

In this study, experimental data were obtained from the publicly available sugarcane surface crack detection dataset from the Roboflow platform. The dataset was generated by an automated annotation tool [46], with resolutions ranging from 1280 × 720 pixels to 1920 × 1080 pixels, and contains a total of 1302 high-resolution images with 1723 annotations, covering scenarios with different lighting conditions and background complexity. According to the cracks on the surface of sugarcane, there are two categories: FIT and UNFIT. As shown in Figure 1, FIT refers to sugarcane stalks with no surface cracks. These stalks feature an intact outer skin structure, normal color, and good accumulation of sugar and water, making them mature, healthy, and suitable for harvesting and industrial utilization. In contrast, UNFIT corresponds to cracked stalks. Due to surface cracks, these stalks are vulnerable to sugar and water loss; additionally, the fiber cells exhibit abnormal cell wall lignification. Such structural and compositional defects render UNFIT stalks unsuitable for processing and utilization.

2.2. Data Augmentation

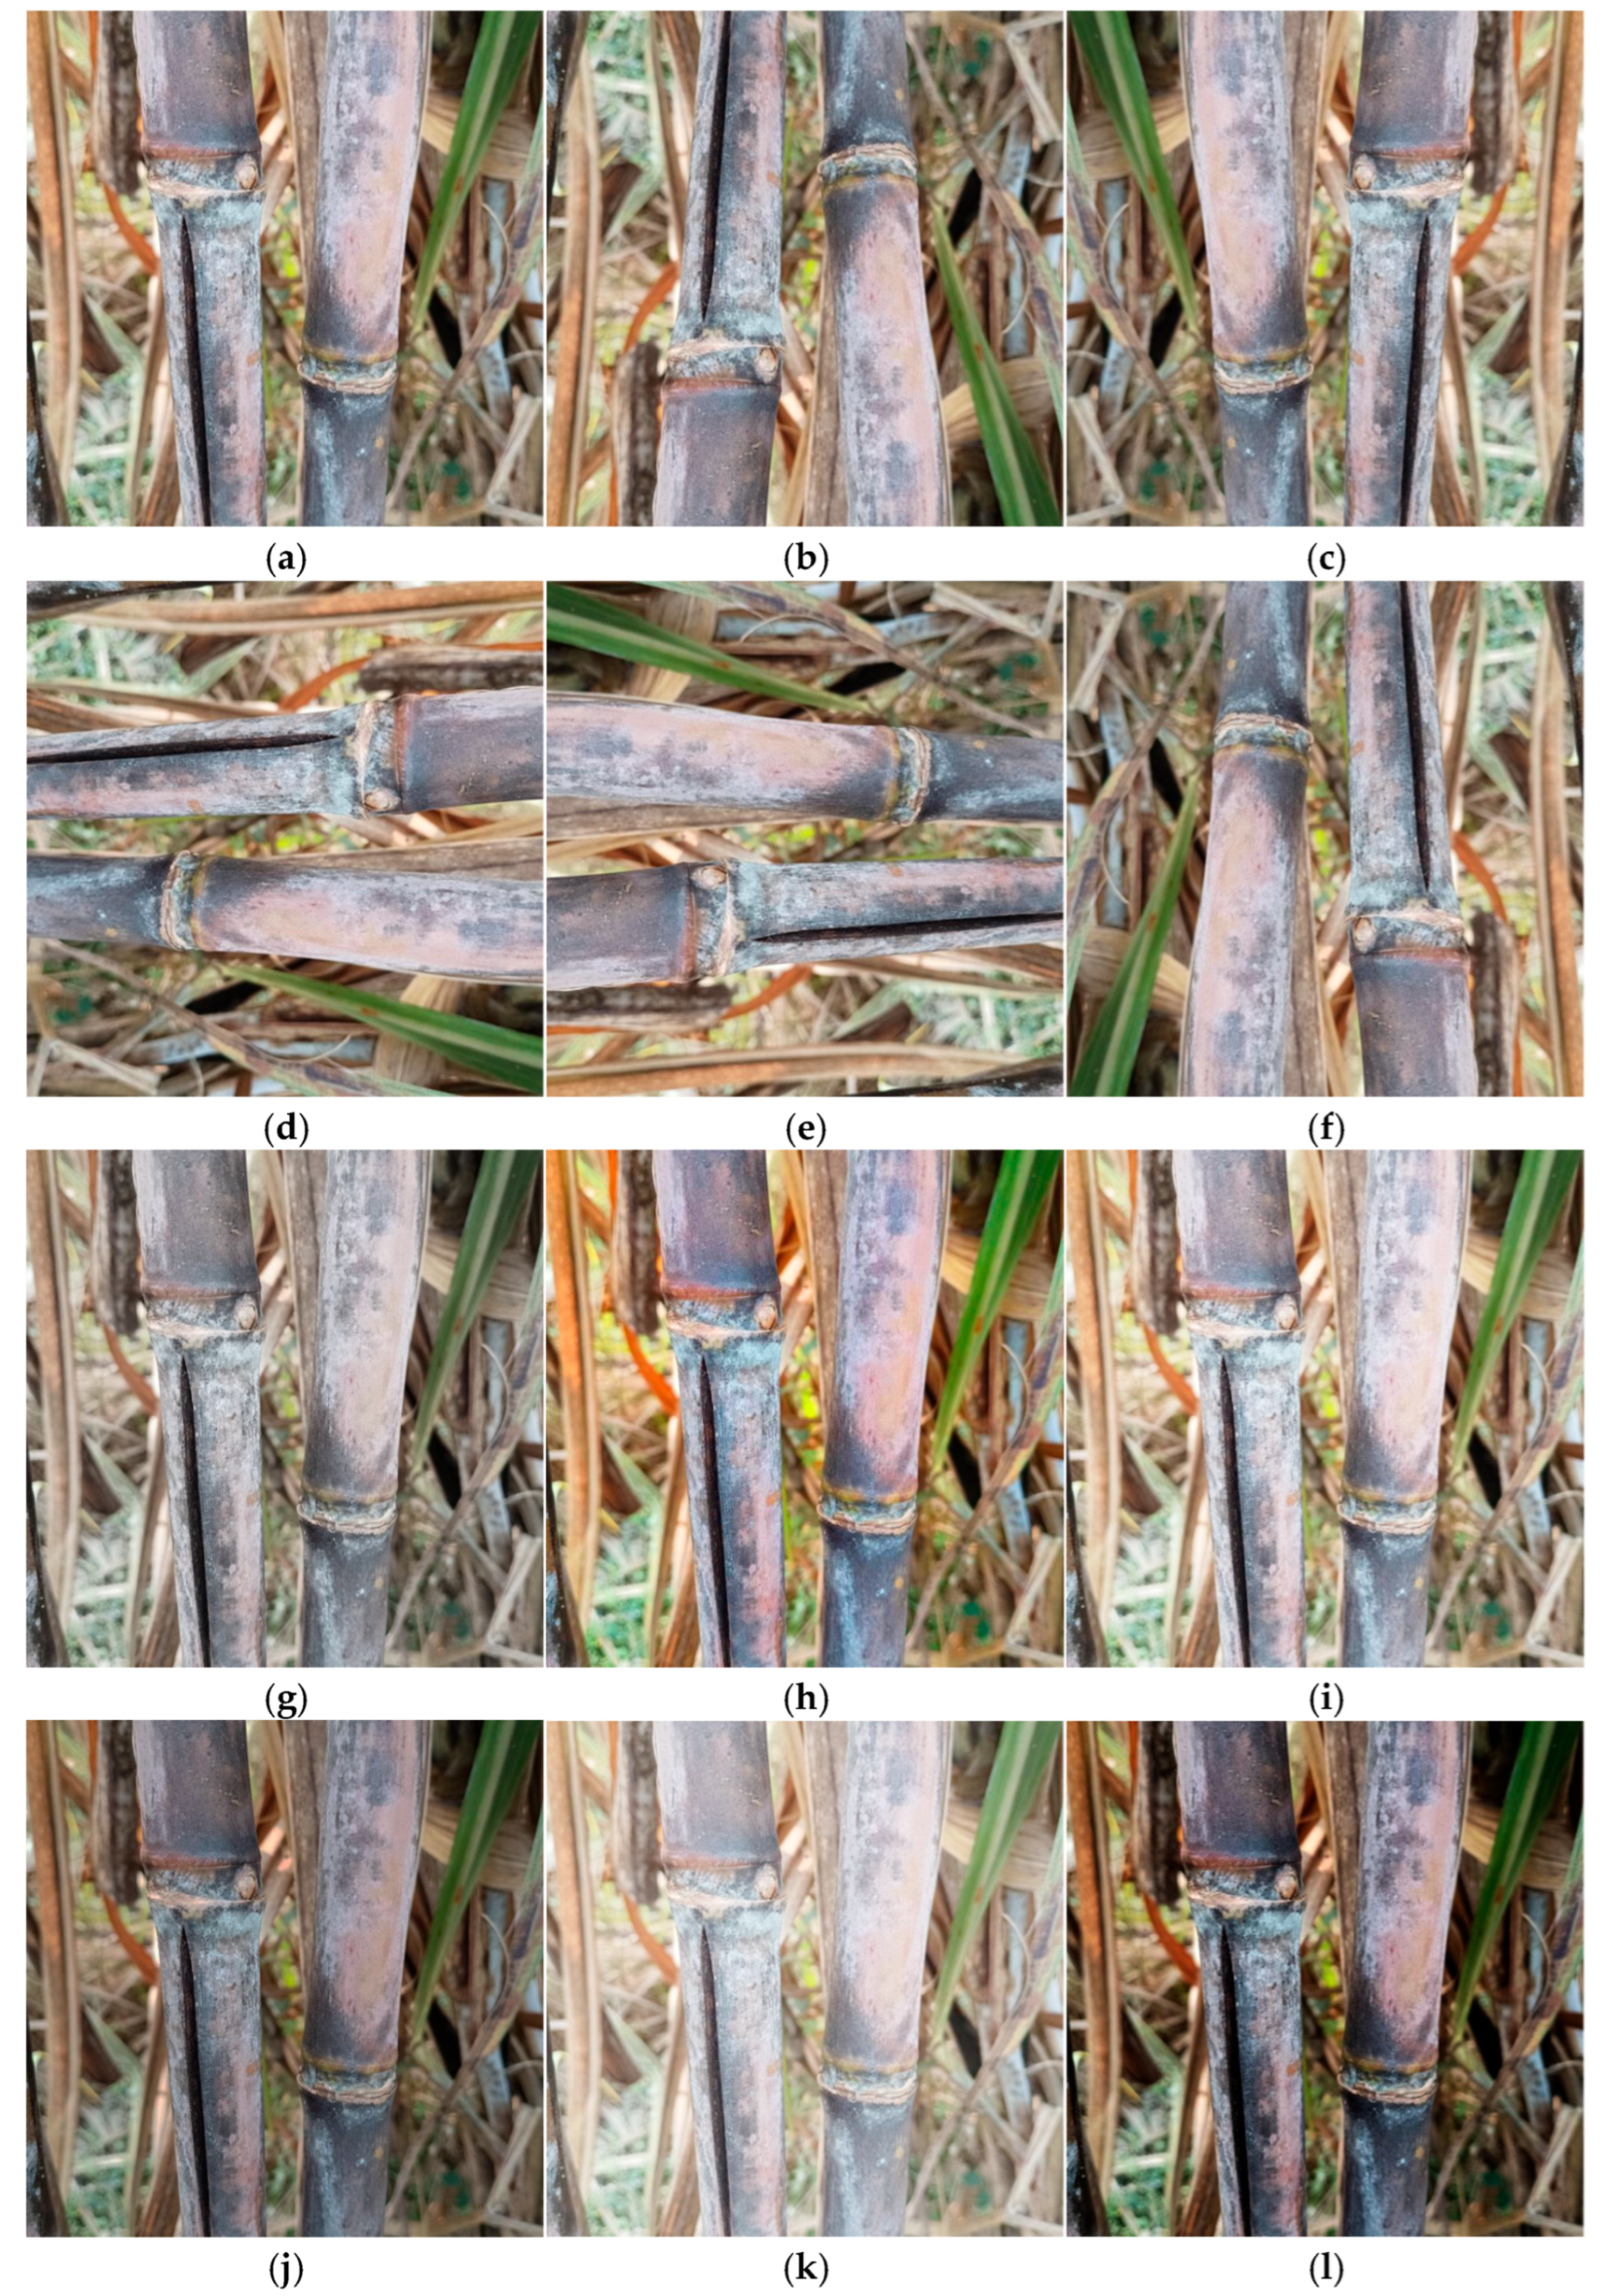
Due to the limited number of samples in the currently available public dataset, to enhance the model’s generalization capability, improve robustness, and prevent overfitting [47], data augmentation was employed using Roboflow’s built-in preprocessing workflow for standardized processing. This approach expanded the dataset by randomly generating three variants for each training sample. This process employs a random combination augmentation strategy. For each original image, the system randomly selects at least two augmentation operations from a predefined library of methods to apply in combination. Figure 2 illustrates the data augmentation methods used, which include the following:
(1)
Geometric transformations: horizontal flip (as shown in Figure 2b), vertical flip (as shown in Figure 2c), clockwise rotation (as shown in Figure 2d), counterclockwise rotation (as shown in Figure 2e), and inverted rotation (as shown in Figure 2f), which help the model adapt to the random spatial distribution of sugarcane stalks and cracks in actual field scenarios;
(2)
Luminance Adjustment: Saturation −30% (as shown in Figure 2g), Saturation +30% (as shown in Figure 2h), Brightness +25% (as shown in Figure 2i), Brightness −25% (as shown in Figure 2j), Exposure +15% (as shown in Figure 2k), Exposure −15% (as shown in Figure 2l). This design aims to simulate variable lighting conditions in agricultural environments, such as intense sunlight and overcast skies, while reducing the model’s sensitivity to light interference.
During data processing, parameter randomization was applied to each sample variant to improve the generalization capacity of the model further [48]. Each augmentation method’s parameters are randomly sampled within a predetermined range. This guarantees that the identical data augmentation operation’s perturbation strength differs among variations, mimicking the intricate alterations found in real-world situations [49]. Each original sample is guaranteed to produce three mutually exclusive enhanced versions through the combined perturbation of geometric transformations and photometric adjustments. This maximizes the data distribution coverage and improves the model’s generalization performance in complex scenarios. By using combined perturbations to simulate the complex imaging circumstances of real-world settings, this data augmentation technique successfully strikes a compromise between computing efficiency and data variety, avoiding the pattern monotony that comes with using only one augmentation method. The training set was increased from the initial 1302 photos to 3906 images in the final experimental dataset utilized in this work. A 7:2:1 ratio separated the improved photos into training, validation, and test sets. All experimental photos were automatically scaled and aligned to standardize the input dimensions using stretching interpolation to 640 × 640 pixels.

3. Network Model Improvement and Training

3.1. SCS-YOLO Model

In this study’s task of detecting surface cracks on sugarcane, YOLOv10 was ultimately selected as the baseline model. The core reason lies in YOLOv10’s ability to more accurately capture the local texture details of slender cracks through its NMS-free training method. Simultaneously, YOLOv10 significantly reduces the number of parameters and FLOPS through model component optimization, making it better suited for devices with limited computing power, such as portable field terminals.
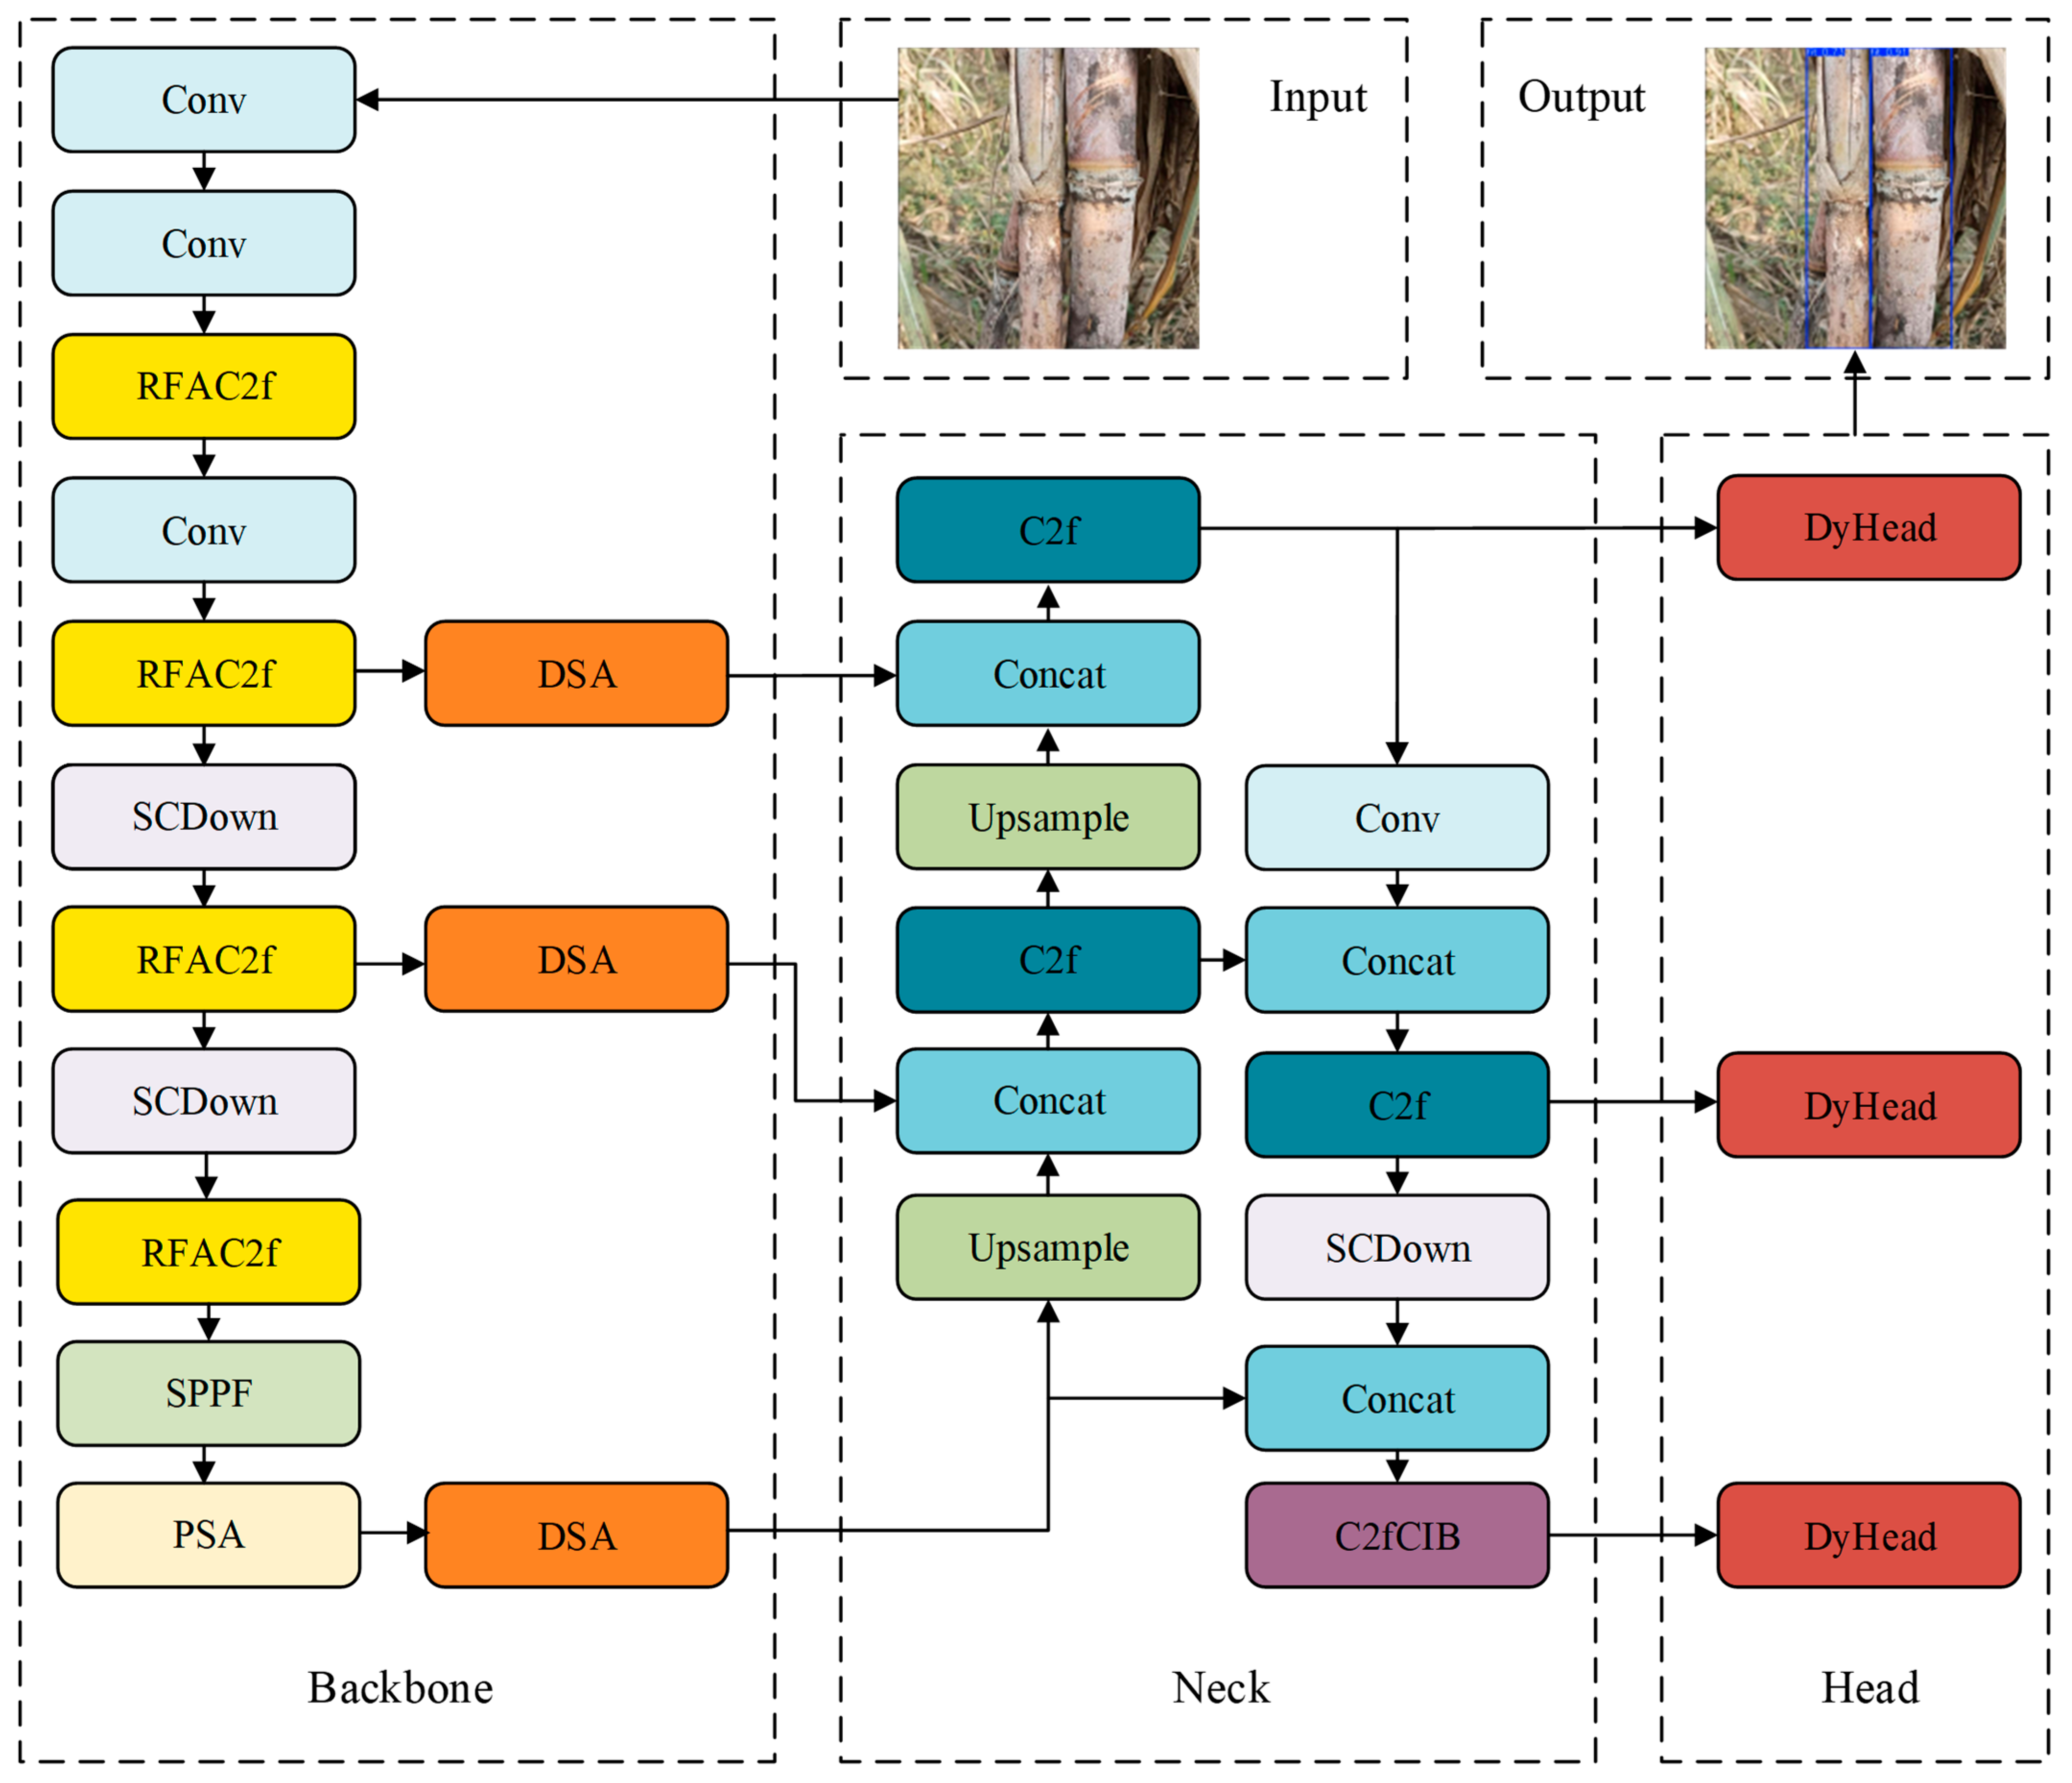
Building upon the YOLOv10n architecture, this study proposes the SCS-YOLO model for sugarcane surface crack detection. Its innovation lies in the synergistic optimization of three key modules. First, the original C2f module is swapped out in the backbone network with the RFAC2f module. The weight sharing problem of traditional spatial attention is avoided by the RFAC2f module, which generates distinct attention weights for each receptive field via a receptive field attention mechanism. This overcomes the limitations of the conventional C2f module in multi-scale feature fusion and allows the model to support fracture detection at various sizes better. The DSA module is then inserted between the neck and backbone networks. The DSA module combines the dynamic expert weight generation mechanism from dynamic convolution with the SimAM spatial attention mechanism to achieve synergistic representation of multi-scale features and local detail information of sugarcane cracks. It dynamically adjusts the combination of convolution kernels based on input features to adaptively suppress background noise, highlight crack target regions in complex backgrounds, and improve the model’s perception of elongated crack features. Lastly, the original v10Detect detection head is replaced with the DyHead (Dynamic Head), which is incorporated into the head network as the detection head. DyHead generates task-aware dynamic weights for the classification and regression branches, enabling adaptive modification of feature interaction approaches through dynamic weight generation. It automatically modifies classification and regression weights to precisely identify crack types and locations for various sugarcane crack scales and complicated background circumstances.
As seen in Figure 3, the backbone network does feature extraction, the neck network performs feature improvement, the head network performs localization regression, and the detection results are finally produced. Our model exhibits exceptional efficiency and resilience in identifying surface fractures in sugarcane.

3.1.1. Receptive-Field Attention C2f

The C2f module is a key component of the YOLOv10n model, responsible for feature extraction and enhancement through convolution, feature splitting, bottleneck layer processing, and feature fusion. However, in the original YOLOv10n model, the C2f modules in layers 2, 4, 6, and 8 rely primarily on convolution operations with fixed kernel sizes, requiring multiple repeated calls during feature extraction. This operation limits the model’s ability to perceive multi-scale information and incurs significant computational overhead. When facing tasks with high requirements for capturing texture details, such as sugarcane crack detection, the C2f module may cause feature information to be lost during the extensive convolutional operations.
The core idea of RFAC2f is to introduce dynamic receptive field modeling [50] and multi-branch feature processing and fusion mechanisms to enhance the focus on critical detail regions during feature extraction, addressing the potential feature loss issues in the original model. This structure, as shown in Figure 4, consists of an improved C2f framework and its internal RFAConv (Receptive-Field Attention Convolution) module. Input features are first convolutionally reduced in dimension and then divided into multiple branches, each feeding into an RFAConv module. The RFAConv module performs local feature extraction while dynamically modeling the receptive field responses at different spatial locations. The outputs from all RFAConv branches are concatenated (Concat) and fed into a 1 × 1 convolutional layer, achieving information integration and channel compression, thereby producing feature maps of the same dimension as the C2f structure.
RFAConv introduces a dual-path processing mechanism. Path 1 is the feature generation branch: input features are sequentially processed through convolution, batch normalization, activation function (ReLU), and tensor reshaping to generate enhanced features. Path 2 is the attention weight re-generation branch: the same input first undergoes average pooling to guide the downsampling receptive field range, then passes through a 1 × 1 convolution to generate a weight feature map, which is reshaped and normalized via Softmax to form an attention map. The computational process can be represented as
F = S o f t m a x g 1 × 1 A v g P o o l X × R e L U N o r m g k × k X = A r f × F r f
Among them, g i × i represents an i×i convolution, k represents the size of the convolution kernel, Norm represents normalization, X represents the input feature map, and F is obtained by combining the attention map A r f with the transformed receptive field spatial feature F r f . The two branches perform element-wise weighted multiplication in the spatial dimension, followed by a standard convolution layer to dynamically select and enhance features under different receptive fields, replacing the BottleNeck module in the traditional C2f structure to improve feature representation capabilities and enhance the model’s multi-scale information integration capabilities.

3.1.2. Dynamic Simam Attention Module

In the original YOLOv10n network, the backbone network removes low-level features from the input information, while the neck network fuses and delivers high-level features. There may be a semantic gap between them, and failure to bridge this gap effectively may cause certain key features to be lost or weakened, especially when detecting subtle cracks.
This study proposes a new DSA (Dynamic Simam Attention Module) to address this issue. It embeds it between the trunk and neck networks to optimize cross-layer features. DSA is an attention module that combines a dynamic convolution-based expert weight generation mechanism [51] with a parameter-free spatial attention mechanism [52], as shown in Figure 5. The input processing layer of the module uses CondConv to dynamically generate convolution kernel parameters [53], enabling the convolution operation to adaptively adjust the size of the convolution kernel based on the content of the input feature map. CondConv enhances the model’s adaptability to different input features compared to static convolution. The Sinam module then receives the dynamic features generated by CondConv to produce channel-wise attention weights, optimizing feature weight allocation globally to capture feature information at different scales and levels. This ensures that low-level features from the backbone network are more fully integrated and enhanced before being passed to the neck network, thereby improving the overall quality of feature representation.
Given input features X R C i n × H × W and weight tensor W R C o u t × C i n × K × K , the operation of a traditional static convolution layer is
Y = X W ,
where Y R C o u t × H × W is the output, * is the convolution operation, and the fully connected layer can be regarded as a convolution layer with a kernel size of 1 × 1. Dynamic convolution introduces an enhanced function with more parameters, whose expression is
W = f W .
The function f must satisfy two basic rules: (1) low computational cost, and (2) the ability to increase model capacity or trainable parameters significantly. Dynamic convolution can adaptively adjust its parameters based on different input features, satisfying the above two basic rules. The operation of dynamic convolution can be expressed as
Y = X W ,
W = i = 1 M α i W i .
Among them, W i R C o u t × C i n × H × W is the i -th convolution weight tensor, and α i is the corresponding dynamic coefficient, which is dynamically generated based on different input samples. A typical method is to use an MLP module based on the input. For the input X, global average pooling is used to fuse the information into a vector. Then, a two-layer MLP module with Softmax activation is used to generate the coefficients dynamically:
α = s o f t m a x ( M L P ( P o o l ( X ) ) )
where α R M . In large-scale visual training models, the model’s accuracy positively correlates with the number of parameters. Generally, the more parameters a model has, the higher its accuracy, increasing computational complexity (FLOPs). Compared to the original convolutional layer, the coefficient generation in Equation (6) introduces only a negligible amount of FLOPs. Therefore, dynamic convolution introduces almost no additional FLOPs when increasing the number of computational parameters. This enables the model to significantly enhance its feature modeling capability for complex objects while maintaining low FLOPs.
SimAM (Simple Attention Mechanism) is a lightweight dual-dimensional attention mechanism that enhances model representation capabilities by synergistically optimizing channel and spatial features. Its core steps are as follows:
Given an input feature map X R C × H × W , SimAM generates channel attention weights A c R C and spatial attention weights A s R H × W through global statistical compression and dynamic parameterization, respectively:
A c = σ W c · 1 H W i = 1 H j = 1 W X i j , A s = σ ( C o n v 1 × 1 ( X ) )
where σ ( · ) is the sigmoid function, W c R C × C is the learnable parameter, and C o n v 1 × 1 R C × C is the lightweight convolution. The final output features are modulated element-wise by two-dimensional weights:
Y = X ( A c A s )

3.1.3. Dynamic Head

Due to the constraints of typical convolution operations and fixed receptive fields, the detection heads in YOLOv10n have difficulty capturing detailed properties of objects during object detection, making it easy to overlook minor fractures. Furthermore, when there are negligible visual distinctions between objects and the backdrop, the model is susceptible to background interference, which lowers detection accuracy. To increase detection accuracy, decrease background noise interference, and focus more readily on the critical sections of tiny objects, Dyhead uses several attention mechanisms that allow the model to dynamically alter attention based on the spatial relevance of objects [54].
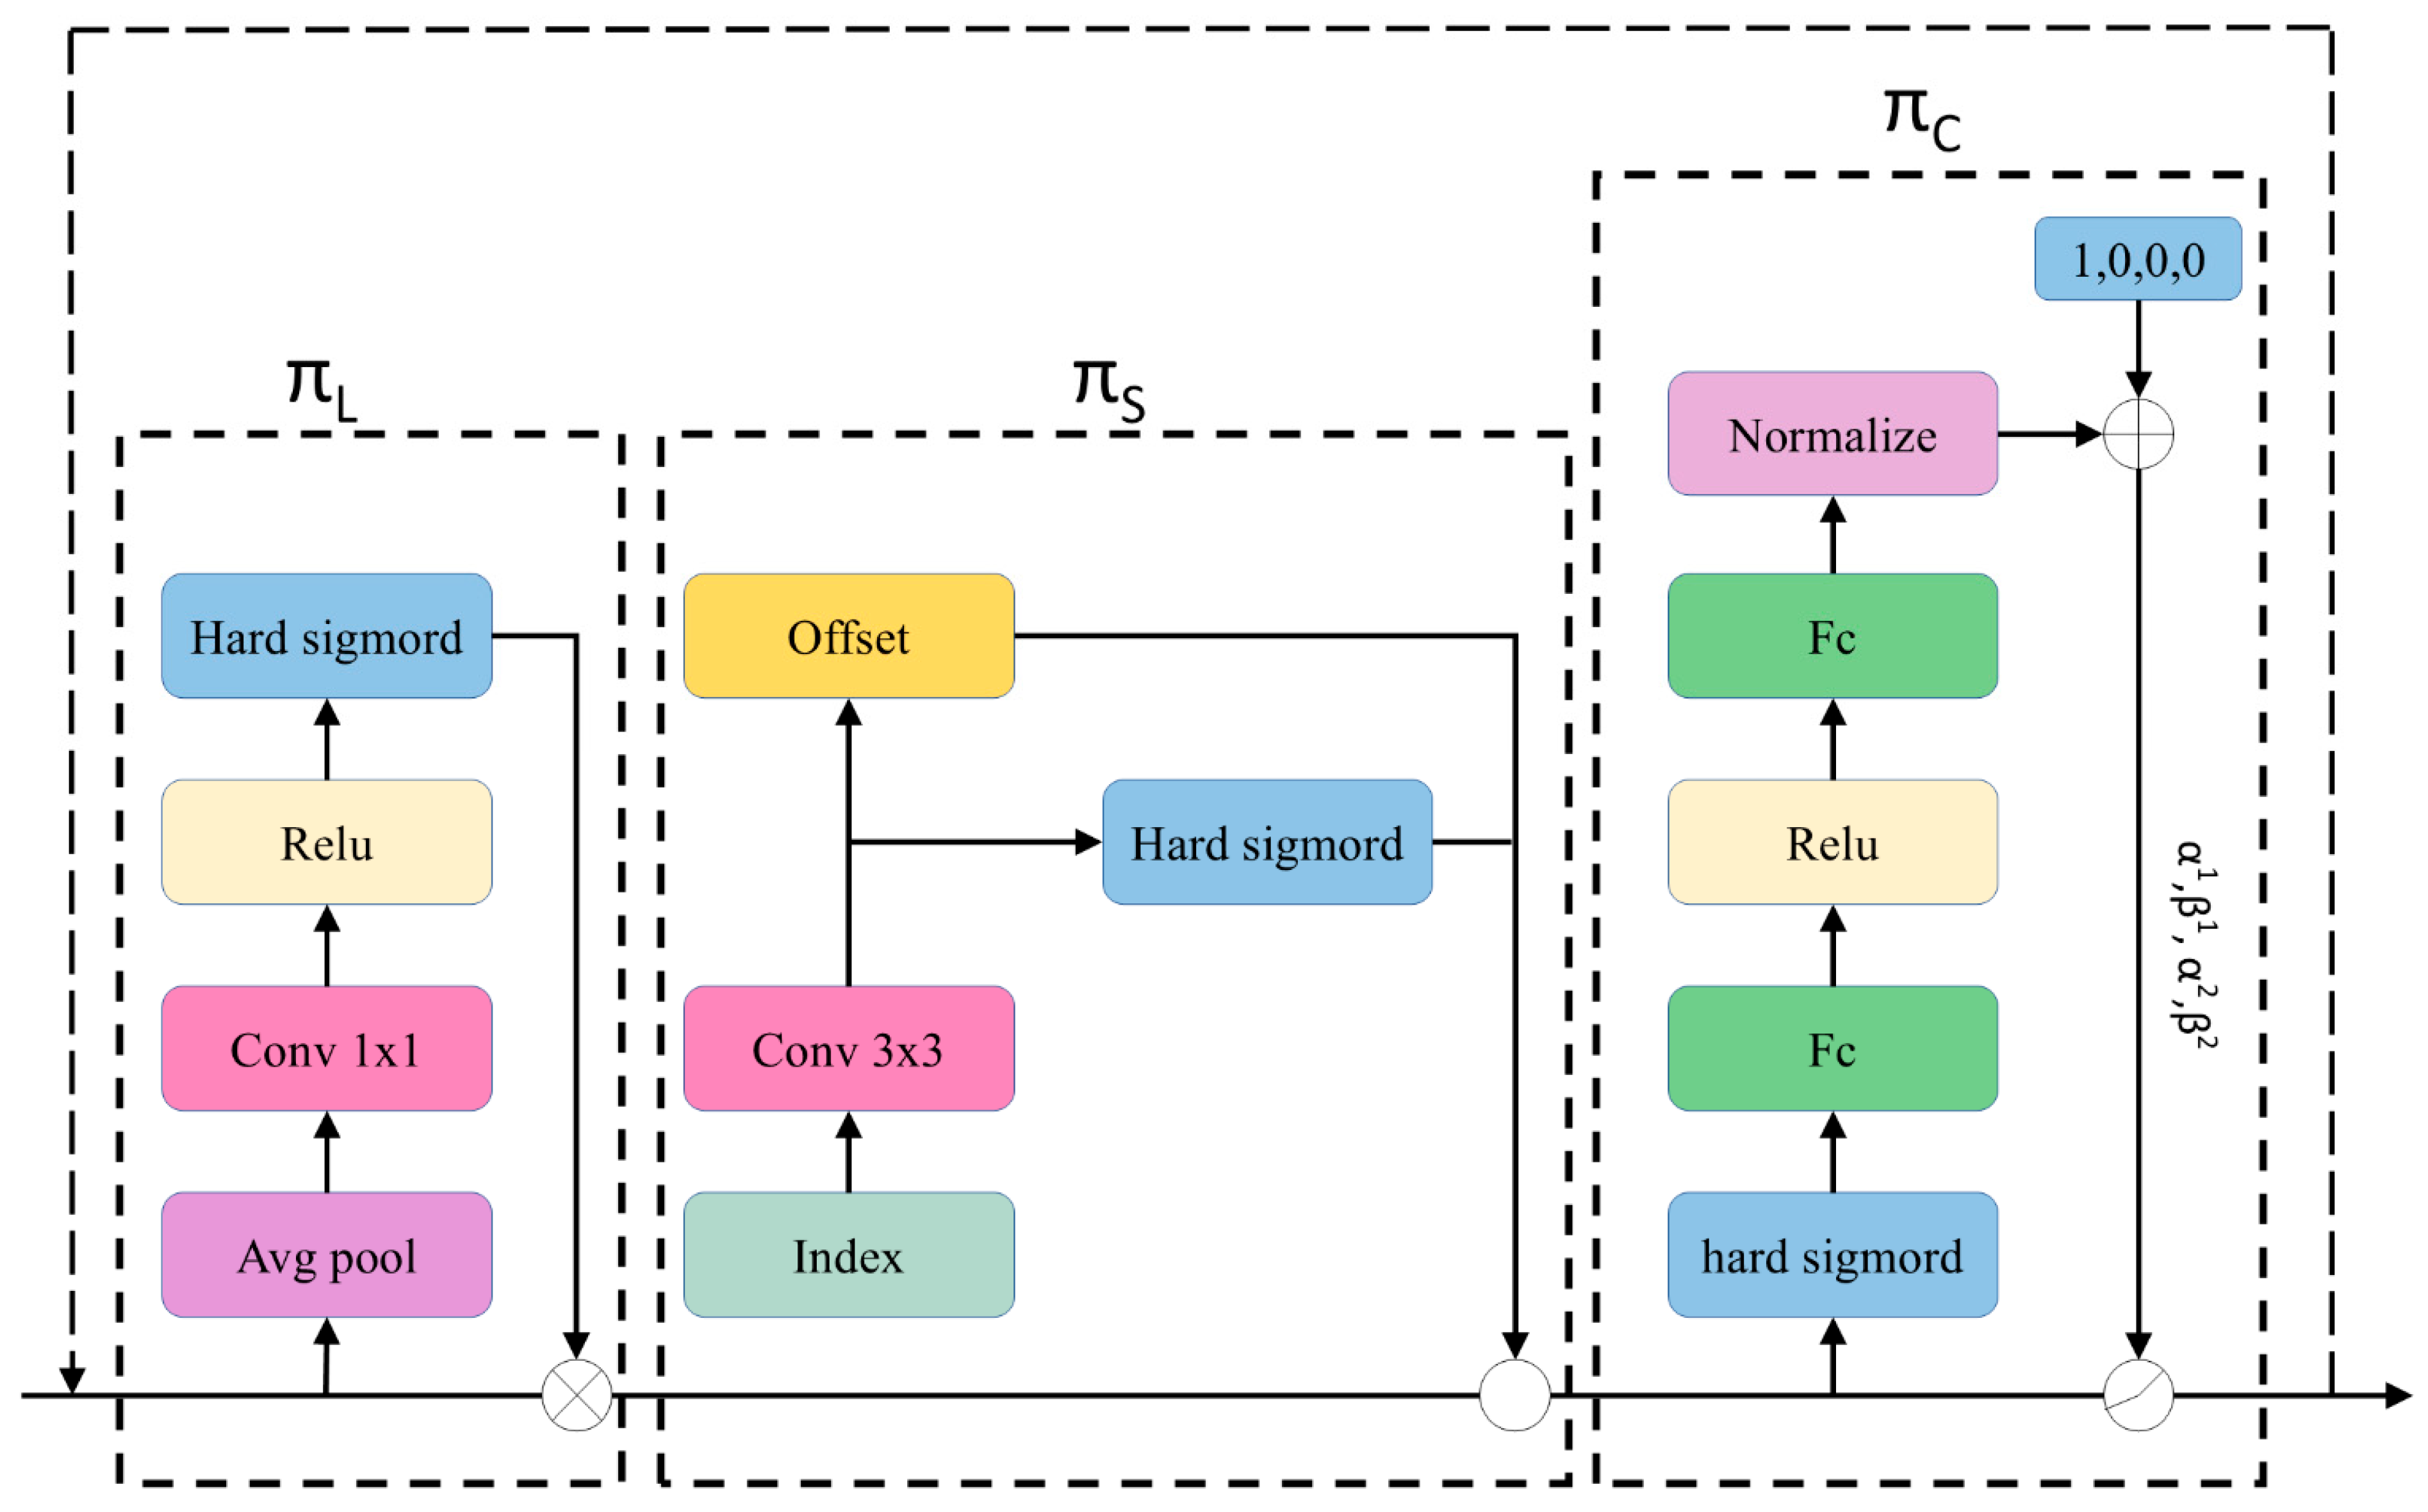
Figure 6 illustrates how Dyhead unifies the object detection head using an attention mechanism [55]. Each dimension of the feature is given an attention mechanism, which is applied to the input of the object detection head, which is a three-dimensional tensor with hierarchical, spatial, and channel dimensions. Task-aware attention attends to various task needs; spatial-aware attention enhances the ability to recognize and locate targets; and scale-aware attention improves the ability to process targets of varied scales in feature maps.
The computational complexity of the model may be significantly decreased by employing dynamic convolution to enhance the detection head of YOLOv10n and applying it to object detection tasks. This allows the improved YOLOv10n model to operate on devices with constrained processing resources.

3.2. Experimental Environment and Evaluation Criteria

3.2.1. Experimental Environment

To validate the significant improvement in detection performance of the SCS-YOLO network, experiments were conducted on a sample dataset. The hardware and software configuration of the experimental environment is as follows: a 64-bit operating system was used. The CPU was a 16 vCPU Intel Xeon Platinum 8474C. The GPU was an RTX 4090D (24 GB)*1. The deep learning framework was PyTorch: 2.0.0+cu118. CUDA version was 11.8, with PyCharm (Community Edition 2024.3.1.1) + Anaconda (Conda 24.9.2) as the compiler and Python 3.8 as the programming language. Input image dimensions were 640 × 640. The hyperparameter configuration used during training is as follows: Mosaic data augmentation was employed to enhance model generalization. The optimizer is Adam with an initial learning rate of 0.01, momentum factor of 0.937, and weight decay coefficient of 0.0005. Epochs are set to 300, workers and batch size are both 32, input image resolution is 640 × 640, cache is set to false, and Amp is set to False.

3.2.2. Evaluation Criteria

In this work, we use multidimensional measures to assess the performance of YOLOv10 and its enhanced models systematically. Performance and complexity metrics are the two categories into which the measurements are separated [56]. Among the performance metrics are the following:
Precision (P): As shown in Formula (9), this reflects the reliability of the model’s prediction results and is defined as the proportion of correctly predicted positive samples among all predicted positive samples.
P = T P ( T P + F P )
Recall (R): As shown in Formula (10), recall measures the model’s ability to cover positive samples, calculated as the proportion of correctly identified positive samples to the actual positive samples.
R = T P ( T P + F N )
The F1-score is the harmonic mean of accuracy and recall, combining the balance between precision and recall. The higher the F1-score, the better the model performs regarding accuracy and recall. It is expressed as:
F 1 - S c o r e = 2 × P × R ( P + R )
Mean Average Precision (mAP): As shown in Formula (11). Dynamically evaluate the model’s overall performance based on the Intersection over Union (IoU) threshold. Among these, mAP50 represents the average precision at an IoU threshold of 50%. At the same time, mAP50-95 denotes the average precision mean as the IoU threshold is incrementally adjusted from 50% to 95%, reflecting the network’s robustness in target localization and classification.
A P = 0 1 p ( r ) d r
m A P = 1 N i = 1 N A P i
Complexity metrics include:
Network depth (Layers): The total number of layers of independent computational units in the model, reflecting the complexity of the network structure.
Number of parameters (Parameters): The total number of trainable parameters in the model, directly related to storage requirements and spatial complexity.
Computational Efficiency (GFLOPs): The number of billion floating-point operations required for a single forward inference, quantifying the computational complexity of the model. A lower GFLOPs value indicates that the network requires less hardware computational power during deployment.

4. Experimental Results and Analysis

4.1. Ablation Experiment

This study used ablation experiments to thoroughly examine the distinct effects of each SCS-YOLO network component on its functionality. To see how the model’s performance and complexity metrics changed, essential elements were eliminated one at a time while maintaining the same other circumstances. The ablation experiment methodically assessed the effect of each enhanced module and its combinations on model performance. Table 1 shows the experimental results of SCS-YOLO with its ablation model in terms of performance and complexity metrics.
Experimental results show that when applied independently, the RFAC2f module achieves a precision of 90.2% on the test set with a frame rate of 129 FPS. This demonstrates that RFAC2f’s dynamic receptive field modeling and spatial attention mechanism enhance the model’s focus on critical details, enabling more precise target detection. The model using DSA alone achieved 88.5% precision, 87.8% recall, and 93.0% mAP50. Positioned between the backbone and neck networks, DSA enhances the model’s adaptability to local features through adaptive convolutions while generating channel-wise attention weights from a global perspective. This enables the model to prioritize important features, particularly highlighting critical information in tasks like detecting minute cracks. However, the additional DSA module increases overall computational load and complexity. The model incorporating only the DyHead module achieves 89.4% precision, with recall significantly improved to 91.4%, mAP50 reaching 94.3%, and mAP50:95 at 71.0%. Parameter count is reduced, and computational efficiency is substantially lowered to 5.2 GFLOPs. The core reason lies in DyHead’s scale-aware capability achieved through inter-feature-level attention mechanisms. It dynamically adjusts feature weighting for objects of varying scales, enhancing the model’s response to multi-scale targets (e.g., detection objects with significant size differences). Its dynamic parameter generation mechanism eliminates reliance on fixed structures, enabling adaptive adjustment of head network parameters and computational paths based on input features. This preserves computational efficiency while enhancing the model’s generalization capability for detecting surface cracks on complex sugarcane surfaces.
Module combination experiments revealed synergistic effects and limitations between components. When RFAC2f was combined with DSA, model precision first reached 91.6%, though recall improvement was relatively limited. Simultaneously, model parameters surged significantly. This indicates that RFAC2f and DSA synergistically enhance the model’s focus on key features, but require concurrent computation of global and local feature correlations, leading to additional computational overhead. When RFAC2f is combined with DyHead, the model’s complexity metrics reach their lowest while performance metrics show a moderate improvement. This indicates that the feature quality optimization provided by RFAC2f compensates for the potential performance loss caused by DyHead’s lightweight nature. When DSA and DyHead are applied simultaneously, both model precision and mean average precision (mAP) significantly increase while complexity metrics decrease, further validating the dynamic mechanism’s adaptability to complex environments and its lightweight advantages. Although YOLOv10+B+C achieves slightly higher precision, mAP50, and mAP50:95 than YOLOv10+A+B+C, Module A remains necessary and justified. Module A enhances the model’s robustness in complex outdoor environments, achieving a recall rate of 89.8%. Its F1-score of 90.35 surpasses that of YOLOv10+B+C, indicating that Module A further optimizes the balance between precision and recall on top of the synergistic effects of Modules B and C. Under these conditions, the YOLOv10+A+B+C model achieves further parameter compression. Moreover, with an FPS of 122, it better meets the real-time requirements for practical sugarcane crack detection compared to configurations without Module A, enabling rapid detection and response. This capability is crucial for real-world sugarcane crack detection. These results demonstrate that Module A enhances the model’s comprehensive crack detection capability while maintaining precision. It achieves a superior balance between precision and recall, making it better suited for the practical task of sugarcane crack detection. Under conditions of limited computational resources, it enables the most comprehensive and accurate crack identification possible.
In conclusion, the three improved modules of the comprehensive SCS-YOLO model produced an average detection accuracy of 90.9% and a recall rate of 89.8% on the test set. Furthermore, SCS-YOLO balances complexity and performance by increasing mAP50 to 94.7% and F1 score to 90.35% while keeping the parameter count modest at 2,175,038 and 6.0 GFLOPs. This offers a lightweight, high-quality solution for practical detection tasks in edge computing applications.
The accuracy rate change curves of various module combinations at various training stages are displayed in Figure 7a, and the recall rate change curves of various module combinations at various training stages are displayed in Figure 7b. The mAP50 and mAP50:95 change curves of various module combinations as training goes on are shown in Figure 7c,d, respectively. The figure demonstrates that the SCS-YOLO model performs better than any other module combination based on P, R, mAP50, and mAP50:95 performance indicators. This suggests that the SCS-YOLO model performs better overall on object detection tasks.

4.2. Comparative Test

A systematic comparison and analysis were conducted with currently popular lightweight object detection models under identical conditions (including consistent parameter settings and the same dataset) to further validate the SCS-YOLO network’s performance compared to existing object detection models. Six sample models of the YOLO series were chosen for the studies: YOLOv3-tiny, YOLOv5n, YOLOv6n, YOLOv8n, YOLOv10n, and YOLOv11. Table 2 displays the outcomes of the experiment.
Table 2 systematically compares the performance of various lightweight object detection models based on metrics including precision, recall, multi-scale detection capability, and computational efficiency. As a representative two-stage model, Faster R-CNN [57] achieves a mAP of 94.1%. While this value is relatively high, its parameter count and GFLOPs are approximately 137M and 370.2G, respectively, with a frame rate of only 0.38 FPS. This represents substantial resource consumption for agricultural applications such as sugarcane surface crack detection. With a 90.85% F1-score and an accuracy of 93.0%, YOLOv8n leads in high-precision scenarios, showcasing its accurate detection capabilities. With the shortest parameter count (2.1MB) and lowest computational cost (6.0 GFLOPs), SCS-YOLO notably achieves a detection accuracy of 90.9% and an F1 score of 90.35%. Its highest recall rate (89.8%) among all models indicates a considerable advantage in reducing missed detections. Furthermore, SCS-YOLO’s weight is only 54% of YOLOv6n’s, demonstrating its usefulness in resource-constrained contexts, even though its mAP50-95% is marginally lower. SCS-YOLO’s extremely lightweight design effectively solves situations compromising efficiency and false negative control, such as high-density agricultural monitoring and edge device deployment.
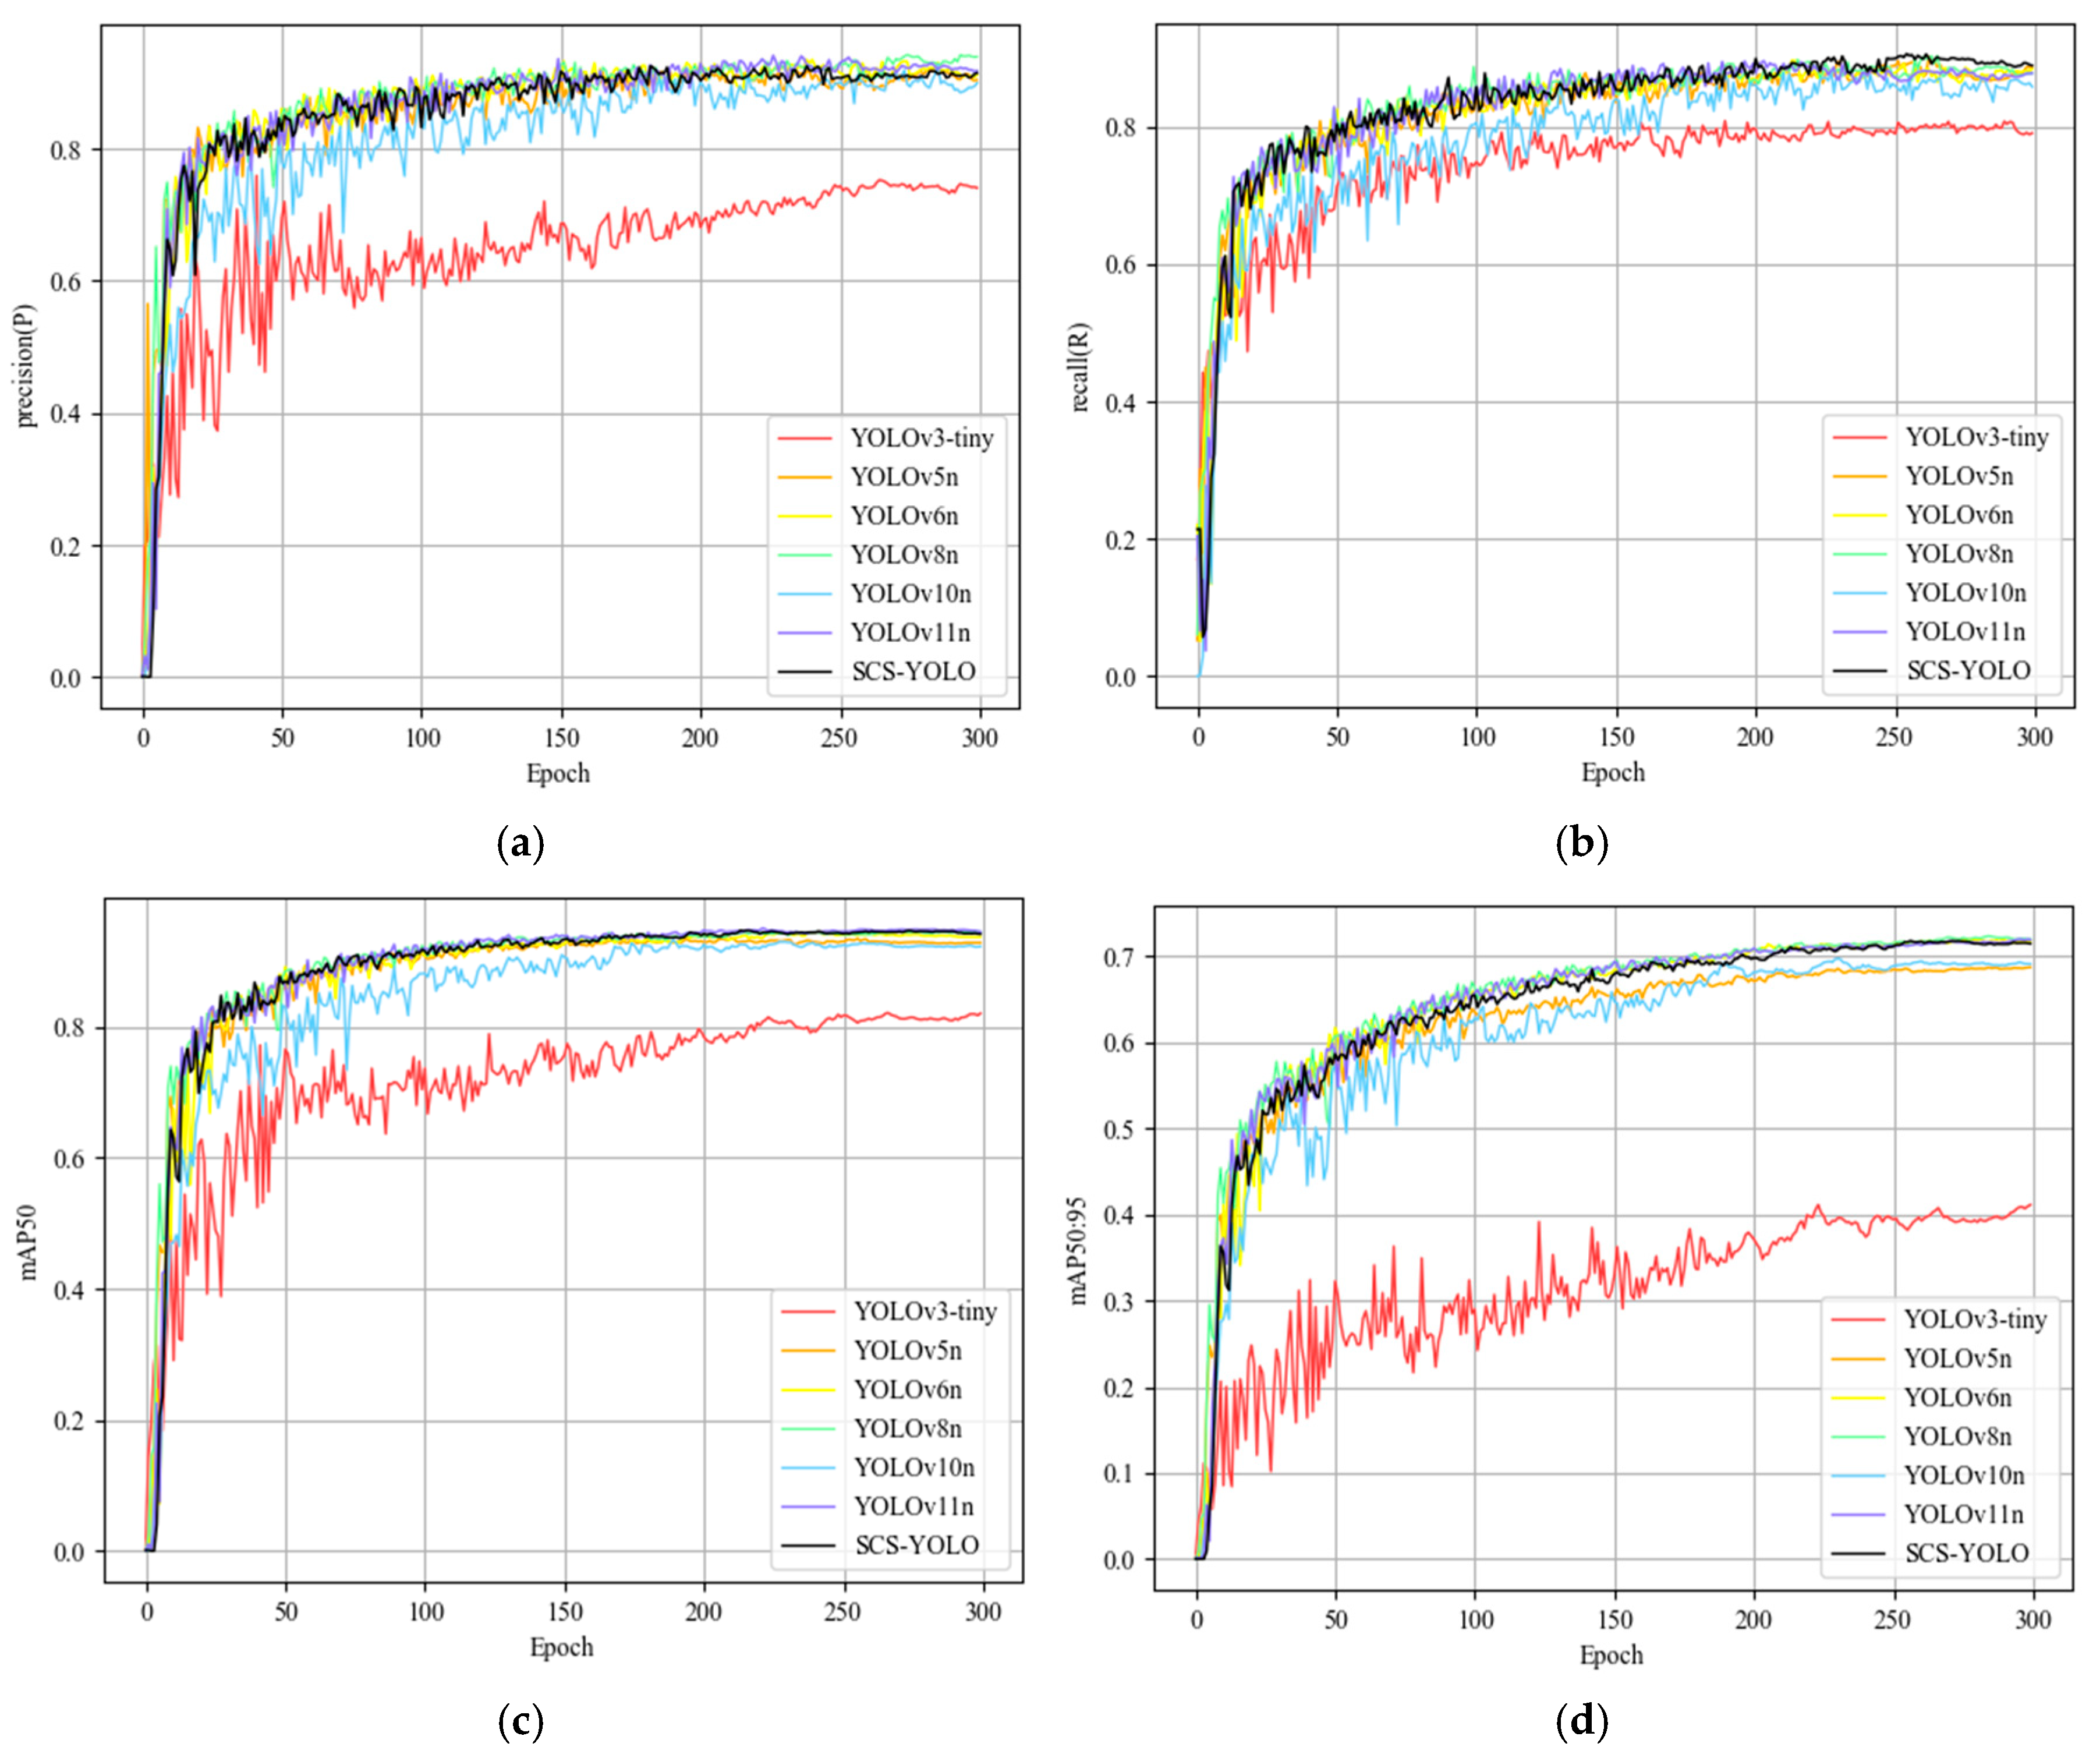
Figure 8 shows the changes and comparisons of performance measures for each model on the same dataset during training to depict the performance metrics changes during model training and the final training outcomes. The accuracy change curves for various models at various training phases are shown in Figure 8a. With minimal variation from other models, SCS-YOLO exhibits consistent development during the first training phase and keeps rising consistently to a high level in the subsequent phases. The recall rate change curves for various models at various training phases are displayed in Figure 8b. The rate of improvement of SCS-YOLO is comparable to that of specific early versions. While SCS-YOLO keeps growing significantly, most conventional models stall or even deteriorate in the middle stage. It takes the lead in the later stage, showing that it can successfully prevent missed detections by crack features. The mAP50 and mAP50:95 curves of various models are displayed while training goes on in Figure 8c,d. SCS-YOLO outperforms other models, converges quickly during the early learning phase, and optimizes in the middle and later stages. It exhibits more adaptability to complicated backdrops, maintains acceptable detection performance under varying accuracy requirements, and meets high accuracy standards in both localization and category classification, all of which contribute to its overall improved detection performance.
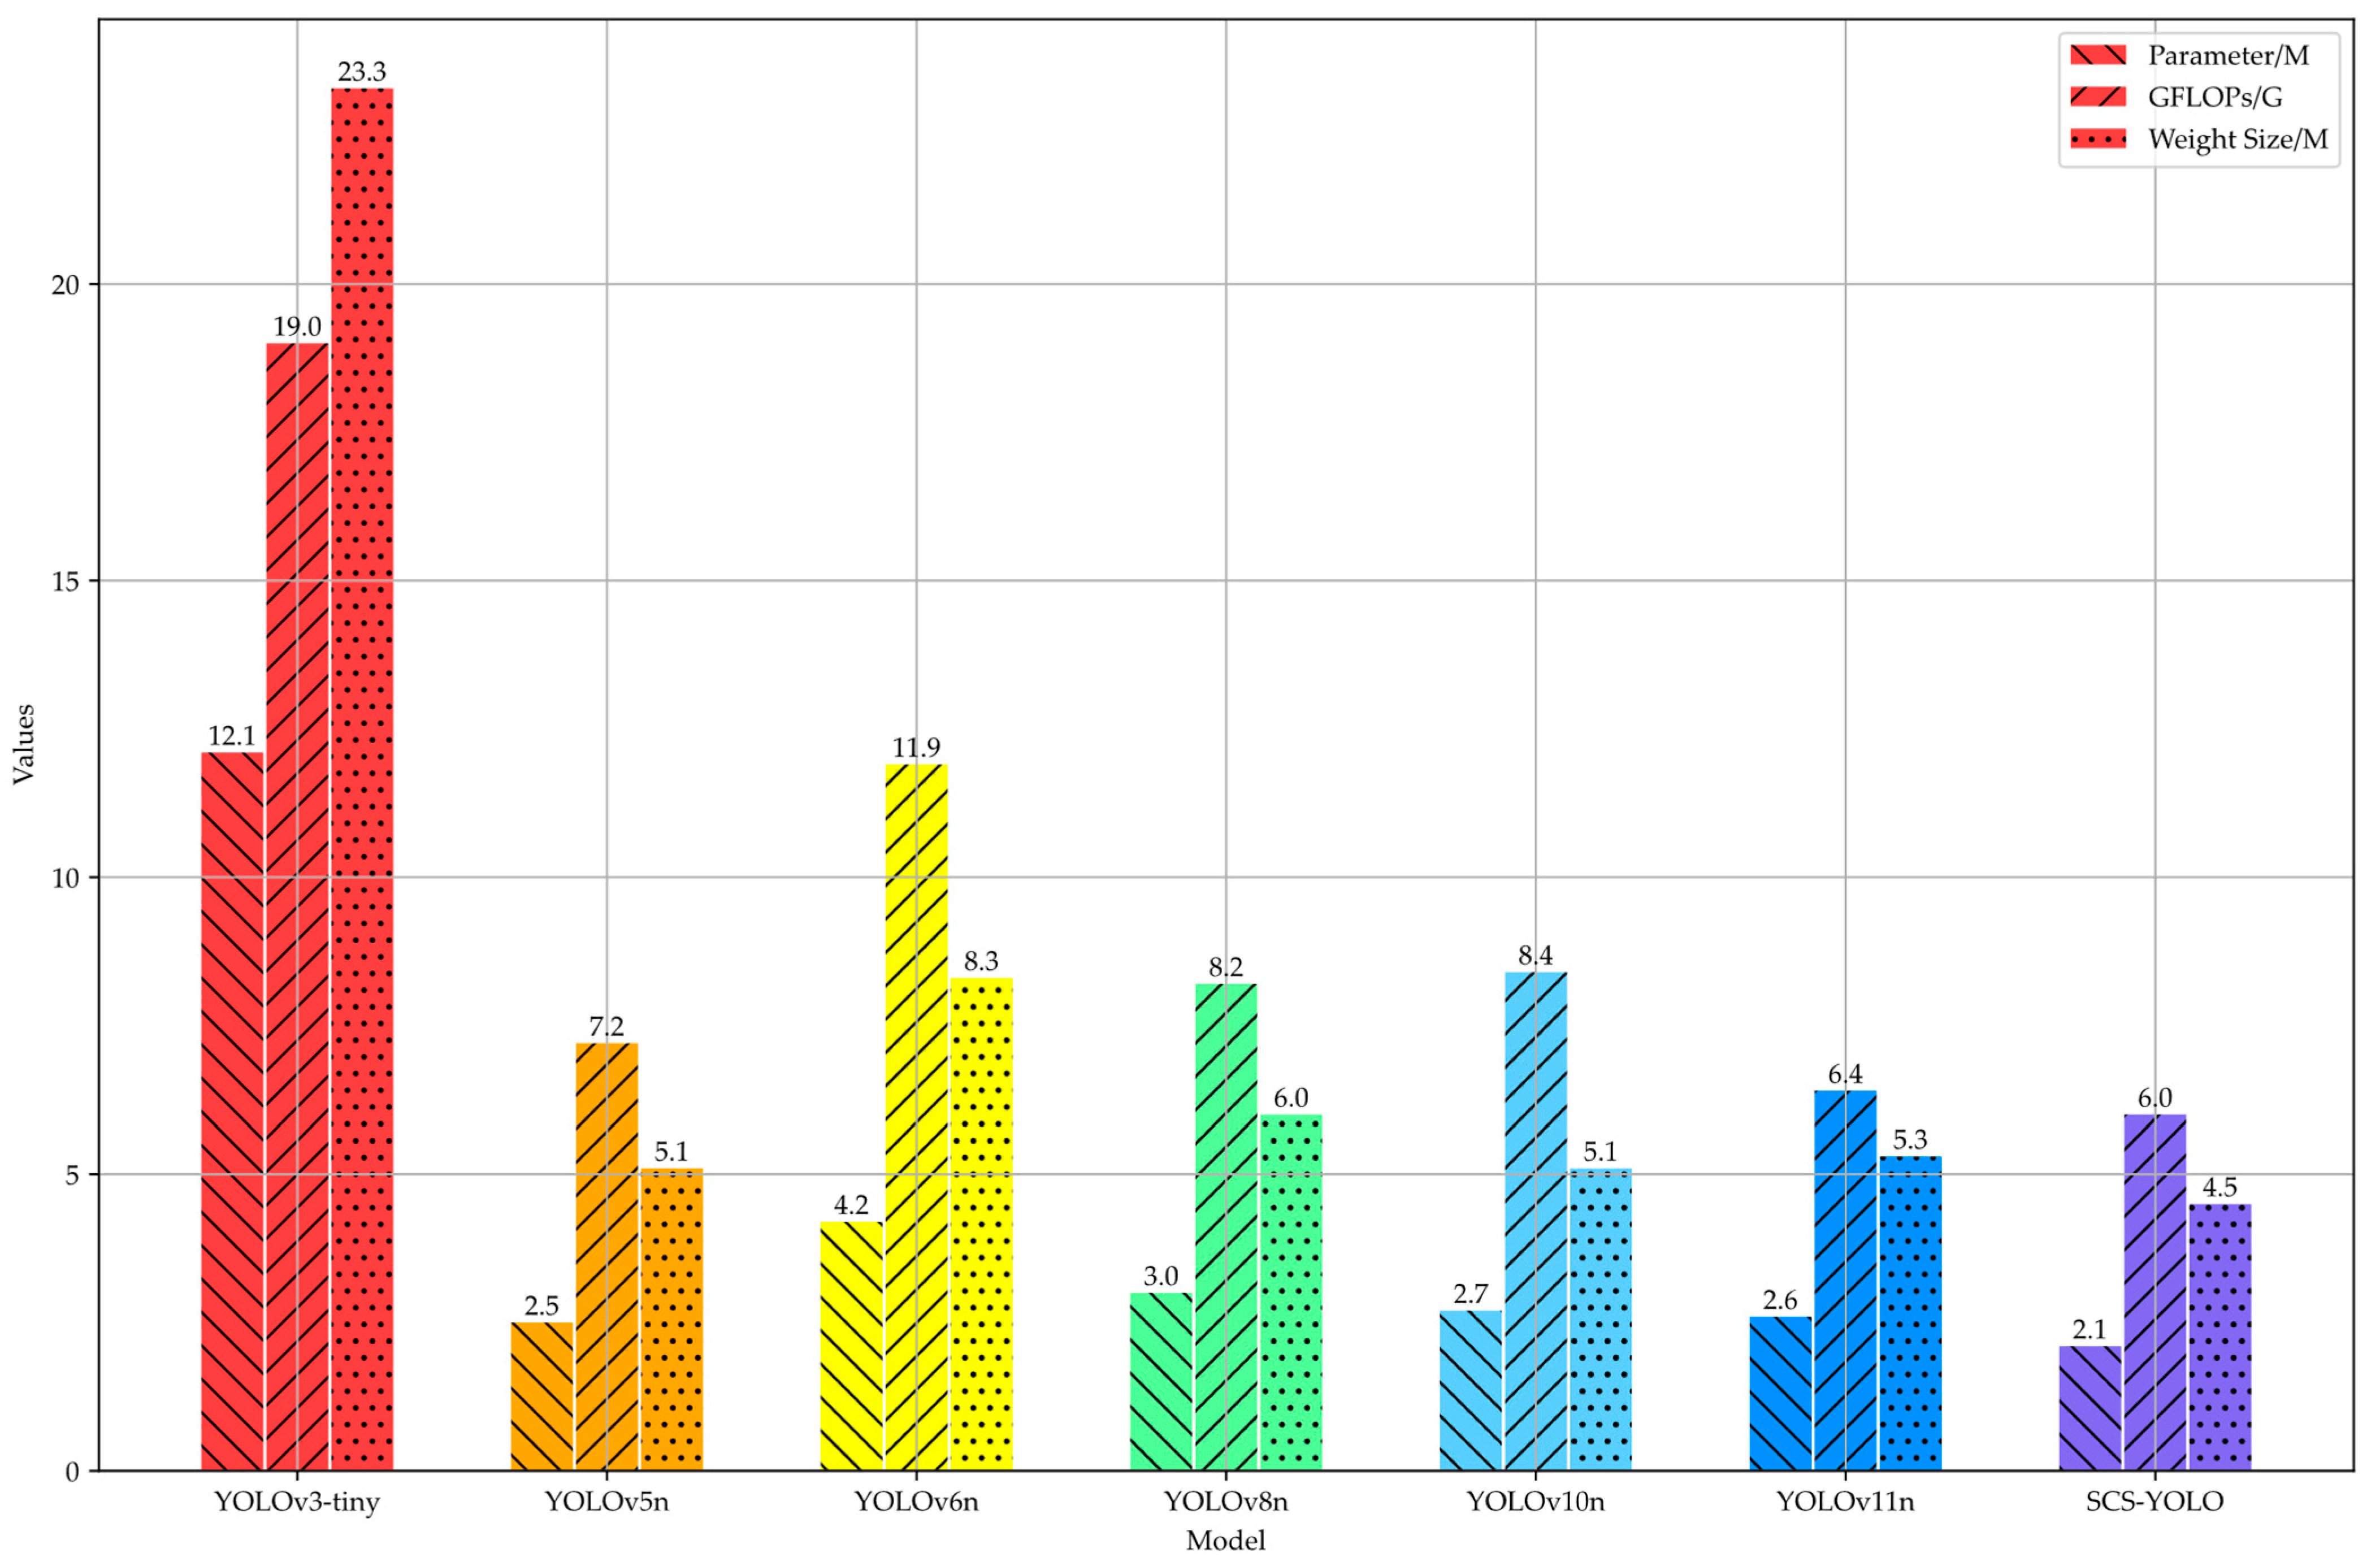
This study builds a multi-dimensional complexity assessment system to systematically compare and analyze complexity metrics between SCS-YOLO and popular lightweight detection models, as illustrated in Figure 9. According to experimental data, SCS-YOLO exhibits notable benefits in three critical metrics when processing the same-sized sugarcane surface crack image dataset:
YOLOv3-tiny contains 12.1 million parameters, whereas SCS-YOLO has just 2.1 million. Compared to YOLOv10n, which has 2.7 million parameters, the difference is substantial—a 22.22% decrease. This lowers storage and processing costs by drastically reducing the parameters that must be handled during model training and inference. YOLOv3-tiny is 19.0 G in terms of computational complexity (GFLOPs). However, SCS-YOLO is just 6.0 G. This represents a 28.57% reduction compared to YOLOv10n’s 8.4 G, suggesting that SCS-YOLO successfully lessens the computational load on hardware while maintaining high-precision detection. The smallest of all the models, SCS-YOLO’s model size can still be compressed to 4.5 MB after training with a lot of data. On the other hand, YOLOv3-tiny and YOLOv10n have weights of up to 23.3 MB and 5.1 MB, respectively, suggesting that the accuracy enhancement attained by SCS-YOLO is not reliant on intricate computational procedures but rather on innovative architecture that achieves high network lightweighting. SCS-YOLO is better suited for use in agricultural detection systems with limited resources because of its notable model deployment and storage advantages.
This work uses Gradient-based Activation Map (Grad-CAM) technology [58] to methodically assess the enhanced model’s visual interpretability for sugarcane crack detection by measuring the distribution of feature attention throughout the decision-making process. Figure 10 provides empirical support for the model’s interpretability studies by demonstrating a strict monotonic relationship between the heatmap’s activation intensity (red regions) and the model’s confidence in crack features.
A complex background scenario, where overlapping sugarcane stalks create textures that are strikingly similar to the target stalk cracks, is depicted in the Grad-CAM heatmap in Figure 10a. This interference noise may interfere with the model’s ability to detect the target cracks precisely. A situation with small cracks that are less than 0.3 mm wide is depicted in Figure 10b. Background information readily overpowers these fractures during the model’s feature extraction phase because of their small pixel proportion and weak geometric features. This results in the loss of semantic information and makes the model miss detections. The SCS-YOLO model significantly benefits in identifying small cracks and minimizing complicated background interference. SDS-YOLO’s heatmap feature distribution is more focused and robust than conventional YOLO series models, such as YOLOv3-tiny and YOLOv5n. By adding the DSA attention mechanism and the DyHead dynamic detection head, the model successfully suppresses interference from non-critical features, as shown by the red regions in the heatmap of Figure 10a, which are highly concentrated in the target crack region and have a significantly weaker response to background noise. Interestingly, in Figure 10b, the delicate crack detection task, the red areas show a uniform and continuous intensity distribution and completely cover the crack morphology. This indicates that the model uses the RFAC2f receptive field feature fusion strategy to improve its feature representation capability for low-contrast, elongated targets. On the other hand, because of its inadequate network depth, YOLOv3-tiny displays dispersed heatmaps. Furthermore, SCS-YOLO does a good job of extracting local features, but the boundaries of the heatmap are still distinctly hazy. The model could explain this using the local feature enhancement module to increase response intensity in key areas. However, when deep and shallow features are fused, the low-resolution nature of the deep features results in excessively smoothed edge information for the shallow features, which causes boundary region discretization in the heatmap. SDS-YOLO uses the DyHead dynamic detecting head, DSA attention mechanism, and RFAC2f receptive field feature fusion technique to accomplish high-precision feature localization. The heatmap findings validate the model’s dual innovations in feature discriminative power and interference resistance, offering a dependable method for identifying high-precision sugarcane surface cracks in challenging situations.
This work created a test set with 390 high-difficulty samples, including samples with cluttered backgrounds, small cracks, uneven lighting, and leaf obstruction, to methodically assess the detection performance of the SCS-YOLO model.
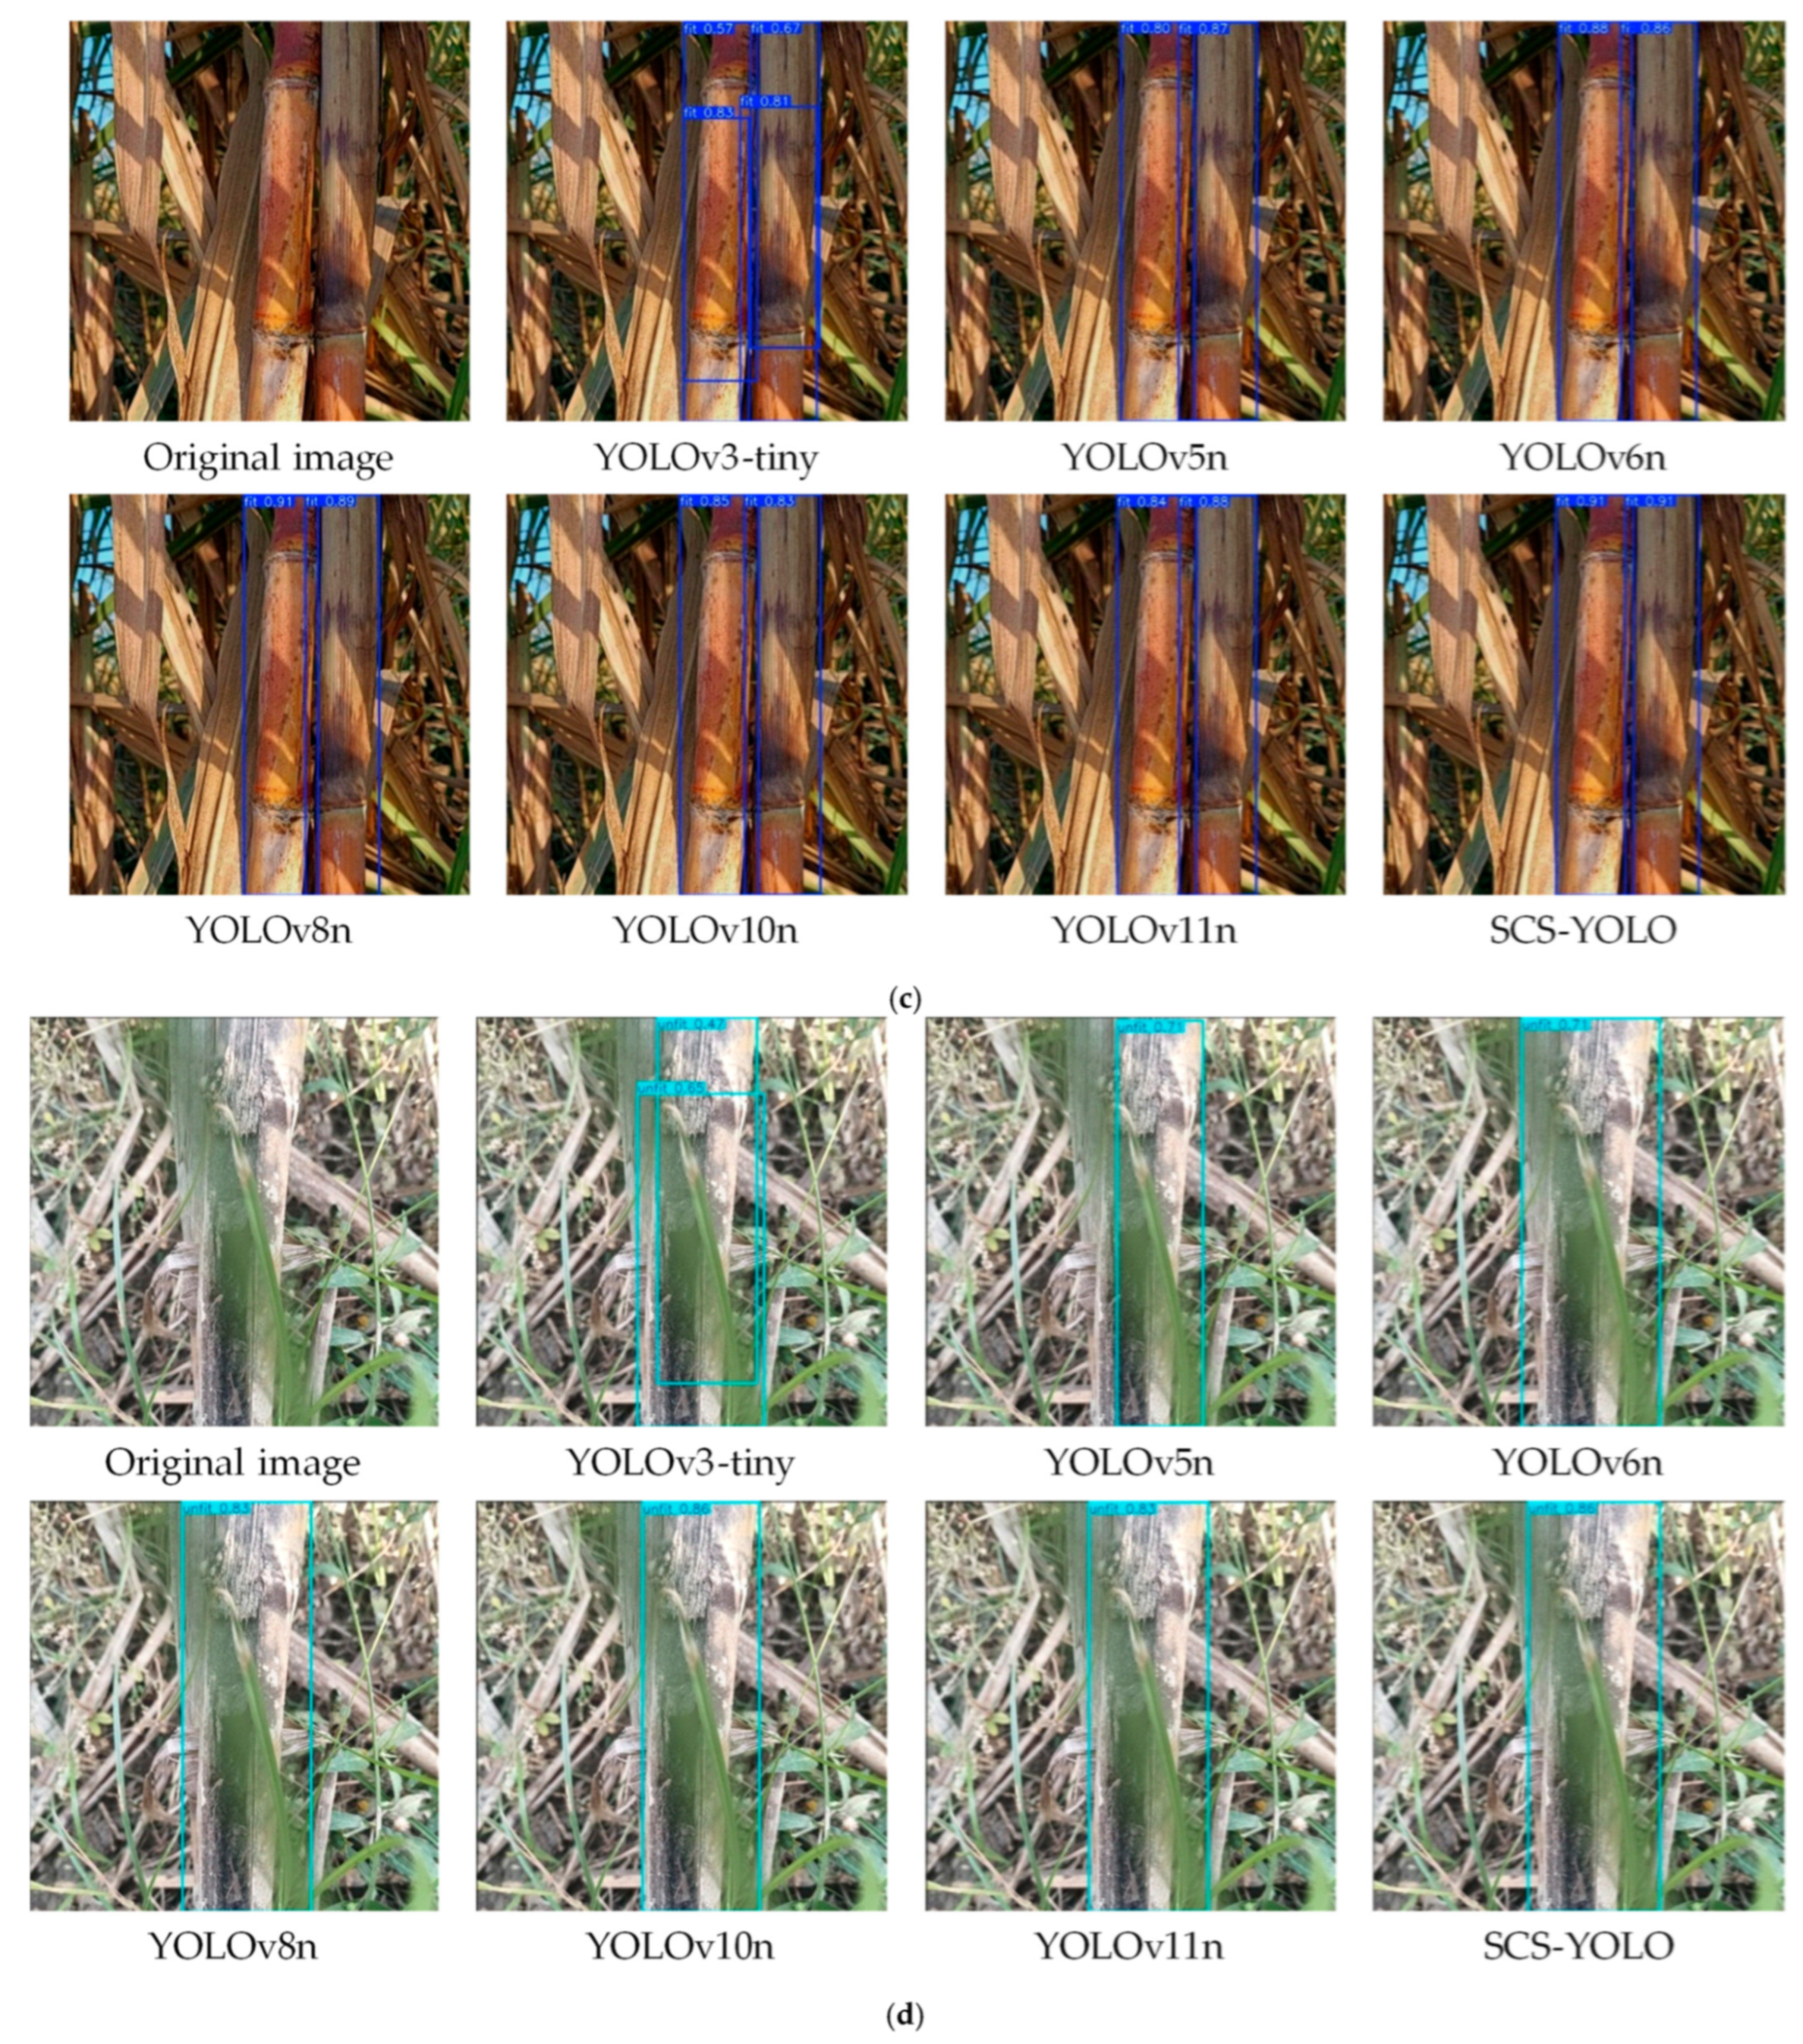
The sugarcane is in the field waiting to be harvested in Figure 11a’s background-cluttered sample, which includes complex background features like weeds and dry leaves that make image processing more challenging and noisy. Nonetheless, the SCS-YOLO model is still highly confident in identifying surface fractures in sugarcane. Under the same circumstances, other models, including YOLOv3-tiny, YOLOv6n, YOLOv10n, and YOLOv11n, show false positives or missing detections. All models identified the fine cracks in the sample in Figure 11b, where the sugarcane surface contains cracks with widths less than 0.3 mm. However, YOLOv11n and SCS-YOLO detected entire cracks with the highest confidence level (0.82), whereas YOLOv3-tiny only detected partial cracks. The uneven lighting sample in Figure 11c results from shadows from leaves cast during photography being projected onto the bent stem. This creates color and texture elements that resemble cracks, increasing the likelihood of false positives. All models identified the fracture in this sample without producing any false negatives. However, YOLOv3-tiny displayed duplicate detection boxes. Being the first to reach a confidence level higher than 0.9, SCS-YOLO offered crucial technical assistance for real-world uses in sugarcane surface crack identification. A situation where leaves partially block the sugarcane crack is seen in Figure 11d. Because YOLOv3-tiny lacks a feature alignment method, it may produce multi-scale low-quality candidate boxes for the same crack, so it still shows duplicate detection boxes in this sample. On the other hand, YOLOv8n, YOLOv10n, YOLOv11n, and SCS-YOLO showed high confidence levels in their detection results.

5. Discussion

This study improves model performance for sugarcane surface fracture detection by introducing systematic architectural modifications based on YOLOv10n. SCS-YOLO exhibits extensive performance improvements over the baseline model YOLOv10n: accuracy rises from 87.3% to 90.9% (+3.6%), recall increases from 87.0% to 89.8% (+2.8%), mAP50 rises to 94.7% (+1.8%), and mAP50:95 rises to 71.8% (+2.1%). With a parameter count of 2.2 MB and a compression rate of 19.7%, computational complexity (GFLOPs) dropped from 8.4 G to 6.0 G, a reduction of 28.6%. This significantly reduced the computing resources required during use and confirmed the efficacy of the lightweight design. According to quantitative research based on ablation tests, the DSA attention mechanism successfully suppresses background interference from sugarcane stalk textures by increasing the saliency of features in crack zones. This resulted in a 1.2% increase in model accuracy; the RFAC2f module’s hierarchical feature fusion approach boosted the capacity to detect tiny cracks. The scale sensitivity problems of conventional detection heads in detecting tiny cracks were further resolved by introducing a dynamic convolution detection head, which achieved model compression without compromising accuracy while retaining the number of parameters and increasing accuracy by 2.9%. This collaborative optimization design paradigm offers a new technological reference for agricultural phenotyping detection jobs in the sugar sector.
Although the SCS-YOLO model demonstrates high performance and low computational complexity in detecting surface cracks on sugarcane, it still has certain limitations. While theoretically capable of meeting field deployment requirements on mobile devices [59], practical testing in mobile scenarios has not yet been conducted due to current research limitations and the phased nature of crop growth cycles. Furthermore, under extremely complex conditions with abundant similar texture interference, the model’s ability to accurately distinguish crack features requires further enhancement. For extremely fine and blurred cracks, constrained by current feature extraction and detection mechanisms, further exploration is needed into the correlation between super-resolution reconstruction and the extraction of fine crack features. Finally, developing physically based rendering data augmentation methods, constructing a multi-spectral-3D joint sugarcane sample dataset encompassing diverse varieties and growth stages [60], and exploring neural architecture search (NAS) for automatic model component optimization will enhance the model’s ability to focus on crack features within complex backgrounds [61]. Further reducing computational complexity and parameter counts to improve model efficiency on edge devices, enabling more stable and efficient operation in resource-constrained environments, represents a key direction for subsequent research. Subsequent research will prioritize field testing on mainstream portable agricultural terminals to analyze inference speed and precision across different hardware architectures, while optimizing model adaptability through real-world field conditions. SCS-YOLO provides an extensible technical framework for intelligent sugarcane quality detection in the sugar industry. Its dynamic feature fusion paradigm is transferable to other crop phenotyping tasks, holding significant practical value for advancing the digital transformation of industrial crops.

6. Conclusions

This work tackles the three main issues in sugarcane crack detection: computing resource limitations, multi-scale feature analysis, and complicated background interference. It suggests the SCS-YOLO lightweight detection framework, which incorporates multifaceted creative ideas to produce performance and efficiency advances:
(1)
The recently suggested RFAC2f module builds a multi-branch feature processing network using a dynamic receptive field adaptive modeling technique to extract crack characteristics at various sizes. This module demonstrated a notable improvement over the YOLOv10n model and successfully overcame the interference generated by complex field environments on crack recognition, achieving a detection accuracy of 90.2% in the Sugarcane Crack Dataset v3.1 benchmark test.
(2)
To improve the capture of tiny crack features, the DSA module incorporates a spatial attention mechanism and a dynamic weight allocation method that adaptively modifies the weight distribution of feature maps. According to experimental data, this module greatly increases the model’s capacity to recognize intricate crack patterns by optimizing recall to 87.8% (an increase of 0.8%) and improving detection accuracy to 88.5% (a rise of 1.2%).
(3)
Through dynamic parameter sharing and lightweight convolution design, the DyHead detection head optimizes the architecture to lower the model parameter count to 2.0 MB, 23.41% less than the baseline model while preserving stable detection performance. The model can now accommodate the resource limitations of edge computing devices thanks to the inclusion of DyHead, offering a workable technological solution for accurate field detection.
The lightweight network architecture innovatively constructed by SCS-YOLO, combined with multi-scale feature enhancement and adaptive anti-interference algorithms, can be transferred to other crop stem and fruit crack detection scenarios. This provides both theoretical foundations and engineering implementation pathways for establishing a standardized intelligent prevention and control system for agricultural pests and diseases. SCS-YOLO’s edge computing-based model deployment solution effectively resolves engineering challenges in smart agriculture. By reducing hardware dependency and algorithm deployment costs, it significantly enhances the intelligent monitoring capabilities of small-to-medium-scale growers. This provides a reusable practical paradigm for bridging the gap between laboratory-based agricultural engineering technologies and high-adaptability field applications.

Author Contributions

Conceptualization: M.L.; methodology: R.L.; software: M.L.; validation: M.L., R.L., X.D. and J.W.; formal analysis: M.L.; investigation: M.L.; resources: M.L. and R.L.; data curation: M.L.; writing—original draft preparation: M.L.; writing—review and editing: X.D. and J.W.; visualization: M.L.; supervision: X.D. and J.W.; project administration: M.L.; funding acquisition: X.D. and J.W. All authors have read and agreed to the published version of the manuscript.

Funding

Science and Technology Major Project of Yunnan Province (Science and Technology Special Project of Southwest United Graduate School—Major Projects of Basic Research and Applied Basic Research): Vegetation change monitoring and ecological restoration models in Jinsha River Basin mining area in Yunnan based on multi-modal remote sensing (Grant No.: 202302AO370003); Yunnan Provincial Basic Research Program General Project: Remote Sensing Estimation of Vegetation Aboveground Carbon Sink in Central Yunnan Urban Agglomeration and Its Response to Climate Change and Human Activities, Project No.: 202401AT070103; Yunnan Provincial Basic Research Program General Project: Research on Forest Aboveground Carbon Storage Estimation in Typical Mountainous Plateau Regions Based on ICESat-2/ATLAS Data, Project No.: 202501AT070008.

Data Availability Statement

The data supporting the reported results in this study can be found at https://universe.roboflow.com/buddetection/np_mynp (accessed on 24 September 2025).

Conflicts of Interest

The authors declare no conflicts of interest.

References

  1. Wang, H.; Pan, Y.-B.; Wu, M.; Liu, J.; Yang, S.; Wu, Q.; Que, Y. Sugarcane genetics: Underlying theory and practical application. Crop J. 2024, 13, 328–338. [Google Scholar] [CrossRef]
  2. Maitra, S.; Dien, B.; Eilts, K.; Kuanyshev, N.; Cortes-Pena, Y.R.; Jin, Y.-S.; Guest, J.S.; Singh, V. Resourceful and economical designing of fermentation medium for lab and commercial strains of yeast from alternative feedstock: ‘transgenic oilcane’. Biotechnol. Biofuels Bioprod. 2025, 18, 14. [Google Scholar] [CrossRef] [PubMed]
  3. Maitra, S.; Viswanathan, M.B.; Park, K.; Kannan, B.; Alfanar, S.C.; McCoy, S.M.; Cahoon, E.B.; Altpeter, F.; Leakey, A.D.B.; Singh, V. Bioprocessing, Recovery, and Mass Balance of Vegetative Lipids from Metabolically Engineered “Oilcane” Demonstrates Its Potential as an Alternative Feedstock for Drop-In Fuel Production. ACS Sustain. Chem. Eng. 2022, 10, 16833–16844. [Google Scholar] [CrossRef]
  4. Maitra, S.; Cheng, M.-H.; Liu, H.; Cao, V.D.; Kannan, B.; Long, S.P.; Shanklin, J.; Altpeter, F.; Singh, V. Sustainable co-production of plant lipids and cellulosic sugars from transgenic energycane at an industrially relevant scale: A proof of concept for alternative feedstocks. Chem. Eng. J. 2024, 487, 150450. [Google Scholar] [CrossRef]
  5. Cao, V.D.; Kannan, B.; Luo, G.; Liu, H.; Shanklin, J.; Altpeter, F. Triacylglycerol, total fatty acid, and biomass accumulation of metabolically engineered energycane grown under field conditions confirms its potential as feedstock for drop-in fuel production. GCB Bioenergy 2023, 15, 1450–1464. [Google Scholar] [CrossRef]
  6. Gomathi, R.; Gururaja Rao, P.N.; Chandran, K.; Selvi, A. Adaptive Responses of Sugarcane to Waterlogging Stress: An Over View. Sugar Tech 2015, 17, 325–338. [Google Scholar] [CrossRef]
  7. Garcia, A.; Crusciol, C.A.C.; Rosolem, C.A.; Bossolani, J.W.; Nascimento, C.A.C.; McCray, J.M.; Dos Reis, A.R.; Cakmak, I. Potassium-magnesium imbalance causes detrimental effects on growth, starch allocation and Rubisco activity in sugarcane plants. Plant Soil 2022, 472, 225–238. [Google Scholar] [CrossRef]
  8. Yao, S.; Wang, B.; Liu, D.L.; Li, S.; Ruan, H.; Yu, Q. Assessing the impact of climate variability on Australia’s sugarcane yield in 1980–2022. Eur. J. Agron. 2025, 164, 127519. [Google Scholar] [CrossRef]
  9. Zhou, B.; Ma, S.; Li, W.; Peng, C.; Li, W. Study on sugarcane chopping and damage mechanism during harvesting of sugarcane chopper harvester. Biosyst. Eng. 2024, 243, 1–12. [Google Scholar] [CrossRef]
  10. Flack-Prain, S.; Shi, L.; Zhu, P.; Da Rocha, H.R.; Cabral, O.; Hu, S.; Williams, M. The impact of climate change and climate extremes on sugarcane production. GCB Bioenergy 2021, 13, 408–424. [Google Scholar] [CrossRef]
  11. Li, A.-M.; Chen, Z.-L.; Liao, F.; Zhao, Y.; Qin, C.-X.; Wang, M.; Pan, Y.-Q.; Wei, S.L.; Huang, D.-L. Sugarcane borers: Species, distribution, damage and management options. J. Pest Sci. 2024, 97, 1171–1201. [Google Scholar] [CrossRef]
  12. Misra, V.; Mall, A.K.; Shrivastava, A.K.; Solomon, S.; Shukla, S.P.; Ansari, M.I. Assessment of Leuconostoc spp. invasion in standing sugarcane with cracks internode. J. Environ. Biol. 2019, 40, 316–321. [Google Scholar] [CrossRef]
  13. Satpathi, A.; Chand, N.; Setiya, P.; Ranjan, R.; Nain, A.S.; Vishwakarma, D.K.; Saleem, K.; Obaidullah, A.J.; Yadav, K.K.; Kisi, O. Evaluating statistical and machine learning techniques for sugarcane yield forecasting in the tarai region of North India. Comput. Electron. Agric. 2025, 229, 109667. [Google Scholar] [CrossRef]
  14. Shang, X.-K.; Wei, J.-L.; Liu, W.; Nikpay, A.; Pan, X.-H.; Huang, C.-H. Integrated Pest Management of Sugarcane Insect Pests in China: Current Status and Future Prospects. Sugar Tech 2025, 27, 299–317. [Google Scholar] [CrossRef]
  15. Djenouri, Y.; Belbachir, A.N.; Michalak, T.; Belhadi, A.; Srivastava, G. A Knowledge-Enhanced Object Detection for Sustainable Agriculture. IEEE J. Sel. Top. Appl. Earth Obs. Remote Sens. 2025, 18, 728–740. [Google Scholar] [CrossRef]
  16. Hu, X.; Du, Z.; Wang, F. Research on detection method of photovoltaic cell surface dirt based on image processing technology. Sci. Rep. 2024, 14, 16842. [Google Scholar] [CrossRef]
  17. Tahir, N.U.A.; Zhang, Z.; Asim, M.; Chen, J.; ELAffendi, M. Object Detection in Autonomous Vehicles under Adverse Weather: A Review of Traditional and Deep Learning Approaches. Algorithms 2024, 17, 103. [Google Scholar] [CrossRef]
  18. Yang, W.; Chen, X.-D.; Wang, H.; Mao, X. Edge detection using multi-scale closest neighbor operator and grid partition. Vis. Comput. 2024, 40, 1947–1964. [Google Scholar] [CrossRef]
  19. Qiao, L.; Liu, K.; Xue, Y.; Tang, W.; Salehnia, T. A multi-level thresholding image segmentation method using hybrid Arithmetic Optimization and Harris Hawks Optimizer algorithms. Expert Syst. Appl. 2024, 241, 122316. [Google Scholar] [CrossRef]
  20. Li, Z.; Xiang, J.; Duan, J. A low illumination target detection method based on a dynamic gradient gain allocation strategy. Sci. Rep. 2024, 14, 29058. [Google Scholar] [CrossRef]
  21. He, Z.; Chen, X.; Yi, T.; He, F.; Dong, Z.; Zhang, Y. Moving Target Shadow Analysis and Detection for ViSAR Imagery. Remote Sens. 2021, 13, 3012. [Google Scholar] [CrossRef]
  22. Chen, R.; Tian, X. Gesture Detection and Recognition Based on Object Detection in Complex Background. Appl. Sci. 2023, 13, 4480. [Google Scholar] [CrossRef]
  23. Xu, F.; Zhu, Z.; Feng, C.; Leng, J.; Zhang, P.; Yu, X.; Wang, C.; Chen, X. An object planar grasping pose detection algorithm in low-light scenes. Multimed. Tools Appl. 2024, 84, 5583–5604. [Google Scholar] [CrossRef]
  24. Agrawal, S.; Natu, P. OBB detector: Occluded object detection based on geometric modeling of video frames. Vis. Comput. 2025, 41, 921–943. [Google Scholar] [CrossRef]
  25. Wang, Y.; Wang, X.; Qiu, S.; Chen, X.; Liu, Z.; Zhou, C.; Yao, W.; Cheng, H.; Zhang, Y.; Wang, F.; et al. Multi-Scale Hierarchical Feature Fusion for Infrared Small-Target Detection. Remote Sens. 2025, 17, 428. [Google Scholar] [CrossRef]
  26. Li, Z.; Miao, Y.; Li, X.; Li, W.; Cao, J.; Hao, Q.; Li, D.; Sheng, Y. Speed-Oriented Lightweight Salient Object Detection in Optical Remote Sensing Images. IEEE Trans. Geosci. Remote Sens. 2025, 63, 5601014. [Google Scholar] [CrossRef]
  27. Zhao, B.; Qin, Z.; Wu, Y.; Song, Y.; Yu, H.; Gao, L. A Fast Target Detection Model for Remote Sensing Images Leveraging Roofline Analysis on Edge Computing Devices. IEEE J. Sel. Top. Appl. Earth Obs. Remote Sens. 2024, 17, 19343–19360. [Google Scholar] [CrossRef]
  28. Oksuz, K.; Cam, B.C.; Kalkan, S.; Akbas, E. Imbalance Problems in Object Detection: A Review. IEEE Trans. Pattern Anal. Mach. Intell. 2021, 43, 3388–3415. [Google Scholar] [CrossRef] [PubMed]
  29. Wei, W.; Cheng, Y.; He, J.; Zhu, X. A review of small object detection based on deep learning. Neural Comput. Appl. 2024, 36, 6283–6303. [Google Scholar] [CrossRef]
  30. Shi, W.; Lyu, X.; Han, L. An Object Detection Model for Power Lines With Occlusions Combining CNN and Transformer. IEEE Trans. Instrum. Meas. 2025, 74, 5007012. [Google Scholar] [CrossRef]
  31. Jiang, P.; Ergu, D.; Liu, F.; Cai, Y.; Ma, B. A Review of Yolo Algorithm Developments. Procedia Comput. Sci. 2022, 199, 1066–1073. [Google Scholar] [CrossRef]
  32. Luo, Y.; Ni, L.; Cai, F.; Wang, D.; Luo, Y.; Li, X.; Fu, N.; Tang, J.; Xue, L. Detection of Agricultural Pests Based on YOLO. J. Phys. Conf. Ser. 2023, 2560, 012013. [Google Scholar] [CrossRef]
  33. Yang, M.; Peng, L.; Liu, L.; Wang, Y.; Zhang, Z.; Yuan, Z.; Zhou, J. LCSED: A low complexity CNN based SED model for IoT devices. Neurocomputing 2022, 485, 155–165. [Google Scholar] [CrossRef]
  34. Guo, X.; Jiang, Q.; Pimentel, A.D.; Stefanov, T. Model and system robustness in distributed CNN inference at the edge. Integration 2025, 100, 102299. [Google Scholar] [CrossRef]
  35. Ruiz-Barroso, P.; Castro, F.M.; Guil, N. Real-time unsupervised video object detection on the edge. Future Gener. Comput. Syst. 2025, 167, 107737. [Google Scholar] [CrossRef]
  36. Vijayakumar, A.; Vairavasundaram, S. YOLO-based Object Detection Models: A Review and its Applications. Multimed. Tools Appl. 2024, 83, 83535–83574. [Google Scholar] [CrossRef]
  37. Redmon, J.; Divvala, S.; Girshick, R.; Farhadi, A. You Only Look Once: Unified, Real-Time Object Detection. In Proceedings of the 2016 IEEE Conference on Computer Vision and Pattern Recognition (CVPR), Las Vegas, NV, USA, 27–30 June 2016; pp. 779–788. [Google Scholar]
  38. Redmon, J.; Farhadi, A. YOLOv3: An Incremental Improvement. arXiv 2018, arXiv:1804.02767. [Google Scholar] [CrossRef]
  39. Lawal, O.M. YOLOv5-LiNet: A lightweight network for fruits instance segmentation. PLoS ONE 2023, 18, e0282297. [Google Scholar] [CrossRef]
  40. Li, C.; Li, L.; Jiang, H.; Weng, K.; Geng, Y.; Li, L.; Ke, Z.; Li, Q.; Cheng, M.; Nie, W.; et al. YOLOv6: A Single-Stage Object Detection Framework for Industrial Applications. arXiv 2022, arXiv:2209.02976. [Google Scholar] [CrossRef]
  41. Ma, N.; Su, Y.; Yang, L.; Li, Z.; Yan, H. Wheat Seed Detection and Counting Method Based on Improved YOLOv8 Model. Sensors 2024, 24, 1654. [Google Scholar] [CrossRef] [PubMed]
  42. Wang, A.; Chen, H.; Liu, L.; Chen, K.; Lin, Z.; Han, J.; Ding, G. YOLOv10: Real-Time End-to-End Object Detection. arXiv 2024, arXiv:2405.14458. [Google Scholar] [CrossRef]
  43. Zou, C.; Yu, S.; Yu, Y.; Gu, H.; Xu, X. Side-Scan Sonar Small Objects Detection Based on Improved YOLOv11. J. Mar. Sci. Eng. 2025, 13, 162. [Google Scholar] [CrossRef]
  44. Wei, M.; Chen, K.; Yan, F.; Ma, J.; Liu, K.; Cheng, E. YOLO-ESFM: A multi-scale YOLO algorithm for sea surface object detection. Int. J. Nav. Archit. Ocean Eng. 2025, 17, 100651. [Google Scholar] [CrossRef]
  45. Mittal, P. A comprehensive survey of deep learning-based lightweight object detection models for edge devices. Artif. Intell. Rev. 2024, 57, 242. [Google Scholar] [CrossRef]
  46. Pitts, H. Warehouse Robot Detection for Human Safety Using YOLOv8. In Proceedings of the SoutheastCon 2024, Atlanta, GA, USA, 20–24 March 2024; pp. 1184–1188. [Google Scholar]
  47. Shorten, C.; Khoshgoftaar, T.M. A survey on Image Data Augmentation for Deep Learning. J. Big Data 2019, 6, 60. [Google Scholar] [CrossRef]
  48. Guo, C.; Huang, H. Enhancing camouflaged object detection through contrastive learning and data augmentation techniques. Eng. Appl. Artif. Intell. 2025, 141, 109703. [Google Scholar] [CrossRef]
  49. Chen, R.; Zhang, D.; Liu, Q.; Li, J. Robust 3D Object Detection Based on Point Feature Enhancement in Driving Scenes. In Proceedings of the 2024 IEEE Intelligent Vehicles Symposium (IV), Jeju Island, Republic of Korea, 2–5 June 2024; pp. 2791–2798. [Google Scholar]
  50. Zhang, X.; Liu, C.; Yang, D.; Song, T.; Ye, Y.; Li, K.; Song, Y. RFAConv: Innovating Spatial Attention and Standard Convolutional Operation. arXiv 2024, arXiv:2304.03198. [Google Scholar] [CrossRef]
  51. Chen, Y.; Dai, X.; Liu, M.; Chen, D.; Yuan, L.; Liu, Z. Dynamic Convolution: Attention Over Convolution Kernels. In Proceedings of the 2020 IEEE/CVF Conference on Computer Vision and Pattern Recognition (CVPR), Seattle, WA, USA, 13–19 June 2020; pp. 11027–11036. [Google Scholar]
  52. Yang, L.; Zhang, R.-Y.; Li, L.; Xie, X. SimAM: A Simple, Parameter-Free Attention Module for Convolutional Neural Networks. In Proceedings of the 38th International Conference on Machine Learning, Virtually, 18–24 July 2021. [Google Scholar]
  53. Kim, W.; Tanaka, M.; Sasaki, Y.; Okutomi, M. Deformable element-wise dynamic convolution. J. Electron. Imaging 2023, 32, 053029. [Google Scholar] [CrossRef]
  54. Dai, X.; Chen, Y.; Xiao, B.; Chen, D.; Liu, M.; Yuan, L.; Zhang, L. Dynamic Head: Unifying Object Detection Heads with Attentions. In Proceedings of the 2021 IEEE/CVF Conference on Computer Vision and Pattern Recognition (CVPR), Nashville, TN, USA, 19–25 June 2021; pp. 7369–7378. [Google Scholar]
  55. Tang, P.; Ding, Z.; Jiang, M.; Xu, W.; Lv, M. LBT-YOLO: A Lightweight Road Targeting Algorithm Based on Task Aligned Dynamic Detection Heads. IEEE Access 2024, 12, 180422–180435. [Google Scholar] [CrossRef]
  56. Park, I.; Kim, S. Performance Indicator Survey for Object Detection. In Proceedings of the 2020 20th International Conference on Control, Automation and Systems (ICCAS), Busan, Republic of Korea, 13–16 October 2020; pp. 284–288. [Google Scholar]
  57. Ren, S.; He, K.; Girshick, R.; Sun, J. Faster R-CNN: Towards Real-Time Object Detection with Region Proposal Networks. IEEE Trans. Pattern Anal. Mach. Intell. 2017, 39, 1137–1149. [Google Scholar] [CrossRef] [PubMed]
  58. Chattopadhay, A.; Sarkar, A.; Howlader, P.; Balasubramanian, V.N. Grad-CAM++: Generalized Gradient-Based Visual Explanations for Deep Convolutional Networks. In Proceedings of the 2018 IEEE Winter Conference on Applications of Computer Vision (WACV), Lake Tahoe, NV, USA, 12–15 March 2018; pp. 839–847. [Google Scholar]
  59. Qin, D.; Leichner, C.; Delakis, M.; Fornoni, M.; Luo, S.; Yang, F.; Wang, W.; Banbury, C.; Ye, C.; Akin, B.; et al. MobileNetV4—Universal Models for the Mobile Ecosystem. arXiv 2024, arXiv:2404.10518. [Google Scholar] [CrossRef]
  60. Pino, A.F.S.; Apraez, L.S.C. Artificial intelligence and multispectral imaging in coffee production: A systematic literature review. Eur. J. Agron. 2025, 170, 127725. [Google Scholar] [CrossRef]
  61. Saeed, F.; Tan, C.; Liu, T.; Li, C. 3D neural architecture search to optimize segmentation of plant parts. Smart Agric. Technol. 2025, 10, 100776. [Google Scholar] [CrossRef]
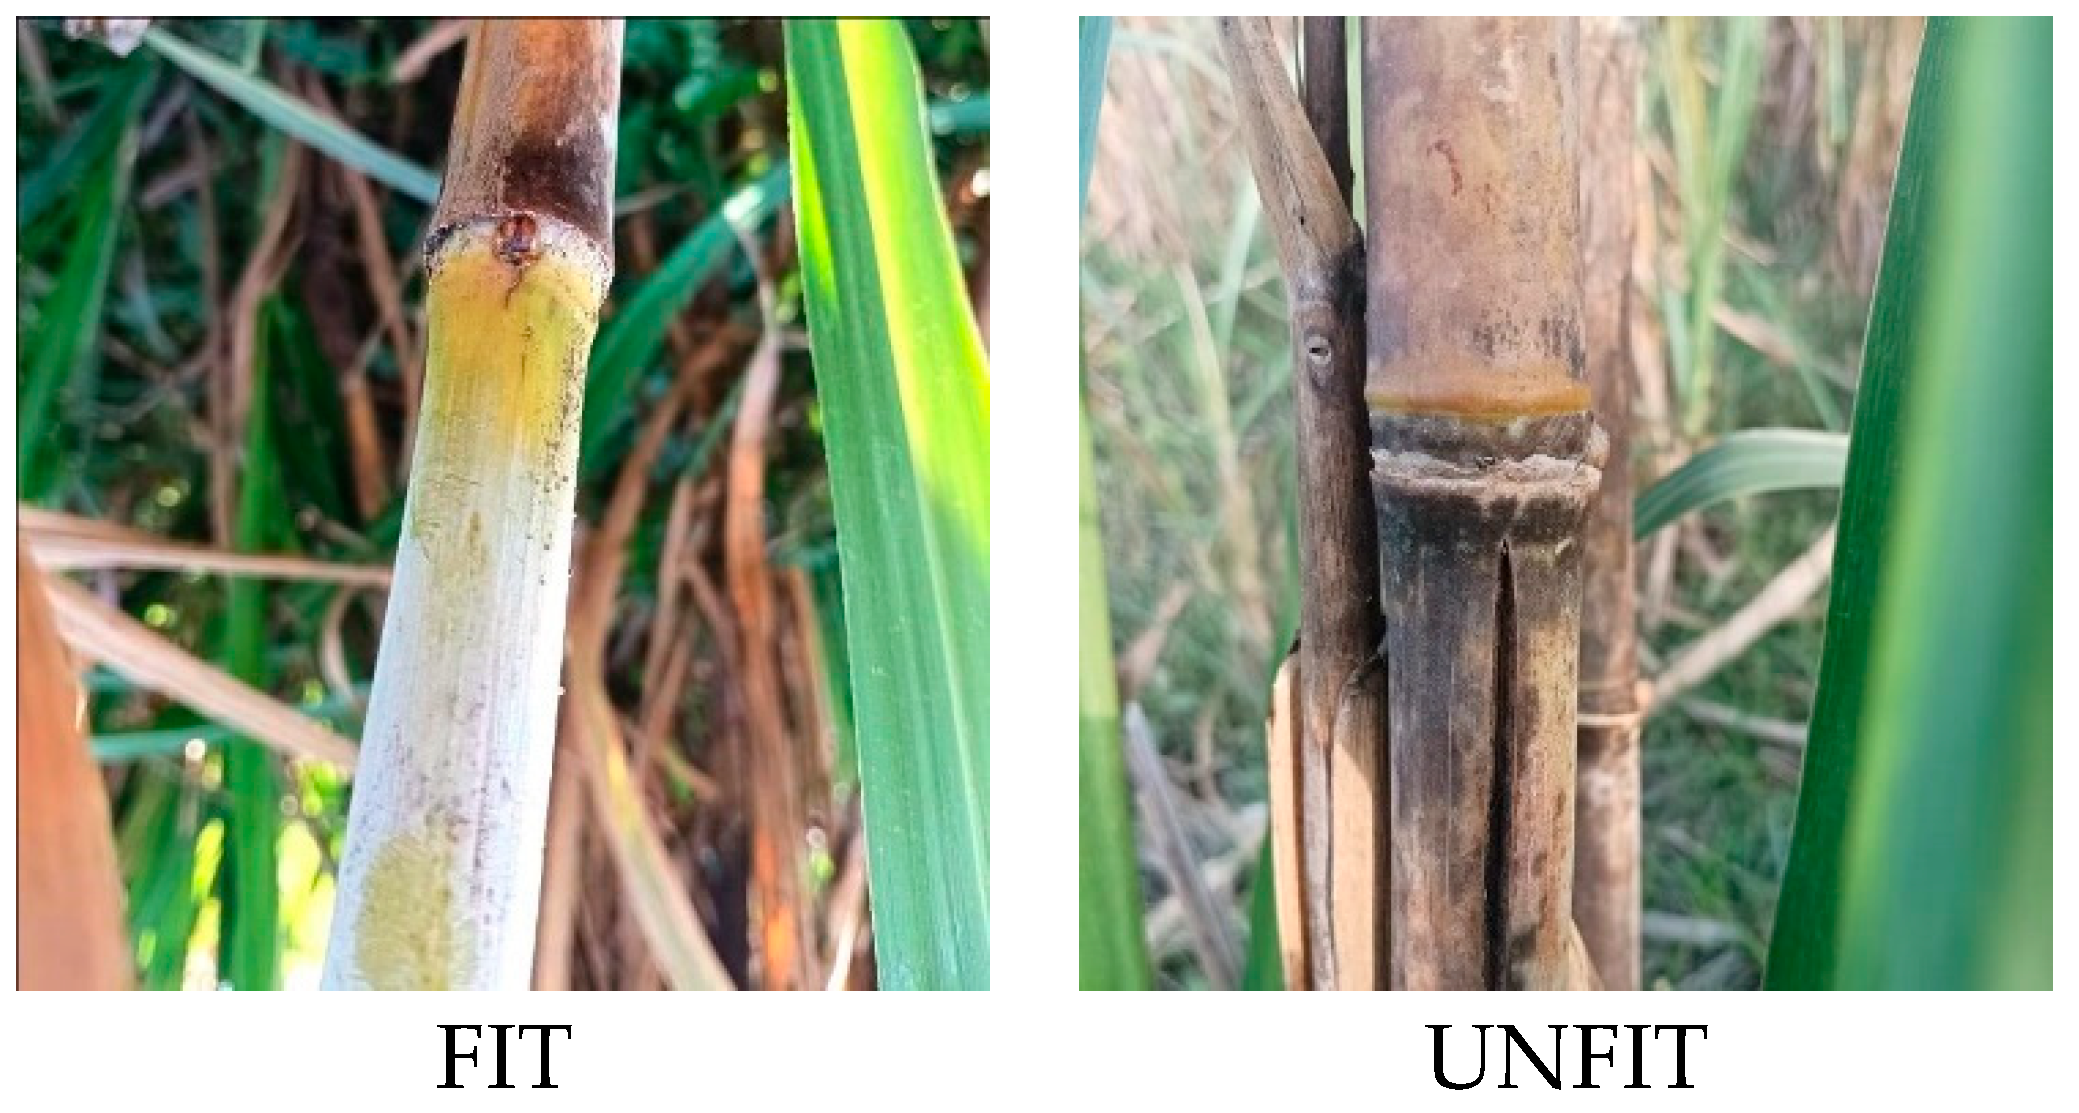
Figure 1. Comparative phenotypic characterization of sugarcane stalks.
Agriengineering 07 00321 g001
Figure 2. Schematic diagram of data augmentation methods. (a) Original image, (b) horizontal flip, (c) vertical flip, (d) clockwise rotation, (e) counterclockwise rotation, (f) inverted rotation, (g) Saturation −30%, (h) Saturation +30, (i) Brightness +25%, (j) Brightness −25%, (k) Exposure +15%, (l) Exposure −15%.
Agriengineering 07 00321 g002
Figure 3. SCS-YOLO network architecture diagram.
Agriengineering 07 00321 g003
Figure 4. Receptive-field attention C2f structure diagram.
Agriengineering 07 00321 g004
Figure 5. Dynamic Simam Attention Module structure diagram.
Agriengineering 07 00321 g005
Figure 6. Dynamic Detection Head structure diagram.
Agriengineering 07 00321 g006
Figure 7. Performance index change curves of different module combinations in different training periods. (a) P curve, (b) R curve, (c) mAP50 curve, (d) mAP50:95 curve.
Agriengineering 07 00321 g007
Figure 8. Performance index change curves of different models in different training periods. (a) P curve, (b) R curve, (c) mAP50 curve, (d) mAP50:95 curve.
Agriengineering 07 00321 g008
Figure 9. Bar chart comparison of complexity metrics for different network models.
Agriengineering 07 00321 g009
Figure 10. Visualized Grad-CAM heatmaps of inference experiments for each model. (a) Complex background interference samples, (b) microcrack sample.
Agriengineering 07 00321 g010
Figure 11. Visualized detection results of inference experiments for each model. (a) Background cluttered samples, (b) microcrack sample, (c) uneven lighting samples, (d) obstructed by branches and leaves samples.
Agriengineering 07 00321 g011aAgriengineering 07 00321 g011b
Table 1. Experimental results of the ablation test.
YOLOv10RFAC2fDSADyHeadP/%R/%mAP50/%mAP50:95/%F1-ScoreParam/MGFLOPs/GSize/MFPS
×××87.387.092.969.787.152.7078208.45.5191
××90.285.892.869.487.952.6947648.45.48129
××88.587.893.065.688.152.8221249.25.8096
××89.491.494.371.090.382.0737905.24.2586
×91.687.393.870.289.393.5841085.67.22116
×89.689.394.270.789.452.0607345.24.2295
×91.489.194.772.390.232.1880946.04.54103
90.989.894.771.890.352.1750386.04.51122
Note: In the table, A indicates that the model applies RFAC2f, B indicates that multiple DSA modules are added, and C indicates that the DyHead dynamic detection head is used.
Table 2. Comparison of network model accuracy and performance indicators.
ModelP/%R/%mAP50/%mAP50:95/%F1-ScoreParameters/MGFLOPs/GSize/MFPS
Faster R-CNN80.475.894.169.378.03137.098724370.2108.220.38
YOLOv3-tiny74.478.982.141.276.5812.13315619.023.369
YOLOv5n90.588.492.968.889.432.5088547.25.1129
YOLOv6n91.388.194.172.089.674.23834211.98.375
YOLOv8n93.088.894.472.490.853.0112228.26.0109
YOLOv10n87.387.092.969.787.152.7078208.45.191
YOLOv11n92.187.494.872.089.692.5902306.45.3111
SCS-YOLO90.989.894.771.890.352.1750386.04.5122
Disclaimer/Publisher’s Note: The statements, opinions and data contained in all publications are solely those of the individual author(s) and contributor(s) and not of MDPI and/or the editor(s). MDPI and/or the editor(s) disclaim responsibility for any injury to people or property resulting from any ideas, methods, instructions or products referred to in the content.