Abstract
Muscle synergies offer valuable insights into the movement strategies employed by the central nervous system and present a promising avenue for clinical applications. However, the field lacks a complete understanding of how surface electromyography processing parameters affect muscle synergy analysis, which in turn has hindered cross-study comparisons and the translation of experimental results to clinical contexts. To address the gap, this study presents a systematic evaluation of interactive effects of three key parameters on muscle synergy analysis, including nine cut-off frequencies of low-pass filters, five normalization methods, and five synergy extraction criteria, covering 225 unique combinations. Using a comprehensive running dataset of 135 subjects, this study examined variance accounted for (VAF) and correlation coefficient (R2) metrics, the number of synergies, and synergy structure consistency under different parameter settings. Synergy similarity was used as a quantitative measure of synergy stability across different parameter settings. The results demonstrated that cut-off frequencies, normalization methods, and criteria choices interactively influenced the outcomes. Notably, VAF consistently yielded higher values than R2, highlighting differences in how these metrics capture explained variance. Error VAF (EVAF) emerged as the most robust criterion for determining the number of synergies, especially when combined with normalization methods by maximum value (MAX), average value (AVE), or unit variance (UVA) and moderately high cut-off frequencies, which led to more stable synergy structures across conditions. Furthermore, the predefined threshold associated with each criterion markedly affected the estimated number of synergies. These findings provide structured guidelines for muscle synergy analysis, helping to standardize preprocessing and extraction parameters, improve reproducibility across studies, and enhance the clinical applicability of synergy-based assessments.
1. Introduction
Recent studies have demonstrated that the central neural system (CNS) coordinates movements by recruiting a set of modules known as muscle synergies, thereby simplifying the control of numerous degrees of freedom in the musculoskeletal system. This modular organization has been observed at several levels of the motor hierarchy [1]. Extensive research suggests that muscle synergies hold significant potential as a tool for human–machine interaction and for assessing motor function in clinical populations. Specifically, in human–machine interaction, synergies provide low-dimensional control primitives that can be mapped to device degrees of freedom for proportional and interpretable control, supporting rapid calibration and robust operation across tasks [2,3,4]. In clinical assessment, synergy-based summaries such as the estimated number of synergies and changes in module composition/activation capture clinically meaningful alterations in motor coordination and can help track impairment and recovery [5,6,7].
However, several factors, including individual physiological and pathological differences in motor control [8,9,10] and variations in experimental methodologies [11,12], have hindered the translation of experimental findings into clinical applications [13,14]. Among these factors, a key issue is the limited understanding of how choices in surface electromyography (EMG) signal processing parameters impact the outcomes of muscle synergy analysis, which is crucial for clinical application and meaningful comparison among studies.
Muscle synergy analysis typically involves several steps: EMG preprocessing (denoising, rectification, low-pass filtering to obtain an envelope, and normalization), identifying the number of synergies, and then extracting and analyzing synergy patterns. The parameters chosen at each step can influence the results more or less. As reported [15,16], the cut-off frequency and order of band- and high-pass filters for reducing noise and artifacts have minimal effects on muscle synergies [17,18]. For example, varying the high-pass/band-pass within standard EMG ranges (e.g., high-pass 10–30 Hz; band-pass 20–500 vs. 50–500 Hz) or using moderate filter orders mainly suppresses drift and mains noise. Once signals are rectified and low-pass filtering, yields negligible changes in synergy outcomes. However, the cut-off frequency of low-pass filter (hereinafter referred to as cut-off frequency) for obtaining EMG envelopes significantly affects the amount of variance accounted for (VAF), as well as the number of synergies and synergy weights [17,18,19,20,21]. In general, higher cut-off frequencies yield lower VAF values and consequently identify a greater number of synergies [19].
Normalization methods for EMG processing also alter outcomes. Some studies have compared the own maximum value vs. pretreatment maximum value [20], and maximum value (MAX) vs. unit variance (UVA) [21], and reported that they have relatively small effects on the number of synergies and VAF. In contrast, other normalization choices, such as maximum voluntary contraction (MVC) and MAX, can alter the amount of variance explained and potentially affect synergy composition [18]. At least six normalization methods, MVC, MAX, median and average value (MED and AVE), UVA, and unit amplitude (UAM), have been implemented in previous work [16]. Nevertheless, few studies have conducted a systematic assessment of how these normalization methods affect synergy outputs.
Similarly, multiple criteria for identifying the number of synergies (hereinafter referred to as criteria) based on the VAF or correlation coefficient (R2) have been reported [13], such as global VAF, local VAF, muscle VAF, error VAF, and random VAF (Table 1). Different studies have adopted either a single criterion or a combination of several criteria. However, prior work has shown that certain criteria (e.g., GVAF and EVAF) can interact with preprocessing choices like cut-off frequency, influencing the number of synergies [19]. Yet, to date, there have been only limited investigations providing a comprehensive evaluation of these factors in combination.

Table 1.
Criteria for identifying the number of synergies.
To sum up, although EMG processing parameters (such as cut-off frequencies and normalization methods) and extraction criteria each influence muscle synergy analysis, most prior studies have examined these factors in isolation. The interactive effects of these parameters on key results, such as the number of synergies, explained variance, and synergy structure, remain largely unaddressed. Moreover, the stability of the extracted synergies across varying settings has seldom been systematically evaluated, leaving uncertainty in cross-study comparability. This knowledge gap impedes the development of robust, standardized guidelines for muscle synergy analysis.
Given the wide range of applications and the considerable inter- and intra-subject variability in synergy analysis [22], it is challenging to establish a single set of “one-size-fits-all” parameters for all studies, especially for patient populations. However, a more comprehensive understanding of how these parameters collectively affect synergy analysis can provide consistent and reliable insights for both clinical practice and cross-study comparisons. Furthermore, the ability to accurately identify muscle synergies and understand their organization can help clinicians design more targeted and effective rehabilitation programs for individuals with motor impairments, such as post-stroke patients [23,24].
To this end, this study conducted a comprehensive analysis examining nine cut-off frequencies, five normalization methods, and five synergy extraction criteria and their effects on the explained variance, the number of synergies, and the muscle synergy structures using a large publicly available running dataset of 135 subjects. Based on the indexed literature and existing scoping reviews, prior studies have typically addressed isolated portions of the pipeline, whereas here we jointly evaluate all three categories of parameters under a single protocol. This analysis provides important insights that enhance the interpretability and comparability of results across different laboratories and experimental conditions, including applications such as upper- or lower-limb motor function assessment in post-stroke patients. In addition, based on the findings, this study offers evidence-based parameter recommendations aimed at improving the stability of synergy extraction and facilitating reproducibility across studies, thereby addressing the noted gaps in the literature.
2. Materials and Methods
2.1. Research Data
A publicly available dataset on human running [25], including 135 healthy volunteers (78 males, height 175 ± 9 cm, weight 69 ± 11 kg, age 30 ± 5 years, means ± SD), was used in this study. After a self-select warm-up, the volunteers ran at a preferred or predefined speed (average speed 2.65 ± 0.31 m/s) on a treadmill (mercury, H-p-cosmos Sports & Medical GmbH, Nussdorf, Germany) equipped with a pressure plate for the plantar pressure recording at 120 Hz (FDMTHM-S, zebris Medical GmbH, Isny im Allgäu, Germany). Thirteen ipsilateral muscle activities were recorded using a 16-channel wireless bipolar EMG system (myon m320, myon AG, Schwarzenberg, Switzerland) with a sampling frequency of 1000 Hz, including gluteus medius (ME), gluteus maximus (MA), tensor fasciæ latæ (FL), rectus femoris (RF), vastus medialis (VM), vastus lateralis (VL), semitendinosus (ST), biceps femoris (BF), tibialis anterior (TA), peroneus longus (PL), gastrocnemius medialis (GM), gastrocnemius lateralis (GL), and soleus (SO). Each participant performed running for two trials of 60 s each. The experiment was approved by the local Ethics Committee. All participants gave written informed consent under the Declaration of Helsinki. More details about the experimental setups can be found in the work [25].
2.2. Data Preprocessing and Synergies Extraction
One study investigated the influence of gait cycles on muscle synergy analysis and showed that 20 cycles were needed for more representative extraction of muscle synergies during walking [26]. Thus, the first 20 cycles of the second trial (43.2 ± 4.2 cycles across subjects) were used for analysis in this study. Raw EMG signals first underwent a series of preprocessing steps [22,27] (Figure 1), including band-pass filtering with a cut-off frequency of 20–450 Hz, demeaning, full-wave rectification, and low-pass filtering with a wide range of cut-off frequencies (2 Hz, 4 Hz, 6 Hz, 8 Hz, 10 Hz, 15 Hz, 20 Hz, 30 Hz, and 40 Hz). These cut-off frequencies were selected a priori from commonly reported values in the synergy literature [1], with finer sampling near 2–10 Hz to probe potential over-smoothing and coarser steps above 10 Hz to capture trend changes and latency trade-offs. In addition, the 2–8 Hz aligns with known activation dynamics (approximately 30–80 ms time constants) and typical burst durations (approximately 100–300 ms) [28].
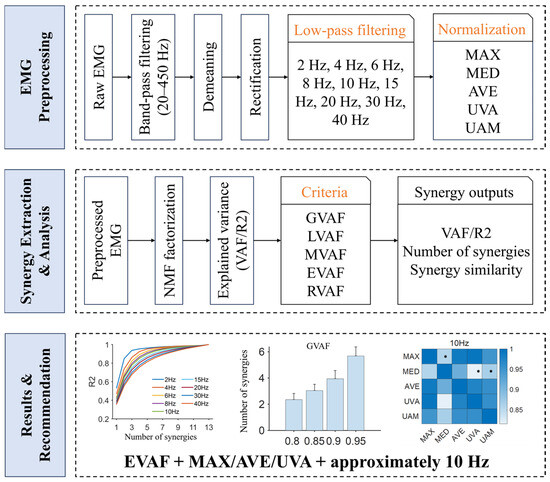
Figure 1.
Study protocol. This study systematically evaluates how EMG processing choices (shown in yellow font) influence muscle synergy analysis across (i) nine low-pass cut-off frequencies (2, 4, 6, 8, 10, 15, 20, 30, 40 Hz), (ii) five normalization methods (MAX, MED, AVE, UVA, UAM), and (iii) five synergy identification criteria (GVAF, LVAF, MVAF, EVAF, RVAF). Outcomes include VAF/R2, the estimated number of synergies, and synergy similarity. Based on these comparisons, this study recommend EVAF + MAX/AVE/UVA with an approximately 10 Hz cut-off frequency as a robust default. Asterisks indicate that the similarity is below the significance level (0.87).
Previous studies have reported few influences of the filter order and the frequency of the band-pass filter [15,16]. Thus, we implemented a 4th-order Butterworth filter for both band-pass and low-pass filters, a common choice in synergy analysis pipelines [13]. There may be negative values in the preprocessed signals. They were set to a small positive value of 1 × 10⁻⁵ for synergies extraction. Muscle activation envelopes were then normalized using five methods: MAX, MED, AVE, UVA (x/std(x)), and UAM (x/norm(x)).
Although MVC might be the most appropriate method for explaining EMG signals among subjects [29], it was not included in this study. First, the current dataset did not record the MVC of each muscle. More importantly, MVC measures usually need large challenges, such as optimal positions [30]. Due to neuromuscular impairment, such as stroke, it is difficult for patients to perform MVC tests.
Each gait cycle that was labeled in the raw dataset was time-normalized to 101 sample points using an interpolation method [31]. Thirteen muscle activity vectors were then organized into an m-by-t matrix X (where m = 13 and t = 101 points × 20 gait cycles). Muscle synergies were extracted using a non-negative matrix factorization (NMF) algorithm [32], which is widely regarded as the most appropriate method for synergies extraction [33,34,35,36]. The locomotor modules W and motor primitives C were obtained such that X = WC + E, where E represents the residual error. To determine the appropriate number of synergies, the NMF was performed 20 times (to mitigate initialization dependence of NMF) with a multiplicative update algorithm and random initialization for each number of synergies from one to thirteen in this study. Each run was iterated until a convergence criterion was met (maximum number of iterations 1 × 10⁴, change in residual < 1 × 10⁻⁴, and relative change in the elements < 1 × 10⁻⁵). The explained variance was computed using two methods: VAF and R2. The number of synergies was identified based on five criteria (Table 1).
where is the number of muscles, is the number of samples, is mean muscle activation. Thresholds for each criterion were pre-specified following common practice to ensure comparability and to avoid post hoc tuning. These fixed settings allowed us to isolate preprocessing effects on synergy outcomes under standard analysis regimes.
2.3. Data Analysis and Statistics
To determine the influence of EMG preprocessing parameters on the outputs of muscle synergy analysis, only one parameter varied with respect to the default parameters: cut-off frequency, 10 Hz; normalization method, MAX; explained variance, VAF; criterion, GVAF. For five criteria, a set of predefined parameters was implemented: GVAF, 0.9; LVAF, 0.9 and 0.05; MVAF, 0.8; EVAF, 1 × 10⁻³; RVAF, 75%.
The variation in synergy weights across cut-off frequencies and normalization methods was examined using a Wilcoxon rank-sum test. The extracted synergies were first matched across subjects and conditions based on the synergy similarity, computed by cosine similarity. Average synergy similarity of matched synergies was then used to assess the similarity level of muscle synergies across conditions [23,24].
where and are the i-th synergy vector of and , respectively. is the number of synergy. indicates the normalized scalar product. To define the random similarity threshold, we drew 1000 random pairs of synergy vectors and estimated the 95th-percentile of the resulting cosine similarity distribution. In our data, this sample size met the target precision for the percentile and is consistent with prior practice in synergy similarity analyses [37]. The random distribution was generated per subject from a large pool of synergies extracted across conditions. The resulting 95th-percentile threshold was 0.87 in this study [38].
All statistical analyses were performed at the significance level of p = 0.05. The effect of cut-off frequencies and normalization methods on the explained variance (VAF/R2) was examined using a Kruskal–Wallis test. The influence of normalization methods, cut-off frequencies, criteria, and threshold on the number of synergies was evaluated using a Wilcoxon rank-sum test. Post hoc comparisons (Kruskal–Wallis for the explained variance; Wilcoxon rank-sum for the number of synergies) were performed with Bonferroni corrections for multiple comparisons (normalization = 10, cut-off frequency = 36, criteria = 10, and threshold = 6). The relationships between the cut-off frequencies and the number of synergies were fitted for each criterion and evaluated by Pearson correlation coefficient. All analyses were performed in MATLAB R2020b on a 64-bit Windows workstation (Intel Core i7-class CPU, 32 GB RAM).
3. Results
We first evaluate how normalization and cut-off frequency affect explained variance (Section 3.1), then quantify their impact on the estimated number of synergies and threshold sensitivity (Section 3.2 and Section 3.3), and finally assess effects on spatial synergy weights and similarity (Section 3.4).
3.1. Normalization Methods and Cut-Off Frequencies Affect the Explained Variance
Both normalization methods and cut-off frequencies exhibited a significant influence on the explained variance (p < 0.001). The effect of normalization methods on VAF and R2 was consistent across the analysis (Figure 2). MED had the highest value, and UAM yielded the smallest. The VAF/R2 curves for MAX, AVE, and UVA were closely aligned. Post hoc analysis revealed no significant difference in VAF values between MAX and AVE (p > 0.05). Additionally, within the 4–8 Hz cut-off frequency, no statistical difference in VAF values was observed between MAX and UVA (p > 0.05). At a low cut-off frequency of 2 Hz, no significant differences in VAF values were detected across MAX, MED, and AVE (p > 0.05). For R2, significant differences were observed among all five normalization methods. However, under the 4–6 Hz cut-off frequency, R2 values between MAX and UVA were comparable (p > 0.05).
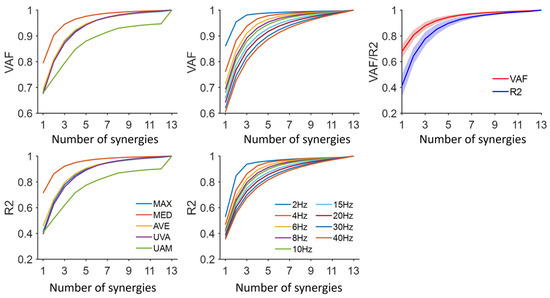
Figure 2.
Explained variance for each normalization method and cut-off frequency. Five normalization methods were shown: MAX, maximum value; MED, median value; AVE, average value; UVA, unit variance; UAM, unit amplitude. The default cut-off frequency and normalization method were 10 Hz and MAX, respectively. The average VAF/R2 for each number of synergies was shown. The shaded area is the standard deviation across subjects.
Higher cut-off frequencies consistently resulted in smaller VAF/R2 values (Figure 2). Post hoc analysis confirmed that this difference was statistically significant (p < 0.05). However, no significant differences in R2 were observed under the conditions of UAM and low cut-off frequencies (below 10 Hz) (p > 0.05). When the same number of synergies was extracted (default: MAX, 10 Hz), the VAF values were significantly higher than those of R2 (p < 0.001).
3.2. The Number of Synergies Varied Across Normalization Methods, Cut-Off Frequencies, and Criteria
The number of synergies was significantly affected by normalization methods, cut-off frequencies, and criteria (p < 0.05). The trends in the number of synergies were consistent across both VAF and R2 (Figure 3 and Figure 4). Because VAF values were higher than R2 for a specified number, R2 typically required more synergies to reach its matched threshold (p < 0.001). Among the normalization methods, UAM resulted in the highest number of synergies, while MED yielded the lowest. The number of synergies identified using MAX, AVE, and UVA was comparable. Post hoc analysis revealed no significant differences between MAX and UVA under both VAF and R2 settings (p > 0.05). The number of synergies significantly increased with the cut-off frequencies (p < 0.001). Additionally, significant differences were observed among the five criteria, with MVAF producing the highest number of synergies and EVAF yielding the lowest. Overall, the results demonstrated that normalization methods, cut-off frequencies, and criteria critically impacted the number of synergies.
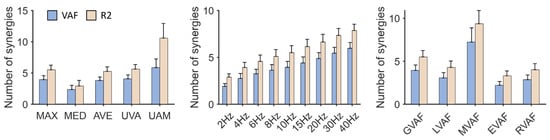
Figure 3.
The number of synergies. Five normalization methods were shown: MAX, maximum value; MED, median value; AVE, average value; UVA, unit variance; UAM, unit amplitude. Five criteria for identifying the number of synergies were shown: GVAF, Global VAF; LVAF, Local VAF; MVAF, Muscle VAF; EVAF, Error VAF; RVAF, Random VAF. The default parameters were: cut-off frequency, 10 Hz, criterion, GVAF, normalization method, MAX.
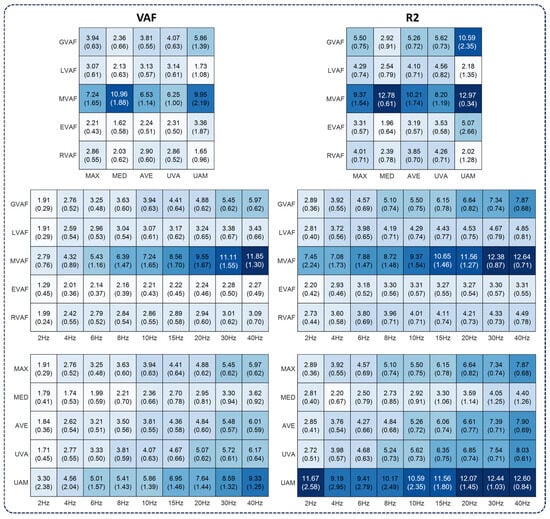
Figure 4.
The number of synergies under various parameters. The first column was based on the VAF, and the second was based on the R2. The numbers were mean values (standard deviation) across subjects. For each subfigure, the default parameters were cut-off frequency, 10 Hz; normalization method, MAX; and criterion, GVAF (0.9).
This study further investigated the relationship between the number of synergies and cut-off frequencies by fitting a linear model (Figure 5, Table 2). The results demonstrated that, in most conditions, the number of synergies exhibited a linear increase with higher cut-off frequencies. However, a notable exception was observed under the settings of LVAF, EVAF, and RVAF when UAM was used for normalization, where the correlation coefficients were negative (Table 2).
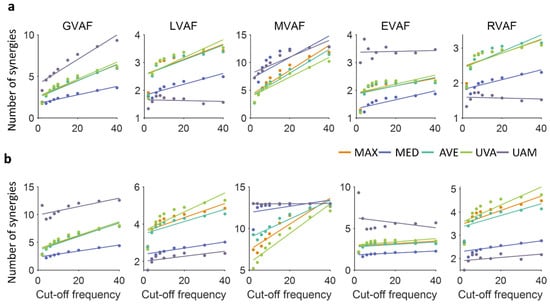
Figure 5.
Correlation between the number of synergies and cut-off frequencies when VAF (a) and R2 (b) were used, respectively.
Table 2.
Correlation coefficients between the number of synergies and cut-off frequencies for each normalization method and criterion when VAF and R2 were used, respectively. Bold indicates that the p-value is below 0.05.
3.3. The Number of Synergies Changed with the Threshold of Each Criterion
In this analysis, thresholds for each criterion were pre-specified following common practice to ensure cross-study comparability. The results showed that the number of synergies varied with the predefined thresholds of each criterion (Figure 6). Specifically, for GVAF, MVAF, and EVAF, the number of synergies was significantly influenced by the threshold (p < 0.05). For LVAF, which requires two predefined parameters, the number of synergies increased as the first threshold was raised (tested at 0.8, 0.85, 0.9, and 0.95) while the second threshold was fixed at 0.05 (Figure 6, LVAF (0.05)). However, no significant differences were observed for thresholds above 0.8. When the second threshold was set to 0.03 (Figure 6, LVAF (0.03)), the number of synergies increased significantly with higher values of the first threshold (p < 0.05). For RVAF, significant differences (p < 0.05) were observed between thresholds of 0.7 and 0.8, 0.7 and 0.85, and 0.75 and 0.85.
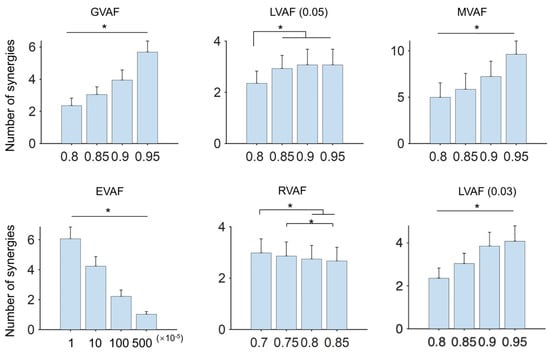
Figure 6.
The number of synergies under different predefined thresholds. In this analysis, the normalization method and cut-off frequency were the default (MAX and 10 Hz). For each criterion, four usually used thresholds were evaluated (x-axis). Two parameters were required for LVAF. The second parameter was 0.05 and 0.03 in this analysis. Asterisks indicate Bonferroni-adjusted significance level p < 0.05.
3.4. Normalization Methods and Cut-Off Frequencies Affect Synergy Weights
Under the default settings, four synergies (3.94 ± 0.63) were identified. On the other hand, previous studies have frequently reported four or five synergies in running setup in healthy individuals [25,39,40]. In line with these findings, the synergy structure was evaluated with four and five synergies. The results revealed that normalization methods and cut-off frequencies significantly influenced synergy weights. Statistical differences were observed in most synergy weights across normalization methods, regardless of whether four or five synergies were extracted (Kruskal–Wallis, p < 0.05; Figure 7). When synergy weights were compared across different cut-off frequencies, comparable weights were observed in several muscles, such as VM and VL in S2. These findings were consistent when five synergies were identified.
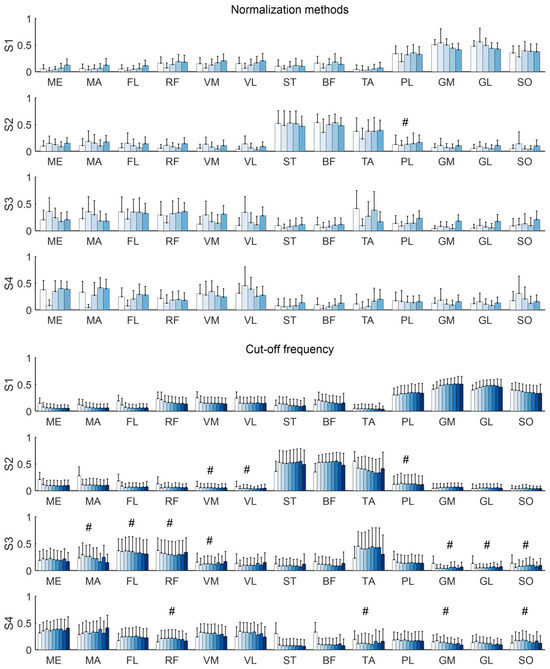
Figure 7.
Synergy weights across normalization methods and cut-off frequencies when four synergies were extracted. The bars show the group average and error bars indicate standard deviations across individuals. Color bars denote normalization methods (MAX, MED, AVE, UVA, UAM) in upper panel and cut-off frequencies (2–40 Hz) in lower panel. The significance of synergy weights across normalization methods and cut-off frequencies was tested for each muscle using a Kruskal–Wallis test. # indicates the Bonferroni-adjusted significance level p > 0.05.
Synergy similarity analysis showed that normalization methods had a larger influence on muscle synergies (Figure 8a). Specifically, the similarity between MED and MAX, as well as between MED and UVA, fell below the significance threshold (0.87) when the cut-off frequency exceeded 10 Hz. Within the cut-off frequency of 4–8 Hz, only the similarity between MED and UVA was below 0.87. At a low cut-off frequency of 2 Hz, the identified synergies exhibited high similarity across all normalization methods. This pattern was consistent when five synergies were extracted.
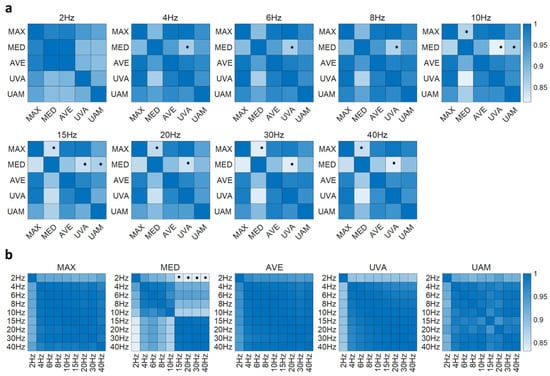
Figure 8.
Synergy similarity between normalization methods (a) and between cut-off frequencies (b) when four synergies were extracted. Asterisks indicate that the similarity is below the significance level (0.87).
When the extracted synergies were compared across cut-off frequencies for each normalization method, the results indicated that cut-off frequencies had a relatively low influence on synergy components, with similarity values consistently above the significance threshold of 0.87 (Figure 8b). However, an exception was observed when the MED normalization method was applied. Muscle synergies extracted at a low cut-off frequency of 2 Hz diverged significantly from those extracted at higher cut-off frequencies (15–40 Hz). This divergence became more pronounced when five synergies were extracted, as more similarity values fell below the 0.87 threshold.
4. Discussion
Muscle synergy, describing modular control strategies of the CNS, has clinical promise. However, the interactive effects of EMG preprocessing on synergy analysis remain underexplored [13,14]. Prior studies typically examined isolated elements (e.g., algorithm choice with fixed preprocessing [33]; limited filter settings or NMF initialization techniques without a broad normalization/criteria [17,41]; scoping reviews without experimental tests of parameter interactions [42]). In contrast, we systematically evaluated three preprocessing domains simultaneously, including nine cut-off frequencies, five normalization methods, and five synergy extraction criteria, covering 225 unique settings across 135 participants. By coupling this large-scale design with a synergy similarity and threshold sensitivity analysis, we reveal interaction effects and identify a robust default (EVAF + MAX/AVE/UVA with a moderately high cut-off approximately 10 Hz). These results provide a data-driven roadmap that improves cross-laboratory comparability, helps isolate disease-related changes in synergy structure from processing artifacts, and supports the translation of synergy analysis from laboratory research to clinical application.
4.1. Effects of Filtering, Normalization, and Criteria on Synergy Outcomes
Current studies often rely on VAF or R2 to quantify the variance explained by muscle synergies. In this analysis, VAF consistently yielded significantly higher values than R2, underscoring a notable distinction between these metrics. This discrepancy highlights that VAF, which accounts for both the shape and magnitude of the measured and reconstructed datasets, can provide a more robust representation of the fraction of total variation explained by synergy reconstruction [43]. This is particularly evident in certain contexts, such as when using MAX and AVE normalization with cut-off frequencies above 10 Hz. Such findings reinforce the importance of clearly reporting which variance metric is used, as it can influence the interpretation of synergy analysis results.
It has been established that cut-off frequencies affect the variance explained by a given number of synergies and therefore affect the identified number of synergies. Notably, extremely low cut-off frequencies, such as 2 Hz in this analysis, caused over-smoothing of EMG signals, artificially reducing signal variability and leading to fewer synergies [21]. This effect was observed across all normalization methods and for both VAF and R2. Meanwhile, normalization methods and cut-off frequencies exhibited an interactive influence on the explained variance. For example, significant differences in R2 across normalization methods only emerged at high cut-off frequencies above 8 Hz, and certain normalization choices (like UAM) maintained more robust R2 values at moderate cut-off frequencies (2–10 Hz). These results indicate that researchers must consider combinations of preprocessing parameters, as their interplay can impact synergy extraction outcomes.
Consistent with previous reports [18,19], we observed that higher cut-off frequencies generally led to lower VAF/R2 values and a larger number of synergies. However, our findings refine this understanding by showing that this trend depends on the criterion used to determine the number of synergies. When using criteria like GVAF or MVAF, the expected inverse relationship between cut-off frequency and number of synergies was evident, whereas with criteria like RVAF or EVAF, the trend was only clear at low cut-off frequencies. Notably, when employing the UAM normalization, the number of synergies was largely consistent across different cut-off frequencies. Among normalization methods, MAX, AVE, and UVA produced a similar number of synergies under criteria such as LVAF, EVAF, and RVAF. In contrast, MED and UAM had a more pronounced influence on the number of synergies. This trend was disrupted at an extremely low cut-off frequency of 2 Hz, where no significant differences in the number of synergies were observed among MED, AVE, and UVA, especially under the RVAF, EVAF, and MVAF. Furthermore, AVE and UVA had a consistent number of synergies when RVAF, EVAF, and LVAF were used as criteria. These nuances highlight that the impact of raising the cut-off frequency on the number of synergies can be mitigated by appropriate criteria and normalization choices, emphasizing the importance of evaluating parameters in concert.
In general, our results demonstrate that cut-off frequencies, normalization methods, and criteria have interactive and collective effects on muscle synergy analysis. Furthermore, correlation analyses revealed that when EVAF was used as the criterion, the cut-off frequency had minimal influence on the number of synergies, particularly under the MAX, AVE, and UVA normalization conditions (Figure 5 and Table 2). Under these settings, the composition of muscle synergies remained highly consistent. The similarity between extracted synergies was high regardless of whether four or five synergies were extracted. In contrast, using MED normalization led to substantially different synergy structures, as evidenced by significantly lower similarity (e.g., comparing MED vs. MAX or MED vs. UVA). This study visualized these effects with a synergy similarity heatmap (Figure 8), which we introduced as a quantitative measure of synergy stability across parameter combinations. This analysis highlights that EVAF combined with MAX, AVE, or UVA normalization produces notably stable synergy structures, whereas certain other settings (such as MED) introduce greater variability in the synergies.
4.2. Physiological Interpretation and Clinical Relevance
From a physiological standpoint, the observed changes in the number of synergies and their between-setting similarity reflect how preprocessing choices emphasize or attenuate task-phase co-activations. Extremely low cut-off values (e.g., 2 Hz) over-smooth the rectified EMG envelope, merge temporally adjacent bursts, and can artificially collapse distinct modules into fewer synergies. Conversely, moderately higher cut-offs (approximately 10 Hz) preserve brief, phase-specific bursts (e.g., push-off vs. early swing), allowing separate modules to be resolved when they are genuinely present. Normalization also shapes physiologic weighting. Methods such as MED compress amplitude and down-weight peak bursts, which can distort the relative contribution of phase-critical muscles and thus lower cross-setting similarity. By contrast, MAX/AVE/UVA better preserve the salience of meaningful bursts and yield highly consistent synergy structures across settings. Taken together, the EVAF + MAX/AVE/UVA + approximately 10 Hz configuration maintains the core co-activation backbone expected for running while avoiding artifacts from over-smoothing or amplitude compression. Clinically, this favors stable biomarkers of coordination. Differences in the number of synergies or similarity under unstable settings should be interpreted cautiously as they may arise from processing, not pathophysiology.
4.3. Clinical and Task-Aware Recommendations
Although a single parameter set cannot suit every application, our results support a clear default: use EVAF for synergy selection, pair it with MAX/AVE/UVA normalization, and apply a moderately high cut-off frequency (approximately 10 Hz). This combination yielded stable, consistent synergies across tested conditions, enhancing cross-study reproducibility and clinical confidence. Reliability is supported by high between-setting similarity under this configuration and convergence across multi-start NMF runs. Prior work also shows intra-subject > inter-subject similarity in comparable tasks, reinforcing the expectation of stable modules when preprocessing is standardized [22].
Starting from this baseline, task-aware adjustments are appropriate to match task dynamics and constraints, e.g., 6–8 Hz for slow/tonic postures to avoid over-smoothing; 8–10 Hz as a general setting; 10–12 Hz to preserve brief transients in interactive or spastic contexts. This “no one-size-fits-all” constraint is more pronounced in neurological populations, where tonic co-contraction, spasms/transients, timing variability, and limited MVC feasibility are common. Under these conditions, in-task MAX/AVE/UVA provide practical non-negative inputs for NMF. Because EVAF is scale-invariant, changes among these normalizations primarily affect relative channel weighting without destabilizing the selected number of synergies. Finally, threshold-based rules may inflate/deflate number of synergies in tonic patterns. EVAF showed lower threshold sensitivity in our comparisons and remains the recommended default. The choices are consistent with reports in cerebral palsy and post-stroke gait [16,20,21].
4.4. Robustness and Methodological Considerations
In neuromuscular disorders, MVC-based scaling is often impractical or unreliable, yet synergy extraction requires stable, non-negative inputs. We therefore recommend in-task MAX/AVE/UVA as clinically feasible defaults that avoid over-penalizing weak channels and remain compatible with NMF. When spasms/outliers occur, an optional 95th-percentile (per-channel) scaling can improve robustness while preserving non-negativity. EVAF-based synergy selection is scale-invariant, so switching among these non-negative, in-task normalizations mainly changes relative channel weighting without destabilizing the number of synergies. Moreover, prior analyses indicate that normalization choice has smaller effects on synergy outcomes than filter cut-off. For example, unit-variance/peak-based scaling typically induce only modest changes in explained variance with minimal impact on spatial patterns [21]. Likewise, MVC vs. SELF (maximum amplitude of the signal itself) shows no systematic differences in synergy weights [18], though normalization can shift explained variance and thus the number of synergies when fixed VAF thresholds are used. Consequently, if a simplified MVC/reference contraction is feasible, our main conclusions should hold (stable spatial structure). As a practical step, report a brief sensitivity check (SELF/percentile vs. simplified MVC) alongside the chosen criterion, and keep preprocessing consistent between calibration and analysis to preserve comparability across sessions in future work.
Consistent with prior work, we found that the cut-off frequency, rather than the filter order, was the primary determinant of synergy stability. Accordingly, we fixed a 4th-order Butterworth filter in our analyses [15,16]. At a matched cut-off, higher orders mainly sharpen the transition band and thus produce only minor differences in the rectified EMG envelope that feeds NMF. For latency-critical or highly transient applications (e.g., interactive control), we recommend a compact sensitivity check (2nd vs. 4th vs. 6th order) to confirm order-robustness.
Muscle synergy extraction can be approached with several dimensionality reduction methods. We focus on NMF because its non-negativity yields parts-based co-activation patterns that map naturally to muscle groups, and comparative studies report a favorable balance of interpretability and performance across locomotor and upper-limb tasks [33,34,35,36]. In contrast, PCA mixes positive/negative loadings, ICA relies on independence assumptions and is SNR/model-sensitive, and autoencoders add architectural/regularization choices and data demands that hinder comparability. Accordingly, we examine how preprocessing shapes NMF-based outputs under controlled conditions. We note NMF’s inherent constraints (initialization sensitivity and inter-subject variability) and mitigate them via multi-start runs, convergence checks, and standardized preprocessing/normalization with consistent reporting. Thus, an NMF-only design isolates preprocessing effects, while PCA (rapid exploration), ICA (when independence is defensible), and autoencoders (large data, task-specific nonlinearity) remain useful in specific contexts.
While threshold-based criteria remain the dominant practice in synergy studies and facilitate cross-study comparison, our study underscores the limitations of relying on strict threshold (Figure 6). For example, requiring a very high global VAF can mask subtle but meaningful synergies, whereas a more lenient threshold might overestimate the number of synergies. These challenges echo observations by others that arbitrary threshold choices can introduce bias [44]. As a pragmatic mitigation, EVAF showed lower sensitivity to threshold choice in our comparisons and is therefore recommended as a robust default. For transparency, we also encourage reporting the exact thresholds used. Promising alternatives are emerging in the form of information-theoretic approaches, such as using the Akaike Information Criterion (AIC) [45,46] or entropy [47] measures to automate EMG envelope smoothing and the selection of the number of synergies. These approaches could reduce reliance on manual parameter tuning, thereby standardizing the processing pipeline and further enhancing cross-study comparability. Notably, the relative robustness trends we report across preprocessing choices are expected to hold because these approaches optimize the same explained variance vs. dimensionality balance.
4.5. Real-Time Synergy Pipeline and Personalization Strategy
While the present study focuses on how preprocessing choices shape synergy outcomes under controlled analysis, practical deployments (such as robotics, prosthetics, interactive systems) often require real-time processing and personalization [48]. A pragmatic online recipe is to determine the number of synergies with EVAF during a brief calibration, fix the spatial basis , and update activations per frame via non-negative least squares (NNLS) under a cut-off frequency of approximately 10 Hz with a short frame step (e.g., 25–50 ms). This preserves the stability trends observed here while keeping latency modest. The online computation is dominated by a small NNLS with typical channel and synergy number. In practice, warm-starting , precomputing , and capping iterations keep the per-frame cost lightweight. For multi-user operation, we recommend fixing to retain comparability across users/sessions, maintaining identical preprocessing, and performing a brief per-user calibration to update (periodically offline as needed), while is adapted continuously online. These suggestions are offered as practical guidance. A full engineering evaluation of online controllers and hardware-dependent latencies is required in future work.
4.6. Limitations and Future Directions
Building on our results, future research should explore whether the interactive effects of EMG preprocessing parameters observed here hold true in other populations and tasks. For instance, studies on neuromuscular disorder patients (e.g., Parkinson’s disease or cerebral palsy) or on different movements (walking, reaching, upper-limb tasks) could examine how these parameters influence synergy outcomes in those contexts. Additionally, we did not benchmark automated selection criteria against threshold-based rules. A systematic comparison (e.g., AIC and entropy) under varied tasks and cohorts is an important direction for future work. Synergy extraction lacks a universally agreed external ground truth. Our conclusions therefore rest on internal consistency and comparative robustness of parameter choices. In future work, investigating muscle coordination at finer levels (muscle or motor unit) [49] and validating synergy-based metrics against physiological benchmarks will be important steps forward. By addressing these questions, the field can continue to refine the methodological framework for muscle synergy analysis, ultimately increasing its reliability and utility in both research and clinical domains.
5. Conclusions
This study comprehensively examined the influence of cut-off frequencies, normalization methods, and criteria on muscle synergy analysis. Additionally, it examined the differences in explained variance by VAF and R2, as well as the influence of the threshold on the identification of the number of synergies. The study demonstrated that these parameters interactively affect muscle synergy analysis and recommended using robust synergy extraction settings as a default approach for reliable outcomes, such as a moderately high cut-off frequency (e.g., 10 Hz), normalizing signals with simple in-experiment measures (MAX, AVE, or UVA), and determining synergy number with the EVAF criterion. By following these recommended practices, researchers can significantly reduce variability introduced by arbitrary parameter decisions, thereby strengthening the validity of synergy findings and facilitating their translation into meaningful clinical and biomechanical insights.
Author Contributions
Conceptualization, Formal analysis, Investigation, Methodology, Visualization and Roles/Writing—original draft, K.Z.; Funding acquisition, K.Z. and J.L.; Writing—review and editing, K.Z., Y.J., Y.F., J.L. and Y.Z.; Supervision, J.L. All authors have read and agreed to the published version of the manuscript.
Funding
This research was funded by the National Natural Science Foundation of China (62401274), the Natural Science Foundation of Jiangsu Province (BK20230302), the National Key Research and Development Program of China (2022YFC2405600), and the Key Research and Development Program of Jiangsu (BE2022160).
Institutional Review Board Statement
The experimental data used in this study came from a publicly available dataset at Zenodo (https://doi.org/10.5281/zenodo.1254380). Data collection for this dataset was conducted with the approval of the Ethics Committee of Humboldt University of Berlin. All participants gave written informed consent under the Declaration of Helsinki.
Informed Consent Statement
This study did not involve any new recruitment of human participants or collection of new data.
Data Availability Statement
The original data presented in the study are openly available in Zenodo at https://doi.org/10.5281/zenodo.1254380 (accessed on 16 September 2022).
Conflicts of Interest
The authors declare no conflicts of interest.
References
- Turpin, N.A.; Uriac, S.; Dalleau, G. How to Improve the Muscle Synergy Analysis Methodology? Eur. J. Appl. Physiol. 2021, 121, 1009–1025. [Google Scholar] [CrossRef]
- Ison, M.; Artemiadis, P. The Role of Muscle Synergies in Myoelectric Control: Trends and Challenges for Simultaneous Multifunction Control. J. Neural Eng. 2014, 11, 051001. [Google Scholar] [CrossRef]
- Hong, Y.N.G.; Ballekere, A.N.; Fregly, B.J.; Roh, J. Are Muscle Synergies Useful for Stroke Rehabilitation? Curr. Opin. Biomed. Eng. 2021, 19, 100315. [Google Scholar] [CrossRef]
- Xiong, D.; Zhang, D.; Zhao, X.; Chu, Y.; Zhao, Y. Synergy-Based Neural Interface for Human Gait Tracking with Deep Learning. IEEE Trans. Neural Syst. Rehabil. Eng. 2021, 29, 2271–2280. [Google Scholar] [CrossRef] [PubMed]
- Cheung, V.C.K.; Turolla, A.; Agostini, M.; Silvoni, S.; Bennis, C.; Kasi, P.; Paganoni, S.; Bonato, P.; Bizzi, E. Muscle Synergy Patterns as Physiological Markers of Motor Cortical Damage. Proc. Natl. Acad. Sci. USA 2012, 109, 14652–14656. [Google Scholar] [CrossRef] [PubMed]
- Roh, J.; Rymer, W.Z.; Beer, R.F. Evidence for Altered Upper Extremity Muscle Synergies in Chronic Stroke Survivors with Mild and Moderate Impairment. Front. Hum. Neurosci. 2015, 9, 6. [Google Scholar] [CrossRef]
- Pan, B.; Sun, Y.; Xie, B.; Huang, Z.; Wu, J.; Hou, J.; Liu, Y.; Huang, Z.; Zhang, Z. Alterations of Muscle Synergies during Voluntary Arm Reaching Movement in Subacute Stroke Survivors at Different Levels of Impairment. Front. Comput. Neurosci. 2018, 12, 69. [Google Scholar] [CrossRef]
- Baggen, R.J.; van Dieën, J.H.; Van Roie, E.; Verschueren, S.M.; Giarmatzis, G.; Delecluse, C.; Dominici, N. Age-Related Differences in Muscle Synergy Organization during Step Ascent at Different Heights and Directions. Appl. Sci. 2020, 10, 1987. [Google Scholar] [CrossRef]
- Pellegrino, L.; Coscia, M.; Pierella, C.; Giannoni, P.; Cherif, A.; Mugnosso, M.; Marinelli, L.; Casadio, M. Effects of Hemispheric Stroke Localization on the Reorganization of Arm Movements within Different Mechanical Environments. Life 2021, 11, 383. [Google Scholar] [CrossRef]
- Macchi, R.; Santuz, A.; Hays, A.; Vercruyssen, F.; Arampatzis, A.; Bar-Hen, A.; Nicol, C. Sex Influence on Muscle Synergies in a Ballistic Force-Velocity Test during the Delayed Recovery Phase after a Graded Endurance Run. Heliyon 2022, 8, e09573. [Google Scholar] [CrossRef]
- Coscia, M.; Cheung, V.C.; Tropea, P.; Koenig, A.; Monaco, V.; Bennis, C.; Micera, S.; Bonato, P. The Effect of Arm Weight Support on Upper Limb Muscle Synergies during Reaching Movements. J. Neuroeng. Rehabil. 2014, 11, 22. [Google Scholar] [CrossRef] [PubMed]
- Runnalls, K.D.; Anson, G.; Byblow, W.D. Partial Weight Support of the Arm Affects Corticomotor Selectivity of Biceps Brachii. J. Neuroeng. Rehabil. 2015, 12, 94. [Google Scholar] [CrossRef] [PubMed]
- Zhao, K.; Zhang, Z.; Wen, H.; Liu, B.; Li, J.; d’Avella, A.; Scano, A. Muscle Synergies for Evaluating Upper Limb in Clinical Applications: A Systematic Review. Heliyon 2023, 9, e16202. [Google Scholar] [CrossRef] [PubMed]
- Facciorusso, S.; Guanziroli, E.; Brambilla, C.; Spina, S.; Giraud, M.; Molinari Tosatti, L.; Santamato, A.; Molteni, F.; Scano, A. Muscle Synergies in Upper Limb Stroke Rehabilitation: A Scoping Review. Eur. J. Phys. Rehabil. Med. 2024, 60, 767–792. [Google Scholar] [CrossRef]
- Steele, K.M.; Tresch, M.C.; Perreault, E.J. Consequences of Biomechanically Constrained Tasks in the Design and Interpretation of Synergy Analyses. J. Neurophysiol. 2015, 113, 2102–2113. [Google Scholar] [CrossRef][Green Version]
- Banks, C.L.; Pai, M.M.; McGuirk, T.E.; Fregly, B.J.; Patten, C. Methodological Choices in Muscle Synergy Analysis Impact Differentiation of Physiological Characteristics Following Stroke. Front. Comput. Neurosci. 2017, 11, 78. [Google Scholar] [CrossRef]
- Santuz, A.; Ekizos, A.; Janshen, L.; Baltzopoulos, V.; Arampatzis, A. On the Methodological Implications of Extracting Muscle Synergies from Human Locomotion. Int. J. Neural Syst. 2017, 27, 1750007. [Google Scholar] [CrossRef]
- Kieliba, P.; Tropea, P.; Pirondini, E.; Coscia, M.; Micera, S.; Artoni, F. How Are Muscle Synergies Affected by Electromyography Pre-Processing. IEEE Trans. Neural Syst. Rehabil. Eng. 2018, 26, 882–893. [Google Scholar] [CrossRef]
- Hug, F.; Turpin, N.A.; Dorel, S.; Guével, A. Smoothing of Electromyographic Signals Can Influence the Number of Extracted Muscle Synergies. Clin. Neurophysiol. 2012, 123, 1895–1896. [Google Scholar] [CrossRef]
- van der Krogt, M.; Oudenhoven, L.; Buizer, A.; Dallmeijer, A. The Effect of EMG Processing Choices on Muscle Synergies before and after BoNT-A Treatment in Cerebral Palsy. Gait Posture 2016, 49, 31. [Google Scholar] [CrossRef]
- Shuman, B.R.; Schwartz, M.H.; Steele, K.M. Electromyography Data Processing Impacts Muscle Synergies during Gait for Unimpaired Children and Children with Cerebral Palsy. Front. Comput. Neurosci. 2017, 11, 50. [Google Scholar] [CrossRef]
- Zhao, K.; Zhang, Z.; Wen, H.; Scano, A. Intra-Subject and Inter-Subject Movement Variability Quantified with Muscle Synergies in Upper-Limb Reaching Movements. Biomimetics 2021, 6, 63. [Google Scholar] [CrossRef] [PubMed]
- Zhao, K.; Feng, Y.; Li, L.; Zhou, Y.; Zhang, Z.; Li, J. Muscle Synergies and Muscle Networks in Multiple Frequency Components in Post-Stroke Patients. Biomed. Signal Process. Control 2024, 95, 106417. [Google Scholar] [CrossRef]
- Zhao, K.; He, C.; Xiang, W.; Zhou, Y.; Zhang, Z.; Li, J.; Scano, A. Evidence of Synergy Coordination Patterns of Upper-Limb Motor Control in Stroke Patients with Mild and Moderate Impairment. Front. Physiol. 2023, 14, 1214995. [Google Scholar] [CrossRef] [PubMed]
- Santuz, A.; Ekizos, A.; Janshen, L.; Mersmann, F.; Bohm, S.; Baltzopoulos, V.; Arampatzis, A. Modular Control of Human Movement during Running: An Open Access Data Set. Front. Physiol. 2018, 9, 1509. [Google Scholar] [CrossRef] [PubMed]
- Chujo, Y.; Mori, K.; Kitawaki, T.; Wakida, M.; Noda, T.; Hase, K. How to Decide the Number of Gait Cycles in Different Low-Pass Filters to Extract Motor Modules by Non-Negative Matrix Factorization During Walking in Chronic Post-Stroke Patients. Front. Hum. Neurosci. 2022, 16, 803542. [Google Scholar] [CrossRef]
- Scano, A.; Dardari, L.; Molteni, F.; Giberti, H.; Tosatti, L.M.; D’Avella, A. A Comprehensive Spatial Mapping of Muscle Synergies in Highly Variable Upper-Limb Movements of Healthy Subjects. Front. Physiol. 2019, 10, 1231. [Google Scholar] [CrossRef]
- Santuz, A.; Ekizos, A.; Kunimasa, Y.; Kijima, K.; Ishikawa, M.; Arampatzis, A. Lower Complexity of Motor Primitives Ensures Robust Control of High-Speed Human Locomotion. Heliyon 2020, 6, e05377. [Google Scholar] [CrossRef]
- Chalard, A.; Belle, M.; Montané, E.; Marque, P.; Amarantini, D.; Gasq, D. Impact of the EMG Normalization Method on Muscle Activation and the Antagonist-Agonist Co-Contraction Index during Active Elbow Extension: Practical Implications for Post-Stroke Subjects. J. Electromyogr. Kinesiol. 2020, 51, 102403. [Google Scholar] [CrossRef]
- Avdan, G.; Onal, S.; Smith, B.K. Normalization of EMG Signals: Optimal MVC Positions for the Lower Limb Muscle Groups in Healthy Subjects. J. Med. Biol. Eng. 2023, 43, 195–202. [Google Scholar] [CrossRef]
- Clark, D.J.; Ting, L.H.; Zajac, F.E.; Neptune, R.R.; Kautz, S.A. Merging of Healthy Motor Modules Predicts Reduced Locomotor Performance and Muscle Coordination Complexity Post-Stroke. J. Neurophysiol. 2010, 103, 844–857. [Google Scholar] [CrossRef] [PubMed]
- Lee, D.D.; Seung, H.S. Algorithms for Non-Negative Matrix Factorization. Adv. Neural Inf. Process. Syst. 2001, 13, 556–562. [Google Scholar]
- Tresch, M.C.; Cheung, V.C.K.; d’Avella, A. Matrix Factorization Algorithms for the Identification of Muscle Synergies: Evaluation on Simulated and Experimental Data Sets. J. Neurophysiol. 2006, 95, 2199–2212. [Google Scholar] [CrossRef] [PubMed]
- Ebied, A.; Kinney-Lang, E.; Spyrou, L.; Escudero, J. Evaluation of Matrix Factorisation Approaches for Muscle Synergy Extraction. Med. Eng. Phys. 2018, 57, 51–60. [Google Scholar] [CrossRef]
- Rabbi, M.F.; Pizzolato, C.; Lloyd, D.G.; Carty, C.P.; Devaprakash, D.; Diamond, L.E. Non-Negative Matrix Factorisation Is the Most Appropriate Method for Extraction of Muscle Synergies in Walking and Running. Sci. Rep. 2020, 10, 8266. [Google Scholar] [CrossRef] [PubMed]
- Zhao, K.; Wen, H.; Zhang, Z.; Atzori, M.; Müller, H.; Xie, Z.; Scano, A. Evaluation of Methods for the Extraction of Spatial Muscle Synergies. Front. Neurosci. 2022, 16, 732156. [Google Scholar] [CrossRef]
- Park, J.-H.; Shin, J.-H.; Lee, H.; Roh, J.; Park, H.-S. Alterations in Intermuscular Coordination Underlying Isokinetic Exercise after a Stroke and Their Implications on Neurorehabilitation. J. Neuroeng. Rehabil. 2021, 18, 110. [Google Scholar] [CrossRef]
- Seo, G.; Kishta, A.; Mugler, E.; Slutzky, M.W.; Roh, J. Myoelectric Interface Training Enables Targeted Reduction in Abnormal Muscle Co-Activation. J. Neuroeng. Rehabil. 2022, 19, 67. [Google Scholar] [CrossRef]
- Ivanenko, Y.P.; Poppele, R.E.; Lacquaniti, F. Five Basic Muscle Activation Patterns Account for Muscle Activity during Human Locomotion: Basic Muscle Activation Patterns. J. Physiol. 2004, 556, 267–282. [Google Scholar] [CrossRef]
- Yokoyama, H.; Kaneko, N.; Ogawa, T.; Kawashima, N.; Watanabe, K.; Nakazawa, K. Cortical Correlates of Locomotor Muscle Synergy Activation in Humans: An Electroencephalographic Decoding Study. iScience 2019, 15, 623–639. [Google Scholar] [CrossRef]
- Soomro, M.H.; Conforto, S.; Giunta, G.; Ranaldi, S.; De Marchis, C. Comparison of Initialization Techniques for the Accurate Extraction of Muscle Synergies from Myoelectric Signals via Nonnegative Matrix Factorization. Appl. Bionics Biomech. 2018, 2018, 3629347. [Google Scholar] [CrossRef] [PubMed]
- Lanzani, V.; Brambilla, C.; Scano, A. A Methodological Scoping Review on EMG Processing and Synergy-Based Results in Muscle Synergy Studies in Parkinson’s Disease. Front. Bioeng. Biotechnol. 2025, 12, 1445447. [Google Scholar] [CrossRef]
- Roh, J.; Rymer, W.Z.; Beer, R.F. Robustness of Muscle Synergies Underlying Three-Dimensional Force Generation at the Hand in Healthy Humans. J. Neurophysiol. 2012, 107, 2123–2142. [Google Scholar] [CrossRef]
- Barradas, V.R.; Kutch, J.J.; Kawase, T.; Koike, Y.; Schweighofer, N. When 90% of the Variance Is Not Enough: Residual EMG from Muscle Synergy Extraction Influences Task Performance. J. Neurophysiol. 2020, 123, 2180–2190. [Google Scholar] [CrossRef] [PubMed]
- Ranaldi, S.; De Marchis, C.; Severini, G.; Conforto, S. An Objective, Information-Based Approach for Selecting the Number of Muscle Synergies to Be Extracted via Non-Negative Matrix Factorization. IEEE Trans. Neural Syst. Rehabil. Eng. 2021, 29, 2676–2683. [Google Scholar] [CrossRef] [PubMed]
- Ranaldi, S.; Gizzi, L.; Severini, G.; De Marchis, C. Optimal Identification of Muscle Synergies From Typical Sit-to-Stand Clinical Tests. IEEE Open J. Eng. Med. Biol. 2023, 4, 31–37. [Google Scholar] [CrossRef]
- Ranaldi, S.; De Marchis, C.; Conforto, S. An Automatic, Adaptive, Information-Based Algorithm for the Extraction of the sEMG Envelope. J. Electromyogr. Kinesiol. 2018, 42, 1–9. [Google Scholar] [CrossRef]
- Furui, A.; Eto, S.; Nakagaki, K.; Shimada, K.; Nakamura, G.; Masuda, A.; Chin, T.; Tsuji, T. A Myoelectric Prosthetic Hand with Muscle Synergy–Based Motion Determination and Impedance Model–Based Biomimetic Control. Sci. Robot. 2019, 4, eaaw6339. [Google Scholar] [CrossRef]
- Hug, F.; Avrillon, S.; Ibáñez, J.; Farina, D. Common Synaptic Input, Synergies and Size Principle: Control of Spinal Motor Neurons for Movement Generation. J. Physiol. 2023, 601, 11–20. [Google Scholar] [CrossRef]
Disclaimer/Publisher’s Note: The statements, opinions and data contained in all publications are solely those of the individual author(s) and contributor(s) and not of MDPI and/or the editor(s). MDPI and/or the editor(s) disclaim responsibility for any injury to people or property resulting from any ideas, methods, instructions or products referred to in the content. |
© 2025 by the authors. Licensee MDPI, Basel, Switzerland. This article is an open access article distributed under the terms and conditions of the Creative Commons Attribution (CC BY) license (https://creativecommons.org/licenses/by/4.0/).