Abstract
Accurate spatial sound localization is critical in flight simulators for enhancing situational awareness and pilot training effectiveness, particularly for diagnosing severe faults like engine surge which emit directional sound cues. However, existing spatial audio systems are primarily optimized for a single central listening position, failing to provide consistent localization accuracy for pilots seated in naturally off-center positions within the cockpit. To bridge this gap, this paper proposes a novel compensation method incorporating near-field loudspeakers. A comprehensive mathematical model for multiple off-center listening points is established based on acoustic velocity and energy vector theory. We further formulate a dual-phase optimization framework: a multi-objective model employing the NSGA-II algorithm to Pareto-optimize the trade-off between minimizing localization error and maximizing spatial stability, followed by a maximin model that guarantees robustness during head movements. A formal listening experiment demonstrates that the proposed optimized design significantly improves both localization accuracy and stability over conventional uniform layouts, thereby enhancing the fidelity and safety of flight simulation training.
1. Introduction
In flight simulators, accurate sound source localization is crucial for pilot training, as it provides essential auditory cues that enhance situational awareness, spatial orientation, and immersion within the cockpit environment. Such cues, including azimuth and distance information, aid pilots in detecting potential threats and mitigating the risk of spatial disorientation under visually degraded conditions. Our analysis from a Boeing 737 Full Flight Simulator (FFS) indicates that, among 78 typical engine fault simulations, at least 20 faults produce sound signatures with discernible spatial information, many of which correspond to critical failures such as engine surge. Misidentification of the direction of such auditory alerts could lead to delayed responses and simulated accidents, with potentially serious operational consequences.
In recent years, research on the use of spatial audio technology to enhance pilots’ situational awareness has steadily increased. Veltman [1] demonstrates that spatial audio cues enable rapid threat and target localization, providing direct, intuitive indications of danger locations without diverting visual attention from primary flight tasks. Further studies by Oving [2], Niermann [3], and Jones [4] corroborate that spatially localized auditory warnings offer intuitive location information, significantly reducing response times compared to conventional monaural or stereo alerts. These findings underscore the importance of high-fidelity spatial audio reproduction in aviation environments to mitigate cognitive load, improve reaction times, and ultimately enhance flight safety.
Despite these advancements, conventional flight simulator sound systems, predominantly reliant on directional loudspeakers [5,6], are limited in their ability to provide the high-fidelity spatial auditory cues essential for effective pilot training. These systems may fail to accurately reproduce psychoacoustic cues such as interaural time differences (ITDs) and interaural level differences (ILDs), leading to significant sound localization errors. In multi-crew aircraft, this limitation is exacerbated by listener displacement from the optimal listening position (’sweet spot’), resulting in multi-speaker cross-talk, degraded spatial fusion, and an unstable auditory image [7].
To address these challenges, advanced spatial audio technologies offer promising solutions. Recent approaches, including Wave Field Synthesis [8], Ambisonics [9], and binaural reproduction base on Head-Related Transfer Function (HRTF) [10], have significantly advanced spatial audio reproduction. Concurrent developments in head-tracking technology techniques have enabled personalized spatial audio experiences [11]. However, these methods face limitations in cockpit-scale environments, such as restricted listening zones, sensitivity to seat displacement, restriction on the number of speakers, and incompatibility with multi-user training. Although directional loudspeakers like for constraining sound propagation have gained popularity [12], their application in flight simulators requires further validation due to unconfirmed physiological effects of ultrasonic carriers on pilots. Consequently, psychoacoustics-based approximations, which leverage perceptual models to optimize sound rendering, emerge as arguably the most viable current approach for multi-position setups.
This paper proposes a novel mathematical modeling of multiple off-center listening positions in a flight simulator loudspeaker array system, utilizing psychoacoustic acoustic velocity and energy vector synthesis methods. It addresses two key problems: optimizing loudspeaker gains for fixed positions and determining optimal loudspeaker layouts. A dual-metric optimization framework is introduced, focusing on localization accuracy and stability. For a representative configuration of 12 far-field and 2 near-field loudspeakers, a multi-objective optimization is performed using the NSGA-II method, resulting in an enhanced loudspeaker arrangement.NSGA-II [13] is a fast elitist multi-objective genetic algorithm that ranks solutions by non-dominated layers and maintains diversity via crowding distance; it iteratively evolves the population toward the Pareto front in time. Finally, a listening experiment evaluates the localization performance and stability of the optimized layout compared to a uniform distribution across multiple off-center positions.
2. Materials and Methods
2.1. Problem Statement
2.1.1. Spatial Positioning Approximation Based on Psychoacoustics
The psychoacoustic approach to spatial positioning leverages the characteristics of human auditory perception by adjusting the delay and gain within a loudspeaker array to simplify the sound field, creating the illusion of sound spatial orientation. In 1957, Leakey [14] introduced a sine law that governs virtual source control using two speakers. The method employs gains and from two speakers, at an angular deviation , to synthesize a virtual source direction, denoted as , at low frequencies below 700 Hz.
To improve the stability of the virtual source during head turning, Bernfeld [15] proposed the tangent theorem, which is applicable to low frequencies, specifically below 700 Hz.
Gerzon derived an acoustic velocity vector (frequencies below 700 Hz) and energy vector (700 Hz–5 kHz) sound direction synthesis method [16], from the perspective of the velocity and energy components of the superimposed sound field. He also introduced the velocity coefficient and energy coefficient as metrics for evaluating the stability of head movements.
The velocity vector method assumes that the pressure gradient is in the direction of the virtual sound source. The relationship between sound pressure p and particle velocity in a free field can be described in the frequency domain as
where is the angular frequency, and is the medium density.
The synthesized particle velocity at observation point is given by
After all, for loudspeaker i in the loudspeaker array,
For a loudspeaker i in a loudspeaker array, with position vector and gain , the normalized velocity vector is defined as
When employing an array of N speakers, the composite velocity vector for sound localization is given by
The velocity coefficient can be used to assess the stability of the synthesized sound source from the loudspeaker array. A velocity coefficient closer to 1 indicates greater stability of the sound localization against head turning. Specifically, when , the sound localization is stable against rotation, which typically corresponds to the case of a single loudspeaker.
For audio signals with a frequency range of 700 Hz to 5 kHz, Gerzon proposed using vector-based energy localization.
where
- I is the acoustic intensity.
- is the peak acoustic pressure.
- is the particle velocity amplitude.
- is the ambient density of the medium.
- c is the speed of sound in the medium.
- is the directional vector.
For the loudspeaker array
Similarly, for the synthesis direction of the loudspeaker array
Stability coefficient for the head turning of the energy vector
2.1.2. The Challenge of Sound Spatial Localization in Flight Simulation
Flight simulators commonly employ loudspeaker arrays to reproduce spatial sound localization. However, due to the limited number of speakers available for spatial audio reproduction, psychoacoustic methods are adopted to achieve this. Since both the pilot and co-pilot are off-center positioned, compensation is required to ensure accurate spatial sound reproduction. This section addresses the issue by incorporating near-field speakers to enhance localization accuracy.
The directional synthesis of sound in multi-loudspeaker arrays can be analyzed through velocity and energy vectors. Velocity vectors are effective for low frequencies below 700 Hz, while energy vectors are more suited for higher frequencies up to 5 kHz. We don’t consider localization for frequencies beyond this range, as psychophysical research suggests that low-frequency components play a primary role in influencing sound localization, even in signals containing both low and high frequencies [17].
To achieve optimal spatial localization at both listening positions, it is crucial to determine the ideal loudspeaker gains and layout. Two primary evaluation criteria for spatial positioning are defined:
- The accuracy of directional localization, quantified by the error between the virtual source direction and the target direction;
- Stability during head-turning, assessed by the stability coefficients—velocity and energy coefficients—where values closer to 1 indicate higher stability.
Here, it is assumed that several loudspeakers are distributed in the outer ring and inner ring for formula derivation. The loudspeaker layout used for modeling is as illustrated in Figure 1, m loudspeakers are distributed along a circle with a radius of 4 m, centered at the origin in a right-handed coordinate system. The positions of the two key pilots, denoted as a and b, are fixed at coordinates (0, −1) and (0, 1), respectively. Additionally, n near-field loudspeakers are positioned within a circle of radius 1 surrounding each pilot. For example, in configurations where each pilot employs three near-field loudspeakers, the loudspeakers are classified based on their positions: those located in front and to the sides. The coordinates for the left pilot are (−1, 1), (−2, 0), and (0, 0), while for the right pilot they are (1, 1), (0, 0), and (2, 0).
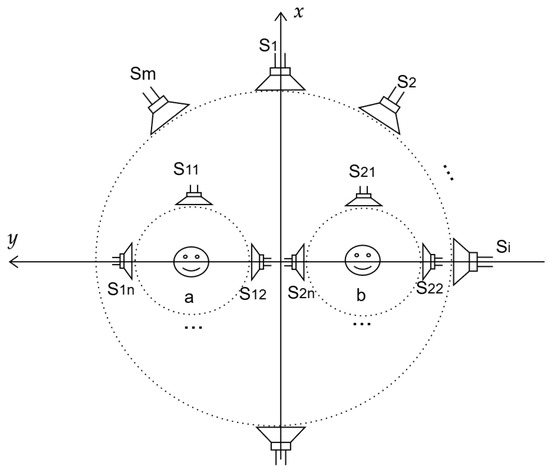
Figure 1.
Loudspeaker distribution for optimized model, a and b denote two off-center listening positions; – are the outer-ring loudspeakers, and –, – are the near-field loudspeakers.
At point a, considering the quadratic decay of sound pressure with respect to the distance from the reference position, the synthesized virtual source can be expressed as
where:
- represents the unit vector pointing from listening position a to the i-th loudspeaker.
- represents the unit vector pointing from listening position a to the i-th near-field loudspeaker.
- denotes the weighting coefficient of the i-th near-field loudspeaker for listening position a.
- denotes the weighting coefficient of the i-th loudspeaker. ⊙ denotes element-wise multiplication.
Based on the previous definitions, the relationship can be reformulated as
where and are matrices representing the orientation of the loudspeakers relative to listening position a, and are the weighting coefficients vector for the loudspeakers.
Likewise, at listening position b, the direction vector of the virtual source, , can be defined as
Thus, there are two optimization problems:
- Given a specified loudspeaker layout , and for a virtual target source position , determine the optimal loudspeaker weight vector for two listening points. The objective is to minimize direction error and maximize head-turning stability coefficients for both positions.
- Given a constraint on the number of loudspeakers M, determine the optimal layout of the loudspeakers to maximize sound source localization accuracy for two listening points within the target zone . The objective is to position the loudspeakers such that localization performance is optimized across the entire zone.
2.2. Problem 1: Determine the Best Loudspeaker Gain for Two Off-Center Listening Positions
For a single listener, virtual sound sources originating from arbitrary directions can be projected onto the circumference defined by the loudspeaker array. In such cases, any virtual directional source can effectively be reduced to a two-loudspeaker configuration, where the localization performance depends primarily on the angular separation between the two loudspeakers. The accuracy of this virtual source reproduction is influenced by the relative positions of the loudspeakers.
When multiple listeners are present, virtual sources that deviate from the circular arrangement of loudspeakers introduce additional complexity and cannot be reduced to a two-loudspeaker problem. Unless the virtual source lies on the circumference defined by the loudspeakers, it is generally impossible to achieve simultaneous optimization of both the stability coefficient and directional angular error for all listeners. Therefore, optimization must consider the trade-off between minimizing angular error and maintaining stable reproduction, represented by the stability coefficient.
The summary angular error between the target angle and the synthetic sound source angle at positions a and b is
where
are vectors from target source to listen position a, b.
On the other hand, for the loudspeaker weight vector , the positioning stability coefficient can be expressed as
This leads to the optimization problem 1:
This problem is evidently a multi-objective optimization challenge. By utilizing the NSGA-II algorithm, the Pareto frontier is effectively obtained. The key steps and mechanisms of the algorithm are detailed as in Algorithm 1:
| Algorithm 1 Best solution of by NSGA-II Algorithm |
| Require: loudspeaker angles vector , listen position |
| Ensure: Set of Pareto Front , |
|
2.3. Problem 2: Determining the Best Loudspeaker Layout for Improved Listening Experience
In a uniform loudspeaker layout, angular errors and stability coefficients exhibit non-uniform distribution across different target angles . This section focuses on optimizing head-turning stability across all directions by utilizing a fixed number of speakers, with an emphasis on enhancing stability in the worst-case scenarios. Additionally, Table 1 shows that the aircraft noise we aim to simulate originates from a limited range of angles, suggesting that the optimization can be concentrated within this specific scope.

Table 1.
Aircraft Noise Sources in Different Degrees.
To minimize computational efforts and simplify the analysis, we will restrict our focus to the angular range from 0 to 180 degrees, and mirror the results symmetrically to the opposite side. For the loudspeaker layout , the target virtual source angle is distributed on a circle with radius d. The optimization objective is to maximize the minimum stability coefficient across all angles , where represents the set of angles of interest. For loudspeaker i,
The optimization problem 2 can be described mathematically as
The function represents the optimal stability coefficient for a given target angle when the distribution of the loudspeakers is known. As described by optimization problem 1, two optimization objectives, the stability coefficient and the angular error , are addressed. However, solving this iteratively using the Algorithm 1 is computationally inefficient due to the multiple iterations of NSGA-II algorithm.
To streamline the computation, we simplify the problem by focusing on scenarios where the target point lies on a circular path with a radius of 4 m, while ignoring near-field loudspeakers. Additionally, in this simplified model, any given angle can correspond to at most two loudspeakers. Achieving zero angular error () yields a unique solution, and the corresponding stability coefficient at this optimal configuration is then used in subsequent optimization tasks. Therefore, can be simplified as sub-optimize problem 3:
The optimization problem 2 can be addressed using the fmincon function in Matlab, as detailed shown in Algorithm 2:
| Algorithm 2 Best loudspeaker layout |
| Require: loudspeaker number M, radius d, target area set |
| Ensure: loudspeaker best distribution vector |
|
2.4. Experimental Design
The experimental setup for the sound array was performed in a realistic operational environment, with the equipment positioned in a spacious room measuring approximately 6 × 6 × 3 m, reverberation time is approximately 0.54 s. The loudspeaker array was meticulously arranged in the right-hand sector (co-pilot side) of the Flight Training Device, as shown in Figure 2.
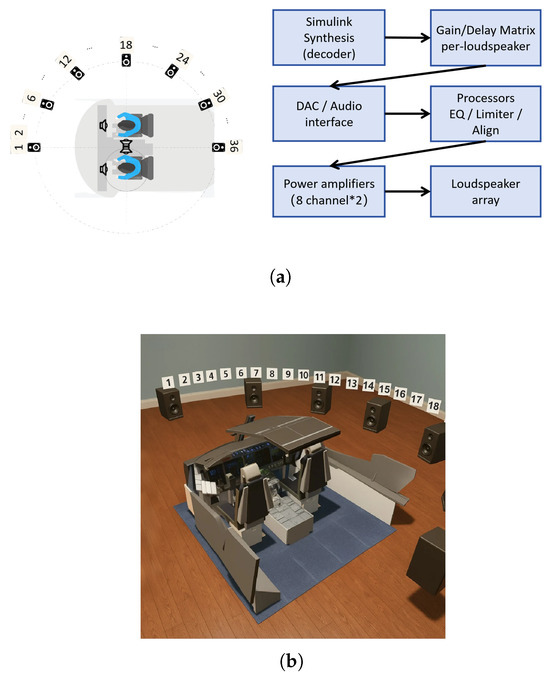
Figure 2.
Experimental Setup (a) The schematic diagram of the experimental design. (b) Schematic diagram of the experimental setup.
2.4.1. Experimental Setup
The experimental system comprised a computer, 16-channel sound card, digital audio processor, power amplifier, and loudspeakers. A Simulink model implemented the synthesis algorithm, while the digital audio processor converted digital signals from the audio interface into analog signals. These signals were amplified and routed to corresponding loudspeaker channels. Frequency response calibration was achieved through channel-specific filter adjustments in the digital audio processor. Table 2 provides the specific hardware and software details.
Table 2.
Hardware and Software Setup.
Loudspeakers were deployed on the right side of the simulated cabin along a 4-m radius circular arc. Three distinct configurations were tested across experimental iterations:
- Uniform angular distribution (base line), using the velocity vector model;
- Omnidirectional optimization, using Algorithm 1;
- Aircraft sound position-optimized configuration, using Algorithm 1.
As illustrated in Figure 2. Digital markers were placed at 5-degree intervals to facilitate subjects’ spatial orientation of virtual sound sources.
2.4.2. Participant Protocol
8 flight simulation practitioners (2 females, aged 25–35 years) with normal hearing were recruited. Each participant contributed two datasets per configuration, yielding 16 valid datasets per configuration (48 total). The experimental procedure comprised
- A male voice counting from 1 to 7 served as the auditory stimulus, delivered through 5-s interval loop playback.
- Participants were instructed to maintain forward-facing head orientation while permitted minor positional adjustments to optimize localization accuracy.
- Prior to testing, individual loudspeakers were sequentially activated without participant awareness of marker-speaker correspondence. Data were discarded if participants failed to correctly identify all baseline speaker positions.
- Synthesized auditory stimuli were presented at 5-degree target angles. Participants recorded perceived source locations using the marker system. Each participant completed testing at both near position (b) and far position (a) listening positions, with two datasets collected per position.
3. Results
3.1. Optimized Result for the Problem 1: The Best Loudspeaker Gain for Two Off-Center Listening Positions
This model employs an analysis based on uniformly distributed speakers from 0 to 180 degrees. To minimize computational effort and simplify the analysis, only the results on the right side of the target are considered. Near-field loudspeakers are placed at the front and on the inner side relative to the listening position, as illustrated in Figure 1.
Solutions were obtained for a target source positioned at 0 degrees with respect to the x-axis, at distances of 3.5 m, 4 m, and 4.5 m from the origin. The results presented is shown in Figure 3, the minimum values for and the occur at 4.5 m, followed by those at 4 m. The parameter settings for Algorithm 1 are as shown in Table 3. Figure 4 presents the algorithm iteration details when the distance is 4.5. To verify the robustness of the algorithm, comparing of the multi-objective optimization results of NSGA-II with those of other algorithms using the statistical values from 10 calculations, as shown in Figure 5. The NSGA-II algorithm demonstrates consistent and superior performance on both the HV and Spacing metrics compared to the SPEA2 and IBEA. In contrast, the MOEA/D algorithm yields notably inferior results for these two indicators.
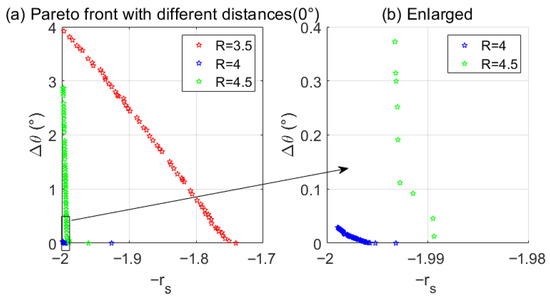
Figure 3.
Pareto front with different distances, the left side (a) shows comparisons at 3.5 m, 4 m, and 4.5 m; the right side (b) is the enlarged detail view.
Table 3.
The parameter settings for Algorithm 1.
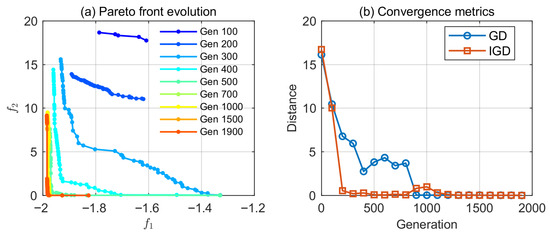
Figure 4.
Pareto front iterate, on the left (a) is the evolution of the Pareto front across generations; on the right (b) are the GD and IGD metrics vs. generations.
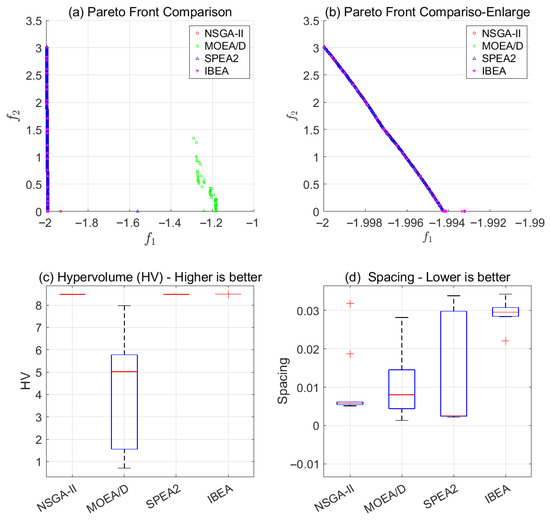
Figure 5.
Comparison with other multi-objective models, (a) shows the comparison of the Pareto fronts; (b) is the enlarged detail. (c,d) present the HV and spacing comparisons after 10 runs.
Figure 6 presents the median values of and for the target source, calculated at 5-degree intervals at a distance of 4 m from the origin. The results indicate that accuracy is relatively high at specific loudspeaker positions (0° 180°), while significantly lower at intermediate angles. Additionally, the result shows that positioning accuracy fluctuates depending on the target direction , decreased as the value approaches 90°.
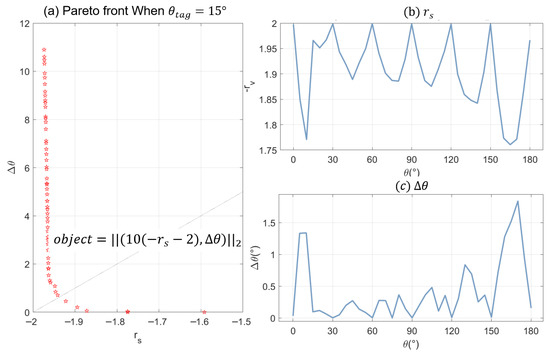
Figure 6.
, vs. target angle under the specific object, (a) shows the Pareto front at = 15, with the dashed line indicating the object. (b) displays vs. , and (c) shows vs .
3.2. Optimized Result for the Problem 2: The Best Loudspeaker Layout for Improved Listening Experience
In a horizontal plane, we obtain a set of solutions for the distribution of 12 outer ring speakers and 4 near-field speakers.
The results show a significant improvement in the minimum stability coefficient , as shown in Figure 7a, which increased from 0.9144 to 0.9528 after optimizing for omnidirectional performance. This improvement was further enhanced by incorporating the directional requirements of aircraft noise distribution, resulting in a final stability coefficient of 0.9627. Figure 7b illustrates the change in the stability coefficient after optimization.
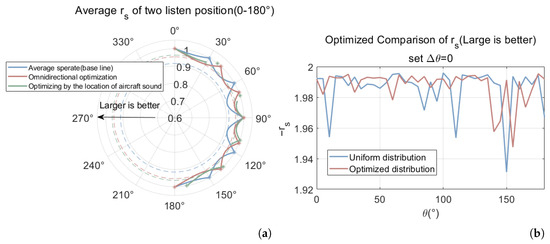
Figure 7.
Comparison of the optimized (a) Comparison of the optimized average with the circumference of the target Angle (* denotes the speaker position), the dashed circles denote the minimum values under different configurations. (b) , vs. after optimization of the loudspeaker layout.
3.3. Experiment Result
A total of 16 sets of experimental data were collected, and average localization angles and their corresponding standard deviations were calculated. Figure 8 demonstrates the comparative listening test results between optimized and baseline configurations. The localization accuracy is tested by calculating the angular deviation between the target sound source’s direction and the perceived direction. The stability is assessed by the standard deviation across multiple measurements. The results are shown as
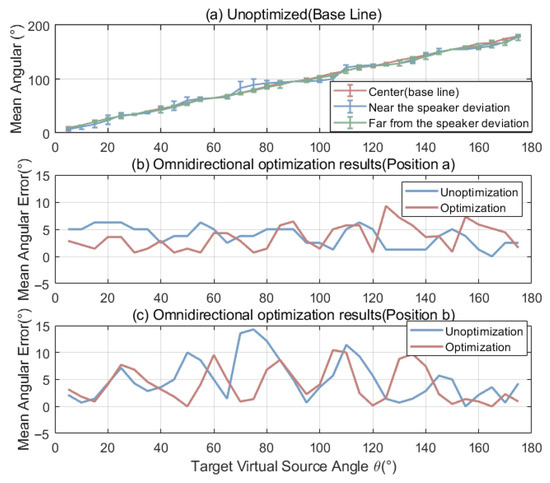
Figure 8.
Speaker Distribution Optimized, (a) Listening test results at three positions for the uniform layout, used as the baseline; (b) mean angular error comparison at the far position (a); (c) mean angular error comparison at the near position (b).
- Far-position (Point a): Maximum increased from to , indicating reduced positional accuracy.
- Near-position (Point b): Maximum decreased from to , showing enhanced reproduction fidelity.
- Peak error variation at point b decreased significantly:
The results of implementing directional restrictions on aircraft noise are presented in Figure 9. The average values of the and standard deviation are summarized in Table 4, indicating a slight improvement in localization stability (standard deviation), consistent with the simulation results.
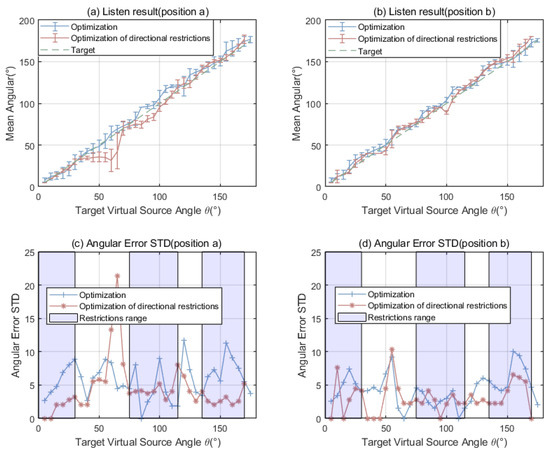
Figure 9.
Optimization of directional restrictions, (a) shows the mean angular at the far position a, (b) shows the mean angular at the near position b; (c,d) compare the standard deviations of the angular errors at positions a and b, respectively.
Table 4.
Performance Comparison in Optimized Regions.
4. Discussion
The results demonstrate that optimizing both directional accuracy () and head-turning stability () simultaneously is impossible for off-center listening positions in aircraft, as shown in the Pareto frontier (Figure 3). When the virtual sound source is positioned outside the loudspeaker, the and are lower, indicating superior localization performance for distant sound sources. The NSGA-II algorithm effectively identified optimal loudspeaker configurations, achieving high convergence and reliability compared to other methods (Figure 5). Optimization quality metrics, such as hypervolume and spacing, confirm the robustness of the NSGA-II approach, making it a reliable tool for multi-objective optimization in sound localization.
After optimization, the loudspeaker layout demonstrated a significant enhancement in localization performance. As illustrated in Table 4, both the average values and the standard deviation observed of the in the experiment showed a marked reduction. Furthermore, the error distribution became more uniform across all listening positions, as depicted in Figure 7. Notably, when directional constraints were applied to aircraft noise, localization accuracy was further refined, showcasing the effectiveness of the implemented restrictions.
It should be noted that the current model is analyzed under the ideal condition of evenly distributed loudspeakers. In practical applications, since the model incorporates the coordinates of each loudspeaker, it can theoretically accommodate variations in loudspeaker arrangement. However, if the pilot’s seat is too close to a loudspeaker, the masking effect may lead to failure in synthesizing the intended sound direction. In such cases, the loudspeaker layout would evidently deviate significantly from the optimal configuration. Theoretically, this risk can be foreseen through analysis of the stability index .
5. Conclusions
5.1. Summary of Contributions
This study addressed the fundamental challenge of sound source localization for multiple off-center listening positions in flight simulators. By integrating near-field loudspeakers with a psychoacoustics-inspired methodology based on velocity and energy vectors, we developed a comprehensive framework for optimizing both loudspeaker gains and physical layout. The main contributions and findings are summarized as follows.
First, we formulated a multi-objective optimization problem to simultaneously minimize localization angular error () and maximize head-turning stability () for two off-center listening positions. The NSGA-II algorithm successfully generated Pareto-optimal solutions, revealing an inherent trade-off between these competing objectives as listeners deviate from the central sweet spot. This finding highlights a fundamental design constraint in multi-listener spatial audio systems.
Second, we implemented a loudspeaker layout optimization strategy focused on maximizing the minimum stability coefficient within the operational area. By constraining the optimization to the circular array region, we transformed the problem into a tractable single-objective formulation. The resulting layout demonstrated significantly improved stability in worst-case directions, with additional refinements achievable by targeting specific acoustic zones such as aircraft noise sources.
The proposed methodology offers a practical compromise between computationally intensive wavefield synthesis and Higher-Order Ambisonics approaches, proving particularly valuable for cockpit environments where multi-user compatibility is essential.
5.2. Limitations and Future Work
This study has several limitations that warrant attention. First, the current model operates in two-dimensional space; extension to full three-dimensional analysis would enhance practical applicability. Second, the constraint of optimizing only within the loudspeaker circumference may limit performance; future algorithmic improvements could enable more comprehensive search spaces. Last, there is a lack of analysis regarding disturbances such as background noise and variations in loudspeaker placement.
Future research will focus on experimental validation using realistic scenarios with azimuth-dependent acoustic signatures, such as aircraft collisions and engine faults, to quantify the impact of improved localization on pilot performance. Additionally, we will explore the simulation of dynamic sound fields from moving objects. The proposed loudspeaker-based approach also shows significant promise for virtual reality (VR) spatial audio rendering, especially in multi-user training environments where individualized Head-Related Transfer Function (HRTF) calibration presents practical challenges. Furthermore, future research should consider optimizing parameter sensitivity analysis to enhance the algorithm’s universality and effectiveness. The use of a weighted cost function that balances localization accuracy and stability depending on task importance is also a highly promising approach.
Author Contributions
Conceptualization, Y.Y.; methodology, Y.Y.; software, Y.Y.; validation, Y.J. and Y.Y.; writing—original draft preparation, Y.Y.; writing—review and editing, X.L., Y.J. and Y.Y.; visualization, Y.Y.; supervision, S.D. All authors have read and agreed to the published version of the manuscript.
Funding
This research received no external funding.
Institutional Review Board Statement
The study involved only normally hearing adult volunteers who provided verbal consent after being informed of their right to withdraw at any time. The acoustic stimuli were within everyday listening levels and were identical to those widely used in previous spatial–audio research. No personal identifiers or sensitive data were collected beyond gender and age. Because the procedures posed no more than minimal risk and did not involve vulnerable populations, formal review by an external ethics board was not required under our institutional guidelines.
Informed Consent Statement
Informed consent for participation was obtained from all subjects involved in the study.
Data Availability Statement
The data underlying this study cannot be made publicly available due to the Amap licensing agreements. However, the data will be made available upon reasonable request to the corresponding author, contingent on compliance with applicable regulations.
Acknowledgments
In the development of this manuscript, we employed artificial intelligence-assisted technologies to refine the language and enhance the readability of our text. However, the authors have retained full oversight and control over the content, ensuring the accuracy and integrity of the research presented. We acknowledge that the ultimate responsibility for the work’s content lies with the human authors.
Conflicts of Interest
Co-author Yu Jia is from HUA-OU Aviation Training Company Limited, and there are no conflicts of interest among the other authors.
References
- Veltman, J.A.; Oving, A.B.; Bronkhorst, A.W. 3-D Audio in the Fighter Cockpit Improves Task Performance. Int. J. Aviat. Psychol. 2004, 14, 239–256. [Google Scholar] [CrossRef]
- Oving, A.B.; Veltman, J.A.; Bronkhorst, A.W. Effectiveness of 3-D Audio for Warnings in the Cockpit. Int. J. Aviat. Psychol. 2004, 14, 257–276. [Google Scholar] [CrossRef]
- Niermann, C.A. Can spatial audio support pilots? 3D-audio for future pilot-assistance systems. In Proceedings of the 2015 IEEE/AIAA 34th Digital Avionics Systems Conference (DASC), Prague, Czech Republic, 13–17 September 2015; pp. 3C5-1–3C5-7. [Google Scholar]
- Jones, H.G.; Milam, L.; Williams, H.; Simpson, B.; Akins, E.R. Spatial Audio Cueing Aids Pilot Navigation during Simulated Helicopter Flight in Degraded Visual Environments. In Proceedings of the Human Factors and Ergonomics Society Annual Meeting, Seattle, WA, USA, 28 October–1 November 2019. [Google Scholar]
- Ploner-Bernard, H.; Sontacchi, A.; Lichtenegger, G.; Vössner, S.; Braunstingl, R. Sound-system design for a professional full-flight simulator. In Proceedings of the Proceeding International Confercence Digital Audio Effects (DAFx-05), Madrid, Spain, 20–22 September 2005; pp. 36–41. [Google Scholar]
- Sheng, X.W.; Han, J.W.; Hao, M.H. Sound Analysis and Synthesis for Audio Simulation System of Flight Simulator. Adv. Mater. Res. 2013, 748, 708–712. [Google Scholar] [CrossRef]
- Marentakis, G.; Peters, N.; Mcadams, S. Auditory resolution in virtual environments: Effects of spatialization algorithm, off-center listener positioning and speaker configuration. J. Acoust. Soc. Am. 2008, 123, 3798. [Google Scholar] [CrossRef]
- Spors, S.; Rabenstein, R.; Ahrens, J. The theory of wave field synthesis revisited. Connect. Tissue Res. 2008, 124, 7358. [Google Scholar]
- Zotter, F.; Frank, M. Ambisonics: A Practical 3D Audio Theory for Recording, Studio Production, Sound Reinforcement, and Virtual Reality; Springer Nature: Berlin/Heidelberg, Germany, 2019. [Google Scholar]
- Rafaely, B.; Tourbabin, V.; Habets, E.; Ben-Hur, Z.; Lee, H.; Gamper, H.; Arbel, L.; Birnie, L.; Abhayapala, T.; Samarasinghe, P. Spatial audio signal processing for binaural reproduction of recorded acoustic scenes—Review and challenges. Acta Acust. 2022, 6, 47. [Google Scholar] [CrossRef]
- Richard, A.; Markovic, D.; Gebru, I.D.; Krenn, S.; Butler, G.A.; Torre, F.D.L.; Sheikh, Y. Neural Synthesis of Binaural Speech From Mono Audio. In Proceedings of the International Conference on Learning Representations, Addis Ababa, Ethiopia, 30 April 2020. [Google Scholar]
- Gan, W.S.; Yang, J.; Kamakura, T. A review of parametric acoustic array in air. Appl. Acoust. 2012, 73, 1211–1219. [Google Scholar] [CrossRef]
- Deb, K.; Pratap, A.; Agarwal, S.; Meyarivan, T. A fast and elitist multiobjective genetic algorithm: NSGA-II. IEEE Trans. Evol. Comput. 2002, 6, 182–197. [Google Scholar] [CrossRef]
- Leakey, D.M. Some Measurements on the Effects of Interchannel Intensity and Time Differences in Two Channel Sound Systems. J. Acoust. Soc. Am. 1959, 31, 977–986. [Google Scholar] [CrossRef]
- Bernfeld, B. Attempts for Better Understanding of the Directional Stereophonic Listening Mechanism. In Proceedings of the 44th AES Convention, Rotterdam, The Netherlands, 20–22 March 1973; p. C-4. [Google Scholar]
- Gerzon, M.A. General metatheory of auditory localisation. In Proceedings of the Audio Engineering Society Convention 92; Audio Engineering Society: New York, NY, USA, 1992. [Google Scholar]
- Wightman, F.L.; Kistler, D.J. The dominant role of low-frequency interaural time differences in sound localization. J. Acoust. Soc. Am. 1992, 91, 1648–1661. [Google Scholar] [CrossRef] [PubMed]
Disclaimer/Publisher’s Note: The statements, opinions and data contained in all publications are solely those of the individual author(s) and contributor(s) and not of MDPI and/or the editor(s). MDPI and/or the editor(s) disclaim responsibility for any injury to people or property resulting from any ideas, methods, instructions or products referred to in the content. |
© 2025 by the authors. Licensee MDPI, Basel, Switzerland. This article is an open access article distributed under the terms and conditions of the Creative Commons Attribution (CC BY) license (https://creativecommons.org/licenses/by/4.0/).