Abstract
This study investigated how test room acoustic conditions relate to listening comprehension performance in a high-stakes English as a foreign language (EFL) assessment context. Using score data (n = 2532) from five TOEFL ITP test sessions conducted between 2021 and 2025 at a private university in Chiba, Japan, we compared performance across three lecture halls with documented differences in reverberation time (RT) and Speech Transmission Index (STI). Each listening score was linked to an approximated seat-based STI value, while grammar/reading scores were used to account for baseline proficiency. Linear mixed-effects modeling analyses indicated that examinees in the least favorable acoustic environment (RT0.5–2kHz 1.51 s, STI 0.60) obtained lower listening scores than those in rooms with shorter RT (0.93 s, 0.79 s) and higher STI (0.69, 0.67), respectively. Subgroup analyses revealed a significant effect at the CEFR-J B1.1 level, though the room and B1.1 effects showed modest estimated marginal mean differences (EMMDiff) roughly corresponding to 2–3 points on the total scale. Seat-based STI analyses also showed significant EMMDiff, with approximately 3–7 total score point differences observed between categories F (0.52–0.55) and ≥D (≥0.60). While the dataset was limited to one institution and the sample distribution limited generalizability of the findings, the study offers empirical findings that can inform future research and discussions on equitable listening assessment practices.
1. Introduction
High-stakes tests play an important role in modern society as tools for the fair and objective assessment of individuals’ skills and knowledge in specific domains. Among these, standardized English as a foreign language (EFL) proficiency tests are widely used in both academic and professional contexts around the world [1,2,3,4]. In Japan, internationally recognized assessments such as the TOEIC®, TOEFL®, and IELTS are routinely administered alongside large-scale domestic tests like EIKEN, GTEC, and CASEC to millions of examinees each year [5,6,7]. These tests serve diverse purposes, including university admissions, course placement, graduation requirements, job applications, and corporate promotions [5,6,7,8,9,10,11].
Given their high stakes and widespread usage, these assessments are carefully designed and administered under rigorous quality control. Test developers such as the Educational Testing Service (ETS) conduct rigorous research to ensure test reliability and validity [12,13,14], and detailed examiner manuals are distributed to minimize procedural variability across sites [15]. However, fairness in testing depends not only on internal design but also on the consistency of external conditions. This requires standardized procedures and comparable testing conditions so that scores have the same meaning for all examinees, and variations in administration conditions (e.g., time of day, distractions) and in the testing environment or equipment can introduce construct-irrelevant variance [16]. From a psychometric perspective, test validity requires measurement invariance across administrations: if scores vary due to irrelevant factors, construct validity is undermined [17,18].
One critical but often overlooked source of construct-irrelevant variance in EFL listening tests is the acoustic environment. In group-administered paper-based formats, examinees rely on loudspeakers for accurate delivery of the recorded audio stimuli, but acoustic elements such as reverberation, background noise, and signal-to-noise ratio particularly in large lecture halls often used for test administration can significantly alter speech intelligibility [19,20]. Such variability raises concerns about equity in high-stakes listening assessments, especially for non-native listeners who are particularly sensitive to degraded listening conditions. Despite the widespread use of university lecture halls for the administration of standardized EFL listening tests, few studies have systematically examined whether differences in room acoustics translate into measurable score disparities in real-world high-stakes contexts.
1.1. Background
The negative effect of adverse acoustic conditions on speech perception is well established in the literature. Numerous studies have demonstrated that (1) listening in noisy environments is more challenging than in quiet settings [21,22], (2) younger learners are more easily affected by noise than adults [23,24], and (3) adverse acoustic conditions impair comprehension in a second language (L2) more strongly than in one’s native language (L1) regardless of the listener’s age [25,26]. Such issues are exacerbated by findings that acoustic parameters typically prescribed in national standards for educational spaces—such as background noise level (BNL), signal-to-noise ratio (SNR), reverberation time (RT), and the Speech Transmission Index (STI)—are rarely enforced in practice and often fall below recommended levels [20,27,28,29,30,31].
The compounding acoustic effects on speech intelligibility are particularly challenging for L2 listeners. Research has shown that L2 learners often require higher SNRs and more favorable acoustic conditions to reach comprehension levels similar to those of L1 listeners [32]. Even highly proficient L2 users have been shown to require more favorable SNRs (typically +4 to +8 dB) than native speakers to achieve comparable comprehension levels [33]. Proficiency level also modulates vulnerability, with less experienced learners consistently found to be disproportionately disadvantaged in poor acoustic conditions [34]. This is notably exemplified in IEC 60268-16:2020 [19] which indicates that advanced, intermediate, and beginner non-native listeners require corrected STI values of 0.68, 0.86, and >1 (impossible), respectively, to achieve a “fair–good” speech intelligibility level equivalent to 0.60 STI for their L1 listener counterparts.
As the literature shed light on these acoustical challenges for L2 listeners, studies have sought to propose practical recommendations for non-native listeners in real-world contexts. Peng and Wang (2016) [35] examined the effects of varying RT and BNL conditions on native and non-native adult listeners. For situations involving non-native English listeners and native English speakers, the scenario most relevant to the present study, they recommended BNL 48 dBA with RT0.5–2kHz 0.6 s. Minelli et al. (2022) [36] reviewed 38 studies on classroom acoustics and found that key parameters affecting learning included BNL, SNR, RT, and STI. Learners aged 12 and older generally achieved excellent intelligibility in conditions with STI ≥ 0.60, SNR ≥ +12 dB, RT125–4kHz ≤ 0.7 s, and BNL ≤ 40 dBA. The authors emphasized that younger students and those with linguistic disadvantages often required even more favorable conditions. Likewise, Mealings (2023) [37] reviewed studies involving both native and non-native university students and recommended noise levels below 50 dBA, SNRs above +10 dB, and reverberation times under 0.6 s. Noise levels and SNRs are slightly less stringent than those for younger learners, but RT under 0.6 s is on par with those for K-12 classrooms.
Despite the extensive body of research on how adverse acoustic conditions hinder non-native listening, studies focusing specifically on university classrooms and lecture halls—and their effects on university-aged listeners—are a relatively recent development. Escobar and Morillas (2015) [38] examined 17 university classrooms and lecture halls ranging from 190 to 2000 m3 (M = 788.5 m3) and found that 13 rooms exceeded RT0.5–2kHz 1.0 s, five exceeding 2.0 s. Most of these rooms had STI values between 0.49 and 0.62 (M = 0.55), but acoustic conditions did not correlate consistently with room volume. For instance, two rooms of similar size (1350 m3 and 1300 m3) produced very different results (RT0.5–2kHz 1.41 s, 0.62 STI; RT0.5–2kHz 0.64 s, 0.76 STI, respectively). Similarly, Choi (2016) [39] found that in 12 university classrooms ranging from 193 to 2535 m3 (M = 699.3 m3), five of the seven smallest rooms (199–354 m3) exceeded RT0.5–1kHz 1.0 s. Again, room volume did not associate with reverberation, as one of the lowest RTs (0.56 s) came from the second largest room (1310 m3).
In the Japanese context, guidelines published by the Architectural Institute of Japan in AIJES-S001-2020 [27] stipulate the acoustic properties of educational spaces, but they primarily target K–12 classrooms. Specifically, it prescribes BNL recommendations for schools in three categories: LAeq ≤ 35 dB (spaces where quiet conditions are necessary: i.e., music rooms, nurse’s office), LAeq ≤ 40 dB (spaces where quiet conditions are preferable: i.e., classrooms, faculty offices), and LAeq ≤ 45 dB (spaces where quiet conditions are not as critical: i.e., gymnasiums, indoor pools). For RT, most of these spaces are grouped by typical sizes of 200 m3 or 300 m3 for which RT0.5–1kHz 0.6 s and 0.7 s are stipulated. Beyond spaces of 300 m3, however, only 5000 m3 (i.e., gymnasiums, lecture/ceremony halls) with RT0.5–1kHz 1.6 s is listed, and recommended RT is generally expected to increase in conjunction with room size. As such, spaces equivalent to typical university lecture halls would constitute an estimated recommendation around RT0.5–1kHz 1.0 s, a figure generally associated with increased speech intelligibility difficulties.
Although [27] provides general guidelines for school classrooms, those extending to university facilities have attracted limited attention, and studies that investigate acoustic conditions of Japanese university classrooms and their effect on speech intelligibility are virtually non-existent in the literature. This is a critical issue for standardized EFL assessments in Japan, as university classrooms and lecture halls are routinely utilized as venues for the administration of these tests. A quick survey of the official TOEIC Website reveals that the vast majority of test sites in Japan are universities [40]. As observations of acoustic variability across university classrooms have already been reported [36,37,38,39], it would not be surprising to find similar cases in Japanese contexts.
Together, these studies point to an important yet under-addressed dimension of EFL listening assessment: the vulnerability of university-aged, non-native test takers to potentially detrimental acoustic environments in university facilities. Given that standardized listening tests routinely rely on group-based delivery in university lecture halls—often preferred over smaller classrooms for logistical reasons—the influence of room acoustics on high-stakes test performance warrants careful investigation, since inconsistencies in listening conditions may contribute to variation in test outcomes with academic or professional consequences.
1.2. The Present Study
The present study extends the authors’ previous works [41,42,43] which identified (1) substantial acoustic inconsistencies in test rooms used for standardized EFL listening tests and (2) significant differences in listening scores between acoustically favorable and unfavorable rooms. In [41], preliminary investigation of eight classrooms and lecture halls used as test rooms for the TOEIC L&R SP/IP at the authors’ affiliated institution revealed that one room—Room 2—exhibited both the highest RT (RT0.5–2kHz 0.87 s) and the lowest STI (0.59 STI) compared to the other test rooms (RT0.5–2kHz 0.65–0.77 s, 0.63–0.74 STI). Concurrently, analysis of over 20,000 TOEIC L&R IP scores obtained from these rooms showed significantly lower listening scores in Room 2—the acoustically unfavorable room—even though the corresponding Reading scores were comparable across all rooms.
Subsequent studies provided further insights. In [42], two additional test rooms were found to have even more disadvantageous acoustic profiles (RT0.5–2kHz 1.25, 1.17 s; 0.56, 0.58 STI). Moreover, controlled experiments conducted in two rooms representing favorable (RT0.5–2kHz 0.67 s, 0.72 STI) and unfavorable (RT0.5–2kHz 1.25 s, 0.56 STI) acoustic environments revealed statistically significant differences in listening scores, with stronger effects observed among lower proficiency subjects [43]. However, these investigations were limited in scope. All data came from one institution, and score analysis was based on room-level mean acoustic measurements with no data on individual seat positions or proficiency levels. These gaps were partially addressed in [43] by using the subjects’ TOEIC L&R IP scores to categorize proficiency by CEFR-J levels—the Japanese variant of the Common European Framework of Reference for Languages—and assigning them to one of six seat positions in the front and rear rows, but the study relied on practice materials and a small sample size (n = 42), restricting its generalizability.
The present study addresses these limitations by replicating the experiment at a second institution under real-world, high-stakes conditions. It introduces four key improvements: (1) New acoustic measurements were conducted in three lecture halls regularly used for the TOEFL ITP. (2) The score data, along with examinee demographics, were obtained from actual TOEFL ITP tests administered across multiple sessions. (3) Each score was linked to its corresponding STI value based on the examinee’s seat position. (4) Scores were categorized by CEFR [44] and CEFR-J [45] levels to enable thorough analysis and to promote comparability with previous studies as well as future investigations. Refer to [43] for an explanation of CEFR and CEFR-J and the rationale for their adoption in the present study. We believe these methodological considerations allow for a more comprehensive investigation of how test room acoustics may influence EFL listening test performance.
2. Material and Methods
2.1. Score Data
For the present study, TOEFL ITP score data were obtained from a private university located in Chiba, Japan. The dataset comprised five test sessions administered between 2021 and 2025, each conducted as a semester-end diagnostic tool to evaluate students’ English proficiency. Tests were held in the university’s lecture halls, where seats were assigned according to student identification (ID) numbers. The study was conducted under the approval of the Institutional Review Board at the author’s affiliated institution, which deemed the use of retrospectively aggregated student data exempt from individual informed consent requirements. This exemption was granted on the basis that the data were anonymized prior to researcher access and consistent with the university’s regulations regarding the use of academic records for institutional research purposes. At enrollment, all students had signed a consent form outlining the handling of personally identifiable information. For the present analysis, access to ID information was authorized in order to match test scores to seat locations; immediately after this matching process, the ID numbers were converted to case numbers to preserve student anonymity throughout the subsequent data analysis.
2.1.1. CEFR and CEFR-J Categorizations
The TOEFL ITP score data were categorized into CEFR and CEFR-J levels. The TOEFL ITP test consists of the Listening Comprehension, Structure and Written Expression, and Reading Comprehension sections, henceforth referred to as Listening, Grammar, and Reading, respectively. Since no external reference data were available to serve as a baseline for the examinees’ proficiency, Grammar and Reading (GR) scores were used to determine the CEFR/-J categorizations. This approach is supported by research showing strong intercorrelations among language abilities. For example, large-scale TOEFL iBT validation studies demonstrated that Reading and Listening are highly correlated constructs across multiple observations [46], and Reading has likewise been shown to significantly predict Listening performance on the TOEFL ITP, accounting for nearly half of its variance [47]. TOEIC data similarly indicated that Reading and Listening correlate strongly (r = 0.70–0.76), which together serve as a robust measure for overall English ability [48]. Although neither the TOEFL ITP Grammar section nor an isolated construct of grammar knowledge was considered in these studies, it was treated here as an additional receptive measure that is unaffected by the acoustic environment and thus combined with the Reading section. The sum of the Grammar and Reading sections was then used to arrange the score data by CEFR levels, thereby establishing the individual baseline proficiency level. Subsequently, each CEFR level was split in half into high and low tiers for the CEFR-J categorizations, such that CEFR A2 (65–83) was divided into CEFR-J A2.1 (65–73) and CEFR-J A2.2 (74–83). The classifications were performed according to the cut scores published by ETS [49], presented in Table 1.

Table 1.
TOEFL ITP cut scores by section mapped to the CEFR.
2.1.2. Dataset Profile
The role of the TOEFL ITP test within the institution from which the dataset was obtained is uniquely reflected in its characteristics. The TOEFL ITP serves a dual purpose at this institution: a diagnostic assessment and a prerequisite for certain courses. Notably, course enrollment in the third and fourth years requires scores of 480 and 500, respectively, which essentially makes them critical prerequisites for graduation. This encourages the students to strive to reach these score criteria in their first two years of study, and once the score of 500 is achieved, many cease to register for subsequent tests. Conversely, those who struggle to meet these targets continue to take the test into their junior and senior years. Thus, the dataset predominantly contains scores 500 or lower. In fact, of the 2538 total cases, only 338 (13.3%) were above the score of 500, most of which ranged between 500 to 530 (n = 258) and the rest 533 to 627 (n = 80).
2.2. Test Procedures
The test sessions were conducted according to the university’s TOEFL ITP test manual. The manual was adapted from an official TOEFL ITP supervisor’s manual distributed to each administering institution from ETS. This is common practice for tests like the TOEFL ITP (Institutional Testing Program) and the TOEIC L&R IP (Institutional Program) which are designed to be administered by individual institutions and organizations without direct oversight of ETS, utilized to meet their specific needs such as for diagnostics, placement, or workplace promotion. A copy of the university’s test manual was obtained for this study.
2.2.1. Test Rooms
The TOEFL ITP tests were administered in three lecture halls located in the aforementioned institution. The three lecture halls are routinely utilized as venues for various standardized EFL proficiency tests, including the TOEFL ITP, TOEIC L&R IP, and the university entrance exam. The TOEFL ITP alone is conducted semi-monthly year-round, with pre-enrollment, post-spring/fall semesters, and mid-semester sessions open to any student who wish to register. This implies that tens of thousands of students have taken high-stakes tests in these lecture halls over the university’s history.
Overview and images of the test rooms are presented in Table 2 and Figure 1, respectively. In keeping with the numbering scheme from previous studies [41,42,43], room numbers 11 to 13 have been assigned to the three rooms in this study.
Table 2.
Summary of the test rooms. Reproduced with permission from [50].
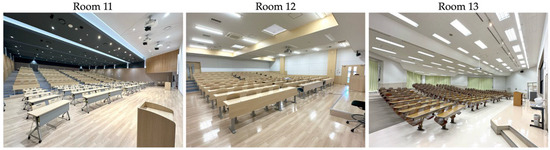
Figure 1.
Photographs of the three test rooms. Reproduced with permission from [50].
2.2.2. Sound Sources
The listening section of the TOEFL ITP was administered via playback of the audio CD through the loudspeakers—referred to as wall-mounted speakers in [42]—installed in each test room. Specifications of the power amplifiers and loudspeakers (Table 3) as well as the placement of the loudspeaker installation (Figure 2) were distinctly unique to each room. These variables could not be specified and controlled for the purposes of the present study since score data from past test sessions were retroactively obtained. However, the use of audio equipment available in the room is common practice for institutional administrations of standardized tests. All devices were operated according to standard test protocols, which merely involves performing playback checks prior to test day and setting the sound pressure level (SPL) at the test proctor’s discretion.
Table 3.
Power amplifier and loudspeaker specifications of the wall-mounted speakers by test room. Adapted from [43].
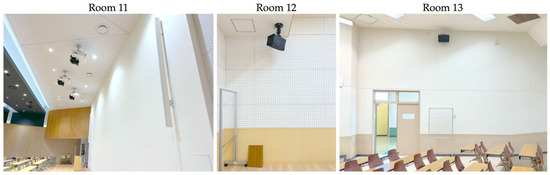
Figure 2.
Photographs of the wall-mounted speakers used for playback of the listening section audio CD.
2.2.3. Seating Scheme
As noted in Section 2.1, an ID-based seating scheme was utilized to assign the seat location to each examinee. The scheme ensured that the seat immediately adjacent to each examinee remained unoccupied. Depending on the area of the room, one of two spacing patterns was used. In some areas—namely the middle sections in Room 11—a checkerboard pattern was implemented, where examinees were seated in alternating rows and columns. In other areas, a vertical pattern was applied, in which all seats in a given column were occupied, the adjacent column left empty, and so on. On occasions when one or more test takers happened to be absent, their seats were left unoccupied and no seating changes were made as a result of the absence. This ID-based seating system minimized systematic bias and helped distribute proficiency levels across and within rooms, although it cannot fully rule out other scenarios that may have led to undocumented changes and introduced misalignment with the recorded data.
In addition to the assigned IDs, the seats had corresponding labels consisting of a combination of row numbers and alphabetized columns, shown in Figure 3. This made it possible not only to identify the exact seat location for each set of L and GR scores within the test room, but also to match the measured STI values to individual examinees. Details of this process are described in Section 2.3.3.
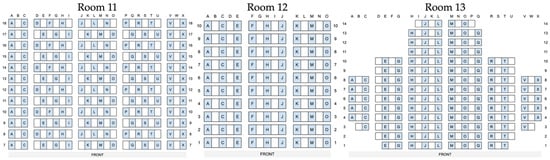
Figure 3.
Seating scheme for the three test rooms. The assigned seats are indicated in blue and the unoccupied spaces in white.
2.3. Acoustic Conditions
The acoustic conditions of the three test rooms, particularly in terms of RT and the STI, were examined and reported in [50]. A summary of the results relevant to the present study will be presented here. All measurements were performed in unoccupied conditions in accordance with ISO 3382–2:2008 [51] and IEC 60268-16:2020 [19]. Readers may refer to [42,50] for details on the measurement procedures.
2.3.1. Background Noise Level
A survey of the BNL in each test room was initially performed with heating, ventilation, and air conditioning (HVAC) noise measurements (Table 4). Room 12 was equipped with a standard HVAC system with three AC (weak, strong, and powerful) and three ventilation (OFF, weak, and strong) settings. Meanwhile, Room 11 and 13 were equipped with an integrated system wherein a single ON/OFF switch controlled the AC and ventilation. Since HVAC settings in actual test scenarios are subject to the discretion of the examiner, information regarding the HVAC setting during the listening section in each test room and across the five sessions was not obtained. As it is unlikely for the tests to be conducted with all HVAC systems turned off, they were set to weak in Room 12 and ON in Room 11 and 13 as the most plausible representation of the actual test conditions. The RT and STI results reported in Section 2.3.2 and Section 2.3.3 were measured under these conditions.
Table 4.
BNL measurement results (dBA) by test room. The selected AC and ventilation settings during the measurement sessions—weak (W), strong (S), and powerful (P)—are indicated in brackets. Reproduced with permission from [50].
2.3.2. Reverberation Time
Table 5 and Figure 4 summarize the RT results from the three lecture halls. Table 5 lists the T20 decay intervals, mean octave band frequency values, and aggregated mid-frequency means (RT0.5–1kHz and RT0.5–2kHz). Standard deviations are reported in parentheses alongside the corresponding means.
Table 5.
Measurement results (s) by test room. Measured decay range (T20), octave band frequencies (125 Hz to 8 kHz), mid-band frequencies (RT0.5–1kHz and RT0.5–2kHz), and standard deviations denoted in parenthesis are presented. Reproduced with permission from [50].
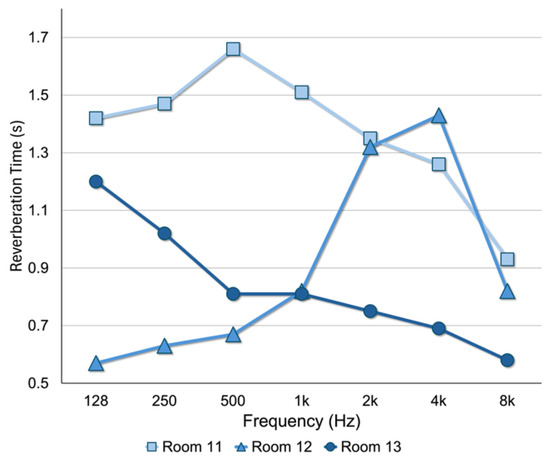
Figure 4.
Line graph of the RT measurement results (s) by test room. Reproduced with permission from [50].
As visually represented in Figure 4, the three test rooms exhibited distinctly different RT profiles both in terms of intensity (s) and distribution across the octave band frequency (Hz). Room 11, perhaps due to its large volume (2033 m3), recorded the longest RT0.5–2kHz at 1.51 s which substantially exceeds recommended limits for speech intelligibility [27]. Room 12 yielded a rather favorable RT0.5–1kHz of 0.74 s; however, a notable spike at 2 kHz (1.32 s) to 4 kHz (1.43 s) was observed, suggesting that certain localized reflections may be contributing to longer RT in these higher frequencies. Room 13 showed the most favorable and consistent profile, with an average RT0.5–2kHz of 0.79 s and minimal variation across frequency bands. The presence of large drape curtains on the rear walls likely contributed to minimizing the RT in the mid- to high-frequencies.
2.3.3. Speech Transmission Index
The STI measurements were conducted with the speech transmission index for public address systems (STIPA) method [19]. Figure 5 shows the layout of each test room indicating the source (loudspeakers) and receiver positions; the STIPA measurement results are presented in Figure 6 and Table 6.
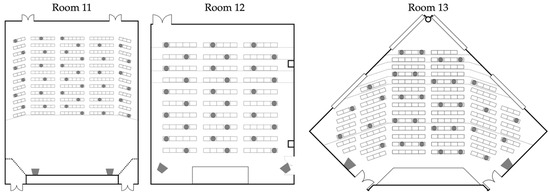
Figure 5.
STIPA source and receiver positions by test room. Source positions are illustrated by the two trapezoid icons at the front of the room, and the round dots represent the receiver positions. Adapted from [50].
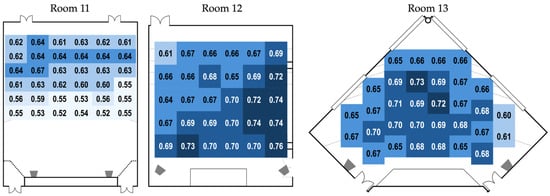
Figure 6.
STIPA measurement results arranged by receiver position. The STI qualification categories are represented by dark to light shades denoting A to F (A ≥ 0.72 STI, B ≥ 0.68 STI, C ≥ 0.64 STI, D ≥ 0.60 STI, E ≥ 0.56 STI, F ≥ 0.52 STI). Adapted from [50].
Table 6.
STIPA measurement results by test room. Sample size (n) denotes the total number of measurement positions.
Varying STI profiles were observed across the three test rooms. Room 11 exhibited the lowest STI values overall, with only one receiver position exceeding the 0.66 STI threshold recommended in [42]. Again, the large room volume (2033 m3) likely contributed to this outcome. In contrast, Room 12 showed a more favorable profile with the majority of measurements exceeding 0.66 STI, though an odd drop in STI was observed in the rear-left section. Room 13, despite its irregular pentagonal shape, demonstrated generally stable and acceptable STI values. The only area with notably lower STI (0.60–0.61) was the far–right section, likely influenced by the presence of a large ventilation grill installed on a nearby wall.
In addition to the measured STI values described above, approximate STI values were distributed to the unmeasured seats based on their proximity and alignment to the nearest measured positions. Using the receiver positions indicated in Figure 5 as reference points, seats located adjacent to or directly behind a measured position were typically assigned a similar STI value, with gradual extension of values across rows and columns reflecting the acoustic gradient observed in the room. This process allowed for each test taker to be assigned an individualized STI value and enabled a detailed analysis of the relationship between room acoustics and listening performance.
3. Results
3.1. Survey of the Score Data
A summary of the score data is presented in Table 7. The distribution (sample size and percentage), mean, and standard deviations (SD) of TOEFL ITP scores across CEFR and CEFR-J levels are presented in Table 8, Table 9 and Table 10.
Table 7.
Summary of TOEFL ITP scores by section and test room.
Table 8.
Sample sizes and distributions (%) of test scores across CEFR and CEFR-J levels by test room.
Table 9.
Mean and standard deviation (SD) of TOEFL ITP Listening scores by CEFR and CEFR-J levels across test rooms.
Table 10.
Mean and standard deviation (SD) of the combined TOEFL ITP Grammar and Reading (GR) scores by CEFR and CEFR-J levels across test rooms.
A survey of the TOEFL ITP score data revealed that the CEFR A1 (n = 4) and C1 (n = 2) levels together accounted for only 0.3% of the total dataset. Given that these sample sizes are too small to yield reliable statistical conclusions, both groups were excluded from further analysis in this study. Similarly, while the CEFR B2 level (n = 66, 2.6%) was included in the analysis, it was found to consist predominantly of CEFR-J B2.1 learners (n = 60, 2.4%), with only six cases (0.2%) classified as CEFR-J B2.2. Accordingly, the CEFR-J B2.2 level was included in the analysis only when the entire CEFR B2 range was under consideration. The resulting sample size after these exclusions was n = 2532.
In addition to the TOEFL ITP score data, demographic information was also obtained. Of the 2532 test takers, females (n = 1795) considerably outnumbered males (n = 737). The mean age was 19.87 (SD = 1.22), and all four years (freshmen to seniors) were represented though the first and second years together made up 79.9% (n = 2024) of the sample population. Notably, 2.4% (n = 61) were of foreign nationality. This group most likely comprised either international students enrolled in the study abroad program at this university or students of mixed heritage with one or both non-Japanese parents. In keeping with the present study’s focus on real-world testing scenarios, all available demographic data were retained in the dataset. Details of the demographic data are presented in Table 11.
Table 11.
Sample sizes and distributions (%) of test scores across demographic groups by test room.
3.2. Score Differences by Test Room
3.2.1. Exploratory Analysis of Room Differences
For exploratory analyses, boxplots and a scatterplot were generated to examine potential patterns in the data. Figure 7a,b show boxplots comparing the raw L scores and the baseline GR scores across the three test rooms, respectively. From left to right, each boxplot corresponds to L and GR scores for Room 11, 12, and 13, respectively. Visual inspection suggests that Room 11 tended to yield lower L scores than Room 12 and 13, despite showing comparably high GR scores across the three rooms.
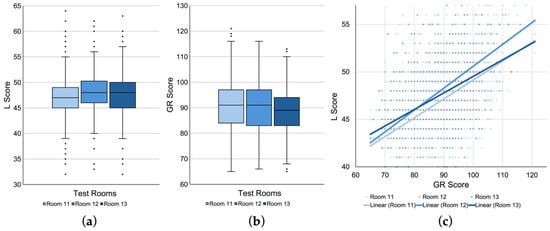
Figure 7.
Score distributions and regression patterns across test rooms. Boxplots of raw (a) Listening (L) and (b) Grammar/Reading (GR) scores for Room 11 to 13. (c) Scatterplot of L scores plotted against GR scores with linear regression lines for each room.
Similarly, Figure 7b shows a scatterplot of L scores plotted against GR scores, with linear regression lines generated separately for each test room. This visualization replicates a similar format reported in [43], where a large deviation of regression lines was observed between favorable and unfavorable test rooms, especially among lower proficiency participants. In the present data, the regression lines for the three rooms appear to be less pronounced with relatively similar slopes overall. However, it can be observed that the regression line for Room 11 lies consistently below those of Room 12 and 13. Moreover, the relationship between Room 11 and 13 seems to mirror a similar pattern observed in [43], with greater separation in the lower proficiency range and convergence at the higher end of the GR distribution.
3.2.2. Statistical Analysis of Room Differences
To examine whether test room conditions had a significant effect on L scores, a linear mixed-effects model (LMM) was fitted in IBM SPSS (Version 27). The model included L scores as the dependent variable, test room, GR scores, year, gender, and nationality as fixed effects, and test date as a random intercept. Visual inspection of residual histogram and Q–Q plots indicated reasonable normality, and plots of standardized residuals versus fitted values confirmed homoscedasticity. Variance inflation factors (VIF < 2.0) suggested no problematic multicollinearity between predictors.
Table 12 shows the analysis results. The LMM revealed a statistically significant main effect of GR scores, F(1, 2522.42) = 658.31, p < 0.001, confirming that baseline proficiency was a strong predictor of listening performance. The fixed effect of test room was statistically significant, F(2, 2516.76) = 10.43, p < 0.001, indicating differences in L scores across test rooms after controlling for baseline proficiency. Estimated marginal means showed that Room 11 yielded the lowest adjusted L score (M = 48.14, SE = 0.47), while Rooms 12 and 13 were higher (M = 48.89, SE = 0.50; M = 48.72, SE = 0.48, respectively). Bonferroni-adjusted pairwise comparisons revealed that Room 11 differed significantly from both Room 12 (p < 0.001) and Room 13 (p < 0.001), whereas no significant difference was observed between Rooms 12 and 13. When the Room × GR interaction term was added, the fixed effect of test room was no longer significant (F(2, 2517.82) = 1.93, p = 0.145). The interaction itself was non-significant (p = 0.217), indicating that the slope of GR was statistically similar across rooms. Pairwise comparisons still indicated significant differences between Room 11 and the other two rooms (p < 0.001) at the mean GR value.
Table 12.
Linear mixed-effects model results for TOEFL ITP listening scores across the three test rooms. Sample size (n), estimated marginal means (Estimated Mean), standard error (Std. Error), and significance values (p) for pairwise comparisons are presented. *** p < 0.001.
Other fixed effects, year (F(3, 2520.54) = 10.08, p < 0.001), gender (F(1, 2519.17) = 11.09, p < 0.001), and nationality (F(1, 2519.25) = 20.35, p < 0.001), were also significant. Year showed that students in later academic years scored higher even with diminishing sample sizes, while the larger sample size for females may have played a role in showing significantly higher L scores than males. Perhaps unsurprisingly, foreign test takers (n = 61) significantly outperformed their Japanese counterparts. Finally, the random intercept for test date was not significant, suggesting that session-to-session variability explained little variance compared with fixed effects. Importantly, test room differences remained statistically significant even after accounting for these demographic factors and session variability.
3.3. Score Differences by STI
3.3.1. Exploratory Analysis of STI Variation
Since the data obtained for this study allowed each set of L and GR scores to be matched to a specific seat with a corresponding STI value, additional analyses were performed to examine the relationship between test performance and seat-level variation in speech intelligibility within each test room.
Figure 8 presents scatterplots for each of the three test rooms with L and GR scores plotted against the STI value assigned to each seat. In Room 11 (Figure 8a) which exhibited the lowest STI (Min = 0.52, M = 0.60, SD = 0.04) among the three test rooms, L scores show a slightly positive linear trend as STI increases, while that of GR scores remain largely flat. This may indicate that the listening performance of examinees seated in areas with higher STI could have benefited from better acoustic conditions. Figure 8b shows Room 12 in which the regression slope for L scores mirror that of Room 11, but GR scores yielded a negative slope. The relatively high STI environment—often exceeding 0.70—may have facilitated better listening outcomes for examinees, even for those with slightly lower GR scores. Figure 8c shows an intriguing pattern where the regression lines for both L and GR scores in Room 13 are nearly parallel and flat, indicating little to no observable relationship between STI and either score. This may be a product of the room’s relatively stable acoustic profile, where STI was generally high and evenly distributed throughout the pentagonal-shaped room.
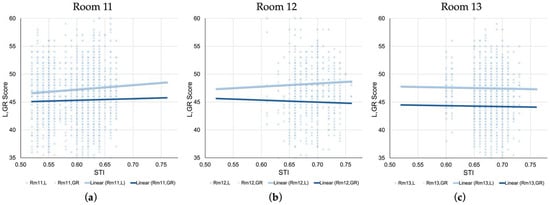
Figure 8.
Scatterplots of L and GR scores plotted against seat-level STI values for (a) Room 11, (b) Room 12, and (c) Room 13. Linear regression lines for L and GR scores are shown for each room. For the purpose of visual comparison, plotted scores and regression lines for GR were generated with halved scores so they correspond with those of L scores.
3.3.2. Statistical Analysis of STI Effects
Linear mixed-effects models were conducted to examine whether acoustic conditions as indicated by STI values had a significant effect on L scores while controlling for fixed effects. To prepare the data for this analysis, the STI values were first grouped into two category sets. The groupings for the first category (Table 13) were determined based on the STI qualification bands presented in IEC 60268-16:2020 [19]. The STI values were clustered in 0.04 increments (i.e., 0.52–0.55, 0.56–0.59, etc.) and given alphabetical labels according to those prescribed in [19]. The highest STI values of 0.75 (n = 1) and 0.76 (n = 2) were included in category A. The second set (Table 14) was prepared in clusters of 0.03 increments (i.e., 0.52–0.54, 0.55–0.57, etc.) and given approximated alphabetical labels, with categories C and E expanded into C+ and E+, respectively, to account for two additional clusters. This grouping was determined based the just noticeable difference (JND) of 0.03 for STI as reported in [52]. Again, the highest STI value (0.76, n = 2) was included in category A. The two category sets will be referred to as IEC– and JND–based, respectively.
Table 13.
Sample size (n) of score data by test room and IEC-based STI category.
Table 14.
Sample size (n) of score data by test room and JND-based STI category.
Two sets of LMMs were setup with L scores as the dependent variable, STI category (IEC- or JND-based), GR scores, year, gender, and nationality as fixed effects, and test date as a random intercept. Assumptions of normality, homoscedasticity, and multicollinearity were met for both sets. Both models revealed a significant main effect of STI on L scores (IEC-based, F(5, 2520.00) = 10.34, p < 0.001; JND-based, F(7, 2518.00) = 7.75, p < 0.001). Other fixed effects were consistent with those reported in Section 3.2.2, with GR scores, year, gender, and nationality all being significant (p < 0.001) in both models, and the random intercept for test date was likewise not significant.
For IEC-based STI categories (Table 15), the estimated marginal means indicated gradual increases from the lowest STI category (F, 0.52–0.55; M = 47.57, SE = 0.27) to the highest (A, 0.72–0.76; M = 49.25, SE = 0.41). The post hoc pairwise comparisons after Bonferroni correction (α = 0.0033) revealed that those in category F (0.52–0.55) scored significantly lower than all other test takers seated in areas with STI at or above category D (≥0.60). The JND-based STI categories (Table 16) showed a similar pattern, with an upward trend across increasing STI categories, and the post hoc pairwise comparisons with Bonferroni-adjusted significance level (α = 0.0018) revealed that those in the lowest STI category (F, 0.52–0.54) scored significantly lower than all groups at or above category D (≥0.61). The results seem to indicate that JND-based categorization may be more sensitive than the IEC version for detecting room-acoustic effects on listening performance.
Table 15.
Linear mixed-effects model results for TOEFL ITP listening scores by IEC-based STI categories. Sample size (n), estimated marginal means (Estimated Mean), standard error (Std. Error), and significance values (p) for pairwise comparisons are presented. The adjusted significance value after Bonferroni correction for 15 pairwise comparisons set at p = 0.0033. Significant values are shown in bold. * p < 0.05, ** p < 0.01, *** p < 0.001.
Table 16.
Linear mixed-effects model results for TOEFL ITP listening scores by JND-based STI categories. Sample size (n), estimated marginal means (Estimated Mean), standard error (Std. Error), and significance values (p) for pairwise comparisons are presented. The adjusted significance value after Bonferroni correction for 28 pairwise comparisons set at p = 0.0018. Significant values are shown in bold. * p < 0.05, ** p < 0.01, *** p < 0.001.
Together, although the pairwise comparisons uncovered pockets of significant differences in other category combinations, both models showed a tendency for lower L scores in the lowest STI categories (IEC-based, 0.52–0.55; JND-based, 0.52–0.54) in relation to those above ≥0.60 STI.
3.4. Score Differences by CEFR-J
3.4.1. Exploratory Analysis
The LMM analysis in Section 3.2.2 did not reveal a significant Room × GR interaction, indicating that the relationship between baseline proficiency and L scores was statistically similar across the three test rooms. However, given that prior research [43] has suggested that lower-proficiency learners may be more vulnerable to suboptimal acoustic conditions, Figure 9 was generated to examine the effect of varying acoustic conditions on different proficiency groups in the present study.
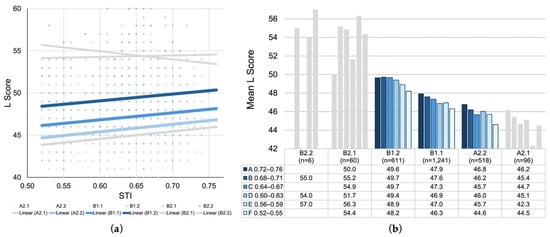
Figure 9.
(a) Scatterplot of L scores plotted against seat-level STI values with linear regression lines by CEFR-J level. (b) Grouped bar chart of mean L scores across STI categories (A–F) by CEFR-J level. The colored figures representing the middle three levels (A2.2, B1.1, B1.2) account for 93.6% of the entire dataset; thus, the peripheral levels (A2.1, B2.1, B2.2) are displayed in grey.
Figure 9a plotted L scores by CEFR-J levels against STI throughout all rooms. A trend of parallel positive slopes was observed for mid- to lower–proficiency groups (A2.1 to B1.2), indicating that listening performance in these groups improves as STI increases. In contrast, higher-level groups (B2.1 and B2.2) showed weaker or inverse trends, which imply that the benefits of favorable acoustic conditions may taper off as proficiency increases. Figure 9b supplements the scatterplot with a grouped bar chart of the mean L scores across STI categories for each CEFR-J level. In addition to the general direction of decreasing mean L scores, a positive relationship between STI and L scores within each proficiency group was identified, suggesting that examinees with comparable GR scores performed better in higher STI conditions than those in lower ones.
It should be noted that, although the figures seem to indicate these proficiency-dependent patterns across the CEFR-J levels, sample sizes are heavily concentrated in the middle three levels—A2.2 (n = 518), B1.1 (n = 1241), and B1.2 (n = 611)—together accounting for 93.6% of the entire dataset. To reflect this sample distribution, the peripheral levels—A2.1 (n = 96), B2.1 (n = 60), and B2.2 (n = 6)—are displayed in grey.
3.4.2. Statistical Analysis
Despite the uneven sample distribution, patterns suggestive of proficiency-dependent effect of acoustic conditions on L scores can still be identified. To examine this possibility, LMM analyses were conducted separately for CEFR-J A2.2, B1.1, and B1.2. The fixed effect of test room was statistically significant for B1.1 (p = 0.002) and B1.2 (p = 0.035), but not for A2.2 (p = 0.306). Estimated marginal means showed that Room 11 consistently yielded lower listening scores than Rooms 12 (M = 0.63) and 13 (M = 0.64) across these groups. Pairwise comparisons indicated significantly lower scores in Room 11 compared to Room 12 (mean difference = −0.77, p = 0.029) and Room 13 (−0.66, p = 0.004) for B1.1 learners, and significantly lower than Room 13 (−0.77, p = 0.047) for B1.2 learners. No significant differences between Rooms 12 and 13 were observed in any group. After applying the Holm–Bonferroni (step-down) correction for multiple comparisons, significant results remained only for B1.1: Room effect (p = 0.005), Room 11 vs. 13 (p = 0.034).
4. Discussion
4.1. Interpretation of Score Differences by Test Room
The findings substantiate the notion that standardized EFL proficiency listening tests administered under adverse acoustic conditions can present inequitable challenges for particular test taker populations. Our preliminary study [41] analyzed approximately 5000 TOEIC L&R IP scores from one department, a subset of the obtained 20,000 score data, and found significantly lower L scores in the test room exhibiting the highest RT (RT0.5–2kHz 0.87 s) and the lowest STI (0.59 STI) among the eight rooms examined. Inclusion of two additional rooms in subsequent studies revealed even greater acoustic discrepancies. Using TOEIC practice tests in a controlled experiment, significantly lower L scores were found in an acoustically unfavorable environment—Room 9 (RT0.5–2kHz 1.25 s, 0.56 STI)—compared to those from a favorable test room—Room 5 (RT0.5–2kHz 0.67 s, 0.72 STI) [43]. The present study replicated these findings using score data (n = 2532) from five TOEFL ITP sessions administered across five years, with Room 11 (RT0.5–2kHz 1.51 s, 0.60 STI) yielding significantly lower L scores. Both the TOEIC L&R IP and the TOEFL ITP were conducted by the respective universities and carried high-stakes consequences such as proficiency-based class placement, final grade in English classes, and eligibility for required courses.
One notable observation is that, similar to the acoustic conditions reported in [38,39] in their investigations of university facilities, large acoustic variations were found between university classrooms and lecture halls. Our earlier studies [41,42,43] were conducted at a national university, whose facilities are also used by outside organizations including the official TOEIC L&R SP and the EIKEN exams. University records have shown that the same test rooms investigated in the studies were routinely used by these testing organizations. In contrast, the present study was conducted at a private university. The use of facilities by outside organizations is less frequent, but the lecture halls are also used for the university’s own entrance exams. This is different from Japan’s national Common Test for University Admissions, for which both institutions are designated venues, where the English listening test is administered using a portable audio player developed specifically for this purpose [53]. Nevertheless, whether public or private, in-house or standardized, these tests are high-stakes assessments that demand a fair and accurate evaluation of each examinee’s language proficiency.
The results point to an emerging pattern of acoustic parameters that could serve as practical criteria for the discernment of a given test room’s suitability for high-stakes tests. As indicated by the statistical analysis results, Room 11 was associated with apparent acoustic challenges that induced significantly lower L scores for certain test taker populations. With a RT0.5–2kHz of 1.51 s and mean STI of 0.60, it mirrors the adverse acoustic conditions of Room 9 referenced above. Interestingly, although these rooms differed substantially in volume (Room 9, 333 m3; Room 11, 2033 m3), both shared architectural features that likely contributed to the observed acoustic characteristics. Room 9 had hard, reflective surfaces and decorative gypsum ceiling panels, while Room 11 appeared to be acoustically treated but was later also found to be mostly decorative in nature. Ironically, both rooms had been recently renovated and were otherwise clean, modern, and well-equipped, making their acoustic disposition particularly unfortunate. On the other hand, it is reasonable to identify Rooms 12 and 13 as favorable L2 listening environments. Both Room 12 (RT0.5–2kHz 0.93 s, 0.69 STI) and Room 13 (RT0.5–2kHz 0.79 s, 0.67 STI) largely mirrored the acoustic profile of Room 5 (RT0.5–2kHz 0.67 s, 0.72 STI), also labeled favorable, from the earlier study. All rooms featured some form of acoustic treatment: Room 5 had perforated and fluted wood panels across the entire front and rear walls, Room 12 had perforated panels on all four walls and a carpeted area towards the rear, and Room 13, though much larger than the other two, had heavy drape curtains covering a significant portion of the rear wall.
The presence of such distinct acoustic variations—not only across ten rooms at a national university but also across three lecture halls at a private university—underscores the potential prevalence of this issue. These findings align with reports in the literature that acoustic inadequacies are widespread in educational environments, not only in primary and secondary schools but also at the university level [31,37,54]. Given the growing emphasis on foreign language instruction in higher education and the routine use of these lecture halls for language instruction, these results call for an increased effort to establish acoustic standards and guidelines for university facilities.
4.2. Interpretation of Score Differences by STI
In addition to room-level analysis, the present study utilized seat-based STI values to examine more closely the relationship between localized speech intelligibility and listening performance. A notable finding from the analysis was the significantly lower L scores observed in test takers seated in areas with ≤0.55 STI compared to those in ≥0.60 STI across all three test rooms. This is an important finding as our previous studies have recommended 0.66 STI as a minimum threshold for STI in non-native listening test scenarios. This recommendation originally stemmed from an interpretation of the STI categories presented in [19], in which 0.66 STI (category C) is described as exhibiting “high speech intelligibility” for “complex messages, unfamiliar words,” while 0.62 STI (category D) is defined as “good speech intelligibility” for “complex messages, familiar words.” Given that accurate perception of all test content, regardless of lexical familiarity, is essential for test equity, 0.66 STI was adopted as a minimum recommended threshold for non-native listening assessments. The previous studies supported this assumption, with analyses of TOEIC L&R IP test scores collected over an eight-year period revealing that L scores from a test room with M = 0.59 STI were significantly lower than those from test rooms M = 0.68–0.74 STI [41]; however, only room-level mean values were considered. The finding from the present study seems to indicate that the threshold for acceptable acoustic conditions, at least in terms of STI, may be lower than previously assumed.
Another result that adds an important dimension to the evaluation of test rooms is that significant differences in L scores were observed not just across test rooms but also within the room. While all three test rooms in the present study showed a comparable STI range of 0.13–0.15 (see Table 6), only Room 11 yielded a significant difference in L scores. Follow-up LMM analyses conducted separately by test room revealed that pairwise comparisons of L scores from STI category F (IEC, 0.52–0.55; JND, 0.52–0.54) in Room 11 were significantly lower than those from C (IEC, 0.64–0.67; JND, 0.64–0.66) and D (IEC, 0.60–0.63; JND, 0.61–0.63). The STI fixed effect and L score pairwise comparisons for Room 12 and 13 were all non-significant. In [43] only front-rear differences were examined in regard to mean L scores within each of the two test rooms, from which no statistically significant differences were observed, positing that perhaps within-room STI differences are not as perceptible as those between rooms. However, a re-examination of the methods indicated that loudspeaker distances may have influenced this assumption. In [43], the source-receiver distances for the front and rear sections in Room 5 were 3.25 m (SD = 1.73) and 10.15 m (SD = 1.18), whereas those in Room 9 were 3.34 m (SD = 0.86) and 12.16 m (SD = 0.78). In contrast, the source-receiver distances in Room 11 ranged from 9.72 m to 21.5 m, with the seat position closest to the loudspeakers being as far as those in the rear rows in Room 5 and 9. The present study’s findings suggest that the distribution of STI in a room beyond a certain range may have a measurable effect on listening performance.
These findings align with research on speech intelligibility in educational settings. Kennedy et al. (2006) [55] surveyed over 5700 university students who reported significantly greater perceived listening ease in classrooms with STI values above 0.60, while lower perceived ease was associated with STI values below 0.55. Although their study did not involve non-native listeners, the reported values remarkably coincide with those that showed significant differences in L scores in the present study. The STI value of 0.60 also appears in Minelli (2022) [36], in which a comprehensive review of 38 studies revealed that learners aged 12 and older generally achieve excellent intelligibility at STI ≥ 0.60. Again, the reviewed studies mostly concerned L1 listeners, but the authors emphasized that those with linguistic disadvantages, such as L2 learners, would require more favorable conditions. Lastly, Yang and Mak (2018) [56] conducted controlled experiments with English as a second language learners aged 12 to 21 in Hong Kong and reported that speech intelligibility continued to improve up to STI values as high as 0.90, with no observable plateauing of performance at 0.60 or 0.66. Their finding suggests that higher STI values even beyond the minimum threshold may be beneficial particularly for non-native listeners. Collectively, these studies reinforce the present study’s finding that <0.60 STI represent a critical threshold where listening comprehension may be compromised.
4.3. Interpretation of Score Differences by CEFR-J
The literature has reported an interactive relationship between acoustic condition and L2 ability, with higher-proficiency learners showing increased tolerance against adverse acoustic condition. Sörqvist et al. (2014) [34] examined Swedish university students listening to English under reverberation times of 0.3 s (low) and 1.2 s (high), and found that high L2 proficiency (based on reading comprehension test scores) significantly mitigated the negative effects of long RT on listening comprehension. Similarly, Kilman et al. (2014) [57] tested university students’ speech perception in English across four conditions involving different combinations of reverberation and background noise. Their results showed that higher English proficiency consistently led to better comprehension across all conditions. A more recent study by MacCutcheon et al. (2019) [58] also supported this pattern. The authors compared performance of bilingual university students under two RT conditions (0.3 s and 0.9 s) and found that those with larger English vocabulary sizes performed substantially better; the longer RT condition yielded 22% higher comprehension scores compared to 9% higher in the shorter RT condition. Our previous work [43] likewise observed this trend. In two acoustic environments labeled favorable (RT0.5–2kHz 0.67 s, 0.72 STI) and unfavorable (RT0.5–2kHz 1.25 s, 0.56 STI), participants showed significantly higher L scores in the favorable condition, with decreasing mean L score differences between the two environments as proficiency increased from CEFR-J A2.2. to B2.1.
The present study revealed comparable yet biased results. The descriptive statistics (Figure 9) generally indicated a linear relationship between acoustic condition and L2 proficiency, with greater susceptibility among lower proficiency learners and a moderating effect in the higher groups. However, the sample distribution was highly skewed towards the center, with 49.0% of the data contained in CEFR-J B1.1 and 93.6% in A2.2 to B1.2. Moreover, among these three groups, the LMM analyses yielded significant room effects for the higher proficiency groups (B1.1, B1.2), with one significant pairwise difference between Room 11 and 13 for B1.1. While a lack of standardized categorization of the proficiency levels of the subjects makes direct comparisons across listener groups difficult, these results do not necessarily contradict previous studies. The Council of Europe designates CEFR B as “independent user” and its subset B1 as “intermediate” [44]. Since the CEFR-J B1.1 represents the bottom half of the B1 category, it can be presumed that B1.1 results from the present study is comparable to the mid- to lower proficiency participants in the referenced literature. In this regard, although the sample distribution of the present study’s findings limits the interpretation of the results across a wide spectrum of proficiency levels, it is nonetheless noteworthy that significant L score differences between acoustically distinct testing environments were observed among test takers at the B1.1 level comprising virtually half of the dataset. We encourage future investigations to employ standardized frameworks like the CEFR in order to build a cumulative body of research that enables meaningful cross-study comparisons.
4.4. Implications for Standardized L2 Listening Assessment
4.4.1. STI Recommendations
The findings from the present study provided empirical evidence that warrants a reappraisal of the STI recommendation, previously established at ≥0.66 STI. Particularly, 0.60 STI emerged as a possible candidate, as it aligns with the lower bound of IEC-based STI category D (0.60 < D < 0.64) which showed significantly higher L scores compared to those in category F (0.52–0.55). In addition, category D is still considered to show good speech intelligibility [19]. Thus, ≥0.60 STI may be a reasonable revision to the recommendation. However, as Figure 9 illustrated, acoustic conditions beyond 0.60 STI can still yield higher L scores across a broad range of proficiency levels, also supported by [56]. Moreover, test rooms in our previous work that exhibited ≥0.66 STI—deemed both reasonable and attainable in those environments—rarely contained measurements below 0.60 STI. In fact, those that did contain 0.60 STI or lower mostly fell under this threshold and were deemed unfit for standardized EFL assessments. By this line of reasoning, Room 11 would be categorized as the latter, which is substantiated by the findings of the present study. Thus, perhaps a more suitable application of 0.60 STI could be a minimum threshold required for all seating areas, while 0.66 STI can be reinterpreted as M ≥ 0.66 STI, the recommended mean value of all measurements from a given test room.
It should be noted that the purpose of these recommendations is to present benchmark STI values that can inform the identification and selection of test rooms for high-stakes listening assessments. They are not intended to propose sweeping renovations to existing lecture halls, at least for the sole purpose of standardized EFL proficiency test administrations. Of course, acoustic renovations in university lecture halls would certainly benefit its users, not only for test administration but also for their primary use as educational spaces. However, retrofitting large university spaces often involves extensive planning and substantial financial commitment on the part of the institution. The benchmarks presented here should therefore be understood primarily as a tool for guiding test-room selection. Future research will need to examine how such thresholds might be applied in practice, including the development of cost-effective screening methods that allow administrators to identify and prioritize more favorable test venues.
4.4.2. Score Implications
Implications of the observed score differences on test outcomes need to be discussed. In the TOEFL ITP, the Listening, Grammar, and Reading sections contain 50, 40, and 50 question items, respectively. The raw scores are converted to scaled score ranges of 31–68 for the Listening and Grammar sections and 31–67 for Reading. These scaled scores are further converted to the total score range of 310–677. Although the conversion process from raw to scaled scores is undisclosed [59], it can be deduced that each question item roughly translates to 0.7–0.9 scaled points and 3 points in the total score. This is evident from the dataset in which the total score increases in 3- or 4-point increments (i.e., 470, 473, 477, 480). In the present study, scaled scores were used in all analyses.
When LMM analyses yielded significant differences between Room 11 and the other two rooms, they indicated estimated marginal mean differences of 0.75 (Room 11 vs. 12) and 0.58 (Room 11 vs. 13) scaled-score points, corresponding to approximately one raw item and 2–3 points in the total score. Both the room and CEFR-J B1.1 showed comparable effects. For the STI category analyses, significant pairwise differences revealed larger effects. For example, under the IEC-based categorization, A–F and B–F category differences were 1.68 and 1.47 points, respectively, roughly 5–6 total-score points. Under the JND-based categorization, the largest observed difference was 2.11 points between categories A and F (~7 total-score points), whereas the next largest was 1.67 points between both B–F and C+–F which exceeded 5 points on the total-score scale. Since categories A and B only appeared in Room 12 and 13, and category F was only found in Room 11, these observations imply that there was as much as 5–7 total-score points difference between test takers seated in these conditions. Even within Room 11, where the highest STI categories were C and C+ for IEC and JND, respectively, the analysis results indicated significant differences of 3–5 total-score points between those seated in acoustically worst and best seats.
The implication of these score differences becomes clear when viewed against institutional cutoffs. At this university, TOEFL ITP scores of 480 and 500 serve as important prerequisites for course enrollment and graduation. Thus, even a difference equivalent to one or two question items can be consequential. In fact, the dataset included a notable number of examinees who fell just short of these cutoffs (473–477, n = 160; 493–497, n = 119) as opposed to those that achieved 480 (n = 68) and 500 (n = 56). The findings thus raise equity concerns in high-stakes testing contexts and reinforce the need for rigorous acoustic quality control.
4.4.3. Loudspeaker Directivity and Maintenance
As listening tests rely on the use of loudspeakers, room-level acoustic variations may stem from factors such as loudspeaker type, placement, orientation, and maintenance. Notably, the loudspeakers used for the delivery of the listening test audio in the present study were those available as part of the multimedia equipment installed in each room. Aside from routine volume checks performed prior to test day, no other configuration, maintenance, or calibration were conducted in preparation for each test session. Such factors likely contributed to the observed STI distribution within each test room. In Room 11, line-array loudspeakers were aimed toward the rear, where STI values were the highest. In Room 12, one loudspeaker was visibly misaligned, corresponding to a cluster of higher STI values on the right side. These patterns echo findings from our earlier study [42], where poor maintenance of the wall-mounted speakers in Room 1 was likely linked to noticeably lower STI measurement results compared to those of portable loudspeaker units. Millett (2015) [60] noted that sound field amplification systems can improve classroom listening, but only if installed and maintained properly; otherwise, misalignment or user error can even reduce their effectiveness. Lafargue and Lafargue (2012) [61] also cautioned that poorly managed systems may worsen intelligibility compared to having no system at all. Together, these factors can introduce additional sources of uncontrolled acoustic difference, which may have contributed to score variation independently of room acoustics in the present study, and they suggest that the audio delivery system can also play a critical role in supporting fair listening conditions in standardized EFL testing contexts. Future work should seek to minimize this variability by standardizing or acoustically characterizing the playback systems used across test venues.
4.4.4. Room Volume
Room volume appears to have played a major role in acoustic performance. Room 11 was approximately 2033 m3, double the size of Room 13 (1040 m3) and nearly four times the size of Room 12 (585 m3). In fact, all test rooms investigated in our previous study were under 1000 m3 (301 m3 to 967 m3). Larger lecture rooms, such as Room 11, are often associated with degraded speech intelligibility even under moderate reverberation times [62], and they frequently suffer from acoustic inconsistencies due to suboptimal speaker placement or reflective surfaces [63]. Although recent studies have demonstrated that acoustics can be optimized even in large university lecture halls [64,65], improvements such as installation of acoustic panels and new loudspeakers come at considerable cost and planning effort. The present findings reinforce the challenges of ensuring consistent acoustic quality in large spaces, especially under standardized testing conditions. The fact that Room 11 exhibited unfavorable outcomes in both objective acoustic measurements and listening test performance suggests that establishing a maximum room volume threshold for EFL test administration may be a useful consideration moving forward.
4.4.5. Test Methods
Finally, implications for standardized assessment testing methods will be briefly discussed. Recently, alternative methods such as dedicated test centers and online platforms have been gaining traction for their potential to control variability in test conditions, including audio delivery methods for the listening test. Particularly in Japan, the national Common Test for University Admissions administered to nearly 500,000 high school students each year famously utilizes sets of individual IC players and earphones for the listening test, developed specifically to mitigate acoustic variability in test rooms. While these options offer important benefits, each comes with its own set of challenges. Reports have highlighted issues ranging from poor headphone quality and user error to synchronization problems and environmental distractions [53]. Moreover, online testing faces major challenges such as cheating and score inflation, limitations in both AI- and human-based proctoring, and unequal access to digital resources [66,67,68]. In this respect, the present study’s findings uphold the use of lecture halls for group-based test administration, as both Room 12 and 13 were found to be suitable environments. Combined with our previous findings that showed favorable acoustic conditions in seven out of ten rooms [42], the continued use of physical test rooms remains a viable and cost-effective option.
4.5. Limitations and Future Studies
4.5.1. The Data
This study focused exclusively on TOEFL ITP scores while the findings in our previous works were based on TOEIC L&R IP data. Although results across two different standardized tests (TOEIC L&R IP and TOEFL ITP) point to a converging trend in high-stakes testing contexts, where poorer acoustic conditions are associated with lower listening scores, further research is needed to verify reproducibility under more controlled conditions. Other variables unique to high-stakes tests should also be considered, such as test type (IELTS, EIKEN, GTEC, TEAP, etc.), quantity and position of sound source (central, dual, ceiling), audio delivery method (loudspeakers, earphones, headphones), and location (test room, test center, online).
One statistic worth mentioning here is that CEFR levels A2 and B1, which comprised 97.4% of the present study’s score data, similarly comprised 93.0% of all test takers for the 2023 TOEIC L&R IP administrations in Japan [1] as well as the 1st through the 77th percentile among global TOEFL ITP examinees in 2023 [3]. Thus, it can be argued that the obtained dataset represented a sizeable portion of typical test taker populations for these tests. However, as noted in Section 4.3, the subdivided CEFR-J groups contained skewed sample distributions (A2.1, n = 96; A2.2, n = 518; B1.1, n = 1241; B1.2, n = 611) which limited generalizability even within these levels. Future research should seek to gather balanced proficiency distributions across wider proficiency ranges to determine the extent to which acoustic effects generalize across diverse high-stakes assessment contexts.
Critically, the obtained data and all findings in this study were restricted to one private university in Japan. Although the large sample size and the distinct acoustic profiles of test rooms yielded important and, to a particular subset of individuals, consequential results, the findings may not represent the full range of test-room conditions or student populations across Japan or internationally. Comparative studies in different institutional contexts are needed to confirm whether similar acoustic effects emerge elsewhere.
4.5.2. Measurement Factors
The acoustic measurements were conducted in unoccupied conditions. Research has generally shown that occupancy negatively affects speech intelligibility in closed spaces [69,70]. Lower STI in occupied contexts can occur from a range of factors. Occupants, typically defined at a rate of 80%, tend to decrease RT but in turn increase BNL, affecting SNR especially for unamplified speech. Occupants also absorb more sound, decreasing STI more in areas farthest from the sound source (typically the rear part of the room) [71,72]. In the present study, BNL with HVAC in unoccupied conditions were 39.6–40 dBA, and test day conditions involved 54–60% occupancy rates, examinees sitting quietly, and listening test audio delivered through amplified loudspeakers at around 70–80 dBA. Provided that the presence of examinees increased the BNL by around 10 dBA [72,73], SNR would be around +20–30 dBA, ample levels to mitigate the effect of BNL on speech intelligibility [74]. In a study conducted under similar conditions, [39] examined 12 university classrooms with and without occupants (students sitting in silence with mean occupancy rate of 54%) and found that while STI was negatively affected (M = −0.02) in absorptive rooms (RT0.5–2kHz 0.60 s), it increased in reflective rooms (RT0.5–2kHz 1.31 s). Thus, while the measured values may not fully reflect the actual test day environment, it can be argued that they provided standardized and conservative estimates that align with international practices and were relevant to acoustic conditions specific to large-scale listening assessment contexts.
The inclusion of seat-based STI values as a variable in the analysis was an important consideration in the present study. However, many of these values were approximated based on measurements from nearby seats (see Figure 3 and Figure 5) and remained unvalidated. While it is worth noting that the number of measurements taken in the test rooms for this study (see Table 6) exceeds what is typically reported in the literature, whether similar analyses can yield valid results based on fewer measurement points remains to be seen, and replication of the present method would help verify its robustness.
Detailed examination of RT was beyond the scope of this study and was not discussed in depth. However, it should be noted that RT in Room 12, while moderate in the mid-band frequencies (0.5 kHz, 0.65 s; 1 kHz, 0.82 s), indicated a sudden spike at higher frequency ranges (2 kHz, 1.32 s; 4 kHz, 1.43 s) comparable to the levels observed in Room 11 (2 kHz, 1.35 s; 4 kHz, 1.26 s). Although the findings from the present study revealed favorable L scores in Room 12, such a sudden, excessive increase in RT, particularly in frequency ranges that still affect speech intelligibility, should be handled with caution. Since the frequency range of recommended RT values for indoor spaces vary by national standards [20,27,28,29], future research should explore the appropriate range of frequencies to include in the recommendations for large-scale non-native listening assessment environments.
4.5.3. Environmental Factors
Seating assignment was ID-based. While the process was systematic and minimized intentional bias, it does not constitute a true random assignment with respect to all unmeasured confounding factors and undocumented examiner discretion in specific instances.
Seating distance was recorded only for the STIPA measurement locations and not for every individual seat; thus, this variable was not incorporated into the analyses. Because distance from the loudspeakers can influence the received signal and interact with the interpolated STI values, the lack of comprehensive seat-level distance data introduces additional uncertainty.
The SPL of the listening test audio on individual test sessions was not recorded. Although test manuals typically stipulate playback of the audio CD at an appropriate SPL and advise examiners to adjust the level based on requests from test takers, the interpretation of an “appropriate SPL” is completely subjective, and test takers rarely make such requests. Moreover, the SPL can be too low, but it can also be too high. Future research should look into developing a systematic method to objectively set the proper SPL in any given test room.
The HVAC settings, room temperature, and ambient noise in actual test day conditions were also not systematically recorded. As these factors directly affect the acoustic properties in a given space, their absence limits the generalizability of the present study’s findings. Since these factors are relatively easy to record, future studies should examine how they interact in shaping test room acoustics and their influence on listening performance.
4.5.4. Human and Psychological Factors
In this study, demographic information such as age, year, gender, and nationality was obtained and included in the statistical analyses. However, a number of other individual-level factors were not controlled. Hearing ability of each examinee was not measured despite its potential influence on listening performance. Prior test exposure also could not be fully determined. While all incoming freshmen take the TOEFL ITP upon enrollment, students may choose whether to forego subsequent tests or participate in additional mid-semester sessions, making it difficult to quantify exact exposure. Since test-taking skills and familiarity with test procedures are important components of standardized assessments, this remains a relevant limitation.
Finally, it should be noted that reports of acoustic inadequacies in Room 11 have been repeatedly voiced by examinees and have been a point of concern at the university for some time. Yet, for logistical reasons Room 11 has continued to be utilized for assessment tests including the TOEFL ITP. Consequently, it is plausible that psychological factors such as heightened anxiety or diminished concentration may have arisen from examinees’ perception of being in an acoustically suboptimal space, even when their actual seat conditions were relatively adequate [75]. A recent systematic review has emphasized that K-12 classroom acoustic quality affects students’ perceived listening effort, difficulty concentrating, irritability, reduced motivation, and negative impacts on social relationships [76]. Importantly, older students—those closest in age to university students in the present dataset—reported heightened sensitivity to poor acoustics due to increased awareness of their cognitive and emotional efforts. Future studies should aim to investigate these potential effects empirically.
5. Conclusions
This study showed that test room acoustics can affect test takers’ listening performance on high-stakes EFL assessments. Using large-scale, real-world TOEFL ITP data, we found that test takers in the acoustically unfavorable room (Room 11) scored significantly lower than their peers in better-suited environments (Room 12 and 13), even after controlling for baseline proficiency and demographic factors. Analysis by CEFR-J level revealed B1.1 as the most strongly affected, and seat-level STI revealed a positive relationship with listening performance, though the sample distribution limited their interpretation within a subset of lower-proficiency learners. Crucially, the obtained results were comparable to those observed in our previous investigations of TOEIC IP scores due to the utilization of the CEFR/-J framework across the studies. While the dataset was restricted to one private university in Japan, the results offer empirical evidence for the consideration of acoustic quality as a component of test validity in standardized listening assessments.
Author Contributions
Conceptualization, M.K.; methodology, M.K., H.H.; software, M.K.; validation, M.K.; formal analysis, M.K.; investigation, M.K.; resources, H.H.; data curation, M.K.; writing—original draft preparation, M.K.; writing—review and editing, M.K., H.H.; visualization, M.K.; supervision, H.H.; project administration, H.H.; funding acquisition, H.H. All authors have read and agreed to the published version of the manuscript.
Funding
This research received no external funding.
Institutional Review Board Statement
The study was conducted in accordance with the Declaration of Helsinki, and the protocol was approved by the Research Ethics Review Committee of Kanda University of International Studies (Project ID: 2024-18).
Informed Consent Statement
Informed consent for participation was not required, as the obtained data was part of department-wide end-of-term diagnostic tests conducted by the university. All students signed a consent form at the time of enrollment acknowledging the retroactive use of anonymized data for research purposes.
Data Availability Statement
The data presented in this study are available on request from the corresponding author. The data are not publicly available due to institutional restrictions and privacy considerations.
Acknowledgments
The authors would like to thank the Academic Affairs Division at the first author’s affiliated institution for the provision and preparation of the data. During the preparation of this manuscript, the authors used ChatGPT (version ChatGPT-4) for the purposes of generating portions of the abstract, title, section headings, reports of the statistical analysis, and references. The authors have reviewed and edited the output and take full responsibility for the content of this publication.
Conflicts of Interest
The authors declare no conflicts of interest.
References
- Educational Testing Service. TOEIC Listening and Reading Test: Report on Test Takers Worldwide 2024; ETS: Princeton, NJ, USA, 2024. [Google Scholar]
- Educational Testing Service. TOEFL iBT Test and Score Data Summary 2023; ETS: Princeton, NJ, USA, 2024. [Google Scholar]
- Educational Testing Service. TOEFL ITP Test and Score Data Summary 2024; ETS: Princeton, NJ, USA, 2025. [Google Scholar]
- IELTS Test Partners. IELTS Guide for Teachers 2024; British Council: Manchester, UK, 2024. [Google Scholar]
- Eiken Foundation of Japan, Status of Eiken Exams. Available online: https://www.eiken.or.jp/eiken/about/situation/ (accessed on 12 July 2025).
- Benesse Corporation. GTEC CBT and GTEC for Students: Latest Information; Benesse Corporation: Tokyo, Japan, 2016. [Google Scholar]
- The Japan Institute for Educational Measurement, Inc.; CASEC Homepage. Available online: https://casec.evidus.com/ (accessed on 12 July 2025).
- Institute for International Business Communication (IIBC). TOEIC Program Data & Analysis 2024 (English Version); IIBC: Tokyo, Japan, 2024. [Google Scholar]
- TOEFL iBT Usage in University Entrance Exams. Available online: https://www.toefl-ibt.jp/educators/search/toefl_ibt/ (accessed on 12 July 2025).
- TOEFL ITP Usage in Japanese Universities (2023 Academic Year). Available online: https://www.toefl-ibt.jp/educators/search/toefl_itp/ (accessed on 12 July 2025).
- Eiken Foundation of Japan. IELTS Official Test Center Guidebook; Eiken Foundation of Japan and British Council: Tokyo, Japan, 2020. [Google Scholar]
- Cho, Y.; Rijmen, F.; Novák, J. Investigating the effects of prompt characteristics on the comparability of TOEFL iBT™ integrated writing tasks. Lang. Test. 2013, 30, 513–534. [Google Scholar] [CrossRef]
- Getman, D.; Liu, O.L.; Schnackenberg, H.L.; Zanetti, M. Effects of Printed Option Sets on Listening Item Performance Among Young English-as-a-Foreign-Language Learners; ETS Research Report No. RR-16-26; ETS: Princeton, NJ, USA, 2016. [Google Scholar]
- Livingston, S.A. Test Reliability—Basic Concepts; Research Memorandum No. RM-18-01; ETS: Princeton, NJ, USA, 2018. [Google Scholar]
- Educational Testing Service. TOEFL ITP Supervisors Manual; ETS: Princeton, NJ, USA, 2013. [Google Scholar]
- American Educational Research Association; American Psychological Association; National Council on Measurement in Education. Standards for Educational and Psychological Testing; AERA: Washington, DC, USA, 2014. [Google Scholar]
- Zumbo, B.D. Three generations of DIF analyses: Considering where it has been, where it is now, and where it is going. Lang. Assess. Q. 2007, 4, 223–233. [Google Scholar] [CrossRef]
- Kane, M. Validating the interpretations and uses of test scores. J. Educ. Meas. 2013, 50, 1–73. [Google Scholar] [CrossRef]
- IEC 60268-16:2020; Sound System Equipment—Part 16: Objective Rating of Speech Intelligibility by Speech Transmission Index, 5th ed. IEC: Geneva, Switzerland, 2020.
- ANSI/ASA S12.60-2010/Part 1 (R2020); Acoustical Performance Criteria, Design Requirements, and Guidelines for Schools. Acoustical Society of America: Melville, NY, USA, 2020.
- Bradley, J.S.; Sato, H. The intelligibility of speech in elementary school classrooms. J. Acoust. Soc. Am. 2008, 123, 2078–2086. [Google Scholar] [CrossRef]
- Mealings, K.; Buchholz, J.M. The effect of classroom acoustics and noise on preschool children’s listening, learning, and wellbeing: A scoping review. Build. Acoust. 2025, 32, 109–121. [Google Scholar] [CrossRef]
- Yang, W.; Bradley, J.S. Effects of room acoustics on the intelligibility of speech in classrooms for young children. J. Acoust. Soc. Am. 2009, 125, 922–933. [Google Scholar] [CrossRef]
- Seitz, J.; Loh, K.; Fels, J. Listening effort in children and adults in classroom noise. Sci. Rep. 2024, 14, 25200. [Google Scholar] [CrossRef] [PubMed]
- Nelson, P.; Kohnert, K.; Sabur, S.; Shaw, D. Classroom noise and children learning through a second language: Double jeopardy? Lang. Speech Hear. Serv. Sch. 2005, 36, 219–229. [Google Scholar] [CrossRef] [PubMed]
- Lam, A.; Hodgson, M.; Prodi, N.; Visentin, C. Effects of classroom acoustics on speech intelligibility and response time: A comparison between native and non-native listeners. Build. Acoust. 2018, 25, 35–42. [Google Scholar] [CrossRef]
- AIJES-S0001-2020; Academic Standards and Design Guidelines for Sound Environment in School Buildings. Architectural Institute of Japan: Tokyo, Japan, 2020.
- Department for Education. Building Bulletin 93 (BB93), Acoustic Design of Schools: Performance Standards; Department for Education: London, UK, 2015.
- DIN 18041:2016-03; Acoustic Quality in Rooms—Requirements, Recommendations and Instructions for Planning. Beuth Verlag: Berlin, Germany, 2016.
- Mikulski, W.; Radosz, J. Acoustics of classrooms in primary schools—Results of the reverberation time and the Speech Transmission Index assessments in selected buildings. Arch. Acoust. 2011, 36, 777–793. [Google Scholar] [CrossRef]
- Mealings, K. Classroom acoustic conditions: Understanding what is suitable through a review of national and international standards, recommendations, and live classroom measurements. In Proceedings of the ACOUSTICS 2016: ACOUSTICS Creating Sound Connections, Brisbane, Australia, 9–11 November 2016; pp. 1047–1056. [Google Scholar]
- Lecumberri, M.L.G.; Cooke, M.; Cutler, A. Non-native speech perception in adverse conditions: A review. Speech Commun. 2010, 52, 864–886. [Google Scholar] [CrossRef]
- Scharenborg, O.; Van Os, M. Why listening in background noise is harder in a non-native language than in a native language: A review. Speech Commun. 2019, 108, 53–64. [Google Scholar] [CrossRef]
- Sörqvist, P.; Hurtig, A.; Ljung, R.; Rönnberg, J. High second-language proficiency protects against the effects of reverberation on listening comprehension. Scand. J. Psychol. 2014, 55, 91–96. [Google Scholar] [CrossRef]
- Peng, Z.E.; Wang, L.M. Effects of noise, reverberation and foreign accent on native and non-native listeners’ performance of English speech comprehension. J. Acoust. Soc. Am. 2016, 139, 2772–2783. [Google Scholar] [CrossRef] [PubMed]
- Prodi, N.; Visentin, C. A slight increase in reverberation time in the classroom affects performance and behavioral listening effort. Ear Hear. 2022, 43, 460–476. [Google Scholar] [CrossRef]
- Yang, D.; Mak, C.M. An investigation of speech intelligibility for second language students in classrooms. Appl. Acoust. 2018, 134, 54–59. [Google Scholar] [CrossRef]
- Minelli, G.; Puglisi, G.E.; Astolfi, A. Acoustical parameters for learning in classroom: A review. Build. Environ. 2022, 208, 108582. [Google Scholar] [CrossRef]
- Escobar, V.G.; Morillas, J.M.B. Analysis of intelligibility and reverberation time recommendations in educational rooms. Appl. Acoust. 2015, 96, 1–10. [Google Scholar] [CrossRef]
- Choi, Y.J. Effect of occupancy on acoustical conditions in university classrooms. Appl. Acoust. 2016, 114, 36–43. [Google Scholar] [CrossRef]
- Mealings, K. A scoping review of the effect of classroom acoustic conditions on university Students’ Listening, learning, and Well-Being. J. Speech Lang. Hear. Res. 2023, 66, 4653–4672. [Google Scholar] [CrossRef]
- Kawata, M.; Sato, K.; Tsuruta-Hamamura, M.; Hasegawa, H. Analysis of standardized foreign language listening test scores and their relationship to Speech Transmission Index and reverberation time in test rooms. In Proceedings of the 27th International Congress on Sound and Vibration (ICSV27), Virtual, 11–16 July 2021. [Google Scholar]
- Kawata, M.; Tsuruta-Hamamura, M.; Hasegawa, H. Assessment of speech transmission index and reverberation time in standardized English as a foreign language test rooms. Appl. Acoust. 2022, 202, 109093. [Google Scholar] [CrossRef]
- Kawata, M.; Tsuruta-Hamamura, M.; Hasegawa, H. Influence of test room acoustics on non-native listeners’ standardized test performance. Acoustics 2023, 5, 1161–1179. [Google Scholar] [CrossRef]
- Council of Europe. Common European Framework of Reference for Languages: Learning, Teaching, Assessment. Companion Volume; Council of Europe Publishing: Strasbourg, France, 2020; Available online: www.coe.int/lang-cefr (accessed on 1 November 2023).
- CEFR-J. European Language Portfolio: CAN-DO Descriptors. 2012. Available online: http://www.cefr-j.org/index.html (accessed on 1 November 2023).
- Sawaki, Y.; Sinharay, S. Investigating the value of section scores for the TOEFL iBT® test. ETS Res. Rep. Ser. 2013, 2013, i-113. [Google Scholar] [CrossRef]
- Safitri, M.; Wulyani, A.N.; Suharyadi, S. The correlation between students’ reading and listening score in a standardized test of TOEFL. J. Penelit. Pengkaj. Ilmu Pendidik. E-Saintika 2021, 5, 127–138. [Google Scholar] [CrossRef]
- Kanzaki, M. TOEIC listening and reading test and overall English ability. In Teacher Efficacy, Learner Agency; JALT: Tokyo, Japan, 2020. [Google Scholar] [CrossRef]
- TOEFL ITP Scoring. Available online: https://www.ets.org/toefl/itp/scoring.html (accessed on 12 July 2025).
- Kawata, M. A Study on the Role of Room Acoustics in English as a Foreign Language Listening Comprehension Assessment. Ph.D. Dissertation, Utsunomiya University, Utsunomiya, Japan, 2025. Available online: https://uuair.repo.nii.ac.jp/record/2000862/files/DT_ENG_000542_1_Full.pdf (accessed on 12 July 2025).
- ISO 3382-2:2008(E); Acoustics—Measurement of Room Acoustic Parameters—Part 2: Reverberation Time in Ordinary Rooms. ISO: Geneva, Switzerland, 2008.
- Bradley, J.S.; Reich, R.; Norcross, S.G. A just noticeable difference in C50 for speech. Appl. Acoust. 1999, 58, 99–108. [Google Scholar] [CrossRef]
- Uchida, T.; Otsu, K. The historical background of English listening comprehension tests in the National Center Test and their evaluation. Jpn. Assoc. Res. Test. 2013, 9, 77–84. [Google Scholar]
- Mealings, K.; Miles, K.; Matthews, N.; Buchholz, J.M. Towards an acoustically accessible campus: A case study of the acoustic conditions of an Australian university. Acoust. Aust. 2024, 52, 273–278. [Google Scholar] [CrossRef]
- Kennedy, S.M.; Hodgson, M.; Edgett, L.D.; Lamb, N.; Rempel, R. Subjective assessment of listening environments in university classrooms: Perceptions of students. J. Acoust. Soc. Am. 2006, 119, 299–309. [Google Scholar] [CrossRef]
- Kilman, L.; Zekveld, A.; Hällgren, M.; Rönnberg, J. The influence of non-native language proficiency on speech perception performance. Front. Psychol. 2014, 5, 651. [Google Scholar] [CrossRef]
- MacCutcheon, D.; Hurtig, A.; Pausch, F.; Hygge, S.; Fels, J.; Ljung, R. Second language vocabulary level is related to benefits for second language listening comprehension under lower reverberation time conditions. J. Cogn. Psychol. 2019, 31, 175–185. [Google Scholar] [CrossRef]
- Educational Testing Service. TOEFL ITP Test Taker Handbook; ETS: Princeton, NJ, USA, 2025. [Google Scholar]
- Millett, P. Sound Field Amplification Research Summary; York University: North York, ON, Canada, 2015; Available online: https://simeoncanada.com/wp-content/uploads/2018/12/Soundfield-Amplification-Research-Summary.pdf (accessed on 16 July 2025).
- Lafargue, C.; Lafargue, D. Sound Field Systems in New Brunswick Classrooms: Let’s Enhance Their Use; Department of Education and Early Childhood Development: Fredericton, NB, Canada, 2012. Available online: https://journals.lib.unb.ca/index.php/antistasis/article/download/19591/21123 (accessed on 16 July 2025).
- Prodeus, A.; Didkovska, M. Assessment of speech intelligibility in university lecture rooms of different sizes using objective and subjective methods. East.-Eur. J. Enterp. Technol. 2021, 3, 47–56. [Google Scholar] [CrossRef]
- Razali, A.W.; Din, N.C.; Hamdan, S. Investigation of the acoustics performance of the university’s lecture rooms by using economical and feasible design improvement strategies. J. Des. Built Environ. 2023, 23, 1–25. [Google Scholar] [CrossRef]
- Zhu, P.; Tao, W.; Lu, X.; Mo, F.; Guo, F.; Zhang, H. Optimisation design and verification of the acoustic environment for multimedia classrooms in universities based on simulation. Build. Simul. 2021, 15, 1419–1436. [Google Scholar] [CrossRef]
- Hakim, C.J.A.; Jonathan, M.; Indrani, H.C. Assessment of indoor acoustic performance: Impact of interior materials on classrooms in higher education buildings. Int. J. Sustain. Dev. Future Soc. 2024, 2, 84–98. [Google Scholar] [CrossRef]
- Langenfeld, T. Internet-based proctored assessment: Security and fairness issues. Educ. Meas. Issues Pract. 2020, 39, 24–27. [Google Scholar] [CrossRef]
- Yao, D. Examining the subjective fairness of at-home and online tests: Taking Duolingo English Test as an example. PLoS ONE 2023, 18, e0291629. [Google Scholar] [CrossRef]
- Maleki, A. Towards a more equitable education: A lens into EFL teachers’ pedagogical barriers in online assessments. Int. J. Lifelong Educ. 2024, 44, 186–205. [Google Scholar] [CrossRef]
- Valente, D.L.; Plevinsky, H.M.; Franco, J.M.; Heinrichs-Graham, E.C.; Lewis, D.E. Experimental investigation of the effects of the acoustical conditions in a simulated classroom on speech recognition and learning in children. J. Acoust. Soc. Am. 2012, 131, 232–246. [Google Scholar] [CrossRef] [PubMed]
- Yang, D.; Mak, C.M. Effects of acoustical descriptors on speech intelligibility in Hong Kong classrooms. Appl. Acoust. 2021, 171, 107678. [Google Scholar] [CrossRef]
- Visentin, C.; Prodi, N.; Cappelletti, F.; Torresin, S.; Gasparella, A. Using lis-tening effort assessment in the acoustical design of rooms for speech. Build. Environ. 2018, 136, 38–53. [Google Scholar] [CrossRef]
- Choi, Y.J. Evaluation of acoustical conditions for speech communication in active university classrooms. Appl. Acoust. 2020, 159, 107089. [Google Scholar] [CrossRef]
- Fratoni, G.; D’Orazio, D.; De Salvio, D.; Garai, M. Predicting speech intelligibility in university classrooms using geometrical acoustic simulations. In Proceedings of the 16th Conference of International Building Performance Simulation Association (IBPSA), Rome, Italy, 2–4 September 2019; pp. 4305–4312. [Google Scholar]
- Bistafa, S.R.; Bradley, J.S. Reverberation time and maximum background-noise level for classrooms from a comparative study of speech intelligibility metrics. J. Acoust. Soc. Am. 2000, 107, 861–875. [Google Scholar] [CrossRef] [PubMed]
- Chen, Q.; Ou, D. The effects of classroom reverberation time and traffic noise on English listening comprehension of Chinese university students. Appl. Acoust. 2021, 179, 108082. [Google Scholar] [CrossRef]
- Mercugliano, A.; Corbani, A.; Bigozzi, L.; Vettori, G.; Incognito, O. The effects of classroom acoustic quality on student perception and well-being: A systematic review across educational levels. Front. Psychol. 2025, 16, 1586997. [Google Scholar] [CrossRef] [PubMed]


Disclaimer/Publisher’s Note: The statements, opinions and data contained in all publications are solely those of the individual author(s) and contributor(s) and not of MDPI and/or the editor(s). MDPI and/or the editor(s) disclaim responsibility for any injury to people or property resulting from any ideas, methods, instructions or products referred to in the content. |
© 2025 by the authors. Licensee MDPI, Basel, Switzerland. This article is an open access article distributed under the terms and conditions of the Creative Commons Attribution (CC BY) license (https://creativecommons.org/licenses/by/4.0/).