

Acoustic Noise Characterization of a Switched Reluctance Motor Using Sound Power and Psychoacoustic Metric Measurements


Abstract
1. Introduction
2. Hardware Setup
3. Software Setup
4. Sound Power Measurement
5. Psychoacoustic Metrics
5.1. Sharpness
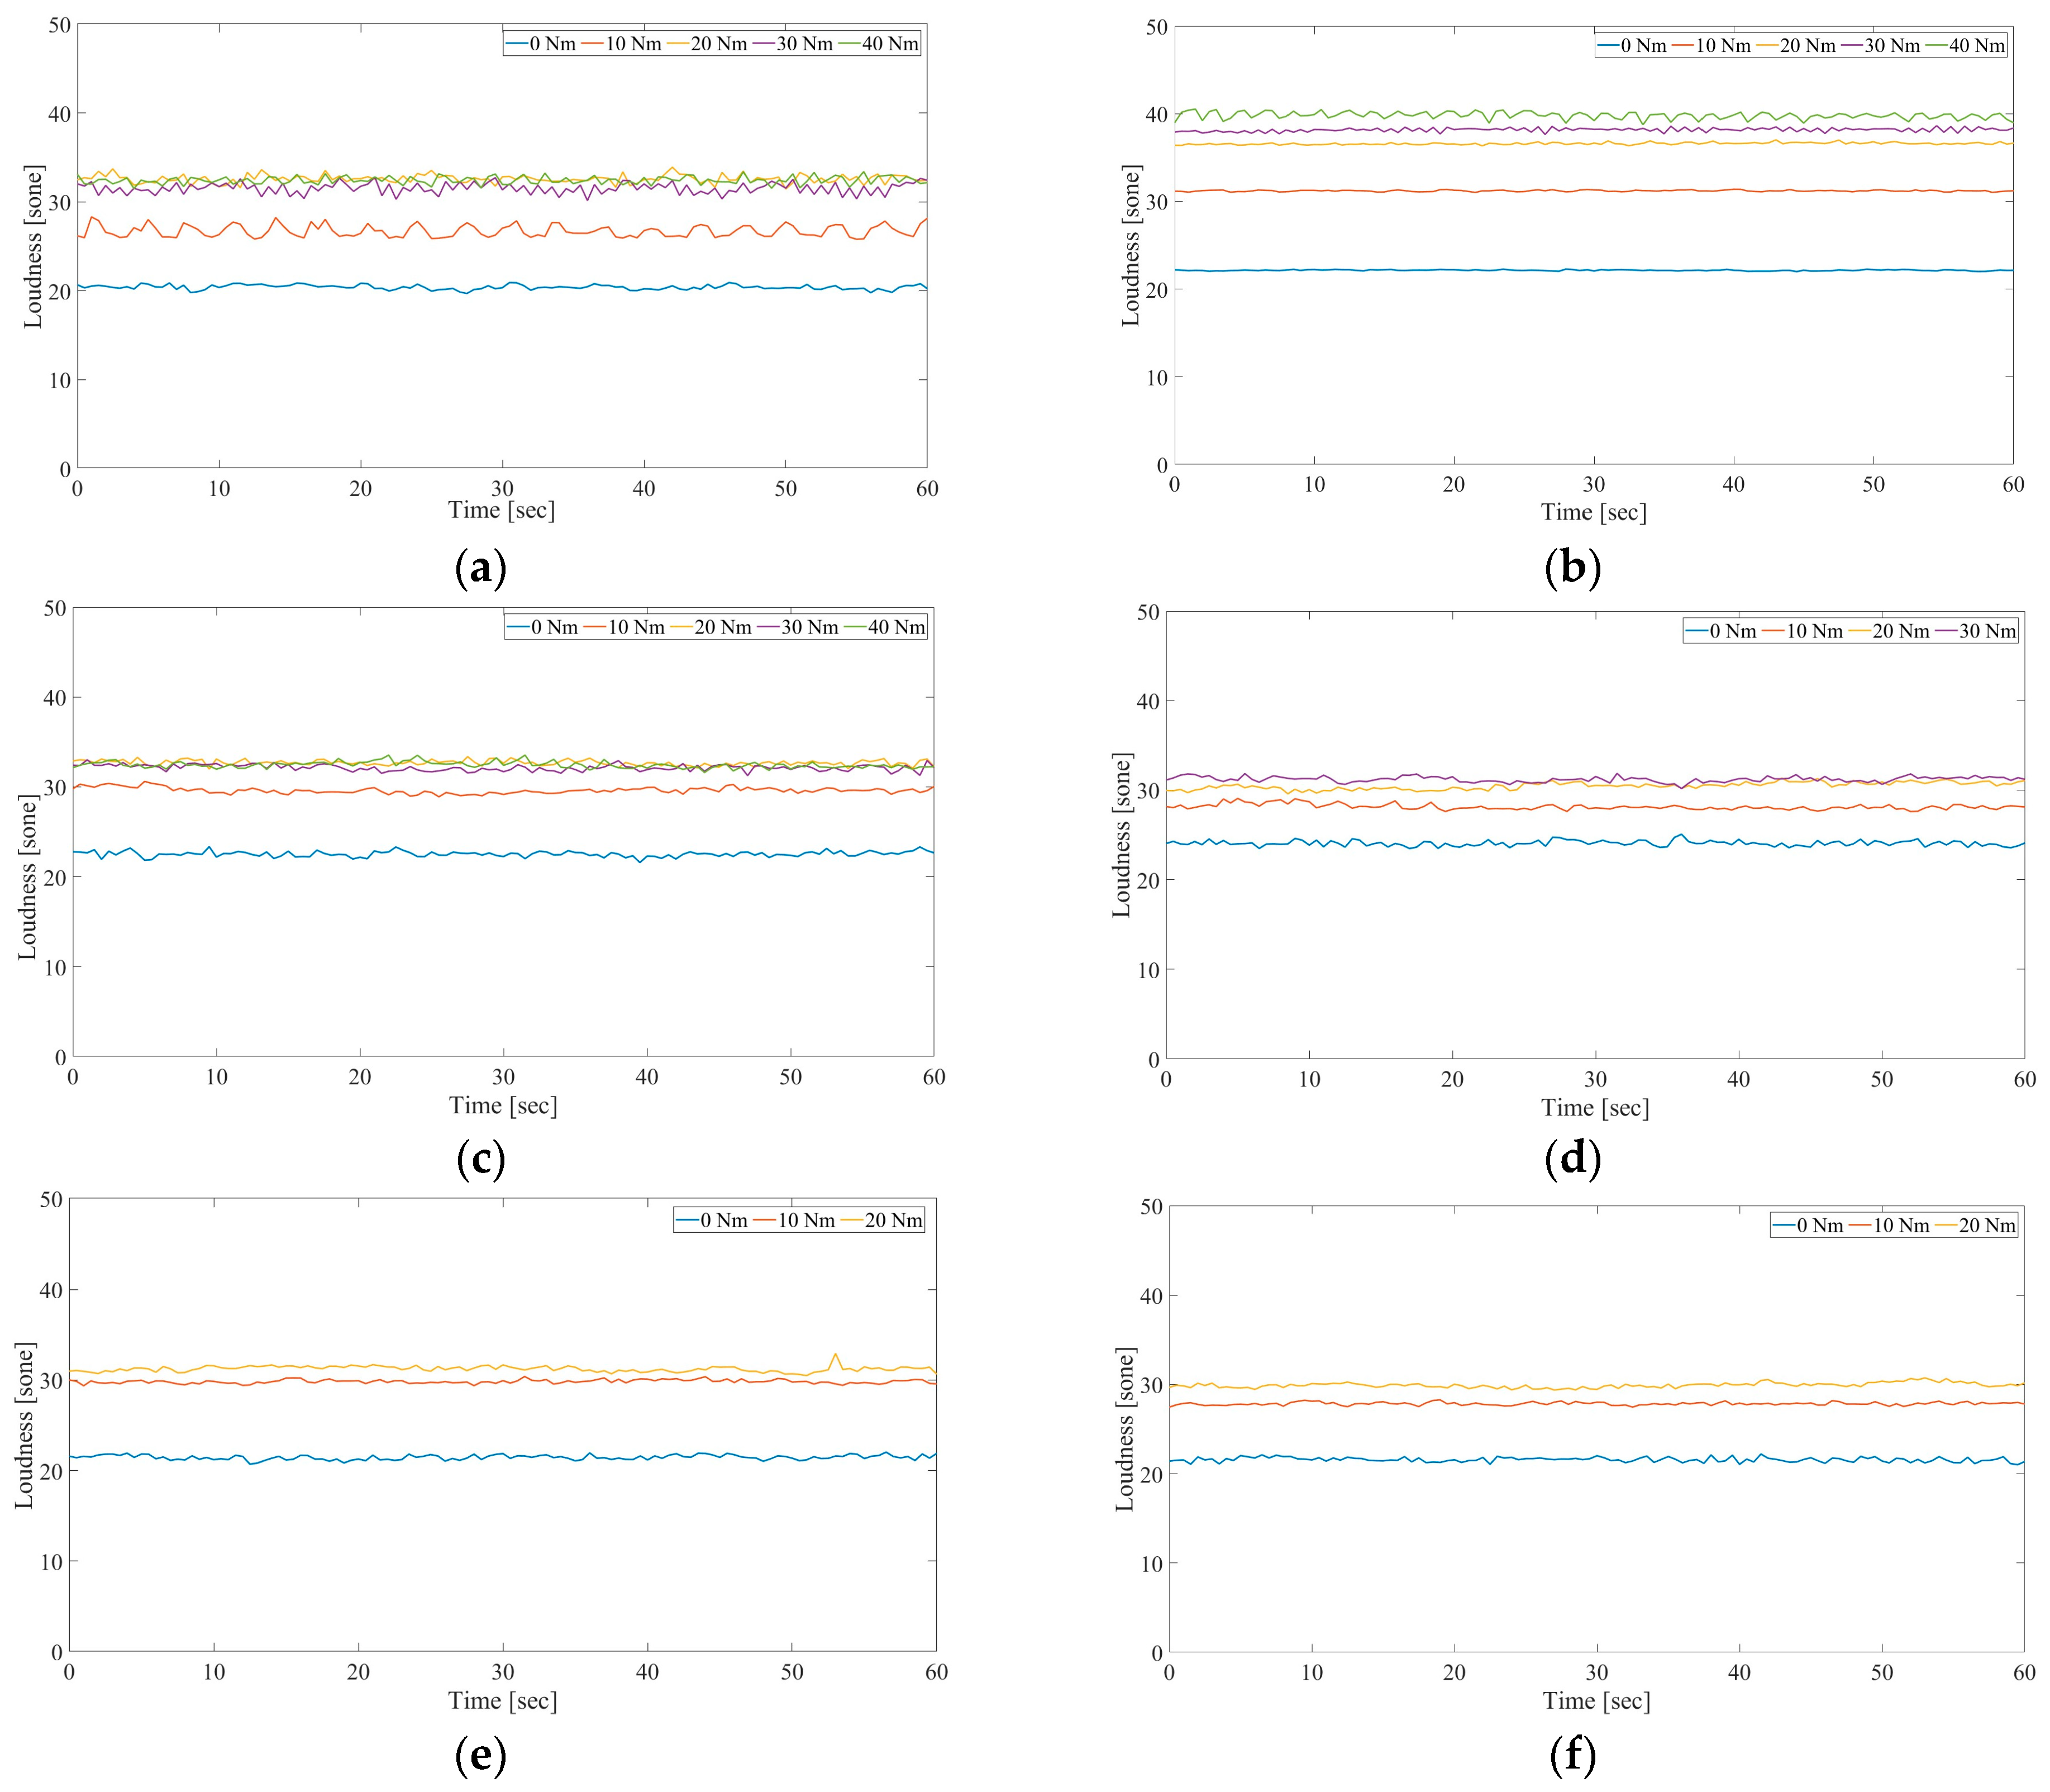
5.2. Loudness
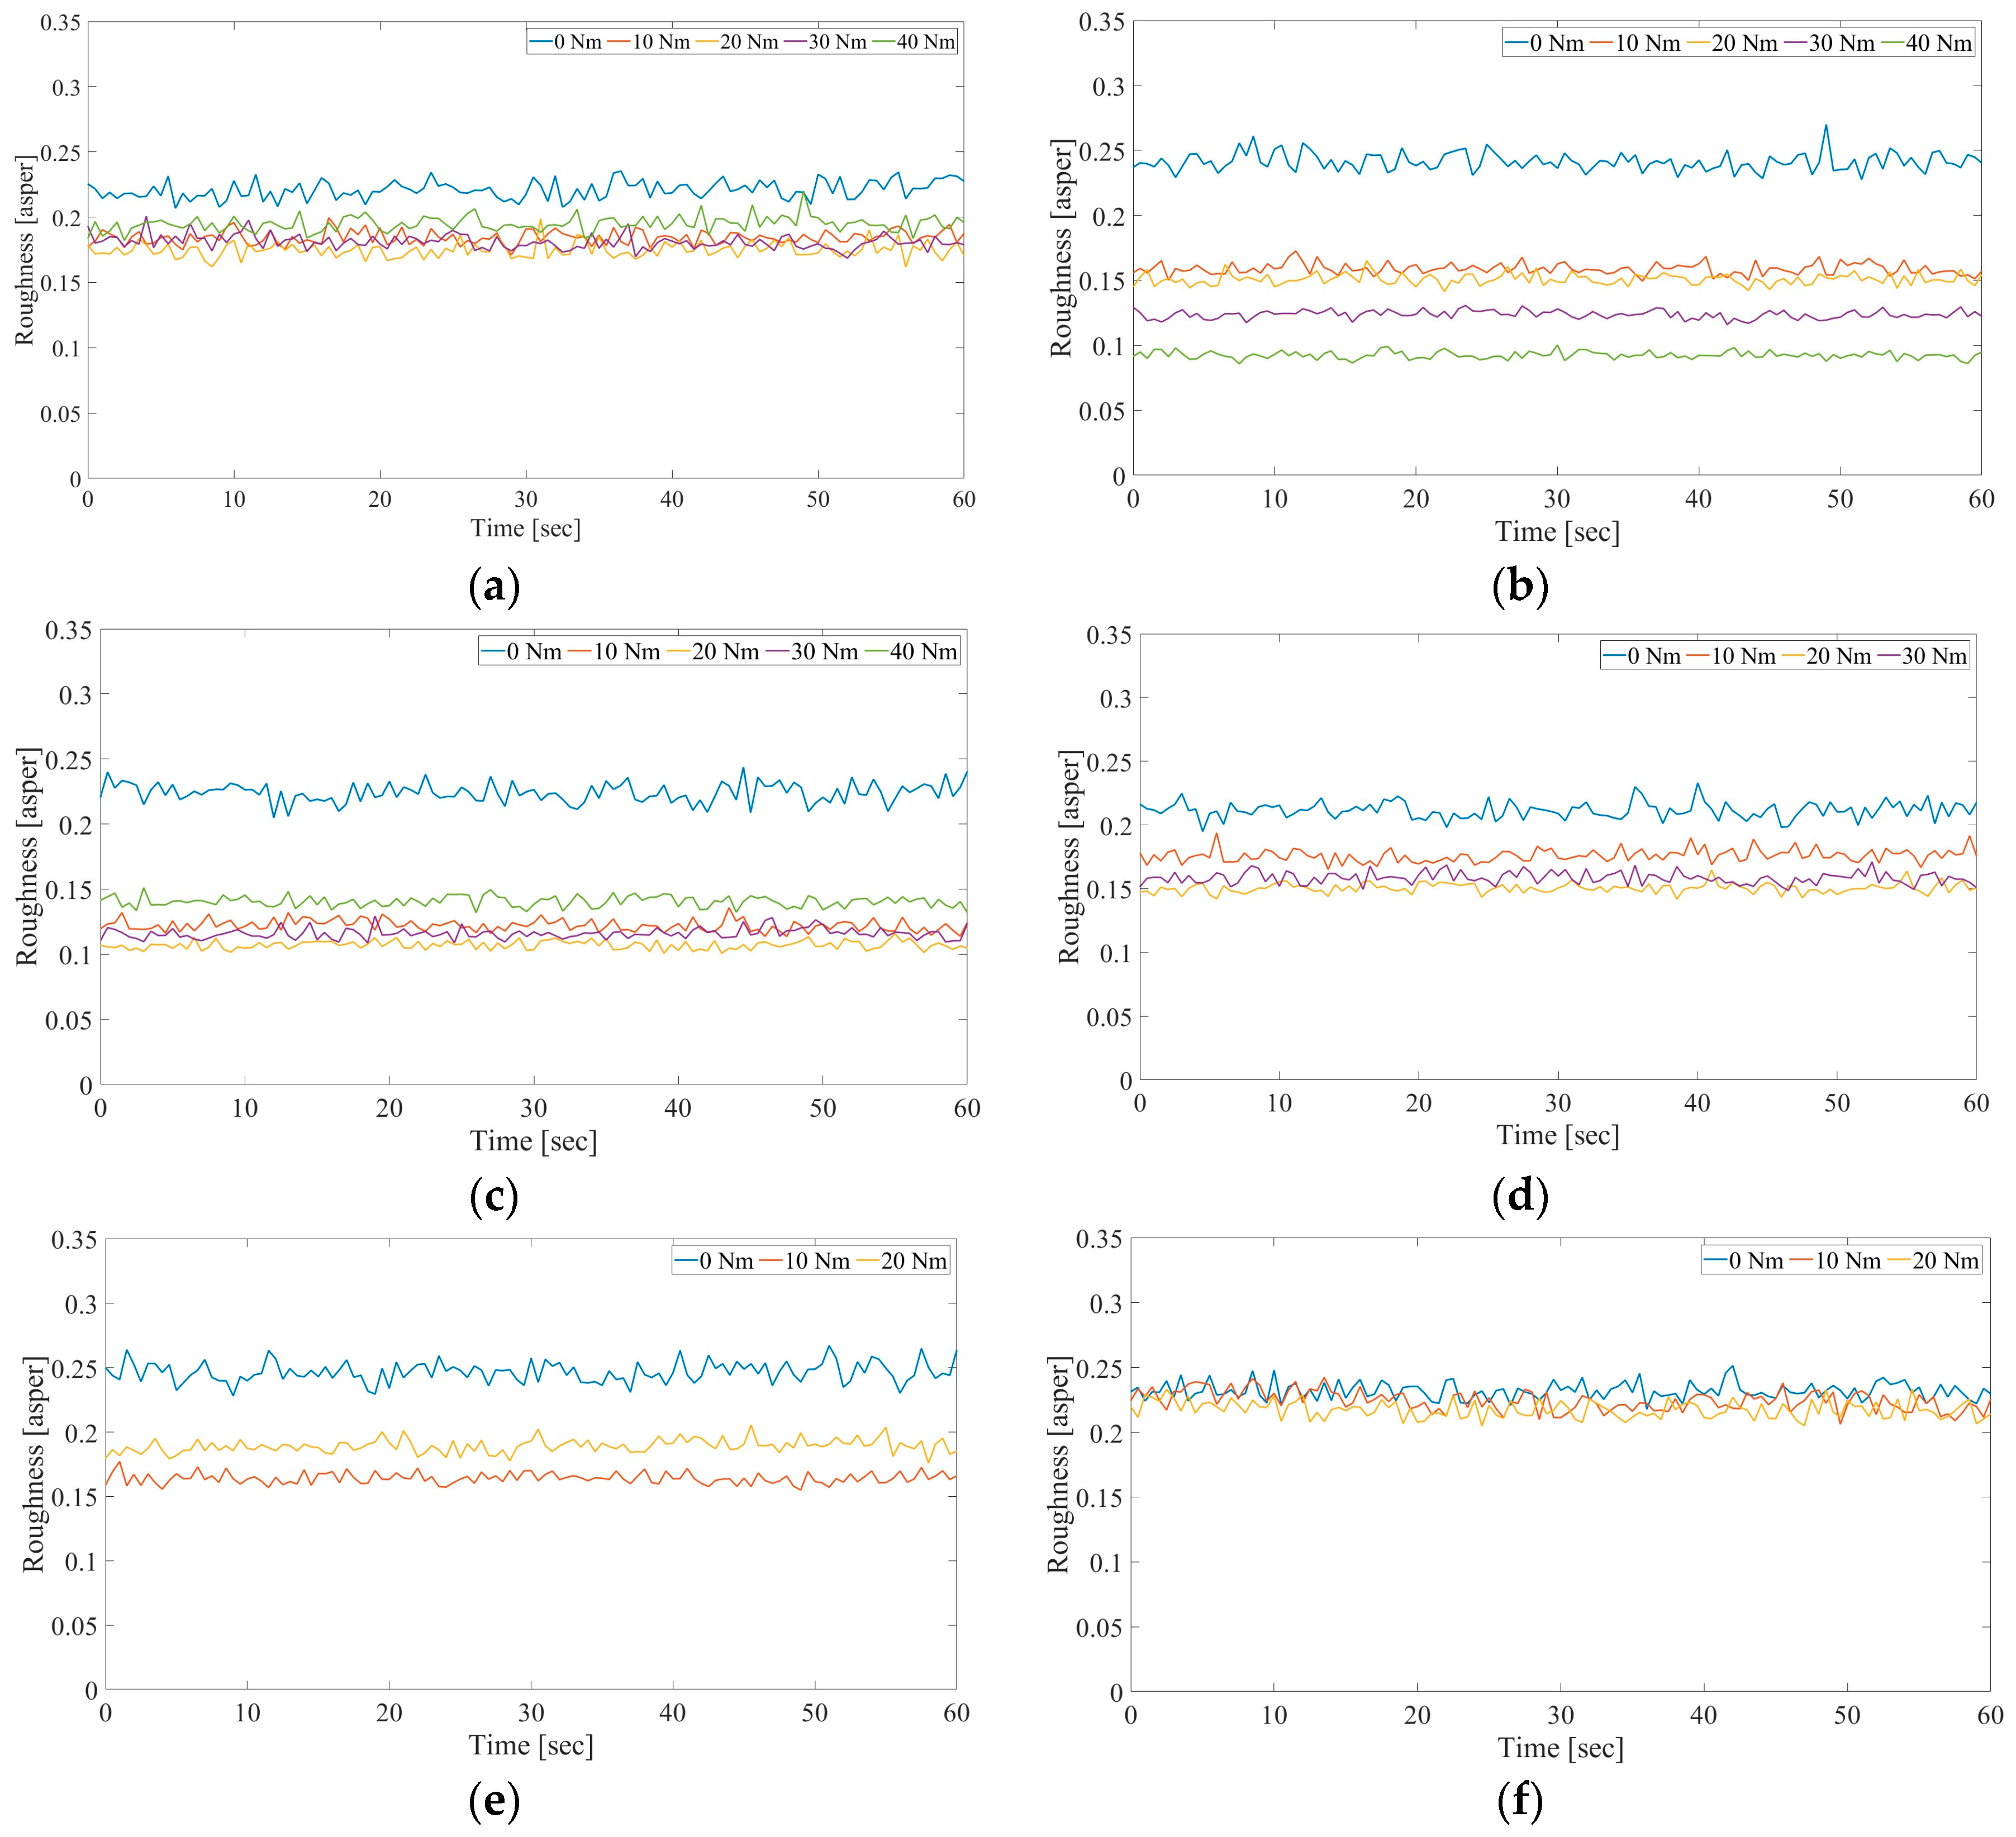
5.3. Roughness
6. Conclusions
Author Contributions
Funding
Data Availability Statement
Acknowledgments
Conflicts of Interest
References
- Masoumi, M.; Bilgin, B. Comparative study on the radial force and acoustic noise harmonics of an interior permanent magnet, induction, and switched reluctance motor drive. IEEE Access 2024, 12, 49937–49946. [Google Scholar] [CrossRef]
- Rahmani, M.; Darabi, A.; Deylami, F.P. Impact of the stator coil pitch on acoustic noise and vibration of squirrel cage induction motors. IEEE Trans. Energy Convers. 2023, 38, 2344–2352. [Google Scholar] [CrossRef]
- Masoumi, M.; Tsao, A.; Abeyrathne, C.; Sahu, A.; Bilgin, B. Investigation of the impact of rotor shaping on the torque and radial force harmonics of a V-shape interior permanent magnet synchronous machine. IET Electr. Power Appl. 2024, 18, 185–194. [Google Scholar] [CrossRef]
- Liang, J.; Howey, B.; Bilgin, B.; Emadi, A. Source of acoustic noise in a 12/16 external-rotor switched reluctance motor: Stator tangential vibration and rotor radial vibration. IEEE Open J. Ind. Appl. 2020, 1, 63–73. [Google Scholar] [CrossRef]
- Ibrahim, I.; Rahman, T.; Lowther, D.A. A study of vibroacoustic performance of synchronous motor drives under different operating conditions. In Proceedings of the International Electric Machines & Drives Conference (IEMDC), Hartford, CT, USA, 16–19 May 2021; pp. 1–9. [Google Scholar]
- Gonzalez, P.; Buigues, G.; Mazon, A.J. Noise in electric motors: A comprehensive review. Energies 2023, 16, 5311. [Google Scholar] [CrossRef]
- Zhu, M.; Hu, W.; Kar, N.C. Acoustic noise-based uniform permanent-magnet demagnetization detection in SPMSM for high-performance PMSM drive. IEEE Trans. Transport. Electr. 2018, 4, 303–313. [Google Scholar] [CrossRef]
- Qian, Z.; Qi, L.; Li, G.; Deng, W.; Sun, Z.; Chen, Q. Analysis of vibration and noise in electric drive system under resolver and motor rotor coupling eccentricity. IEEE Trans. Transport. Electr. 2024, 10, 1827–1836. [Google Scholar] [CrossRef]
- Fang, Y.; Zhang, T. Sound quality of the acoustic noise radiated by PWM-fed electric powertrain. IEEE Trans. Ind. Electron. 2018, 65, 4534–4541. [Google Scholar] [CrossRef]
- Andersson, A.; Lennström, D.; Nykänen, A. Influence of inverter modulation strategy on electric drive efficiency and perceived sound quality. IEEE Trans. Transp. Electrific. 2016, 2, 24–35. [Google Scholar] [CrossRef]
- Pindoriya, R.M.; Thakur, R.K.; Rajpurohit, B.S.; Kumar, R. Numerical and experimental analysis of torsional vibration and acoustic noise of PMSM coupled with DC generator. IEEE Trans. Ind. Electron. 2022, 69, 3345–3356. [Google Scholar] [CrossRef]
- Imakawa, T.; Chimata, K.; Hoshi, N.; Chiba, A.; Takemoto, M.; Ogasawara, S. Characteristic measurements of switched reluctance motor on prototype electric vehicle. In Proceedings of the IEEE International Electric Vehicle Conference, Greenville, SC, USA, 4–8 March 2012. [Google Scholar]
- Furqani, J.; Wiguna, C.A.; Chiba, A.; Gundogmus, O.; Sozer, Y.; Purwadi, A. Experimental verification of acoustic noise and radial force sum variation in switched reluctance motor. IEEE Trans. Ind. Appl. 2021, 57, 2481–2493. [Google Scholar] [CrossRef]
- Wiguna, C.A.; Cai, Y.; Lilian, L.L.S.S.; Furqani, J.; Fujii, Y.; Kiyota, K.; Chiba, A. Vibration and acoustic noise reduction in switched reluctance motor by selective radial force harmonics reduction. IEEE Open J. Ind. Appl. 2022, 4, 23–34. [Google Scholar] [CrossRef]
- Feng, S.; Qu, R. Noise and vibration analysis of integrated two-speed e-powertrain system for electric vehicles. IEEE Trans. Ind. Appl. 2024, 60, 57–67. [Google Scholar] [CrossRef]
- Liang, J.; Li, Y.; Mak, C.; Bilgin, B.; Al-Ani, D.; Emadi, A. A comprehensive analysis of the acoustic noise in an interior permanent magnet traction motor. In Proceedings of the Energy Conversion Congress and Exposition (ECCE), Baltimore, MD, USA, 29 September–3 October 2019. [Google Scholar]
- DEWESoft. Sound Power Measurement. Available online: https://dewesoft.com/applications/sound-power/ (accessed on 14 March 2025).
- SIEMENS Community. Sound Intensity. Available online: https://community.sw.siemens.com/s/article/Sound-Intensity (accessed on 14 March 2025).
- Sound Pressure, Sound Power, and Sound Intensity: What’s the Difference? Available online: https://community.sw.siemens.com/s/article/sound-pressure-sound-power-and-sound-intensity-what-s-the-difference/ (accessed on 14 March 2025).
- ISO 9614-1:1993; Acoustics—Determination of Sound Power Levels of Noise Sources Using Sound Intensity—Part 1: Measurement at Discrete Points. ISO: Geneva, Switzerland, 1993.
- ISO 9614-2:1996; Acoustics—Determination of Sound Power Levels of Noise Sources Using Sound Intensity—Part 2: Measurement by Scanning. ISO: Geneva, Switzerland, 1996.
- SIEMENS Community. Simcenter Testlab: Measuring Sound Intensity. Available online: https://community.sw.siemens.com/s/article/Simcenter-Testlab-Measuring-Sound-Intensity/ (accessed on 14 March 2025).
- SIEMENS Community. Sharpness in Simcenter Testlab. Available online: https://community.sw.siemens.com/s/article/Sharpness-in-Simcenter-Testlab/ (accessed on 14 March 2025).
- Kaczmarek, T.; Hafke, H.; Preis, A.; Sandrock, S.; Griefahn, B.; Gjestland, T. The Tram Bonus. Arch. Acoust. 2006, 31, 405–412. [Google Scholar]
- SIEMENS Community. Sound Quality Metrics: Loudness and Sones. Available online: https://community.sw.siemens.com/s/article/sound-quality-metrics-loudness-and-sones (accessed on 14 March 2025).
- SIEMENS Community. Sound Modulation Metrics: Fluctuation Strength and Roughness. Available online: https://community.sw.siemens.com/s/article/sound-modulation-metrics-fluctuation-strength-and-roughness/ (accessed on 14 March 2025).


| Instrument | Manufacturer | Model |
|---|---|---|
| Data acquisition device | Siemens | SCADAS Mobile |
| Microphone | GRAS | 40BI-S1 |
| Preamplifier | GRAS | 26 CB SET |
| Speed [rpm] | 600 | 600 | 600 | 600 | 600 | 900 | 900 | 900 | 900 | 900 | 1200 | 1200 | 1200 |
| Torque [Nm] | 0 | 10 | 20 | 30 | 40 | 0 | 10 | 20 | 30 | 40 | 0 | 10 | 20 |
| Current reference [A] | 0 | 87 | 125 | 150 | 175 | 0 | 95 | 135 | 163 | 190 | 0 | 105 | 147 |
| Speed [rpm] | 1200 | 1200 | 1500 | 1500 | 1500 | 1500 | 1800 | 1800 | 1800 | 2100 | 2100 | 2100 | -- |
| Torque [Nm] | 30 | 40 | 0 | 10 | 20 | 30 | 0 | 10 | 20 | 0 | 10 | 20 | -- |
| Current reference [A] | 175 | 205 | 0 | 110 | 155 | 195 | 0 | 120 | 170 | 0 | 125 | 200 | -- |
| Torque [Nm] | ||||||
|---|---|---|---|---|---|---|
| 0 | 10 | 20 | 30 | 40 | ||
| Speed [rpm] | 600 | 2.32 | 2.70 | 2.82 | 2.72 | 2.54 |
| 900 | 2.37 | 2.63 | 2.62 | 2.17 | 1.98 | |
| 1200 | 2.37 | 2.48 | 2.51 | 2.52 | 2.34 | |
| 1500 | 2.28 | 2.50 | 2.42 | 2.34 | -- | |
| 1800 | 2.06 | 2.41 | 2.43 | -- | -- | |
| 2100 | 2.11 | 2.41 | 2.44 | -- | -- | |
| Torque [Nm] | ||||||
|---|---|---|---|---|---|---|
| 0 | 10 | 20 | 30 | 40 | ||
| Speed [rpm] | 600 | 20.40 | 26.71 | 32.59 | 31.54 | 32.42 |
| 900 | 22.15 | 31.20 | 36.54 | 38.08 | 39.90 | |
| 1200 | 22.54 | 29.61 | 33.70 | 32.14 | 32.45 | |
| 1500 | 24.05 | 28.13 | 30.48 | 31.20 | -- | |
| 1800 | 21.46 | 29.83 | 31.23 | -- | -- | |
| 2100 | 21.58 | 27.85 | 29.93 | -- | -- | |
| Torque [Nm] | ||||||
|---|---|---|---|---|---|---|
| 0 | 10 | 20 | 30 | 40 | ||
| Speed [rpm] | 600 | 0.219 | 0.184 | 0.174 | 0.183 | 0.193 |
| 900 | 0.242 | 0.159 | 0.151 | 0.124 | 0.093 | |
| 1200 | 0.225 | 0.123 | 0.107 | 0.115 | 0.141 | |
| 1500 | 0.212 | 0.175 | 0.150 | 0.158 | -- | |
| 1800 | 0.246 | 0.164 | 0.188 | -- | -- | |
| 2100 | 0.232 | 0.228 | 0.219 | -- | -- | |
Disclaimer/Publisher’s Note: The statements, opinions and data contained in all publications are solely those of the individual author(s) and contributor(s) and not of MDPI and/or the editor(s). MDPI and/or the editor(s) disclaim responsibility for any injury to people or property resulting from any ideas, methods, instructions or products referred to in the content. |
© 2025 by the authors. Licensee MDPI, Basel, Switzerland. This article is an open access article distributed under the terms and conditions of the Creative Commons Attribution (CC BY) license (https://creativecommons.org/licenses/by/4.0/).
Share and Cite
Masoumi, M.; Bilgin, B. Acoustic Noise Characterization of a Switched Reluctance Motor Using Sound Power and Psychoacoustic Metric Measurements. Acoustics 2025, 7, 41. https://doi.org/10.3390/acoustics7030041
Masoumi M, Bilgin B. Acoustic Noise Characterization of a Switched Reluctance Motor Using Sound Power and Psychoacoustic Metric Measurements. Acoustics. 2025; 7(3):41. https://doi.org/10.3390/acoustics7030041
Chicago/Turabian StyleMasoumi, Moien, and Berker Bilgin. 2025. "Acoustic Noise Characterization of a Switched Reluctance Motor Using Sound Power and Psychoacoustic Metric Measurements" Acoustics 7, no. 3: 41. https://doi.org/10.3390/acoustics7030041
APA StyleMasoumi, M., & Bilgin, B. (2025). Acoustic Noise Characterization of a Switched Reluctance Motor Using Sound Power and Psychoacoustic Metric Measurements. Acoustics, 7(3), 41. https://doi.org/10.3390/acoustics7030041