Article

Improving the Acoustics of the Church of Saints Marcellino and Pietro in Cremona (Italy) for Musical Performances

by
Sofia Parrinelli
1,
Riccardo Giampiccolo
1,*,
Angelo Giuseppe Landi
2 and
Fabio Antonacci
1
1
Dipartimento di Elettronica, Informazione e Bioingegneria, Politecnico di Milano, Via Ponzio 34/5, 20133 Milan, Italy
2
Dipartimento di Architettura e Studi Urbani, Politecnico di Milano, Via Bonardi 3, 20133 Milan, Italy
*
Author to whom correspondence should be addressed.
Acoustics 2025, 7(3), 42; https://doi.org/10.3390/acoustics7030042
Submission received: 7 May 2025 / Revised: 16 June 2025 / Accepted: 30 June 2025 / Published: 8 July 2025

Abstract

Churches are spaces designed with a unique acoustic identity, which is intimately connected to the oratory and musical needs of the historical period in which they were built. For instance, their typically long reverberation time is appropriate to specific uses, such as liturgical functions and choral music performances, but it may impair the repurposing of the space for other functions. Indeed, an acoustic environment suitable for choral or sacred music may not be compatible with other musical genres such as chamber music, solo performances, or small instrumental ensembles, which require greater clarity and frequency-balanced acoustic properties. In such cases, careful analysis of the environment and specific acoustic conditioning become essential steps to enable the space to be used for novel purposes, without compromising its artistic and historical integrity. In this work, we analyze and improve the acoustics of the church of Saints Marcellino and Pietro through space-time acoustic measurements and simulations. After developing and validating our model, we propose various solutions to optimize the church acoustics, transforming it into a functional concert hall while preserving its original identity and artistic grandeur.

1. Introduction

Throughout history, church floor plans and their architectural elements have evolved in ways that significantly influenced their acoustic properties [1]. Early Christian basilicas, with their flat ceilings, elevated presbyteries, and slender but closely spaced columns, generate effective direct sound propagation and early reflections, resulting in good speech intelligibility and sound diffusivity [1]. However, as churches grew in size and complexity, particularly during the Romanesque and Gothic periods, architectural changes such as taller vaults, larger support columns, and lower presbyteries created greater distances between the sound source (in the altar zone) and the congregation. This often led to acoustic inconsistencies and zones affected by poor sound coverage. The introduction of the transept, brought about by latin cross layout, further disrupted sound distribution by increasing the separation between spaces and generating shadow zones where the acoustic quality diminished significantly. To counteract these issues, areas from which sound may originate, such as the altar, pulpit, organ, and choir, were centralized within the nave. During the Renaissance and Baroque periods, central plan churches such as those with Greek cross emerged [2]. These layouts performed better acoustically when the sound source was placed at the intersection of the arms, allowing for more uniform sound diffusion. Nevertheless, in larger centralized churches, the considerable distance between the altar and the congregation sometimes compromised intelligibility, especially when not compensated by adequate ceiling reflections [1]. Following the Council of Trento (1545–1563), the Catholic Church initiated a reform that deeply influenced the ecclesiastical architecture [3,4]. In particular, the Jesuits became key players in promoting a new idea of church structure, aligned with the pedagogical and liturgical requirements of the Counter-Reformation [5]. Jesuit churches typically present a single nave with side chapels, a prominent altar, and a clear longitudinal axis, all designed to enhance the liturgical message and to focus the attention of the congregation [6]. For instance, the church of the Jesus in Rome, designed by Giacomo Barozzi da Vignola and later completed by Giacomo Della Porta in the late 16th century, stands as the architectural prototype embodying the principles of the Counter-Reformation [7]. The cited church has a single large central nave and shallow lateral chapels, thus focusing the congregation’s attention on the main altar. In the Baroque period, these structural principles evolved into more elaborate proposals, such as domes, elliptical plans, and ornate surfaces, shaping the acoustic features of Catholic sacred spaces. The churches of the Baroque period certainly exhibit long reverberation times due to their large volume, high ceilings, and reflective materials such as marble and stone employed in the construction. These spaces can also feature numerous elements, such as wooden altars, textiles, and richly decorated surfaces that help to scatter the sound. In fact, from an acoustic point of view, particularly regarding high frequency range, the increase of ornamentation in Baroque churches, over their Renaissance predecessors, leads to an acoustics improvement. As observed by J. J. Sendra, M. Galindo, A. L. León-Rodríguez, and J. León [8], architectural elements such as mouldings, pilasters, entablatures, cornices, capitals, and elaborate wooden altarpieces significantly enhance the diffusion of sound in the high frequency range. At the same time, the presence of side chapels and recesses contributes to the broader diffusion of low frequencies.
Several scientific studies have investigated the acoustic characteristics of churches, offering valuable insights into how architectural choices led to specific acoustic features [9,10,11]. These works analyze parameters such as reverberation time, musical clarity, and definition, which are crucial for evaluating the suitability of a space for speech and music [12]. A notable contribution is the review by S. Girón, L. Álvarez-Morales, and T. Zamarreño, which provides a comprehensive overview of key research conducted from the mid-20th century to 2017, with a particular focus on European Christian churches [10]. Empirical studies such as those by E. Alberdi, M. Galindo, A. L. León-Rodríguez, and J. Leon [6], who analyzed 66 Baroque Catholic churches, and by E. Cirillo and F. Martellotta [13], who examined 31 churches including six from the Baroque period, highlight significant correlations between architectural features and acoustic behavior. The work by E. Cirillo and F. Martellotta in [14] demonstrates how the geometry layout affects the onset of the sound decay and influences acoustic parameters due to peculiar reflections and sound scattering. The variety of worship buildings often results in different source-receiver configuration choices employed in acoustic measurement campaigns, which can make the results difficult to compare. Therefore, standardized protocols have been developed in order to provide common guidelines. Measurement protocols in such environments require careful and context-sensitive planning. The guidelines proposed in [15] highlight the importance of selecting appropriate source and receiver positions as well as employing reliable equipment. The use of spherical microphone arrays in acoustic measurement campaigns, as demonstrated in the comparative study by A. Dick and M. C. Vigeant [16], has proven effective in achieving a high spatial resolution for impulse response measurements. This enhanced resolution enables more detailed analysis of conventional room acoustic parameters and allows for the development of new metrics. As highlighted in [17], musical performances have been increasingly taking place in ancient religious buildings, where the acoustic environment significantly influences the perception of sound. In such settings, the spatial distribution of key acoustic parameters, the influence of architectural features, and the implementation of acoustical treatments are all critical aspects to consider. A crucial aspect in the adaptation of churches for musical performances is the acoustic interaction between their architectural volumes. In particular, the coupling between large central spaces and smaller adjacent volumes, such as domes, chapels, or transepts, plays a significant role in shaping the temporal and spatial characteristics of sound. Understanding and managing these coupled volumes is essential to control parameters such as musical clarity and reverberation. A contribution by D. D’Orazio, G. Fratoni and M. Garai [18] investigates this phenomenon, emphasizing how the interplay between connected architectural volumes can influence the overall acoustic response of ecclesiastical spaces repurposed as concert venues. A project within the church of Rispescia (Grosseto, IT) [19], involves the acoustic renovation of the space in order to convert it in an auditorium. The objective was to create an environment with high acoustic quality and flexibility, capable of fulfilling diverse uses such as musical performances, speech-based events, workshops, or exhibitions. A defining feature of the project was its commitment to environmental sustainability: all materials and systems were selected based on their ecological footprint. The initial acoustic conditions were assessed through reverberation time measurements, revealing values significantly above those recommended by UNI 11367 [20]. To develop the implementation proposals, a model of the space was developed and validated by comparing simulated and measured reverberation times; the modeling was performed using the software Ramsete 2.5. The acoustic design strategy integrated a range of solutions, such as the introduction of sound-absorbing treatment at the entrance wall using evergreen plant compositions. Suspended from the ceiling, a series of curved baffle panels helped control reflections and reduce reverberation. In addition, vertically mobile panels with dual reflective and absorbent surfaces were introduced to further manage the acoustic response of the space and allow for flexible internal configurations. Acoustic measurements conducted after the intervention demonstrated a strong improvement in acoustic performance. Another example of acoustic conditioning is the one developed for the church of Santa Maria del Carmine in Medicina (Bologna) [21] focused on transforming the site into a flexible venue for chamber music concerts and conferences. The project was characterized by the need to reconcile optimal acoustic performance with strict constraints related to heritage preservation. Consequently, strategies that employed reversible operations were adopted, keeping the building’s architectural identity. The design process combined, even in this case, in-situ measurements with simulation techniques. Reverberation times and clarity indices were measured to establish the acoustic conditions, which revealed excessive reverberation for both speech and music. These data informed a three-dimensional acoustic model, utilized in beam-tracing simulations. Key interventions included transparent plexiglass panels mounted at height to maintain visual openness while adjusting sound reflections, heavy drapes to dampen reverberation, sound-absorbing plaster on targeted surfaces, and the introduction of an orchestral shell. The results of the simulations confirmed significant improvements across all target parameters, particularly in reverberation time and spatial uniformity. Another interesting example of acoustic optimization, aimed at preserving the character of the space, was carried out in the Cathedral of Seville [22]. Managing sound distribution within this monumental church presents a significant challenge due to its vast and intricate spatial configuration, characterized by five naves. In this case, specific design choices were implemented, such as the introduction of removable curtains and various types of seating, to improve the acoustic experience while respecting the historical context. These cited examples of acoustic conditioning projects as well as many other projects [23,24], adopt methodologies closely aligned with those employed in our work and share the same emphasis on preserving the artistic and architectural integrity of the church. A comprehensive acoustic analysis of a cultural heritage site, e.g., the case of a church, can, beyond providing data of historical and anthropological relevance [9,25,26], constitute a fundamental resource for the development of models aimed at historical reconstruction [11,27] or architectural design proposals [28,29], as is the objective of the present article. Furthermore, it can provide the data for developing acoustic reconstructions intended for auralization purposes [30,31], thus enabling the virtual reconstruction of the sound scene for musical applications. These and all the other case studies confirm that the acoustic characteristics of Baroque churches are dependent on architectural structure, used materials, and spatial layout. The long reverberation time typical of these spaces reflects an aesthetic ideal that supported immersive acoustic conditions, helping the faithful to feel fully involved in the liturgical context. Understanding these historical acoustic patterns is essential for designing renovation works, especially when sacred spaces are repurposed for new functions, such as concert venues, where greater clarity, frequency balance, and general acoustic comfort must be reconciled with preservation principles.
This paper presents a study of the current acoustic characteristics of the church of Saints Marcellino and Pietro, located in Cremona (Italy), and proposes a series of acoustic redevelopment strategies aimed at adapting the space for the new function of being a concert hall, without compromising its cultural and historical value. Indeed, the work is carried out with the aim of enhancing the church’s acoustics while fully respecting both its intangible values, since it will continue to serve liturgical functions, and its tangible heritage. All proposed interventions are designed in accordance with the principles of reversibility and visual recognizability, ensuring consistency with the building’s historical context.
The church of Saints Marcellino and Pietro in Cremona, shown in Figure 1, was built between 1602 and 1620 by architect F. Laurenzi, as part of a major urban intervention by the Jesuit Order, supported by Bishop Cesare Speciano and local aristocratic families [32]. Designed to accommodate the liturgical and pedagogical reforms of the Counter-Reformation, the church follows the architectural model of a single nave in a rectangular hall with side chapels, intended to emphasize the altar and facilitate congregational focus, in line with the liturgical requirements of Trento’s council. From a volumetric standpoint, the building is defined by a large nave, forming a pseudo-latin cross with side chapels and a pseudo-transept. The spatial layout is articulated through tall vertical walls, monumental pilasters and high clerestory windows, ensuring filtered natural illumination. A prominent vault separates the nave from the timber roof. The interior space spans approximately 49 m in length, 16 m in width along the single nave, 4 m in depth for the transept and side chapels, and reaches a maximum height of 23 m at the vaulted ceiling. The total interior volume is approximately 18,000 m 3 and, based on the floor area available in the nave, the space will accommodate nearly 400 seated people. These dimensions contribute to a rich and resonant acoustic environment, traditionally suited to liturgical and choral music. The unfinished facade is articulated by fluted marble pilasters of the giant order, framing a grand central portal and a serliana-style window above. The interior features a single nave with side chapels and is richly decorated with white and gold colored stuccoes. Barrel vaults span the ceiling, enhancing the sense of verticality. Inside, the church houses remarkable works by artists such as Genovesino, Bertesi, Massarotti, Gatti, Bonisoli, and Zaist. We refer the readers who want to deepen their understanding of history and building details of the church to [32].
This work aligns with a broader initiative of restoring and repurposing the church. The initiative, supported by the Emblematici Maggiori funding program, seeks to secure financial resources for structural consolidation and restoration of the site. The Parish of Saints Giacomo and Agostino, owner of the church, the Municipality of Cremona, the Diocese of Cremona, the Amilcare Ponchielli Theatre Foundation, and Politecnico di Milano have joined the forces for the realization of this project [33,34]. This church plays a central role in Cremona’s cultural life, serving as a venue for the Monteverdi Festival, organized by Ponchielli Theatre Foundation, which is held here yearly [35]. Baroque music has thus been performed and will continue to be featured in the upcoming Monteverdi Festival season, which hosts mainly choral music and Baroque ensembles.
SS. Pietro and Marcellino’s church is actually a singular example of a Baroque religious building in Cremona. Its Baroque architecture provides a striking and artistically rich context that enhances the impact of musical events, making its acoustic revitalization both a cultural and functional priority. Figure 1 shows SS. Pietro and Marcellino’s church during preparations for the 2025 Monteverdi Festival.
As a first step of our analysis, we performed in-situ acoustic measurements to determine key parameters such as reverberation time, sound clarity, and spatial sound distribution [36]. These measurements are, indeed, fundamental to characterize the existing acoustics and assess the scope of the required improvements. Then, we have built a model of the church (in Odeon software) and we employed the acquired data to validate it such that it can be used to explore and evaluate potential acoustic interventions. Finally, we showed that through the proposed solutions it is possible to reduce the reverberation time and improving acoustic comfort, thereby making the space suitable for musical performances.
The article is structured as follows. It begins with an explanation of the methodologies in Section 2, which includes a detailed description of the acoustic measurement phase (Section 2.1) and the subsequent virtual acoustic simulation phase (Section 2.2). In Section 3, both the results of the acoustic measurements (Section 3.1) and the results of the simulation process (Section 3.2) are reported. A discussion of the results obtained is presented in Section 4, whereas conclusions are drawn in Section 4.

2. Materials and Methods

In this section, we describe the methodologies employed in our work, taking into account both the measurement campaign and the simulation phase.

2.1. Acoustic Measurement Campaign

At the outset, we conducted an acoustic measurement campaign inside the church to assess the acoustic parameters that characterize the space and extract the needed information. The data collected through this measurement process are essential for performing the subsequent validation of the simulation model described in Section 2.2.
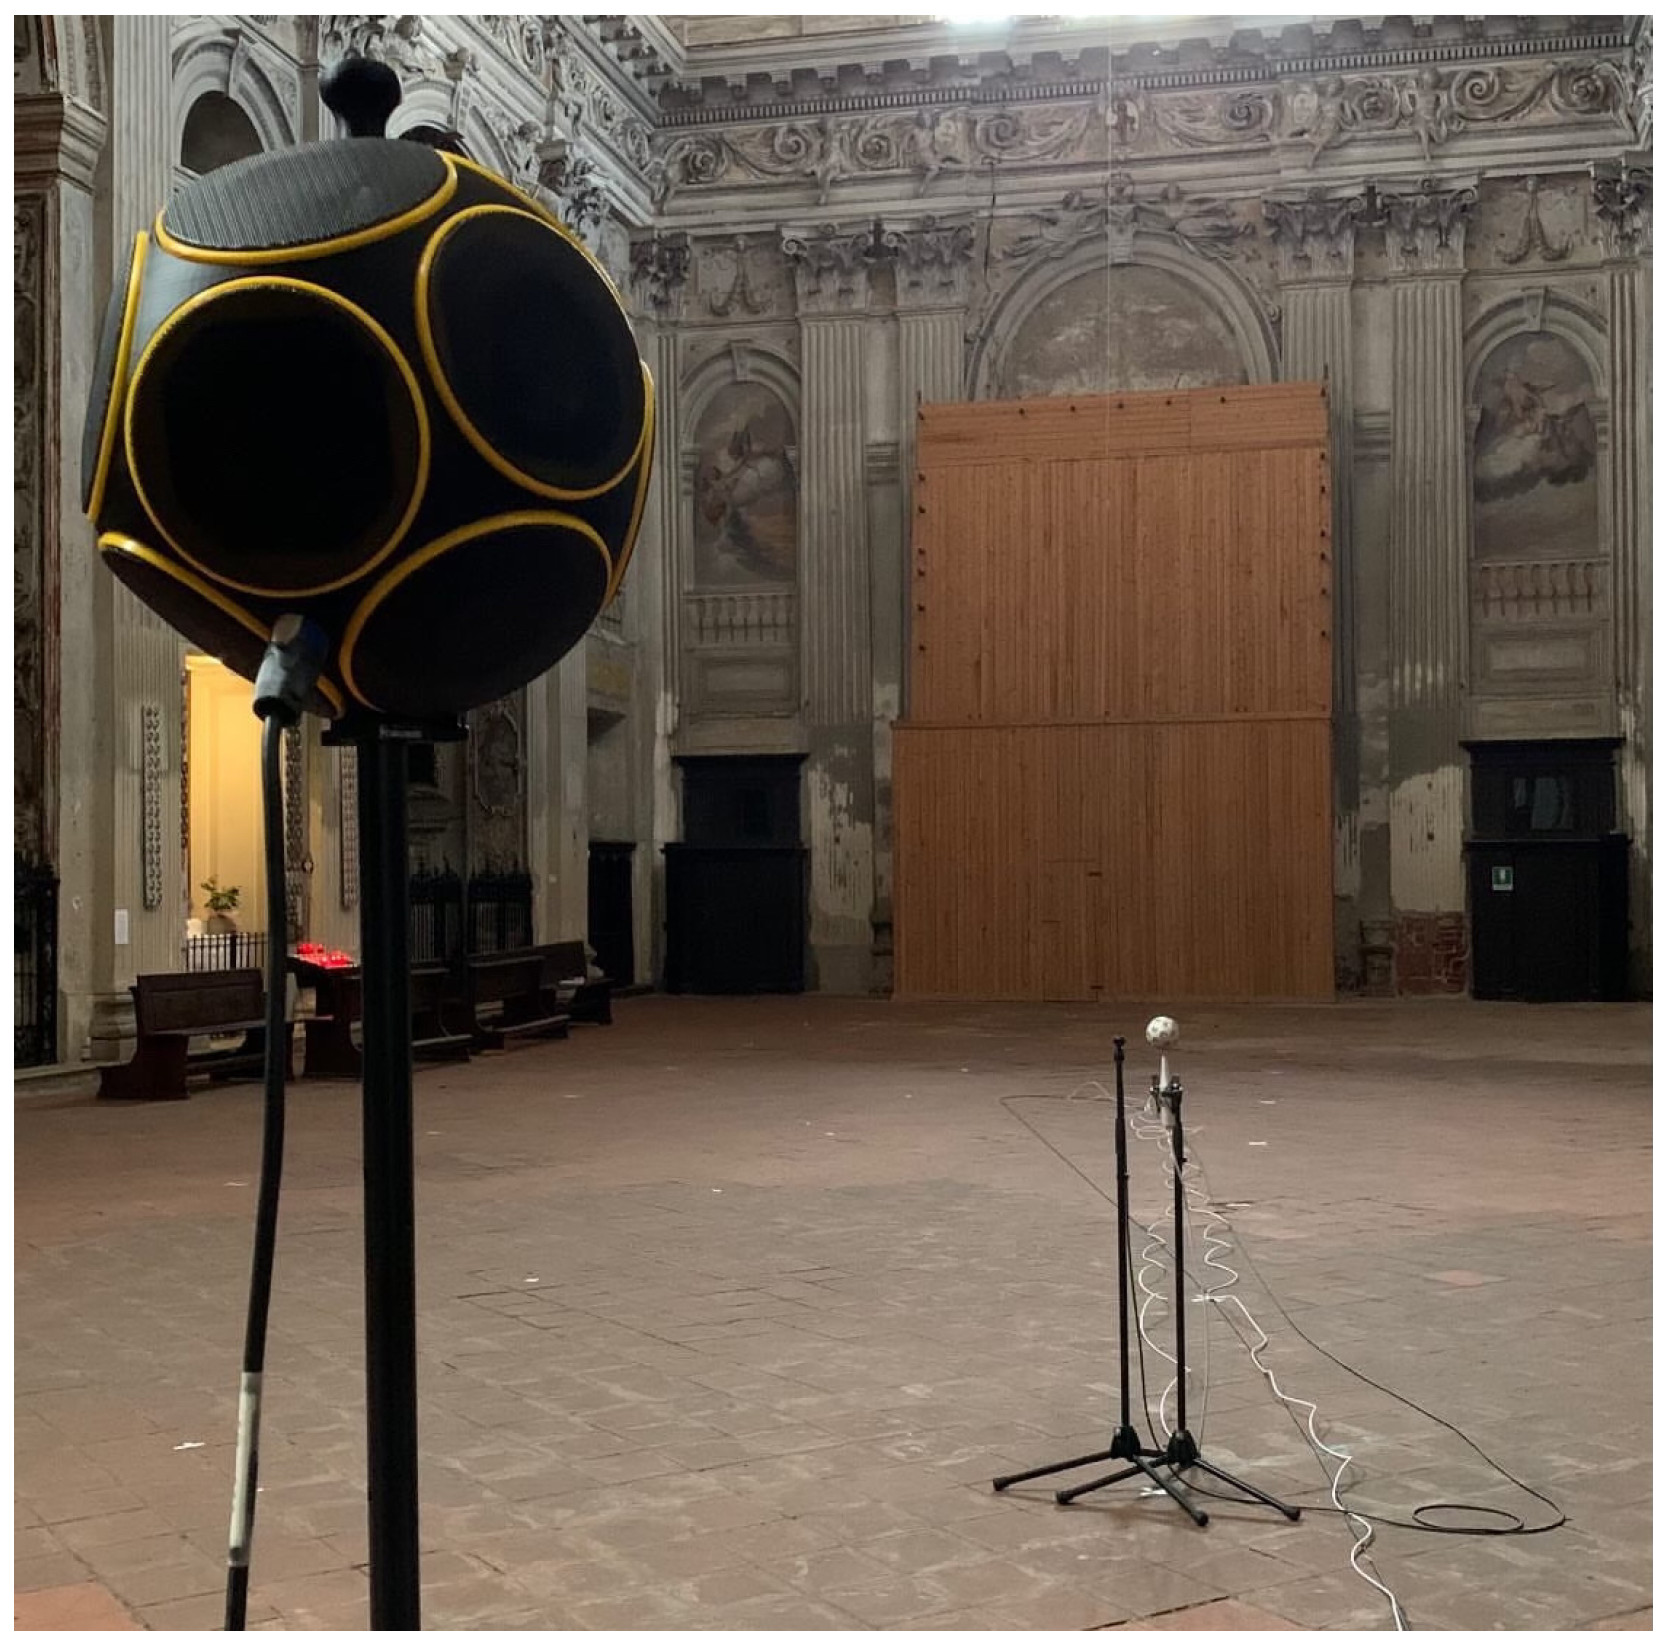
The measurements are carried out using a spherical microphone array, which provides detailed information on sound directivity and on the spatial characteristics of the acoustic of the environment. Additionally, an omnidirectional microphone is employed to extract general acoustic parameters, as illustrated in Figure 2. All measurements are conducted in accordance with the ISO 3382-1 standard [37].
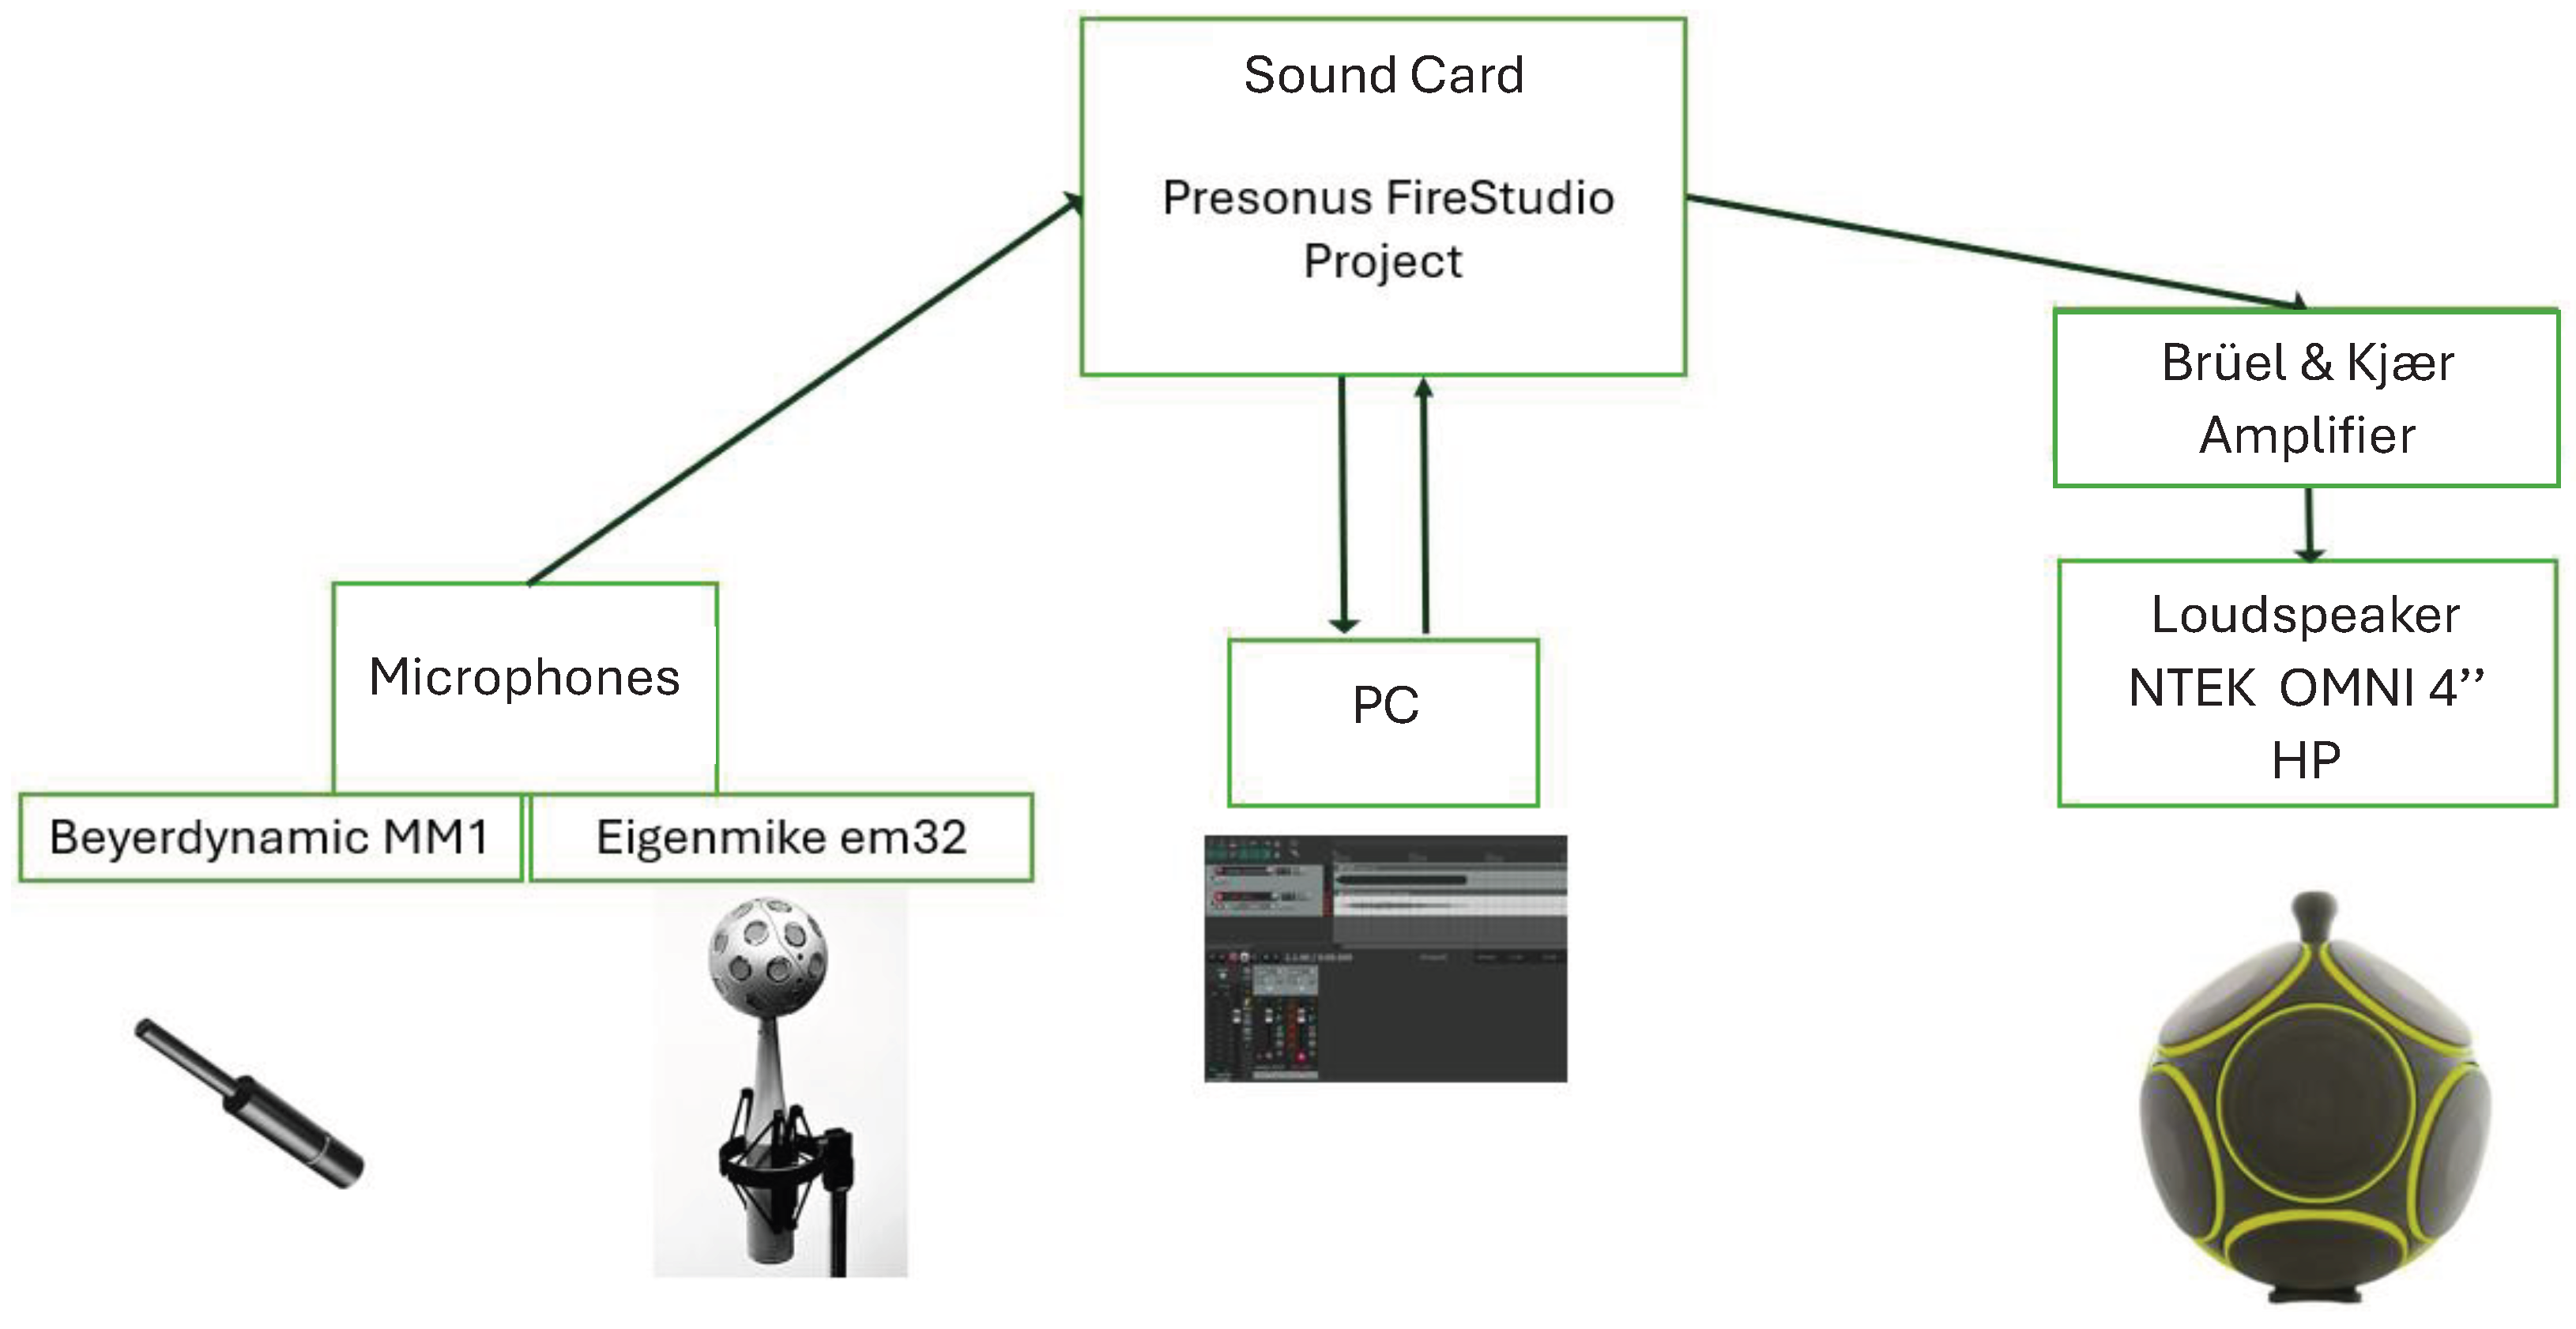
The church interior is acoustically excited using the NTEK OMNI 4” HP dodecahedral omnidirectional sound source, connected to a Brüel & Kjær 2176 amplifier via a Presonus FireStudio Project audio interface. For spatial recordings, the Eigenmike em32 spherical microphone array by MH Acoustics is used, while the Beyerdynamic MM 1 serves as omnidirectional microphone. Both microphones are connected to a PC through the Presonus audio interface. The audio signals are generated and recorded using Reaper, a Digital Audio Workstation, which enables efficient management of both playback and recording. Figure 3 shows the measurement setup.
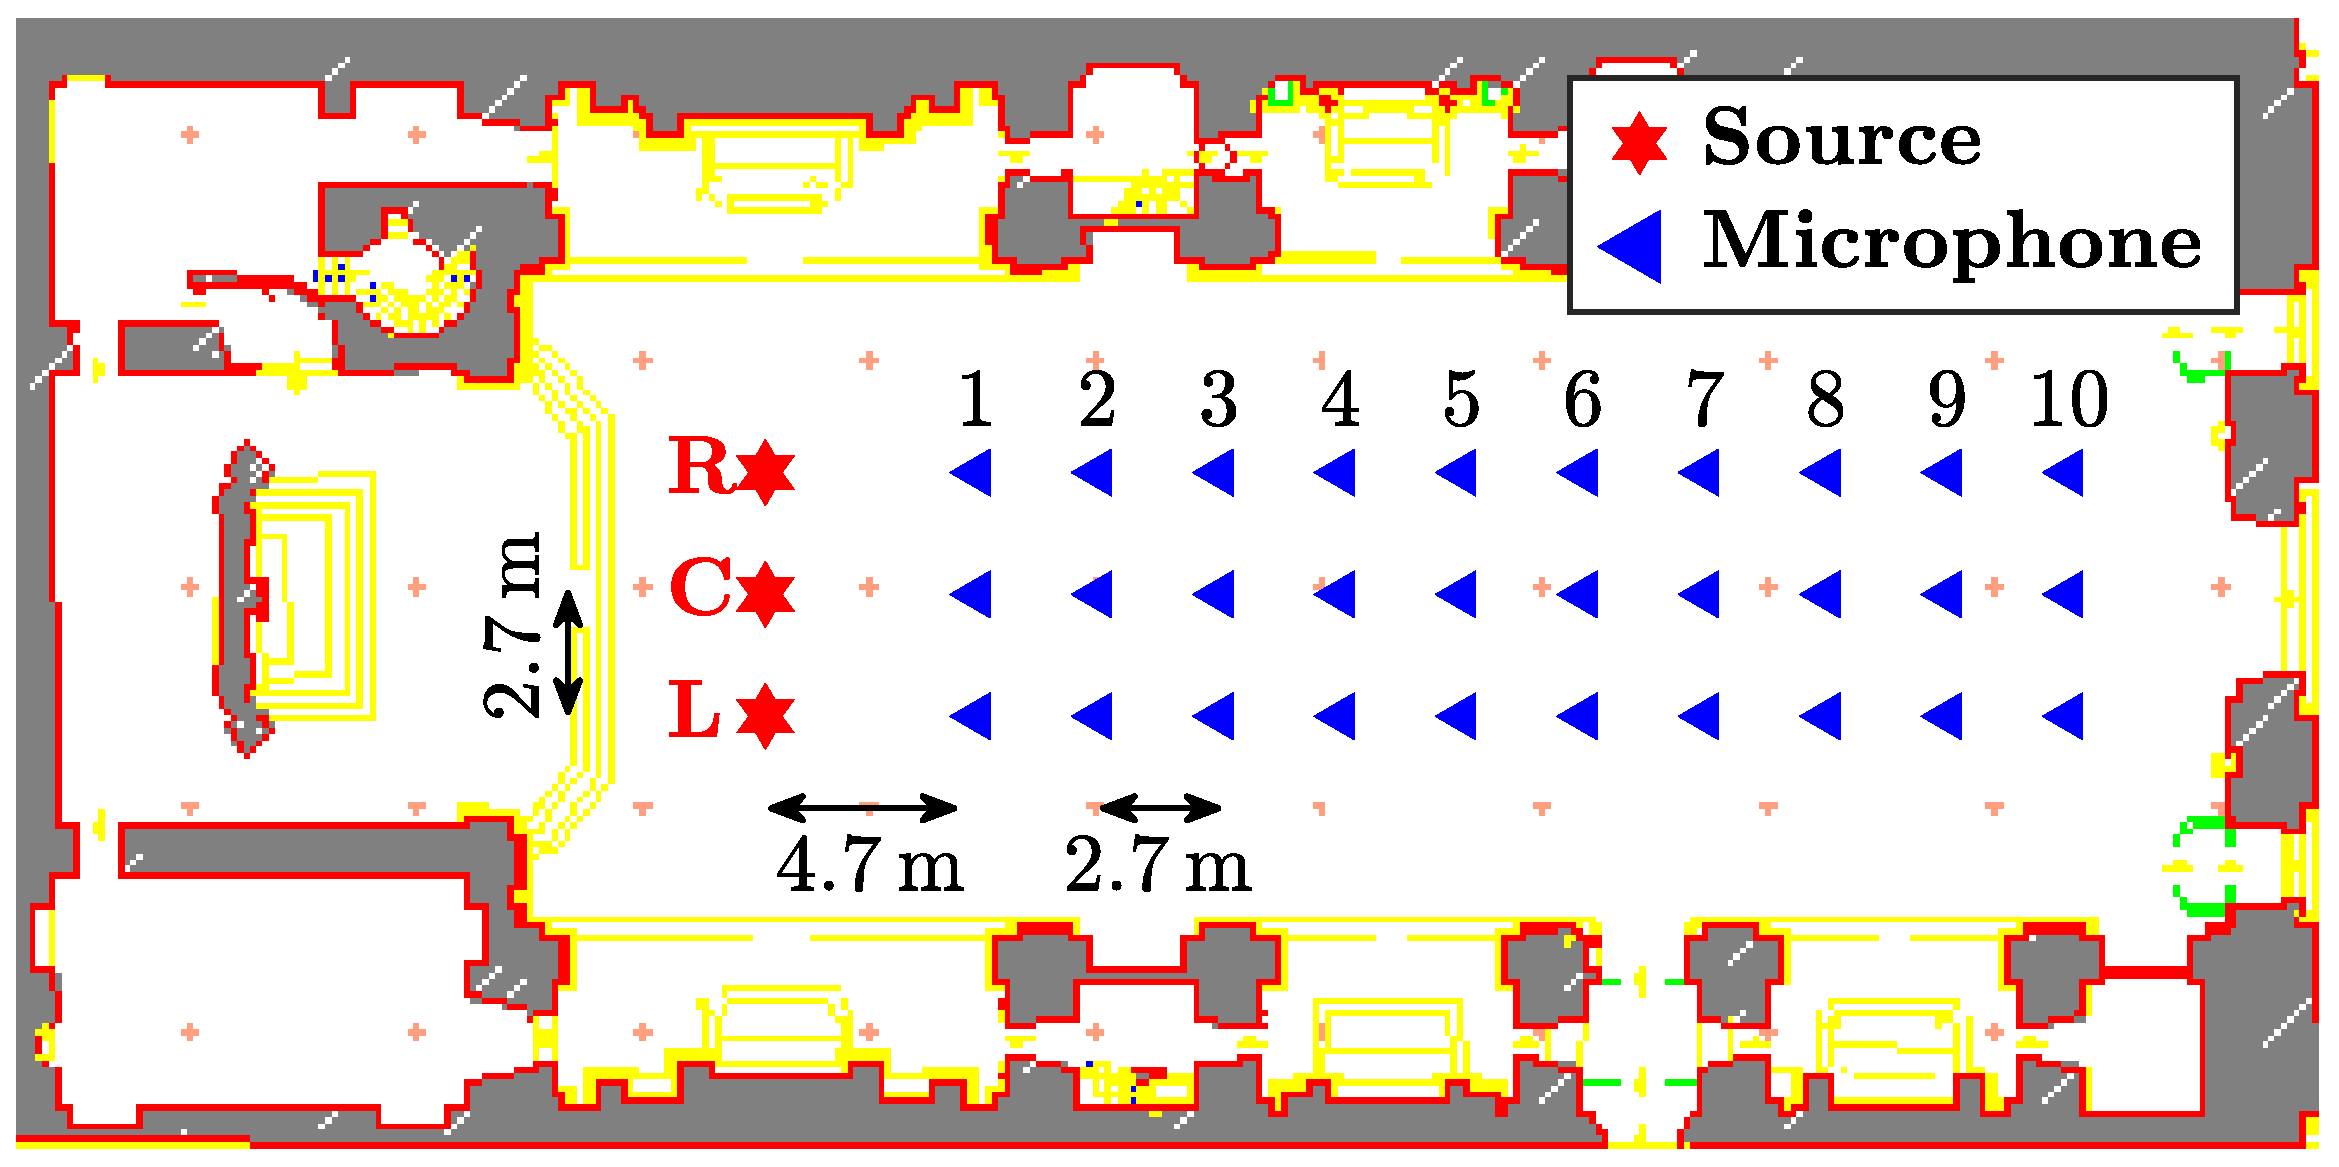
Measurements are performed at thirty receiver positions distributed along three columns that run through the central nave, as shown in Figure 4, to obtain a detailed mapping of the acoustic response in the audience area. The sound source is placed in three different positions, located in the stage area intended for musical performances. These source positions are selected based on their relevance to the intended use of the space, i.e., the area where the stage and musical ensemble will be positioned, guaranteeing a time-efficient measurement campaign with a focus on the most acoustically significant zones for our purpose. The methodology recommended in [15] facilitates a better comparison of acoustic properties measured in different churches, however, said methodology cannot be fully applied due to the different structure and layout of our study case. For example, we do not include a source position in the organ zone, as suggested in [15], because the church is missing it, while the receiver positions are selected to cover the central nave, which corresponds to the main listening area.
Performing the measurements using multiple source positions allows for a more accurate representation of the acoustic conditions and helps identify critical reflection zones. For each of the three source positions, measurements are recorded for all thirty listening points. Figure 4 illustrates the layout of the source positions (in red) and the receiver locations (in blue), distributed along ten rows and three columns. The rows are numbered from Row 1 (closest to the sources) to Row 10 (at the back of the nave). The columns of receiver positions and source placements are referred to as Column L (Left), Column C (Center), and Column R (Right), based on the perspective facing the altar. Both microphones are positioned at a height of 1.27 m from the floor, oriented towards the apse, while the sound source is placed at a height of 1.87 m. The set-up layout respects ISO 3382 guidelines regarding microphone height (about 1.2 m), at a distance of 1 / 4 wavelength from any reflecting surfaces. The adopted receiver grid is therefore consistent with both international standards [37] and recommendations emerging from statistical analyses of church acoustics [15]. The environmental conditions within the church during the measurement campaign include a relative humidity of 57% and a temperature of 26.9 °C. Moreover, the nave of the church contains no seating, except for a few wooden pews placed near a side chapel. The environment is excited using a 7 s long logarithmic sweep signal, covering the frequency range from 22 Hz to 22,000 Hz as suggested in [38]. This signal type ensures uniform excitation across the audible spectrum, yielding high-resolution data over all frequencies of interest. Once the signals are recorded considering a sampling frequency of 48 kHz and 24 bit depth, the impulse response is obtained through deconvolution, following the procedure detailed in [38].
Several key acoustic parameters, such as reverberation time, clarity, definition indices, and envelope indicators, are calculated to provide a comprehensive characterization of the environment’s acoustic qualities. In particular, from the EDC (Energy Decay Curve)
EDC ( t ) : = t N h ( τ ) 2 d τ
we extract the parameters detailed in the following, complying with the specifications in [37]. In Equation (1), the variable h ( · ) represents the impulse response, N is the total length of the signal, while t indicates the continuous time instant. First, the metric characterizing the early reflections is the EDT (Early Decay Time) and is computed as
EDT : = 6 · ( t 0 dB t 10 dB ) ,
where t 0 dB is the time instant of the direct sound, i.e., the moment of maximum perceived energy, and t x dB denotes the time instant which the sound level is decayed by x dB from its maximum energy.
A second relevant parameter is the Reverberation Time T 20 , defined as
T 20 : = 3 · ( t 5 dB t 25 dB ) .
T 20 is calculated using the linear portion of the Energy Decay Curve (EDC, see Equation (1)) between −5 dB and −25 dB with respect to the maximum perceived energy, scaled by a factor 3. It provides a reliable estimation of reverberation time, especially in cases where background noise affects the later part of the decay. Higher values of T 20 indicate longer reverberation and a more reflective environment, such as churches or large halls. Another indicator of Reverberation Time is T 30 , expressed as
T 30 : = 2 · ( t 5 dB t 35 dB ) .
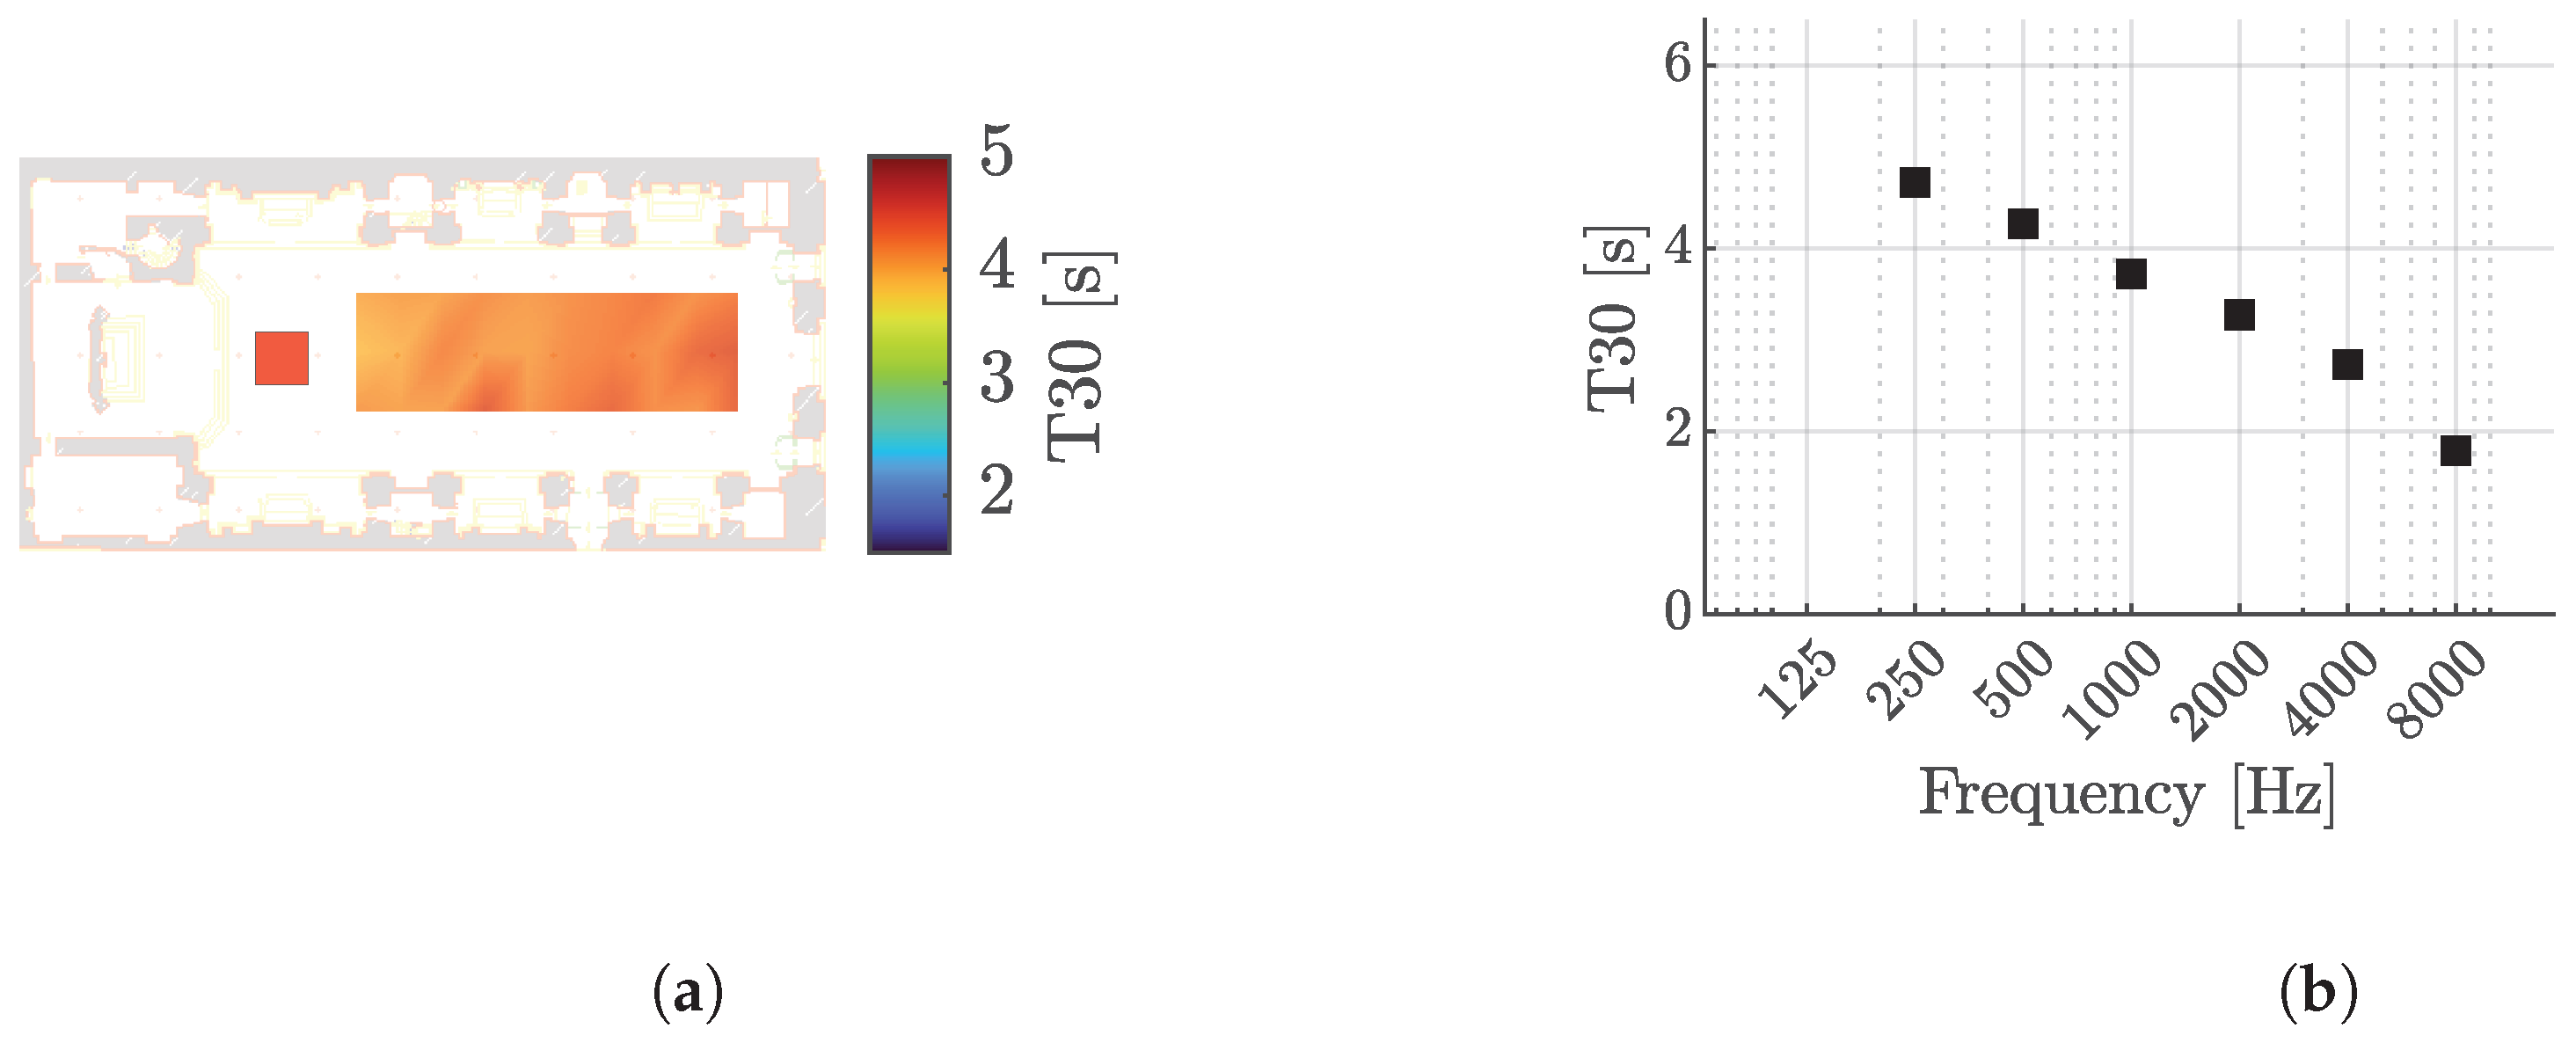
As reported in [37,39], for concert halls, a typical T 30 value at 1000 Hz is around 1.8 s. T 30 offers a more global evaluation of reverberation than T 20 , as it analyzes a longer portion of the decay curve. However, it requires the energy decay to be clearly measurable over a longer time period. In noisy environments, background noise can mask the late decay, making T 30 harder to compute accurately. In such cases, T 20 may be more reliable. The Clarity Index for music C 80 is defined as
C 80 : = 10 · log 10 0 ms 80 ms h 2 ( t ) d t 80 ms h 2 ( t ) d t .
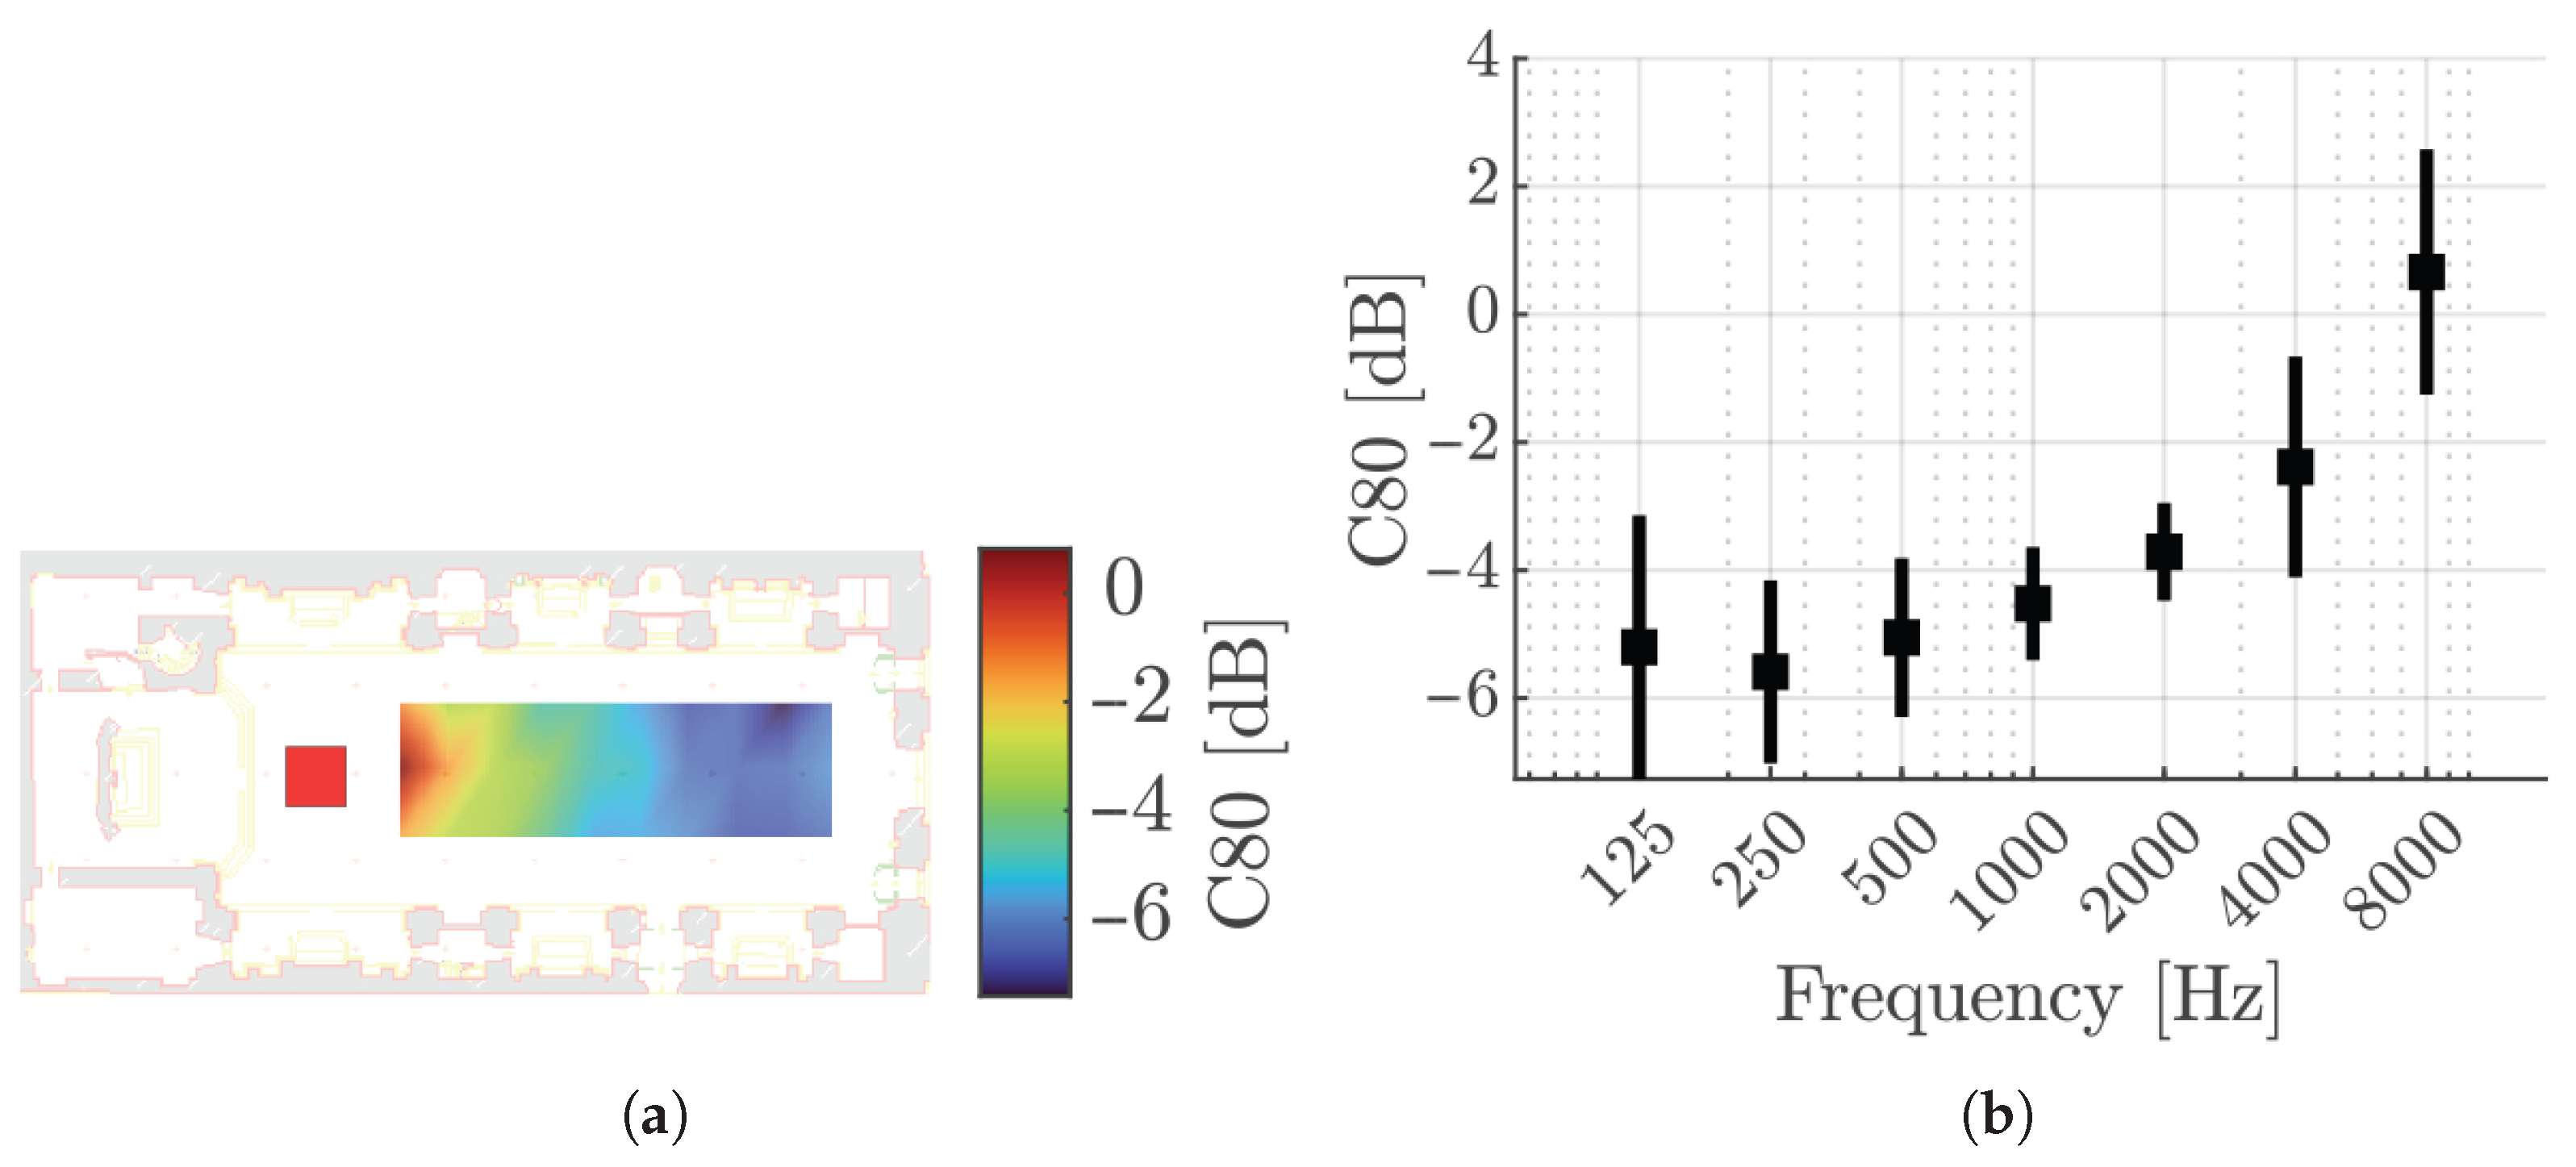
It measures the ratio of early arriving sound energy (within the first 80 ms) to late arriving sound energy and is used to assess musical clarity. Values between 4 dB and + 1 dB are generally considered optimal for music [39]. The comparison of reverberation times at low and mid frequencies is performed taking into account BR (Bass Ratio),
BR : = T 125 Hz + T 250 Hz T 500 Hz + T 1000 Hz ,
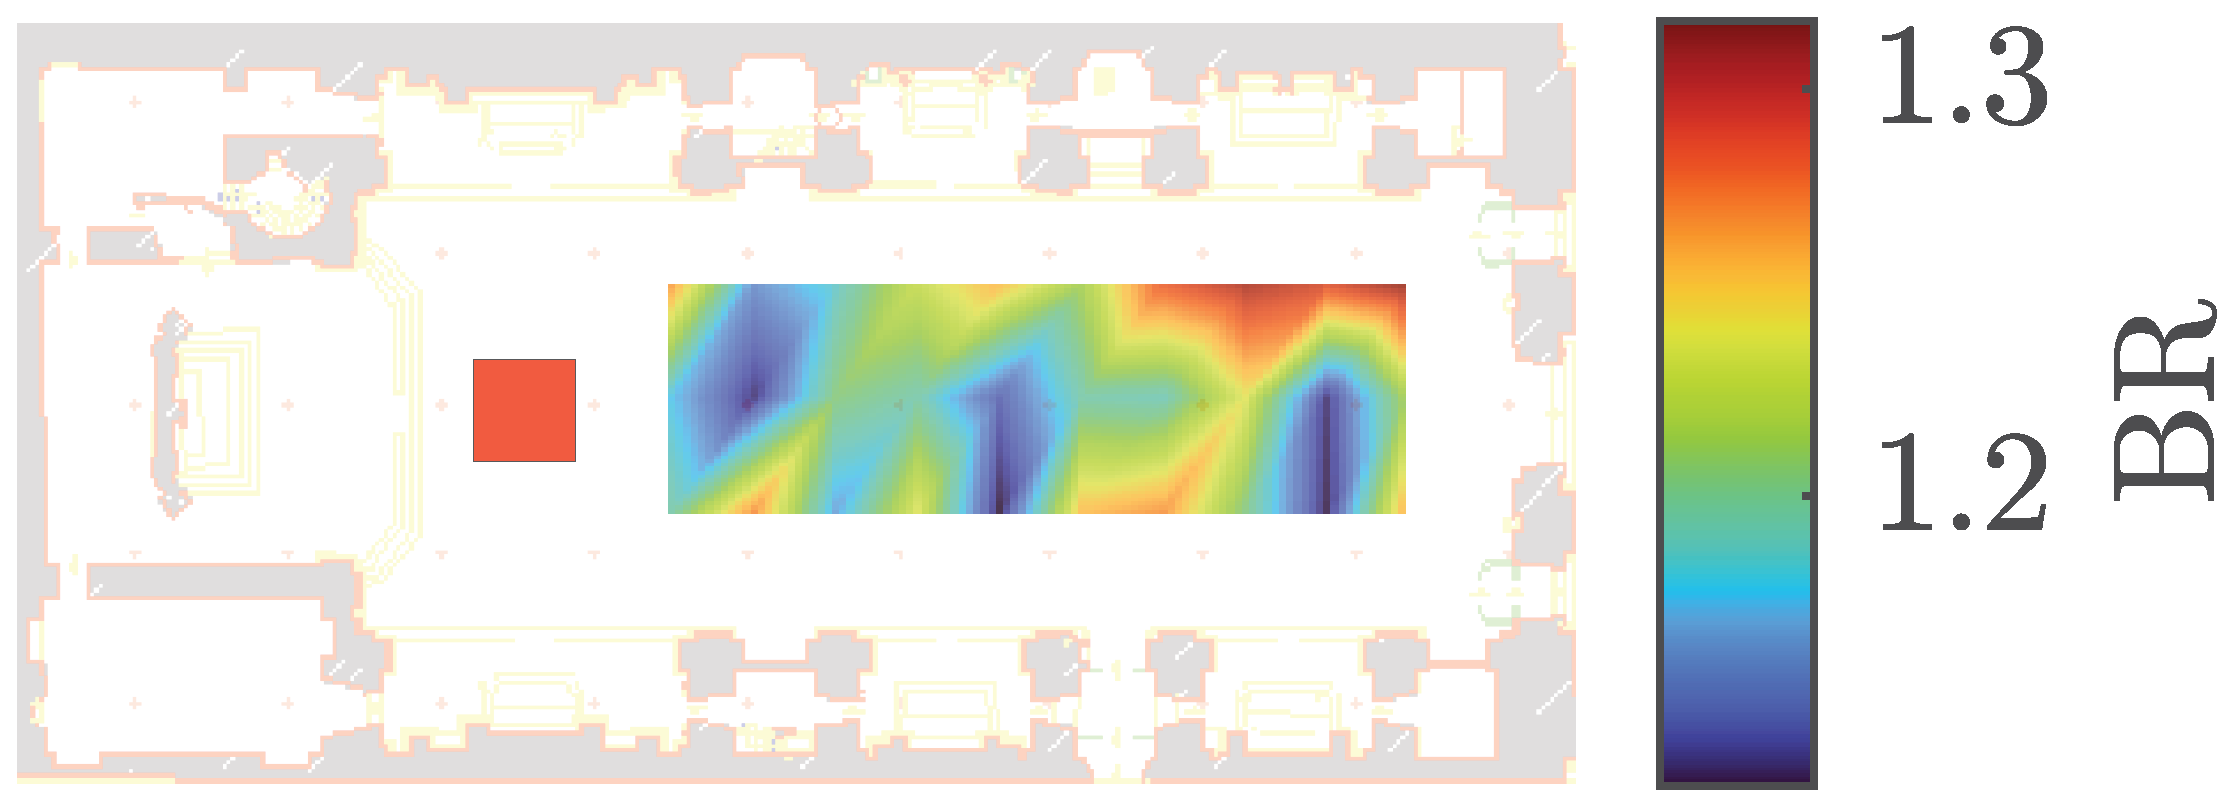
where T x Hz is the reverberation time related to the octave band centered on frequency x Hz. We consider as reverberation time T x Hz the T 20 , Equation (3), to ensure greater reliability of the energy decay curves, especially in the low-frequency bands where T 30 values turned out to be affected by background noise. Higher BR values suggest a fuller and warmer sound. A BR value of approximately 1.2 is considered optimal for musical performances [39]. Concluding, LEF (Lateral Energy Fraction),
LEF : = 5 ms 80 ms h lateral 2 d t 0 ms 80 ms h omni 2 d t ,
where h lateral ( · ) stands for the lateral component of the impulse response (from directions perpendicular to the source-receiver axis), and h omni ( · ) is the omnidirectional impulse response. The numerator is the integral of the squared lateral energy between 5 ms and 80 ms, the denominator, instead, of the squared omnidirectional energy between 0 ms and 80 ms. The data h lateral ( · ) and h omni ( · ) are derived from the impulse responses measured by the spherical microphone array. Specifically, h omni ( · ) is obtained by summing the squared responses from all microphones in the spherical array. To account for the spatial distribution of energy arrival directions, the lateral signal h lateral ( · ) , at the numerator, is weighted by cos ( α ) , Equation (8):
h lateral ( t ) : = h omni ( t ) · | cos ( α ) | ,
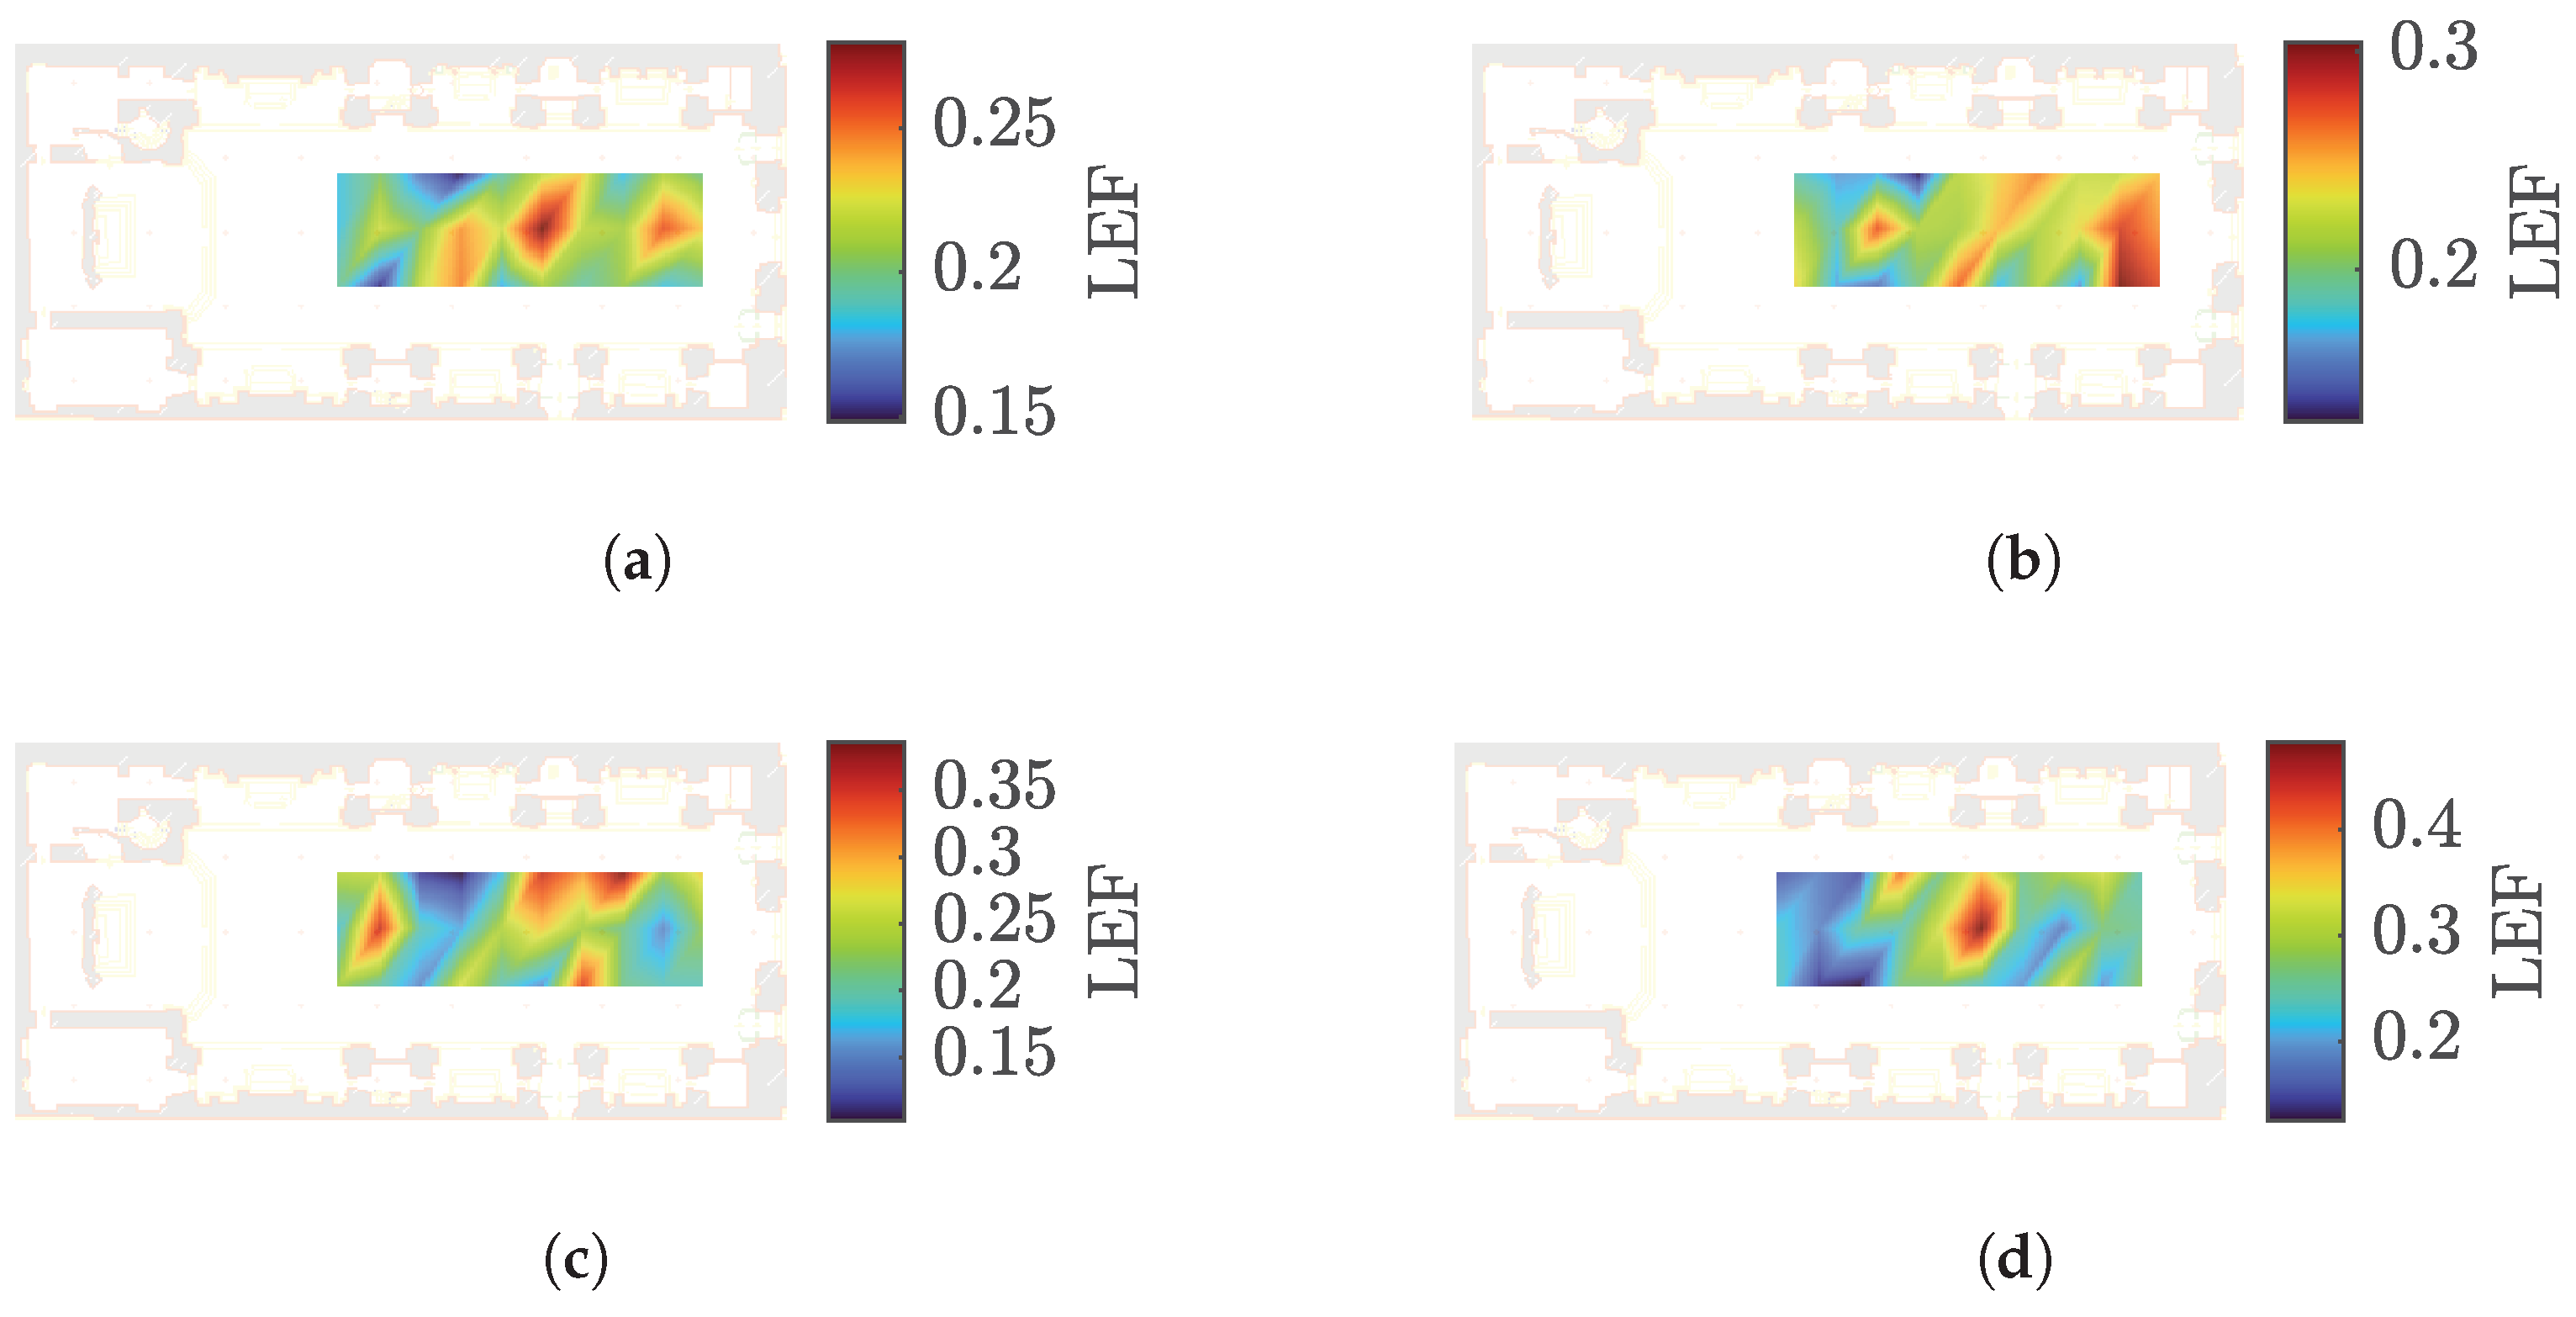
where α denotes the angle between the orientation of each microphone capsule and the lateral direction. The lateral direction is defined as orthogonal to the direction of the direct sound arrival. The use of the absolute value of cos ( α ) ensures that contributions from both directions, i.e., sounds arriving from the left and right lateral sides, are considered equally. This approach follows the methodology presented in [40,41,42]. This parameter quantifies the portion of energy coming from the lateral areas relative to the total early energy [40,43,44]. Higher values reflect a stronger spatial envelope. For concert halls, ideal values are around 0.2 [39]. However, excessively high LEF values can lead to a reduction in clarity, as competing lateral reflections may interfere with direct sound perception. In this work, LEF is computed using data from all three source positions (Left, Center, and Right), ensuring a comprehensive spatial energy analysis at each listening position.

2.2. Acoustic Renovation Study

In this subsection, we validate the model starting from the measurements acquired through the campaign described in Section 2.1. This is followed by the analysis and testing of various acoustic conditioning proposals aimed at exploring potential renovation strategies. These proposals involve the integration of acoustically effective materials intended to enhance the sound quality within the church, while preserving its historical and aesthetic integrity, thus achieving an optimal balance between performance and conservation. All simulations are performed using the Odeon 18 software, with the following settings. The signal duration is set to 15,000 ms to ensure an accurate computation of all acoustic parameters of interest. A total of 10,281 rays are used, providing a balance between computational efficiency and simulation accuracy. The external ray tolerance is set to 18 % , the maximum reflection order to 1000, and the impulse response resolution to 1 ms. Finally, the transition order from early to late reflections is defined to be 3. The obtained average of reflection density is 180 reflections per milliseconds as, according to the guidelines indicated in the Odeon Manual [45], these are enough to guarantee an accurate analysis. An omnidirectional source is used in order to best replicate the conditions of the in-situ measurement campaign. The energy level is set to 100 dB for each octave band and the source is positioned at the same central location used during the measurement campaign. Thirty receivers are placed in the same positions analyzed during the measurement campaign, as shown in Figure 4.

2.2.1. Selection of Materials

Table 1 reports the materials used in the simulation of the church’s current condition (see Figure 1), including the Odeon options applied in the model. The floor is primarily made of terracotta tiles, while the steps are in marble. The interior walls are plastered concrete, featuring large frescos, prominent decorative friezes, and fluted pilasters. In the side chapels and the apse, there are wooden altarpieces with inlaid and painted surfaces, including canvases and panels, which have been carefully represented in the model. At the back of the church, in particular, at the end of the nave, there is a large wooden structure covering most of the rear wall, installed in recent times for practical and restoration purposes. Additionally, wooden confessionals are arranged along the sides of the nave.
Table 2 reports the absorption coefficients used for each octave band. Each row is colored according to the following convention: values highlighted in yellow correspond to absorption coefficient data taken from the Odeon Library [46], while those highlighted in green indicate coefficients specifically tuned to minimize discrepancies with the measurement campaign results (see Figure 5).
In order to improve the acoustics of the environment, we propose and test several solutions, including the addition of seating, cotton curtains, various types of acoustic panels, and a wooden floor. Hereafter, we describe all the materials used to simulate each of the abovementioned installations, while their contribution to the overall church acoustics is discussed in Section 3.2.
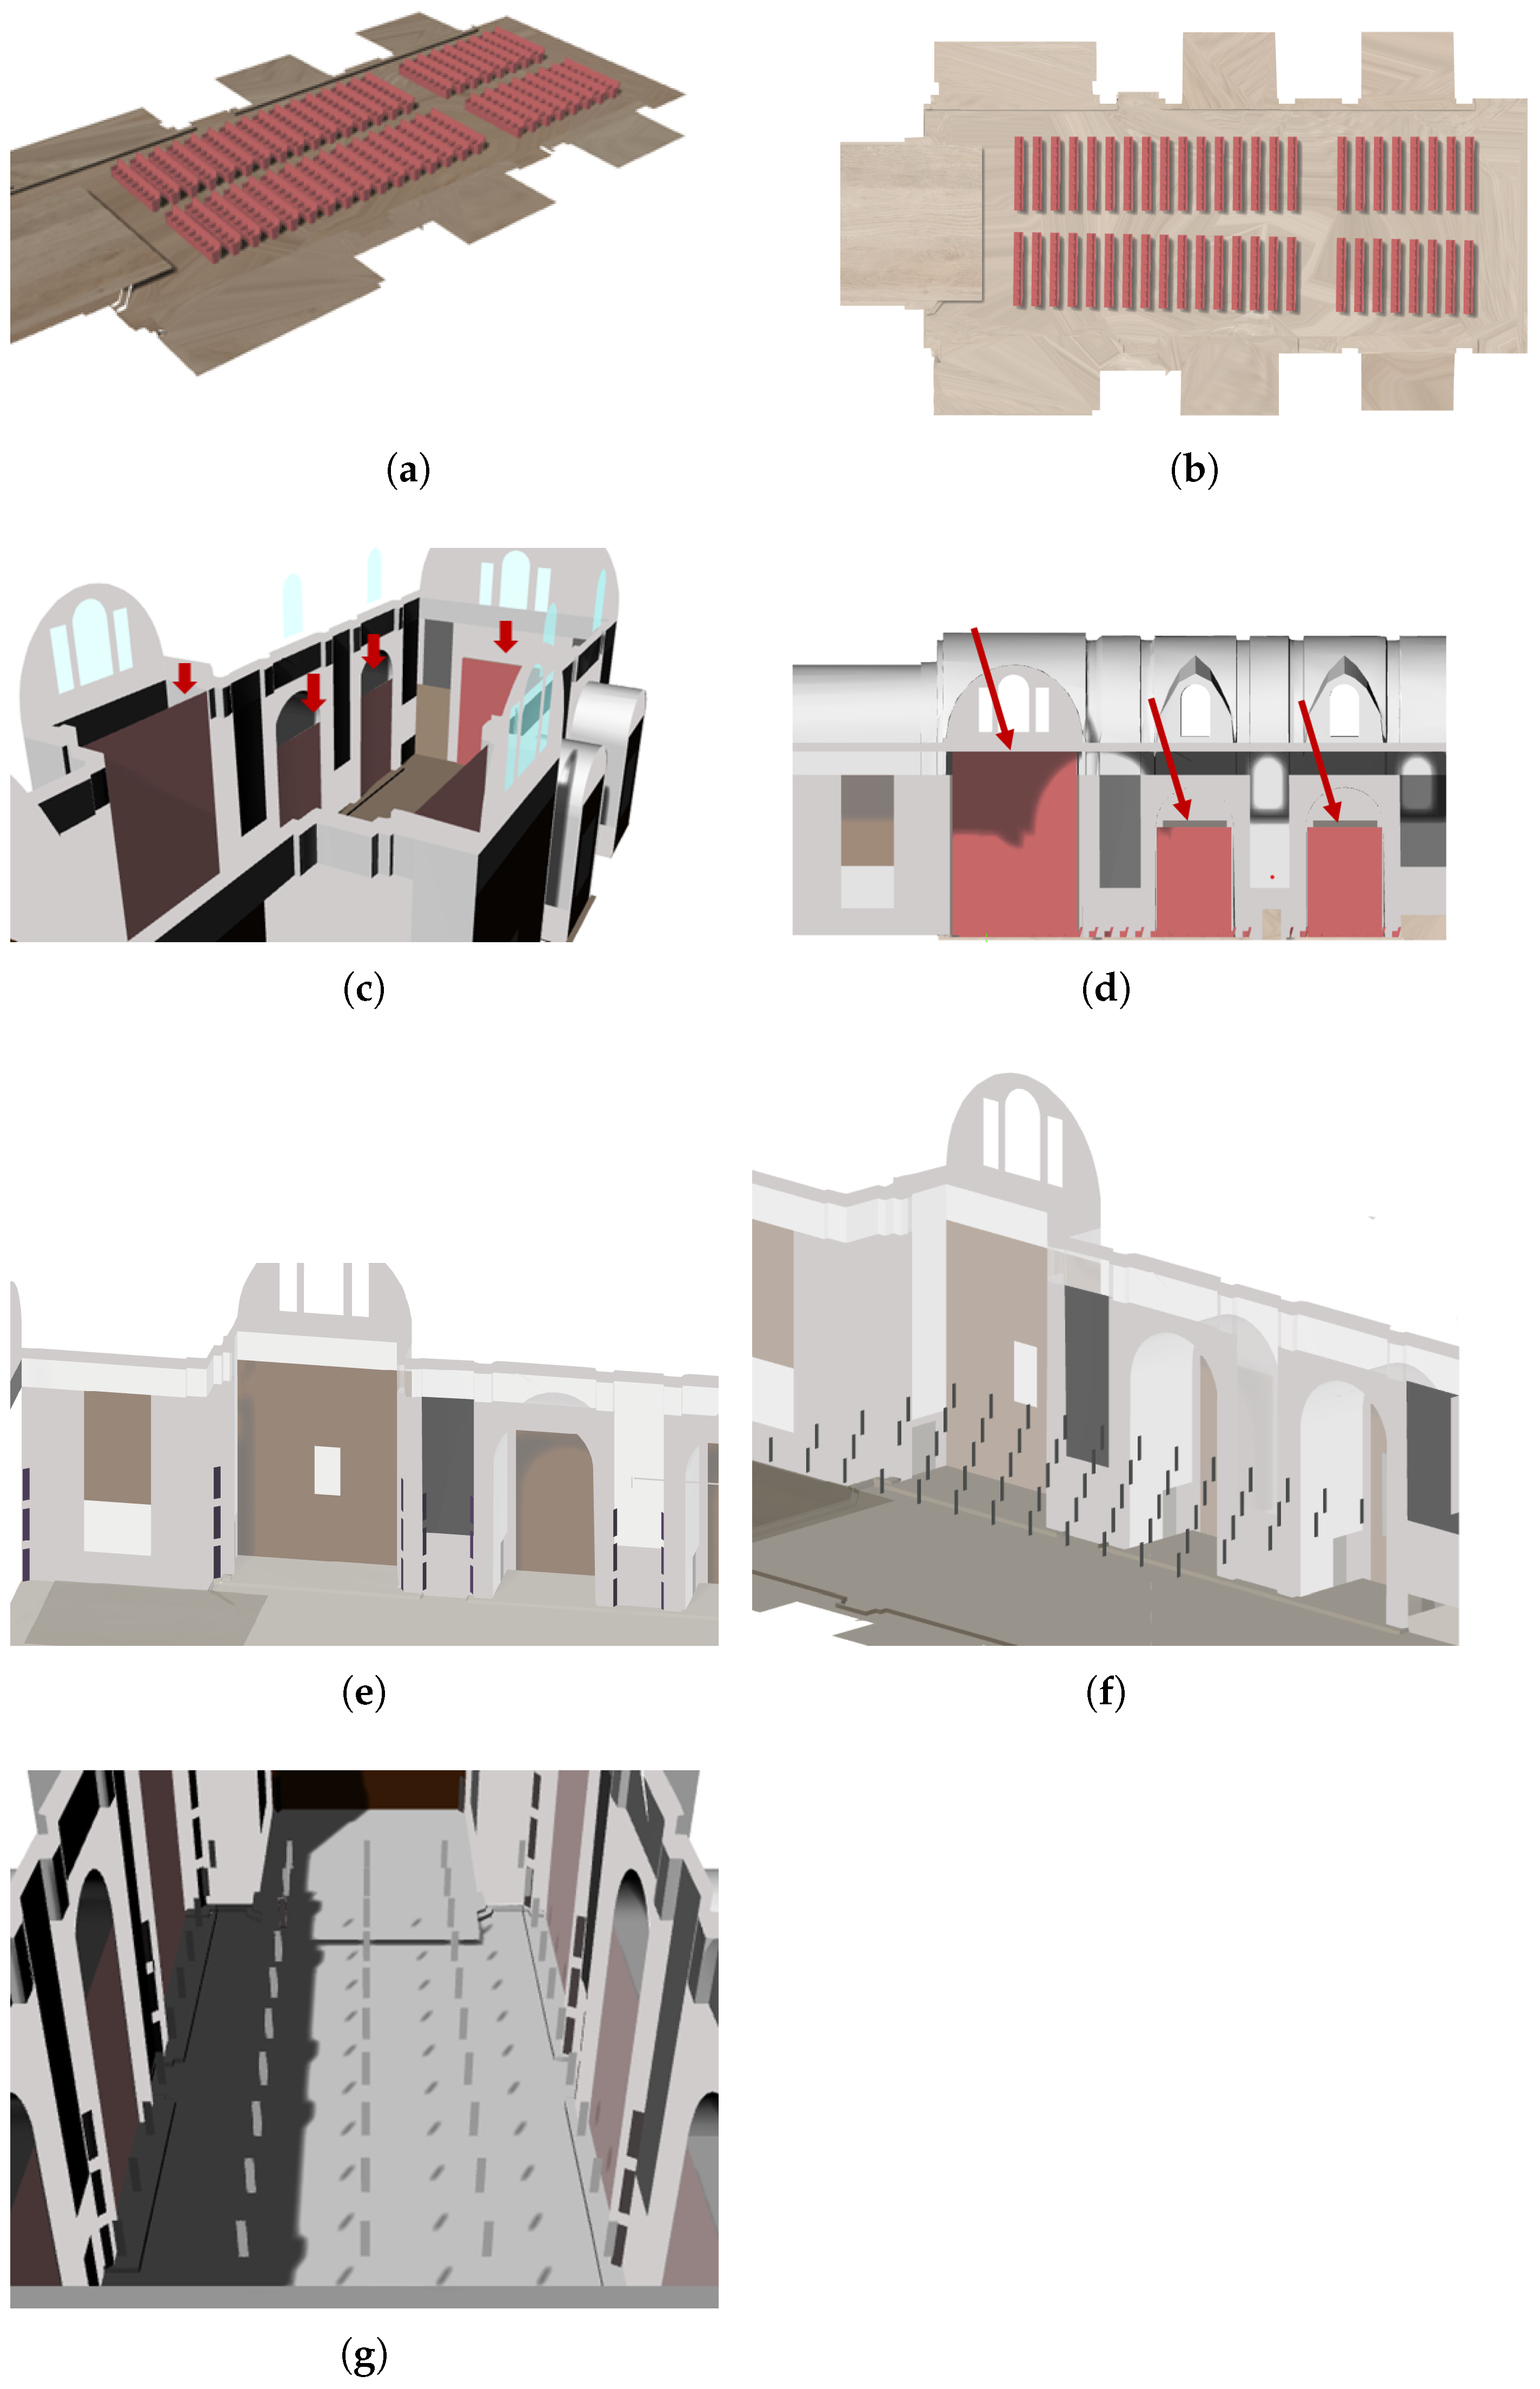
To ensure the audience’s comfort and, at the same time, act on the overall reverberation time, we choose the LAMM L213 seating model [47], which is known for its high acoustic absorption coefficient, even at lower frequencies. A total of 384 seats are placed along the nave, as shown in Figure 6a. A scattering value of 0.6 is applied to appropriately simulate the acoustic diffusion generated when the seats are occupied by the audience, in agreement with the indications reported in the Odeon manual [45]. The absorption coefficients for people are taken from the source [48], which reports octave band values for human bodies based on typical measurement data. In particular, the total absorption A ( m 2 Sabine) of the hall is equivalent to Equation (9) from [49]:
A = S 1 · α 1 + S 2 · α 2 + + S n · α n ,
where S i is the surface area in m 2 and α i is the absorption coefficient of the corresponding surface. We consider that each occupant typically covers approximately half of the area designated for seating, and, therefore, an equal-weight arithmetic average in each octave band between the absorption coefficients of the empty chosen seat and those of the people, as reported in Table 3.
Then, cotton curtains are placed below the arches of the side chapels and the transept, as shown in Figure 6c. These areas, as we will show later, are identified as acoustically critical (see Section 2.1) due to their tendency to generate reflective effects at specific frequencies. This choice is also historically consistent, recalling the widespread use of rich draperies in Baroque interiors as both decorative and functional elements [50,51,52]. Indeed, the use of draperies to decorate churches in northern Italy is already mentioned in the Instructionum Fabriacæ [53] (p. 349), by Saint C. Borromeo, preferably made of leather or wool, although historical descriptions record the use of a wide variety of fabrics. The purpose was to thermally insulate the cold liturgical halls and to improve acoustic comfort. In particular, the use of draperies is among the Jesuit Order’s recommendations for the construction of new churches, also applied in the Church of SS. Marcellino and Pietro [54] (p. 23). The curtain absorption coefficient used in the analysis are selected from the Odeon Material Library [46] and corresponds to a curtain covering approximately 3 / 4 of the designated surface area. The goal is to support an acoustic analysis for a fully removable solution, proposing curtains that can be easily removed or adjusted as needed. We emphasize that the current study focuses on assessing the acoustic impact of such materials, rather than providing structural details for their actual implementation, which will be addressed in future work.
As an additional acoustic treatment, suspended panels are modeled at a height of 5.5 m, with absorption coefficients matching those of Prisma by Acustico® 100 mm [55]. Moreover, bass traps, specifically Modex Corner by Acoustic GRG® [56] are placed in the corners not occupied by decorative elements. A total of 60 panels are introduced, each measuring 1.2 m × 0.2 m , positioned at a height of 5.5 m, as illustrated in Figure 6g. The Modex Corner bass traps measure 0.3 m × 1.7 m and are placed in all corners free of decorative elements, shown in dark gray in Figure 6g, located at the edges of the pilasters. Moreover, the panels are placed at different heights to maximize the treated surface area. The bass trap panels, which are effective for acoustic treatments in the modal region (below the Schroeder frequency), are installed near volumetrically enclosed zones (specifically, the side chapels). Finally, we also foresee introducing a wooden parquet floor. The parquet introduces slight reflection, which can enhance acoustic quality by contributing to a homogeneous sound distribution. In Kirchenakustik, J. Meyer [57] (pp. 162–167) outlines three strategies for reducing reverberation time in churches. Indeed, most churches, as in our case, feature hard flooring materials, such as stone slabs or terracotta tiles, which typically offer very low sound absorption. One of the most effective measures Meyer proposes involves creating a 10 cm deep cavity beneath the seating area and installing a wooden floor within it, flush with the existing stone floor. According to Meyer, this proposal significantly improves the overall absorption. However, in the present case, implementing such a change is not feasible due to its structural complexity and implementation challenges. As an alternative, we propose testing the acoustic performance of a wooden floor installed upon the existing surface, which may offer more practical improvements. Moreover, regarding the simulations of the different configurations, a podium is placed in the stage area 30 cm above the nave floor. The podium material is selected from the standard options available in the Odeon Library [46], to which a scattering coefficient of 0.2 is applied. Table 3 lists the absorption coefficients of the proposed materials used in the different configurations (see Section 2.2.1).

2.2.2. Model Validation

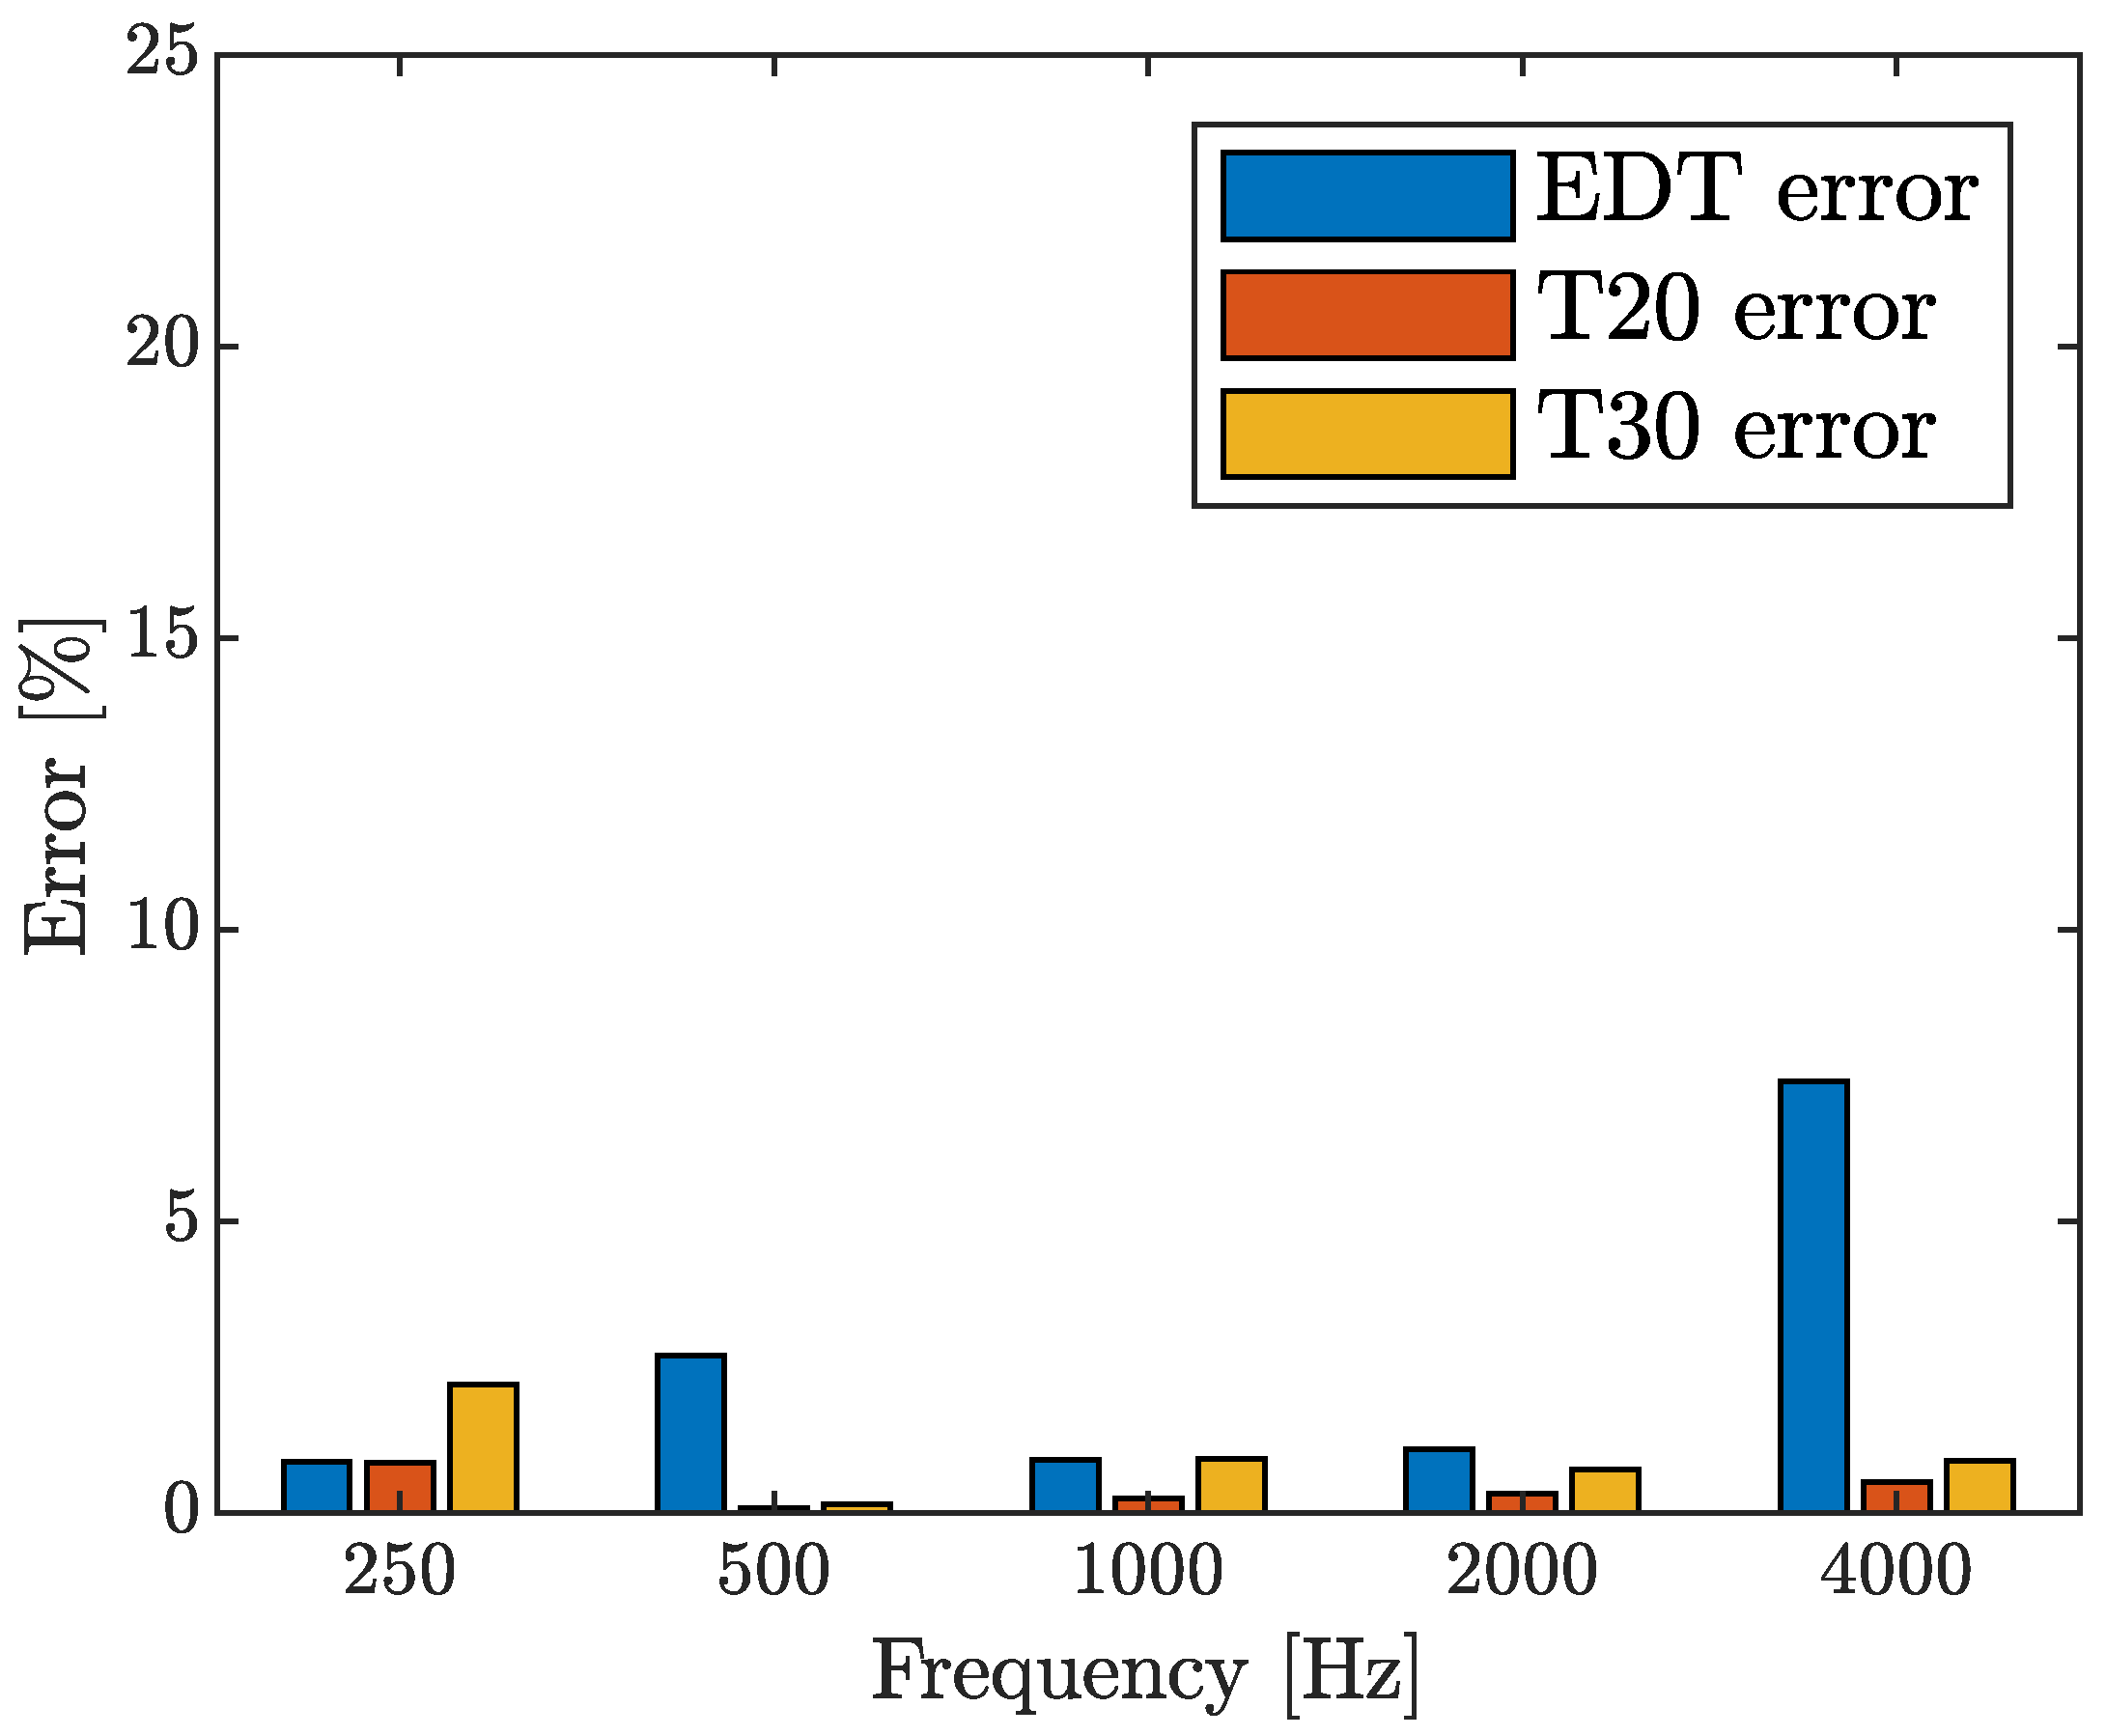
The results of the performed acoustic measurements are used to calibrate the model: The materials used in the simulation model are obtained by adjusting the absorption coefficients and scattering coefficients of the reference materials available in the Odeon library [46]. This tuning process aimed to minimize the discrepancy between the simulation results and the acoustic measurements carried out in the church. The absorption coefficient of the material associated with the walls is selected and modified within its own category limits, ensuring that the resulting coefficients remain consistent with the ranges reported in the literature [58,59]. We confirm, then, the materials that allow the simulation to achieve sufficiently low discrepancy values, shown in Figure 5. In particular, we compare measured and simulated reverberation times, allowing for a reduction in discrepancies between simulated and real acoustic behaviors. This validation process involves the octave-band analysis of the differences between the measured and the simulated acoustic parameters and ensures the reliability of the solutions presented in the following sections. Figure 5 shows the percentage discrepancies between the in-situ measured values and the simulated results, using the material properties listed in Table 1. For each octave band, the values reported are computed as the absolute percentage error between the averaged measured and simulated values across all measurement positions and source configurations. The formula used for the calculation is depicted in Equation (10):
Error X ( f i ) = X ¯ sim ( f i ) X ¯ meas ( f i ) X ¯ meas ( f i ) × 100 ,
where X ¯ sim ( f i ) and X ¯ meas ( f i ) represent the average values of a given acoustic parameter X (e.g., EDT, T 20 , T 30 ) at the octave band frequency f i , obtained respectively from the simulation analysis and the measurement campaign, averaged over all receiver positions and source locations. The largest deviation is observed in the 4000 Hz octave band for EDT, likely due to the higher spatial resolution and sensitivity to fine surface details captured during in-situ measurements, in contrast with the more geometrically simplified and diffuse results produced by the Odeon simulation. Nevertheless, the overall low percentage errors shown in Figure 5 confirm that the simulation model developed in Odeon provides sufficiently accurate results and is therefore considered valid and reliable for the acoustic analyses presented in this work.
It is worth highlighting that the Schroeder’s Frequency of the church, as expressed in [60], considering the whole church volume of about 18,000 m 3 and the reverberation time T 30 (averaged over all the measurement positions) of 4.1 s is:
f s = 2000 · T 30 V = 2000 · 4.1 18,000 30.18 Hz .
It follows that the room operates in the statistically reverberant regime across almost the entire audible range, dominated by dense modal overlap [61,62].

3. Results

In this section, we present both the results of the measurement campaign and those obtained from simulations using the Odeon model.
The colored maps presented in most of the following figures provide a graphical representation of the results obtained through colored maps, based on linear interpolation of the results obtained at the receiver positions shown in Figure 4, for both the in-situ measurements and the simulation tests.

3.1. Measurement Campaign Results

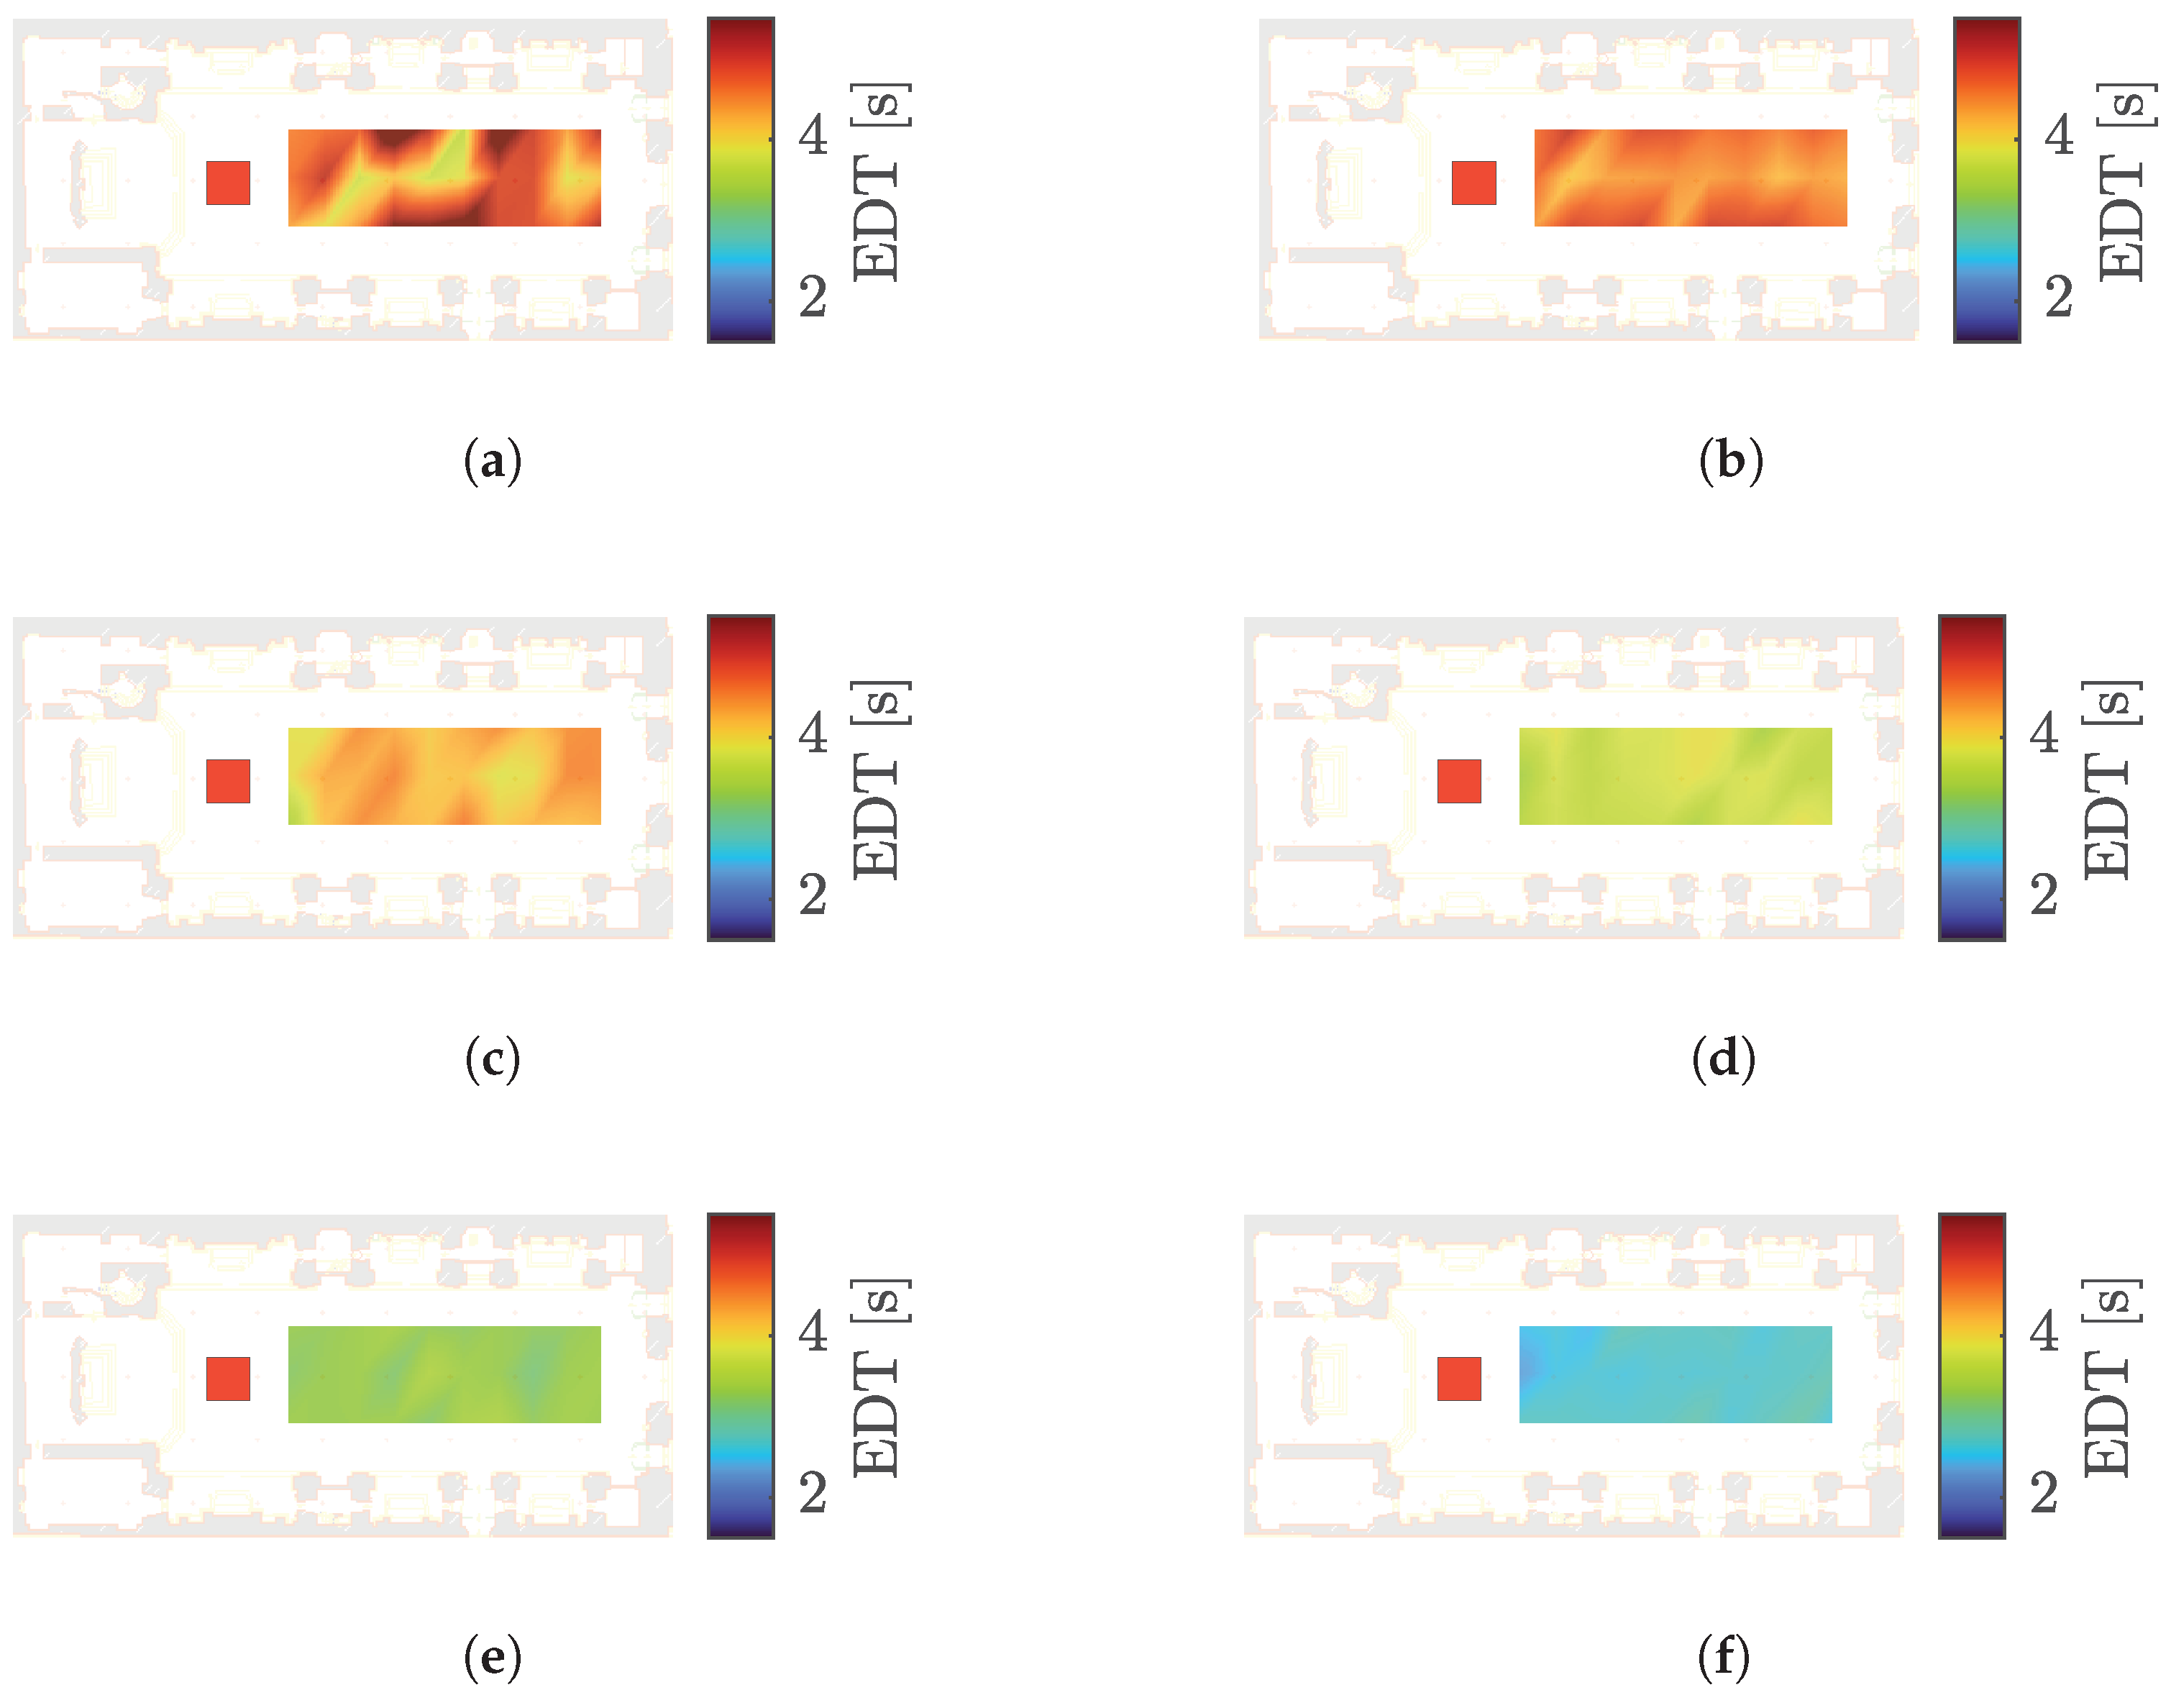
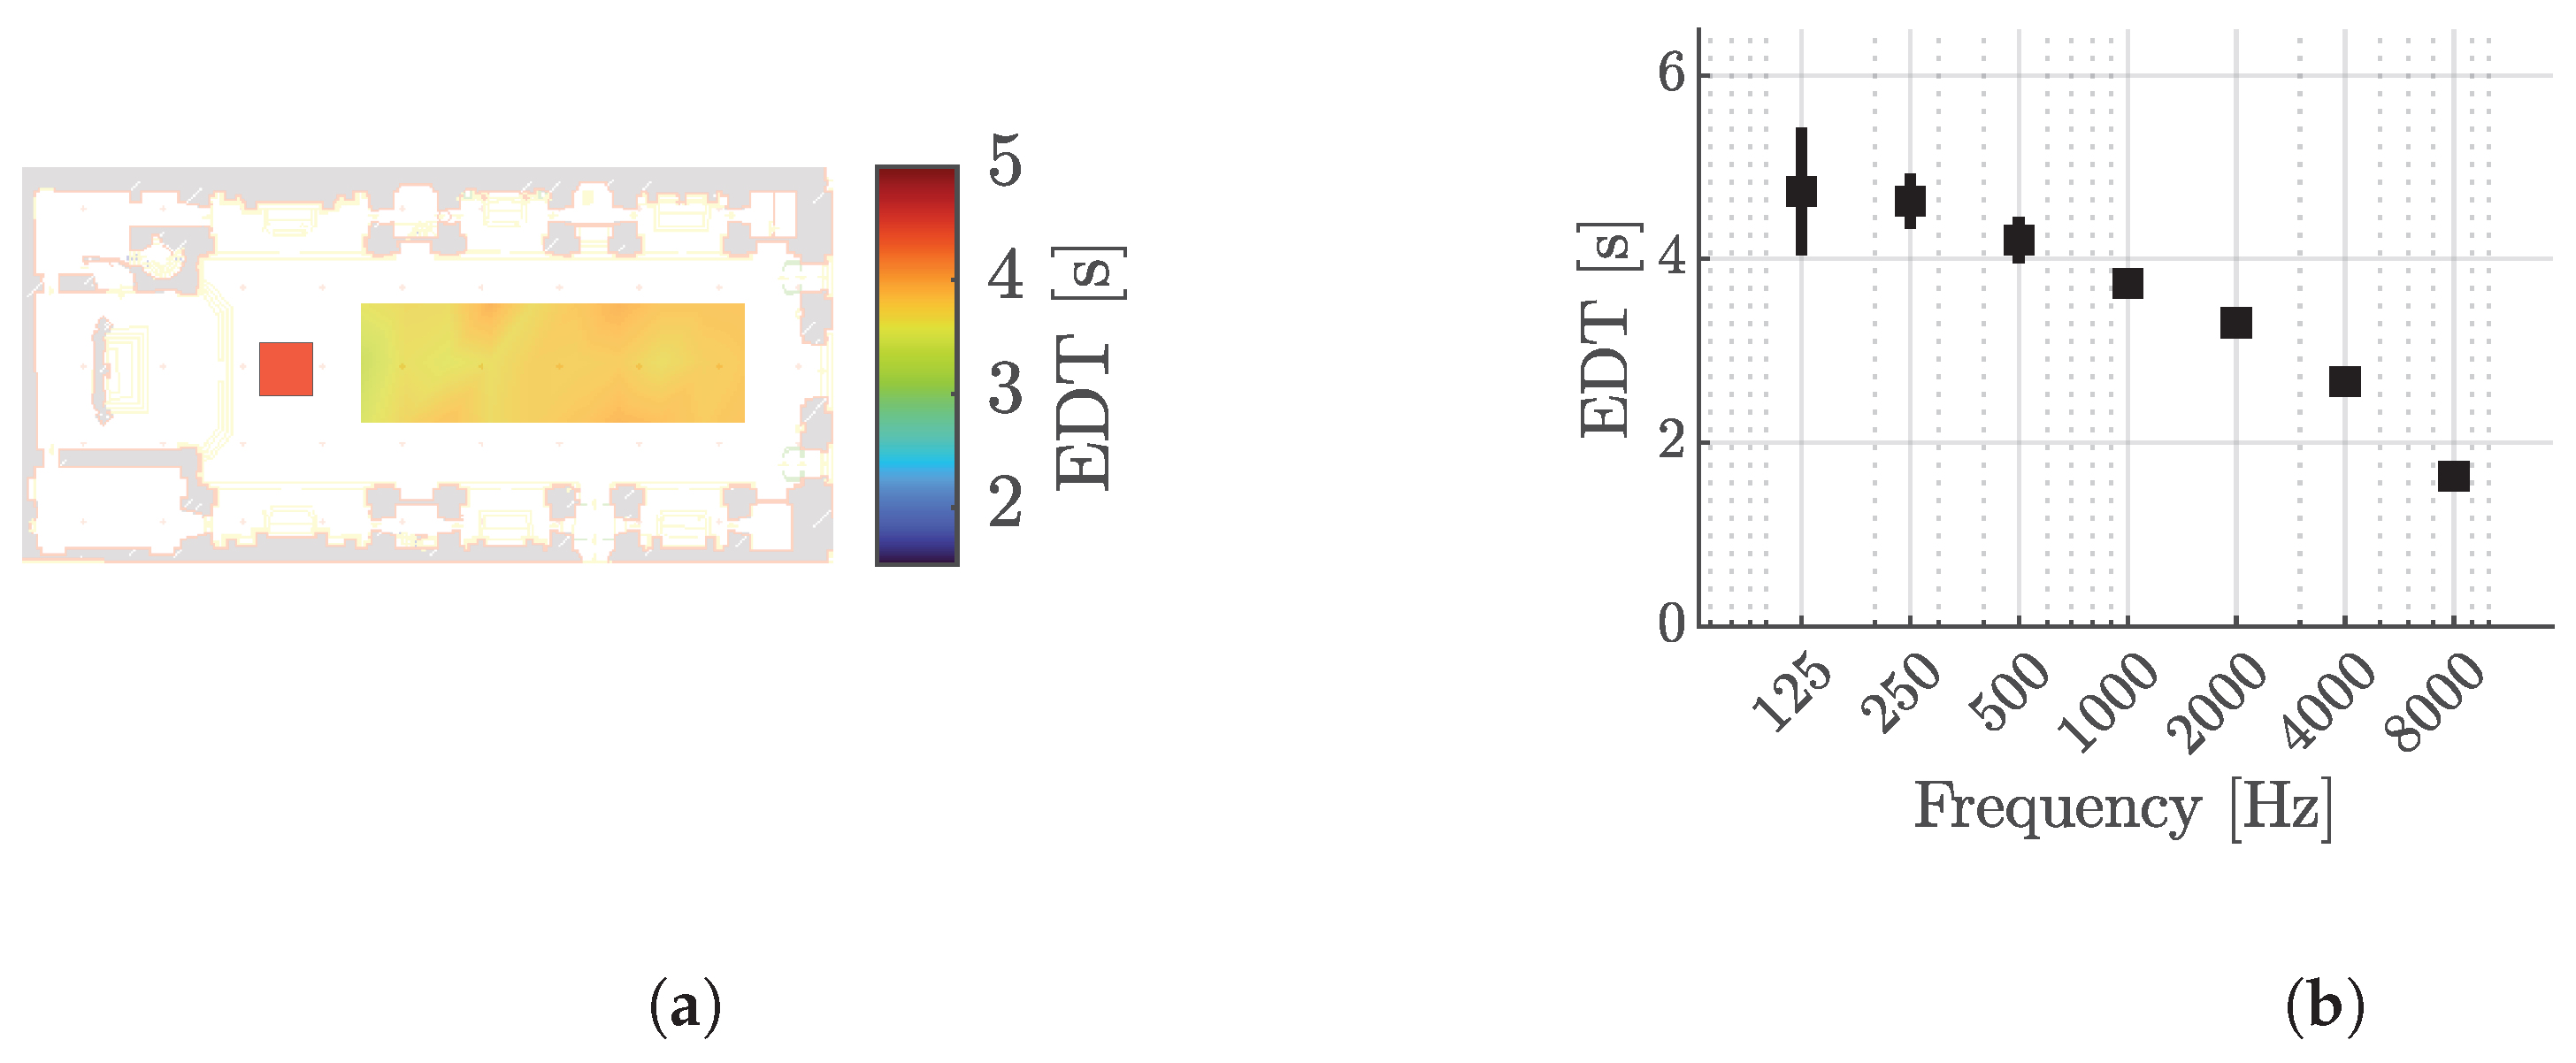
We here report some results obtained from the measurements campaign, including both the omnidirectional microphone acquisitions and the microphone array acquisitions. In particular, let us take into account the EDT shown in Figure 7 and detailed previously in Equation (2). Although it is a global indicator of the initial decay time of the sound energy, the EDT is still affected by local acoustic reflections and may therefore differ from one area of the space to another. The EDT values appear to be high, especially at lower frequencies, as expected for the typical reverberant proposal of church interiors. The values are generally homogeneous, but increases are observed in areas adjacent to the side chapels, as highlighted in the octave band centered at 250 Hz. This behavior highlights sound reflections in areas closer to these chapels, as evident from Figure 8a.
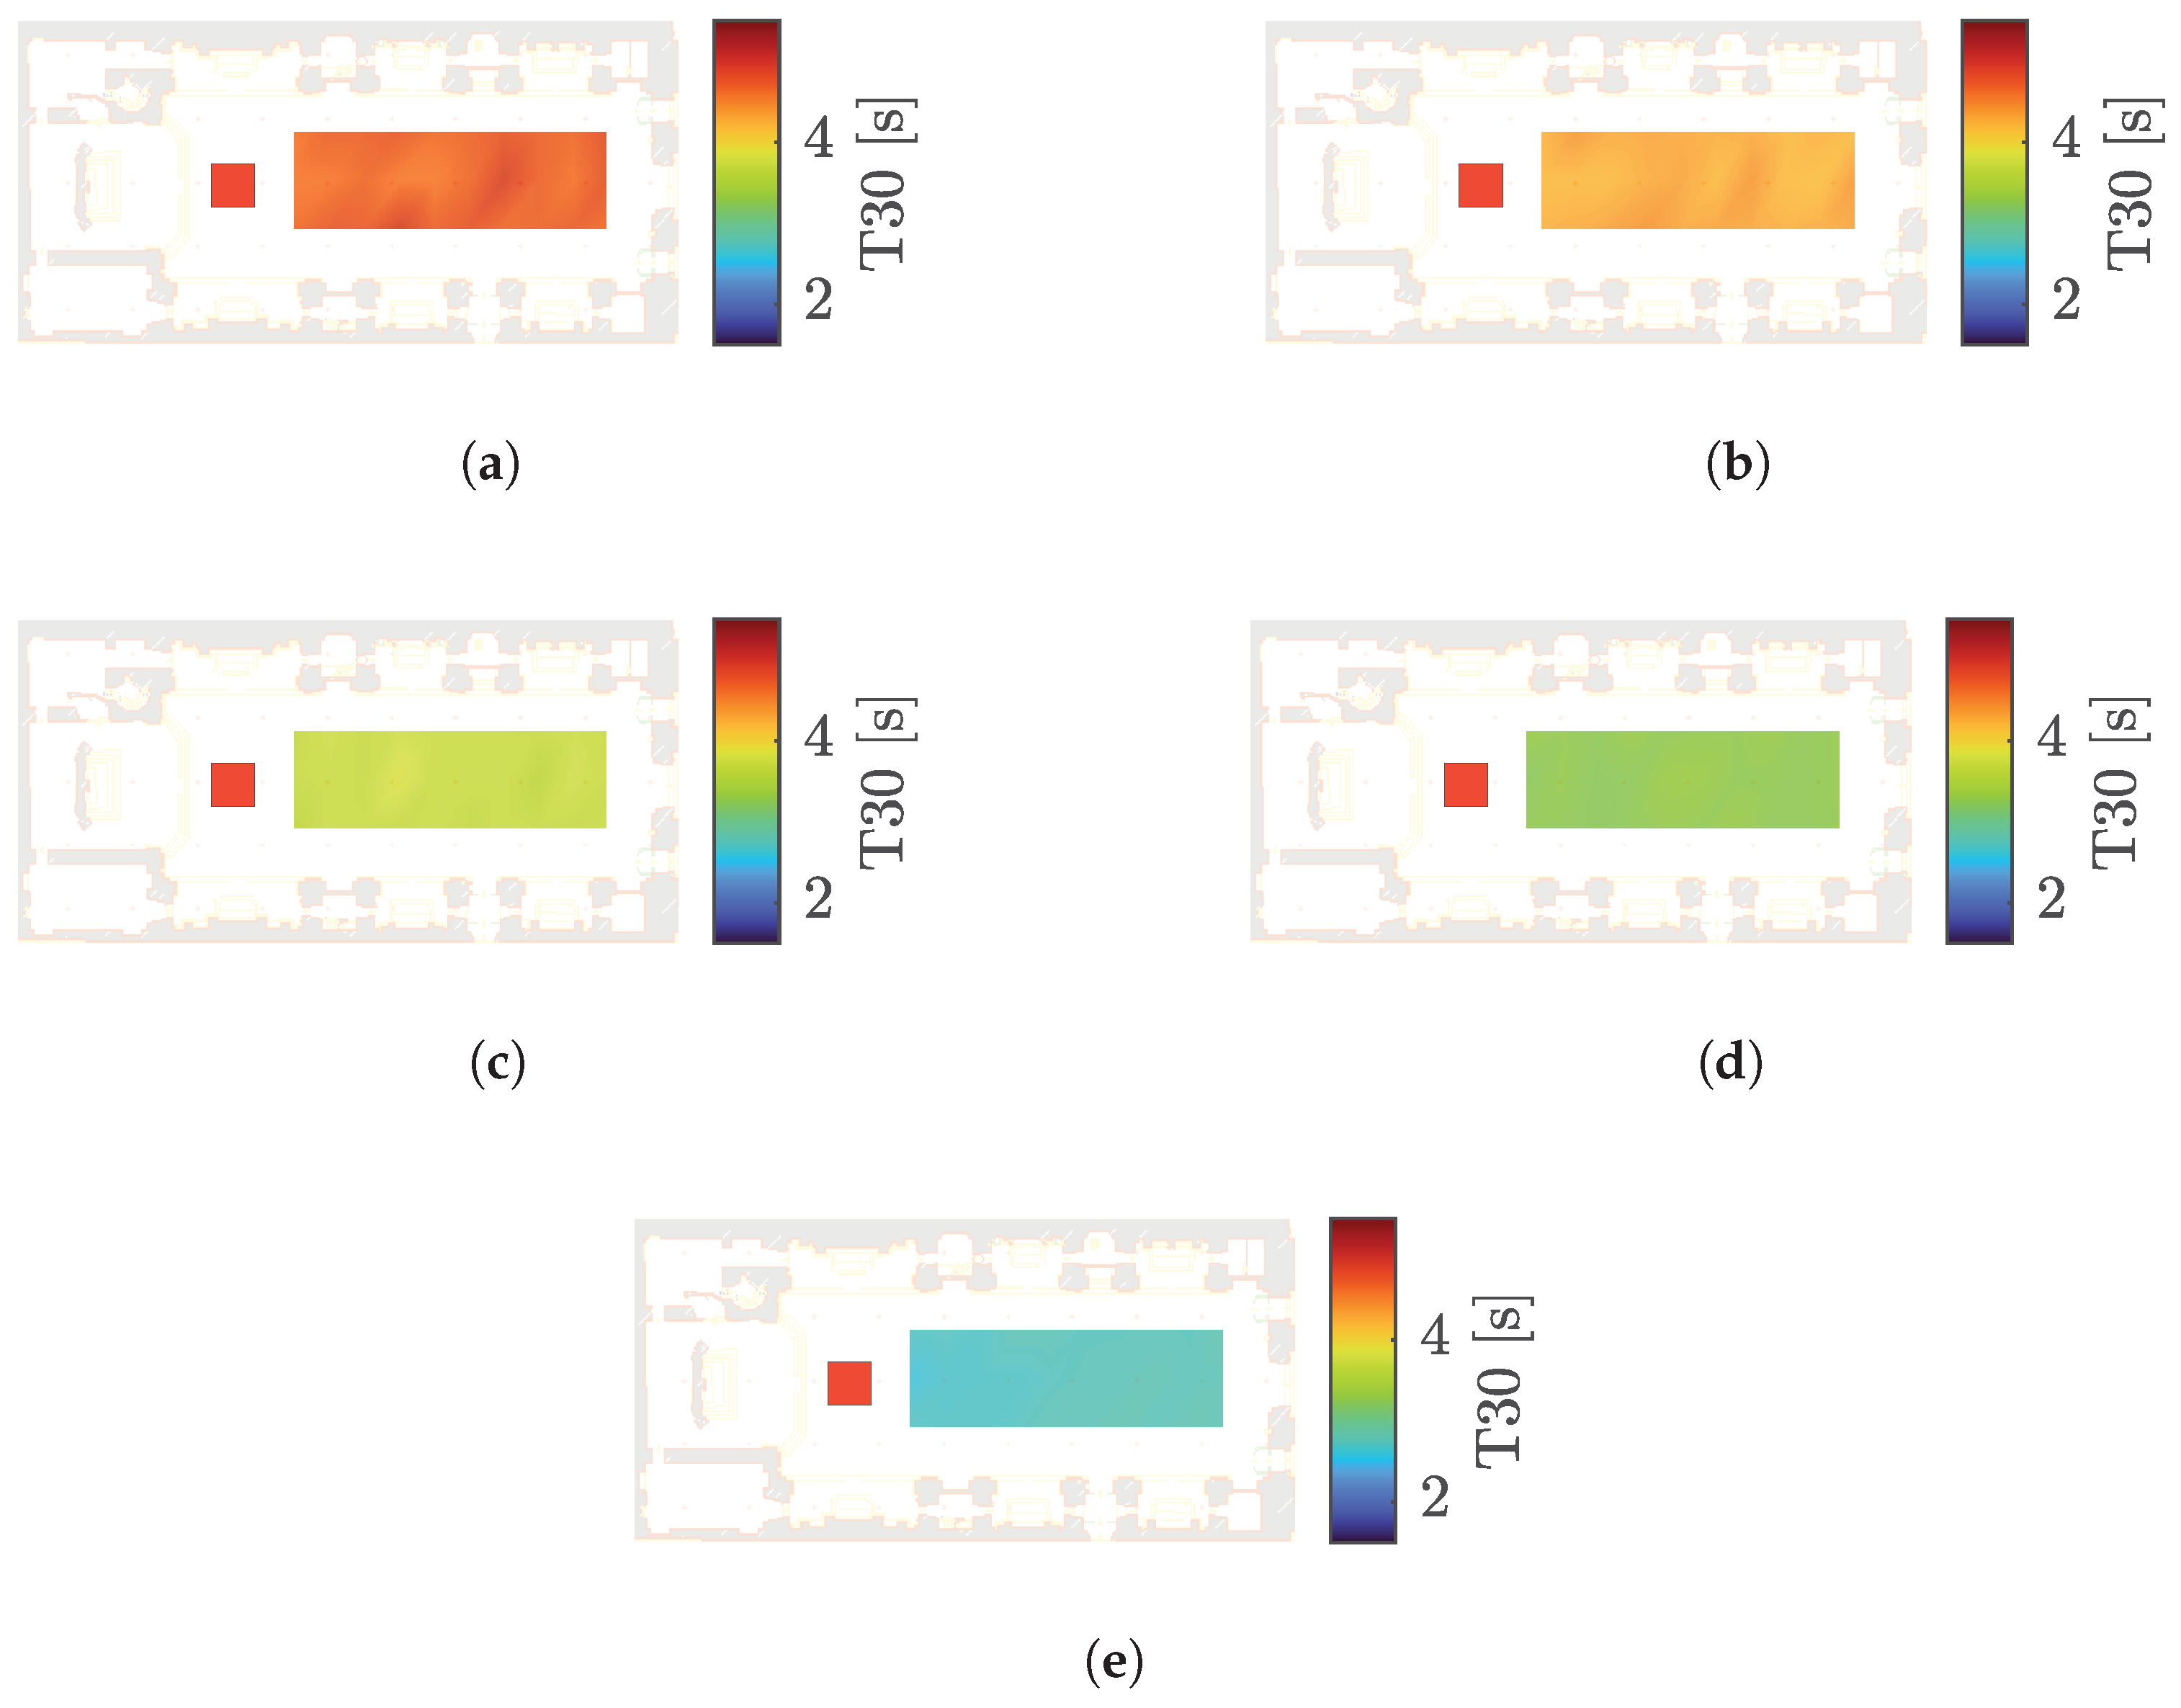
The high EDT values observed in the first subplots of Figure 7 and Figure 9 are confirmed by analyzing the reverberation time T 20 (Equation (3)) in Figure 8 and Figure 10 as well as T 30 (Equation (4)) in Figure 11 and Figure 12. In particular, the mid-low frequencies are those showing the highest values, indicating that these frequency ranges would require more specific acoustic treatment to improve the room acoustic response.
We omit the 125 Hz octave band T 30 map in Figure 11 because the noise level in said frequency band is too high to observe the full 30 dB energy decay. As a result, the T 30 calculation is considered unreliable for this band. We also remind the reader that the T 20 reverberation time, Equation (3), is used for the Bass Ratio calculation, as shown in Equation (6).
Optimal values for Clarity ( C 80 ) (Equation (5)) in a concert hall should range between 4 dB and 1 dB, as indicated in [39]. The results depicted in Figure 13 approach quite well these values, although in some areas, especially in the rear rows, the measured values are below the expectation, resulting in a lack of clarity due to acoustic dispersion along the large nave.
The Bass Ratio (BR), instead, is calculated as shown in Equation (6), and its ideal values should be in between 1.1 1.25 [39]. However, as shown in Figure 14, we observe a critical zone where values exceed the expected range, indicating a more pronounced reverberation at low frequencies. Indeed, higher Bass Ratio values are observed near the lateral chapels particularly in the rear part of the church. In these areas the values lie marginally above the range suggested in [39] and it is clear that low-frequency reverberation slightly dominates over high-frequency reverberation, a characteristic that, while requiring careful control, should be partly preserved to maintain the warm acoustic quality typical of spaces designed for musical performances.
In Table 4 we present the global broadband values, obtained by averaging the measurements across all receiver positions using the central source for the parameters EDT, T 20 , T 30 , C 80 , and BR, while the values for LEF include the contributions from all three sources.
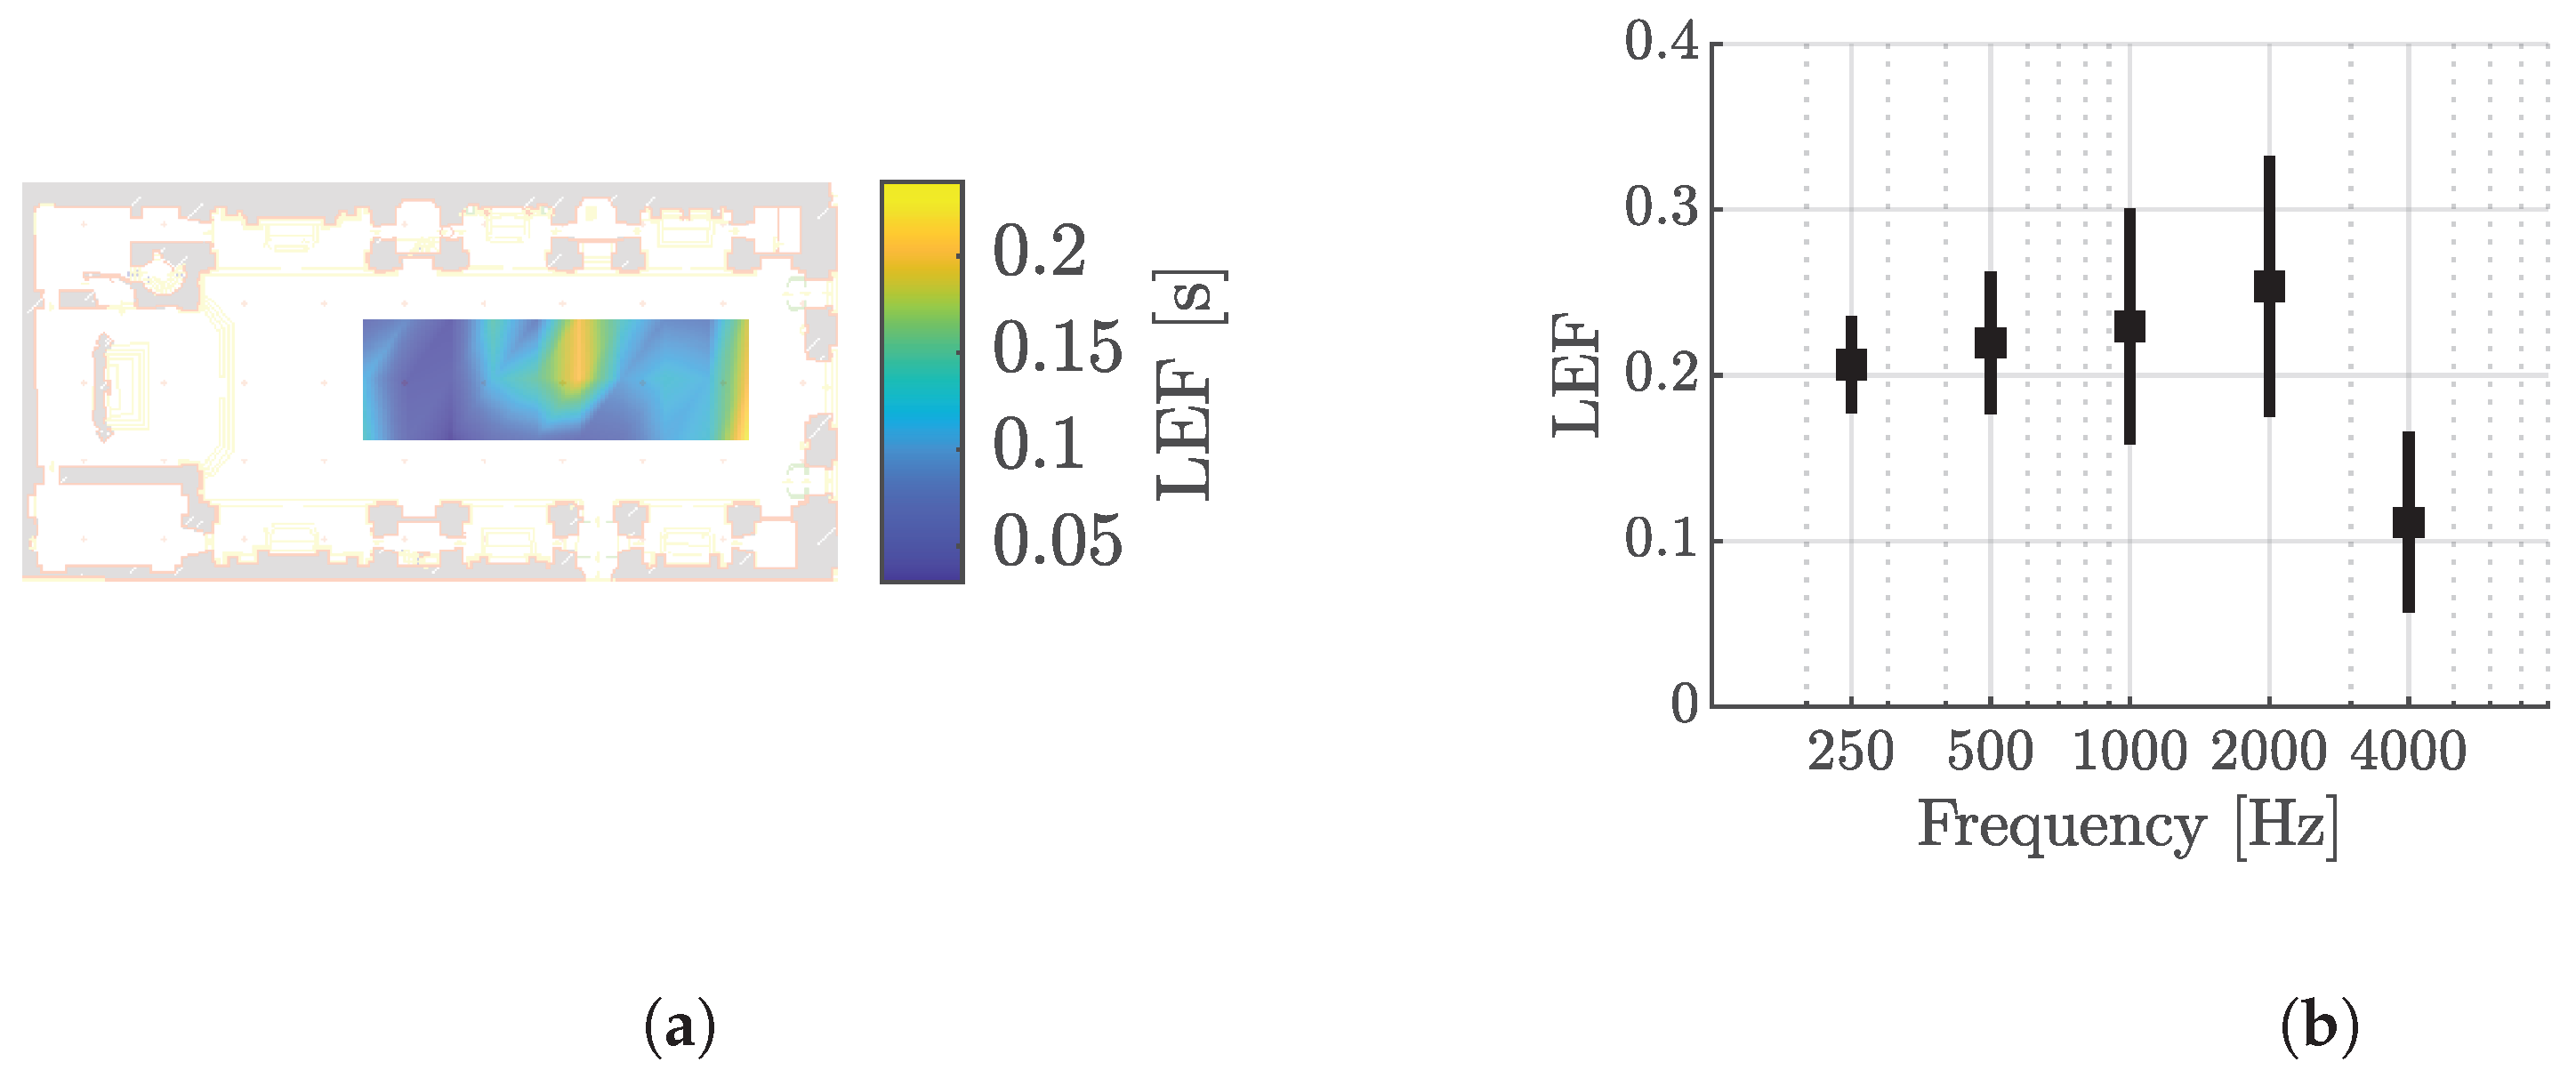
The obtained Lateral Energy Fraction (LEF) values, computed following Equation (7), indicate a good level of overall sound envelope, as shown in Figure 15 and Figure 16, and are close to the ideal value of 0.2 , as suggested in [39]. However, in some areas, we may still state that modifications are needed to improve the metric, likely due to strong sound reflections caused by the rear wall of the nave and the lateral galleries.
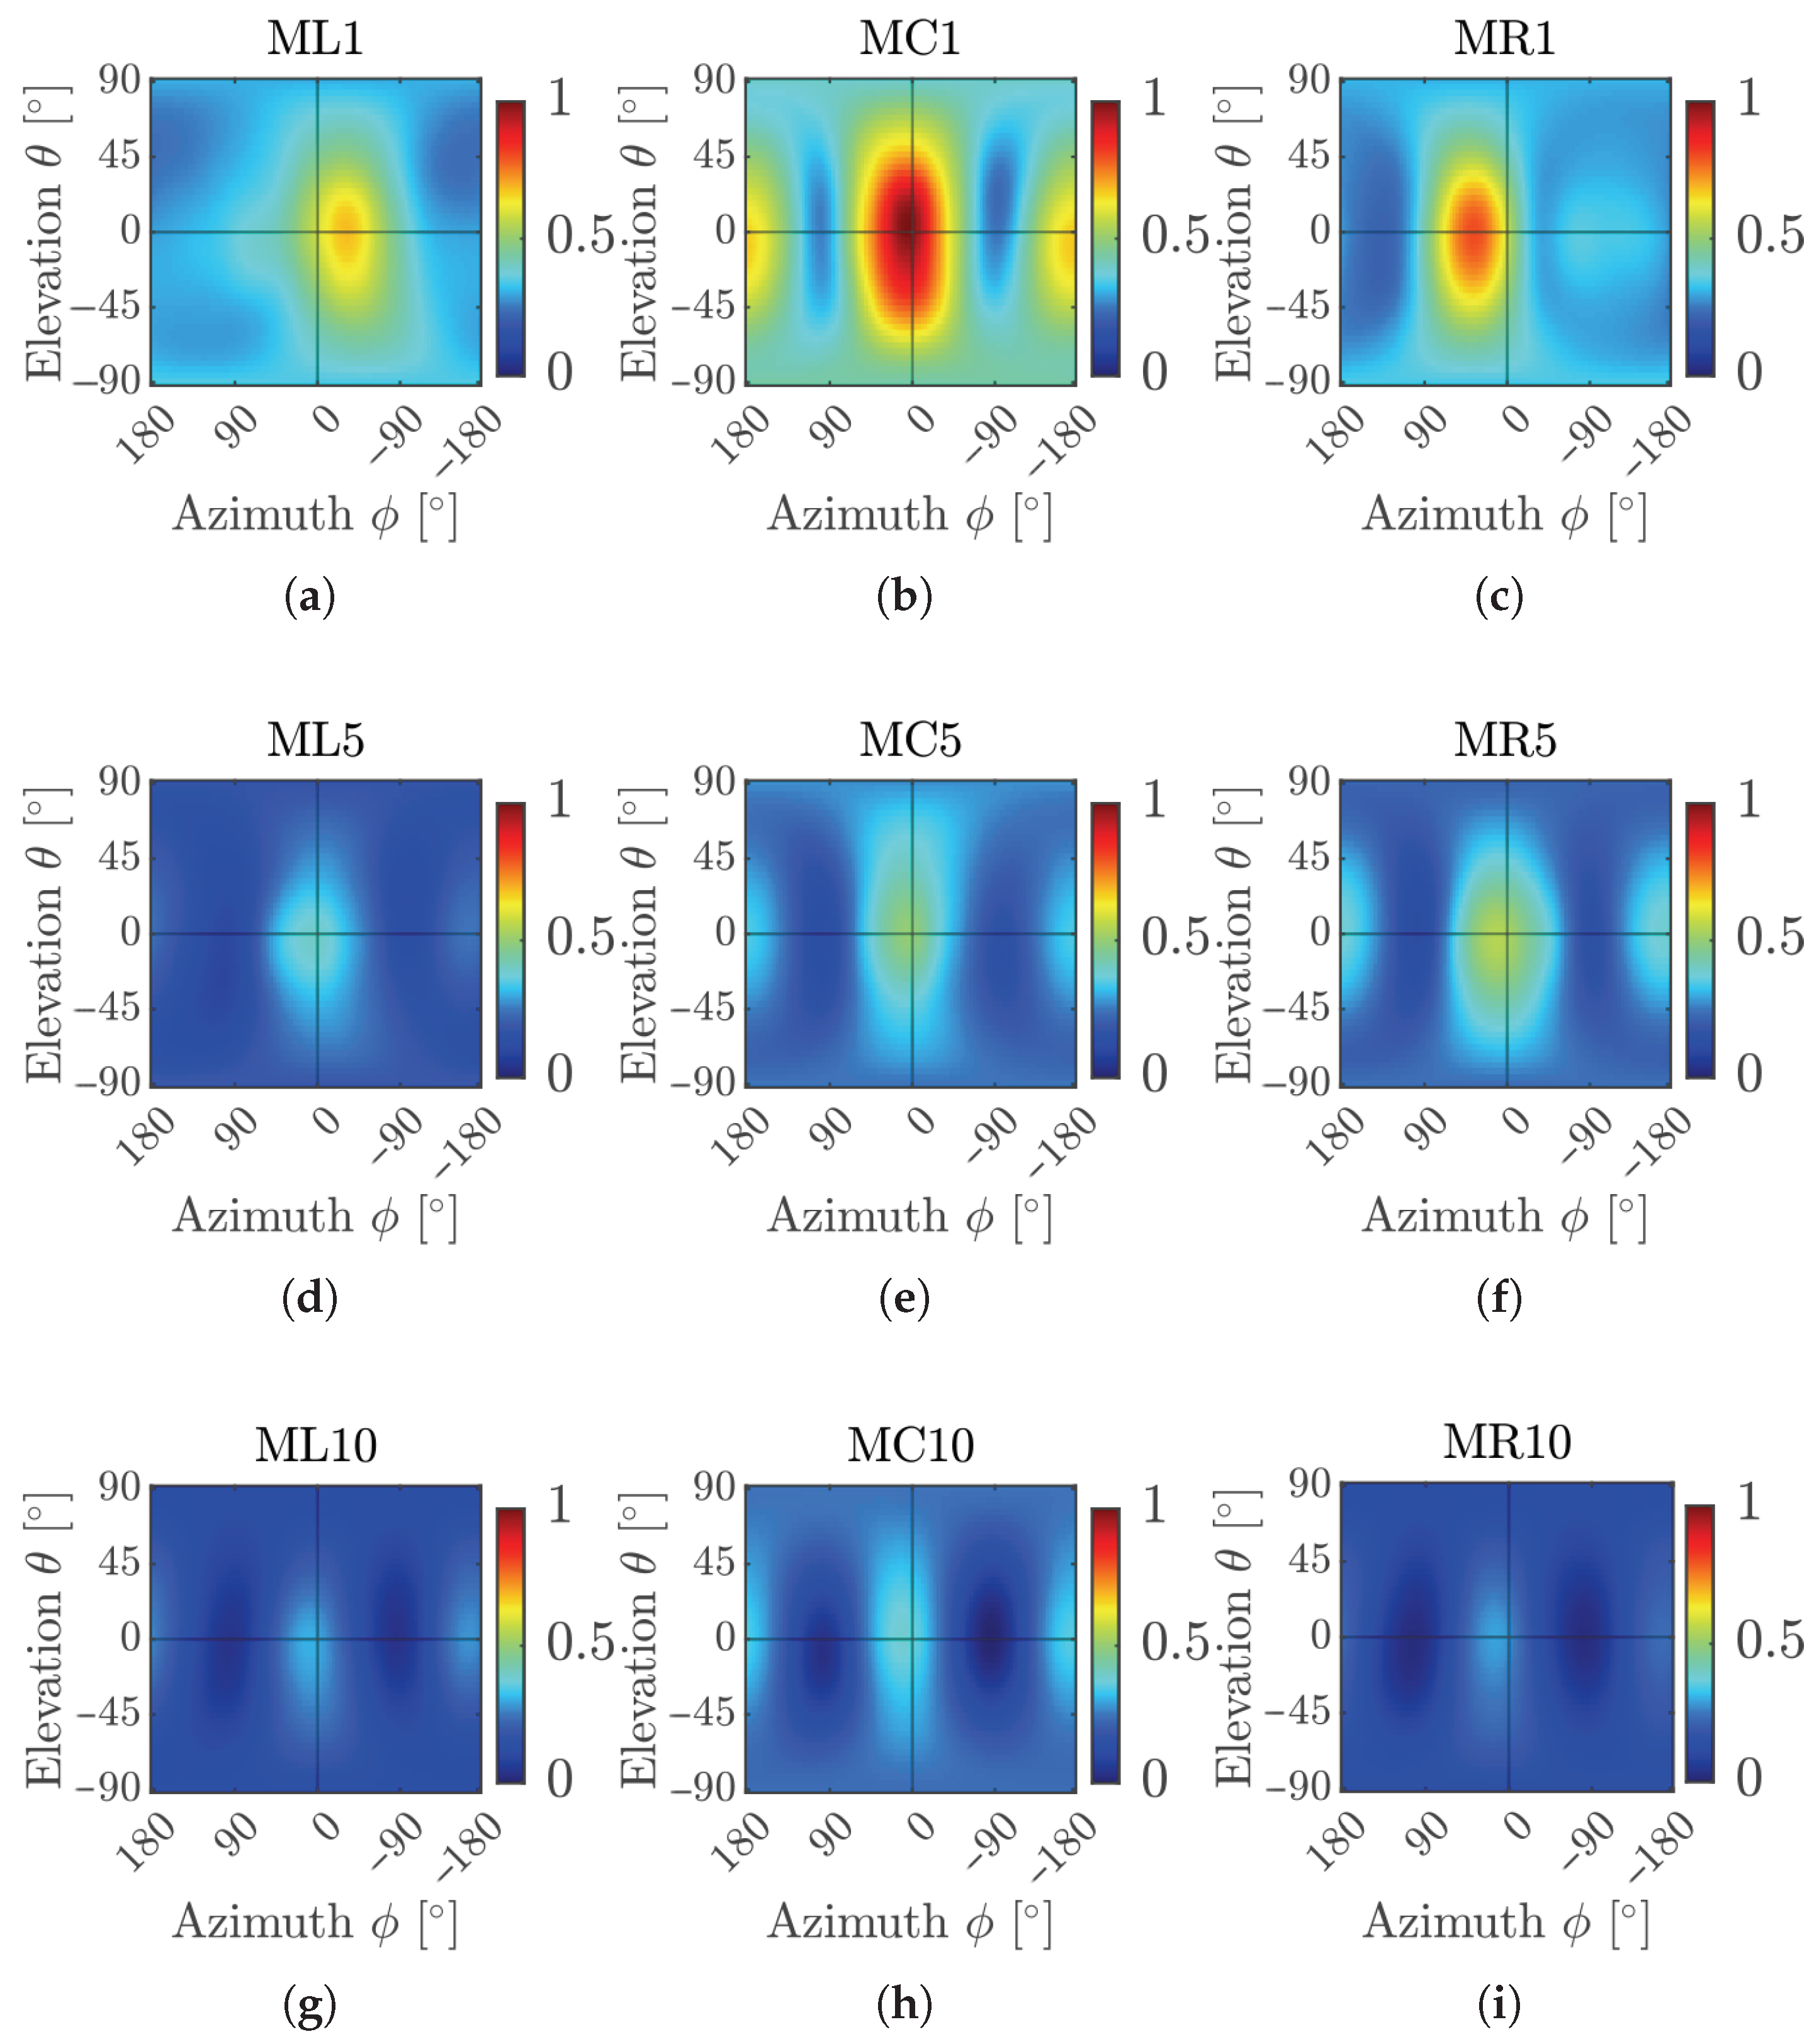
Figure 17 reports the pseudo-spectra computed using the maximum directivity beamforming algorithm [63]. Each plot corresponds to a specific microphone placed in a different row and column. Both Figure 17 and Figure 18 show only the results of measurements performed using the central source, but analogous plots can be drawn for the other sources. The subfigure titles refer to the positions shown in Figure 4: ML refers to measurement positions in the left column, MC in the central column, and MR in the right column, whereas the number indicates the particular row. Hence, Figure 17 illustrates the energy distributions measured in rows 1, 5, and 10, representing the row closest to the source, a middle row in the nave, and one toward the back of the nave, respectively. Reflections from the back are particularly evident in the plot corresponding to the central microphone in the last row, Figure 17h, i.e., the one positioned at the very end of the nave, as well as the right column microphone number 5, Figure 17f. These positions are likely affected by the presence of the vertical wooden surface near the back wall of the nave.
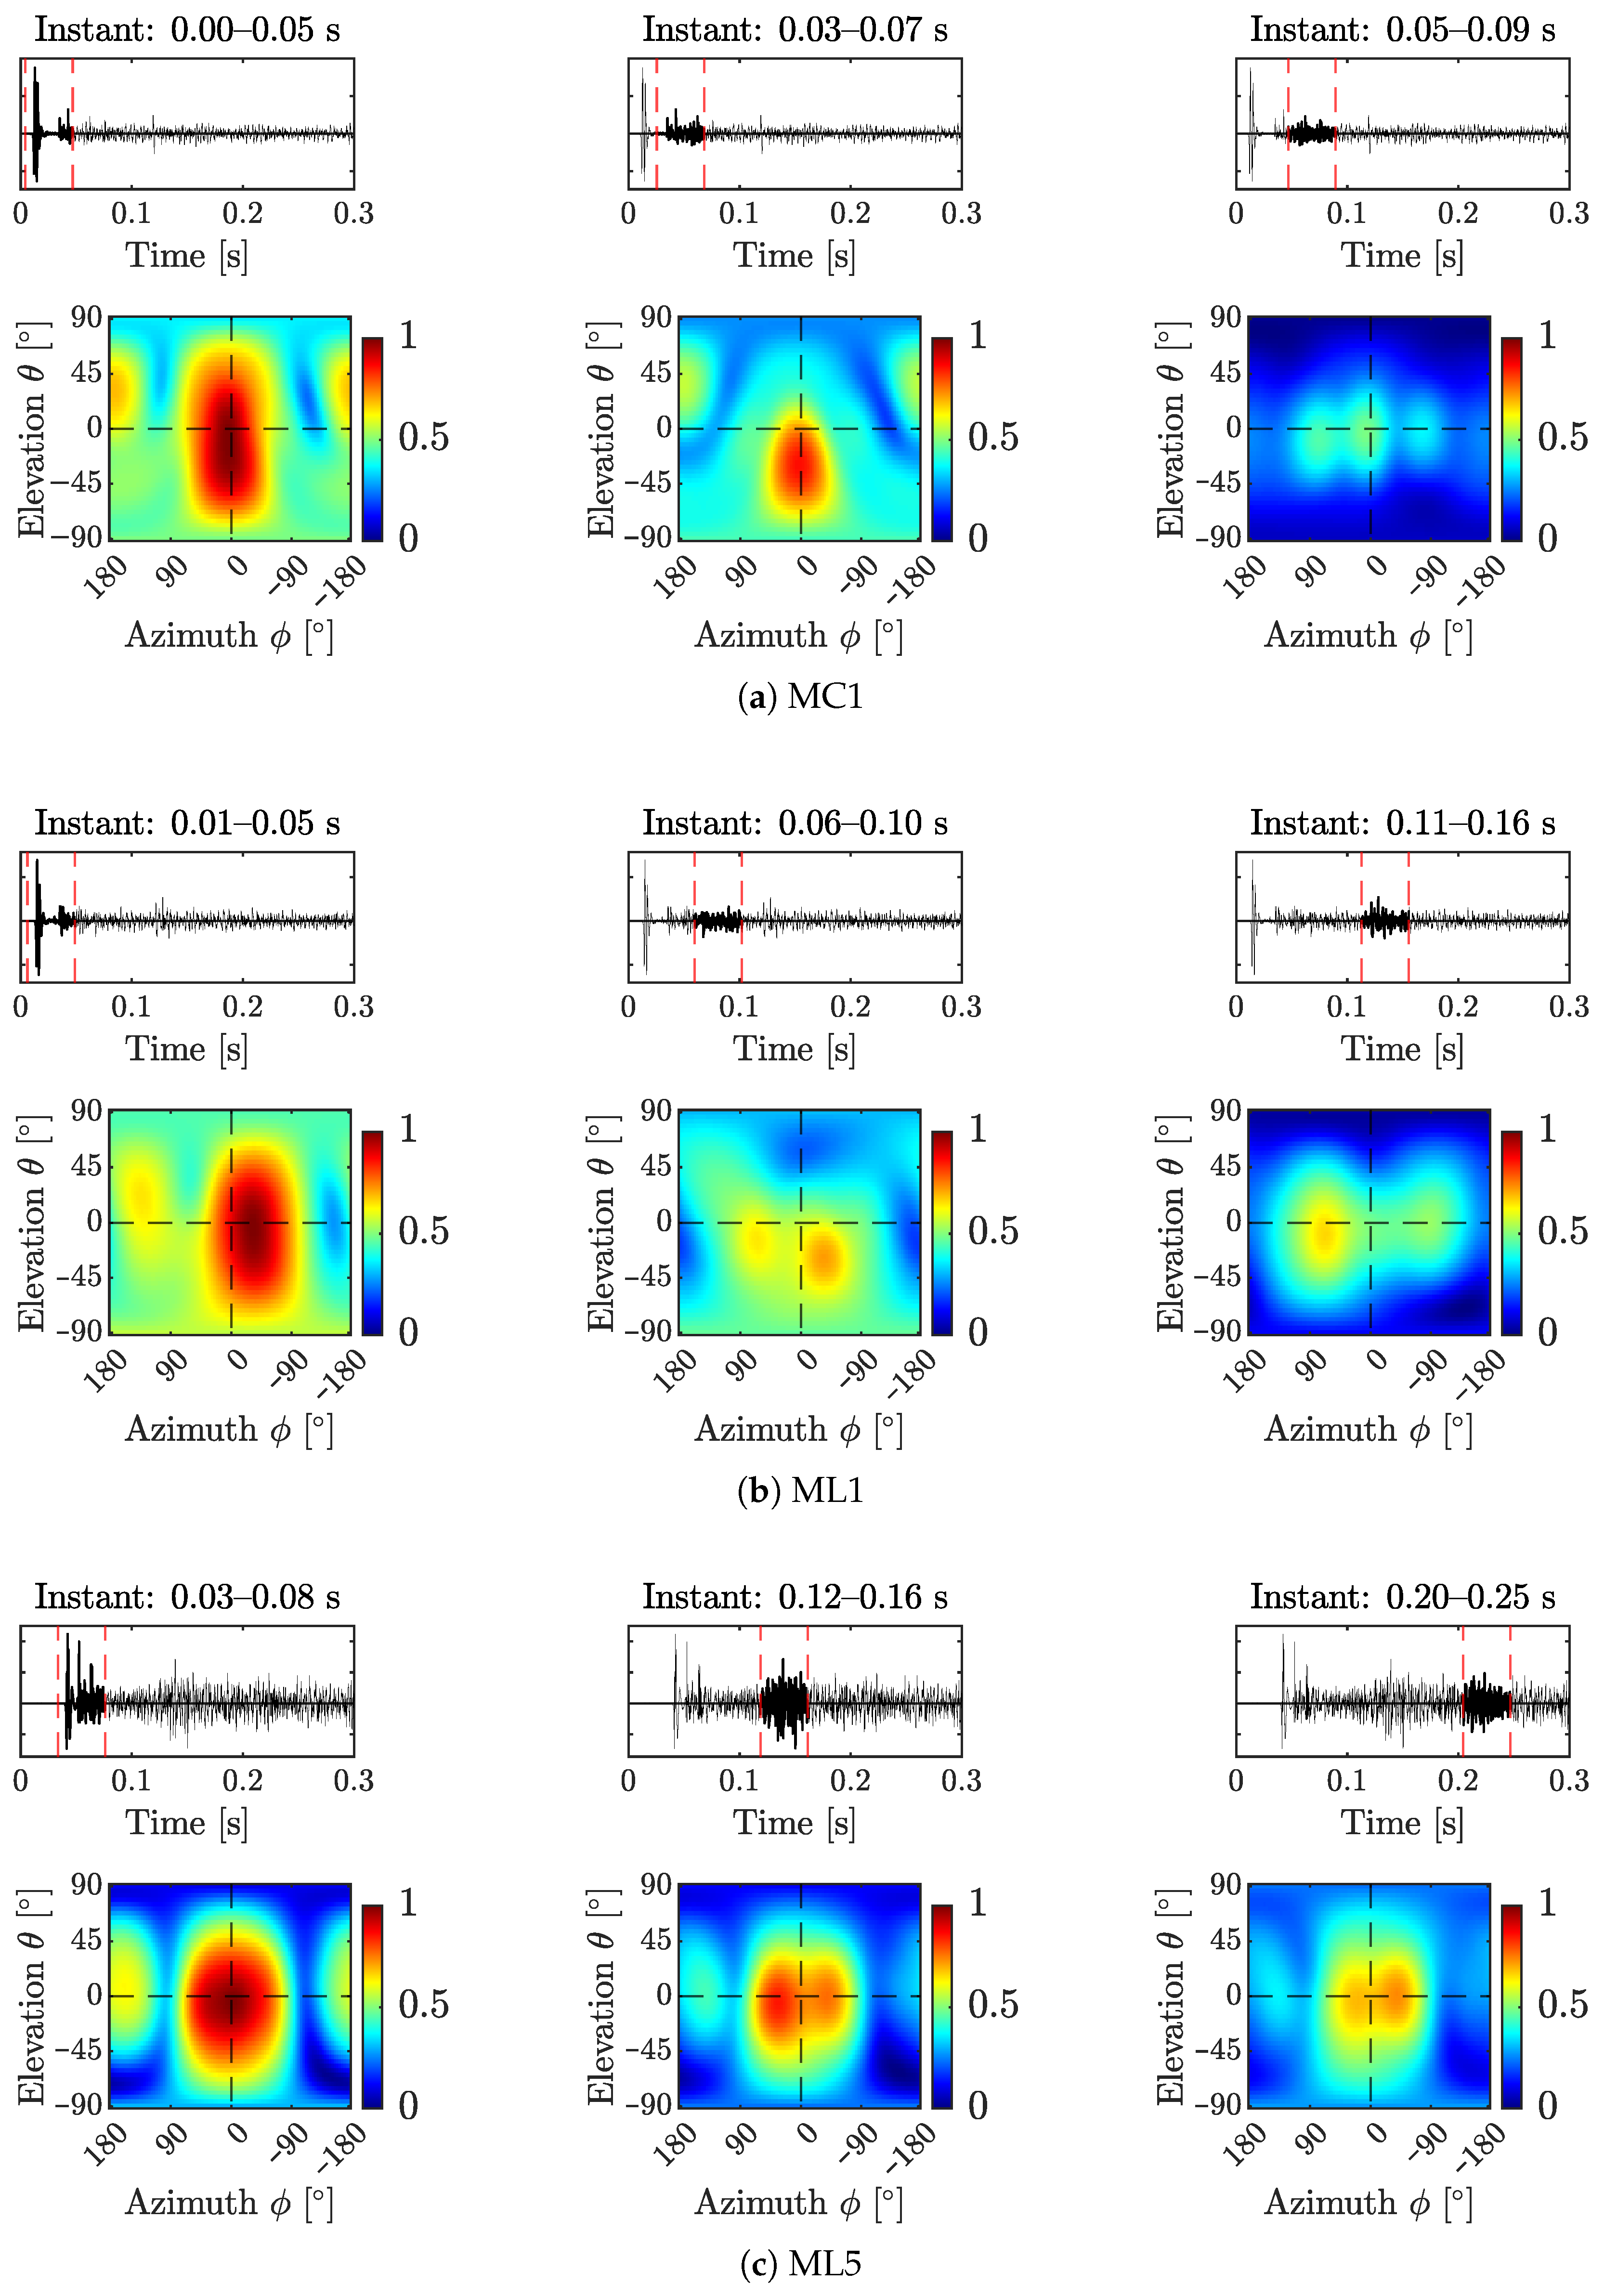
As highlighted in [64], the intensity of listeners’ emotional response is highly subjective and depends both on personal taste and the analytical processing each individual performs during listening. However, it is acknowledged that the presence of lateral sound energy, generated by acoustic reflections, significantly contributes to creating an immersive experience and enhancing the emotional impact of music [43,64,65]. Analyzing our context, the temporal evolution of the sound energy distribution around selected receiver positions, as shown in Figure 19, allows us to observe how the energy is localized over time. The analysis through pseudo-spectra is computed on windowed signals with a window length of 2048 samples and 512 samples overlap. After selecting the central source, positions MC1, ML1, and ML5 are chosen for their distinctive characteristics: MC1 is directly in front of the direct sound source, ML1 is located next to the transept while ML5 is near a lateral chapel. The focus on these positions aims to investigate the contribution of lateral energy, which often originates from adjacent volumes such as lateral chapels or the rear and side walls of the hall. Importantly, the lateral or rear energy should not exceed the intensity of the direct sound to avoid unwanted resonances or echoes; the goal is to achieve a balanced sound field that enhances sound surround without introducing distracting acoustic artifacts. Figure 19 shows that the pseudo-spectra of the windowed signals at specific time frames contain relevant acoustic information. For each representation, the corresponding time window is indicated, and the related portion of the impulse response is shown, with red vertical lines marking the boundaries of the analysis window. The microphone labeling in Figure 19 follows the same nomenclature described in Figure 4. The image corresponding to position MC1, Figure 19a, as expected, shows the greatest energy concentration along the central direction. Nevertheless, significant energy levels are also observed arriving from the direction of the floor, starting as early as the first 5 ms. For position ML1, as shown in Figure 19b, the energy arriving from the transept, on the left side, clearly emerges in the time window between 0.11 and 0.16 s. In position ML5, Figure 19c, the lateral contribution is less clearly distinguishable from the direct sound. The dominant energy visually merges into a broader angular region, extending up to 45° to the left of the receiver. However, from time instances following 0.12 s, distinct energy peaks become more clearly defined and separated. It is interesting to observe the differences in the temporal distribution of energy between positions ML1 and ML5. In the former, energy arriving from the transept zone reaches the measurement point predominantly after approximately 0.08 s. In ML5 the lateral energy contribution associated with the side chapel produces less pronounced effects, yet these occur more simultaneously with the arrival of the frontal energy. Therefore, it is not only the location of the reflective and re-emissive surfaces that defines the acoustic characteristics of the space, but also the arrival timing of these contributions and a combined understanding of these aspects is essential to fully grasp the acoustic peculiarities of the venue.
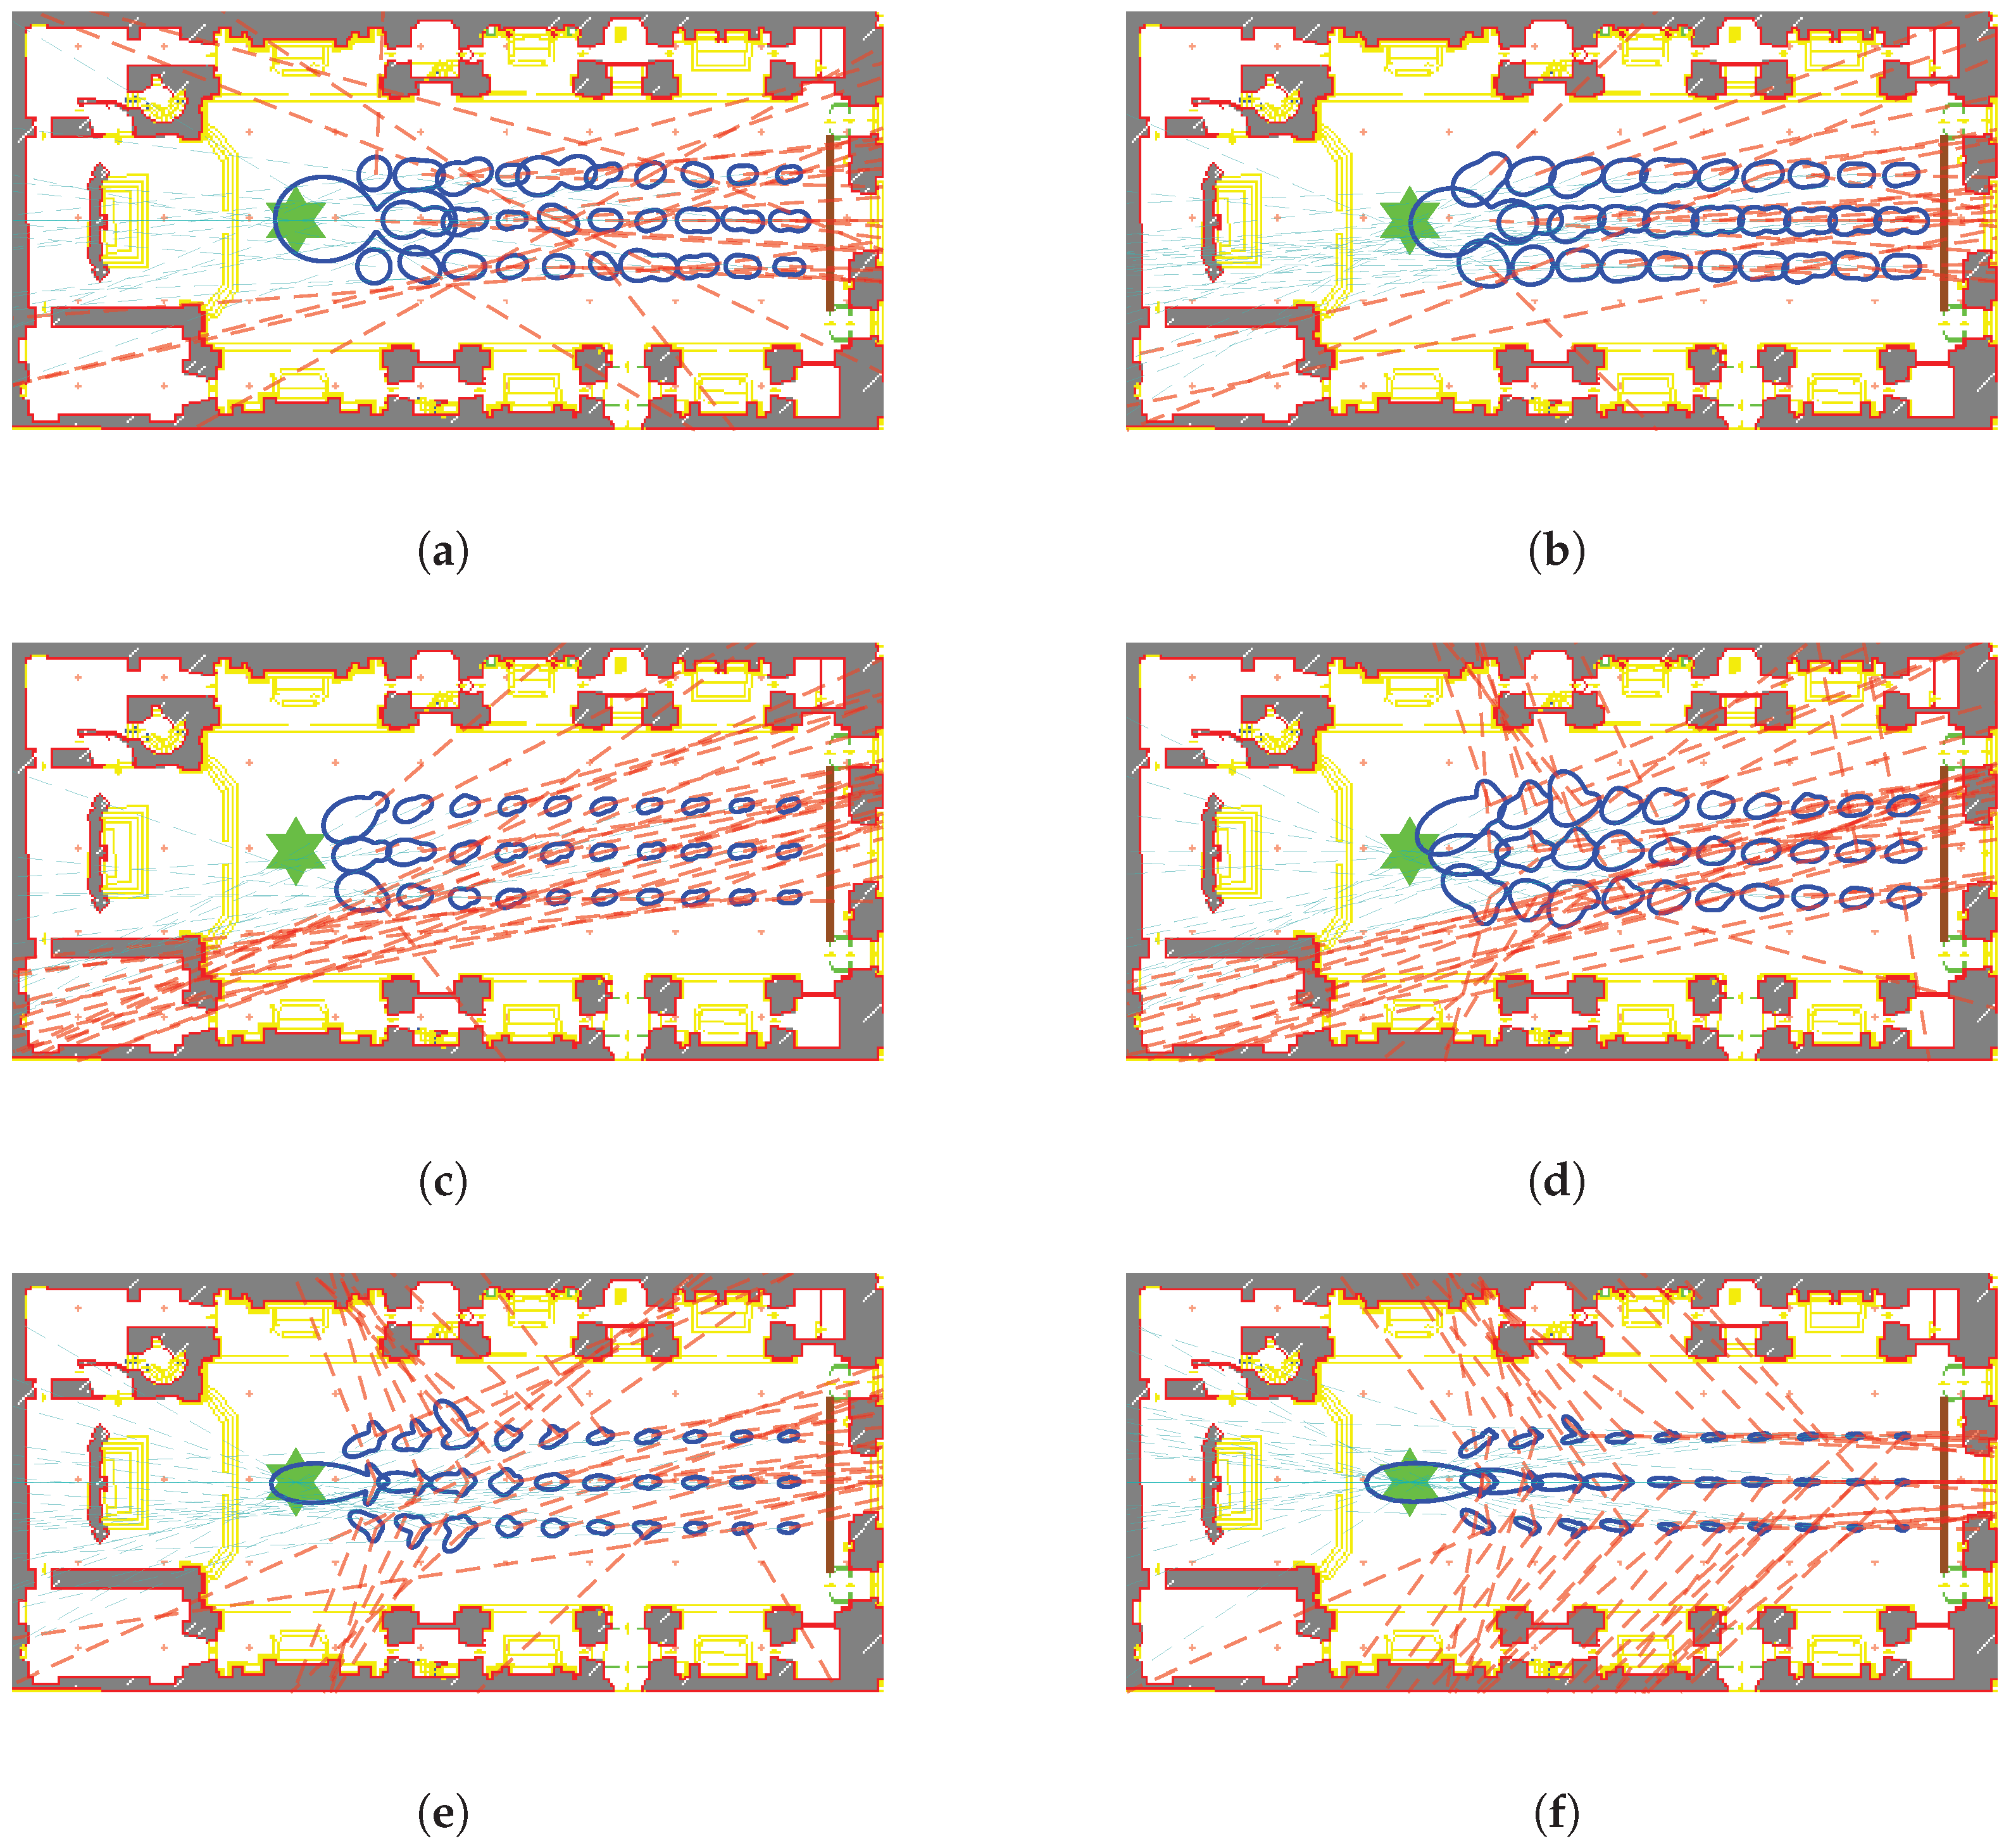
The plots in Figure 18 show, instead, the angular sectors where the main sound sources are localized. The polar plots, depicted in blue, highlight the areas of greatest energy based on the major lobes. The dashed lines pass through the center of these angular sectors and point towards the direction of the main and secondary sound sources. In particular, the main sound sources, represented by light blue lines, are all oriented toward the sound source, while the red lines indicate the energy coming from the surface reflections. The direction of the red lines is of particular interest for the acoustic analysis, as they allow us to draw useful conclusions about the dominant reflecting surfaces within the space. These plots provide similar information to that shown in Figure 17 but offer a more precise way of identifying critical areas with respect to the church floor plan. If reflection zones cause excessively high energy levels, they may result in confusion and disturbances in the perception of sound direction. This occurs because reflections interfere with the direct sound, compromising both clarity and localization. From the data shown in Figure 18, it can be inferred that the rear wall should be given attention in the acoustic treatment, as already pointed out by the measurements of LEF and BR. Moreover, looking at Figure 18, we can see that, for specific frequency bands, sound rays tend to concentrate near the back of the church, the transept, and the side chapels. These areas indicate the presence of resonant recesses that may affect the acoustic quality of the environment. Therefore, we will propose acoustic adjustment in these zones to enhance sound clarity and reduce the impact of undesired reflections.

3.2. Proposed Solutions

In this subsection, we show the results obtained through simulations in Odeon to solve the problems highlighted by the analysis presented in the previous subsection. In all the proposed solutions, we simulate the presence of the audience and of the wooden stage. At the same time, we add to each proposal different installations to gradually improve the church acoustics.
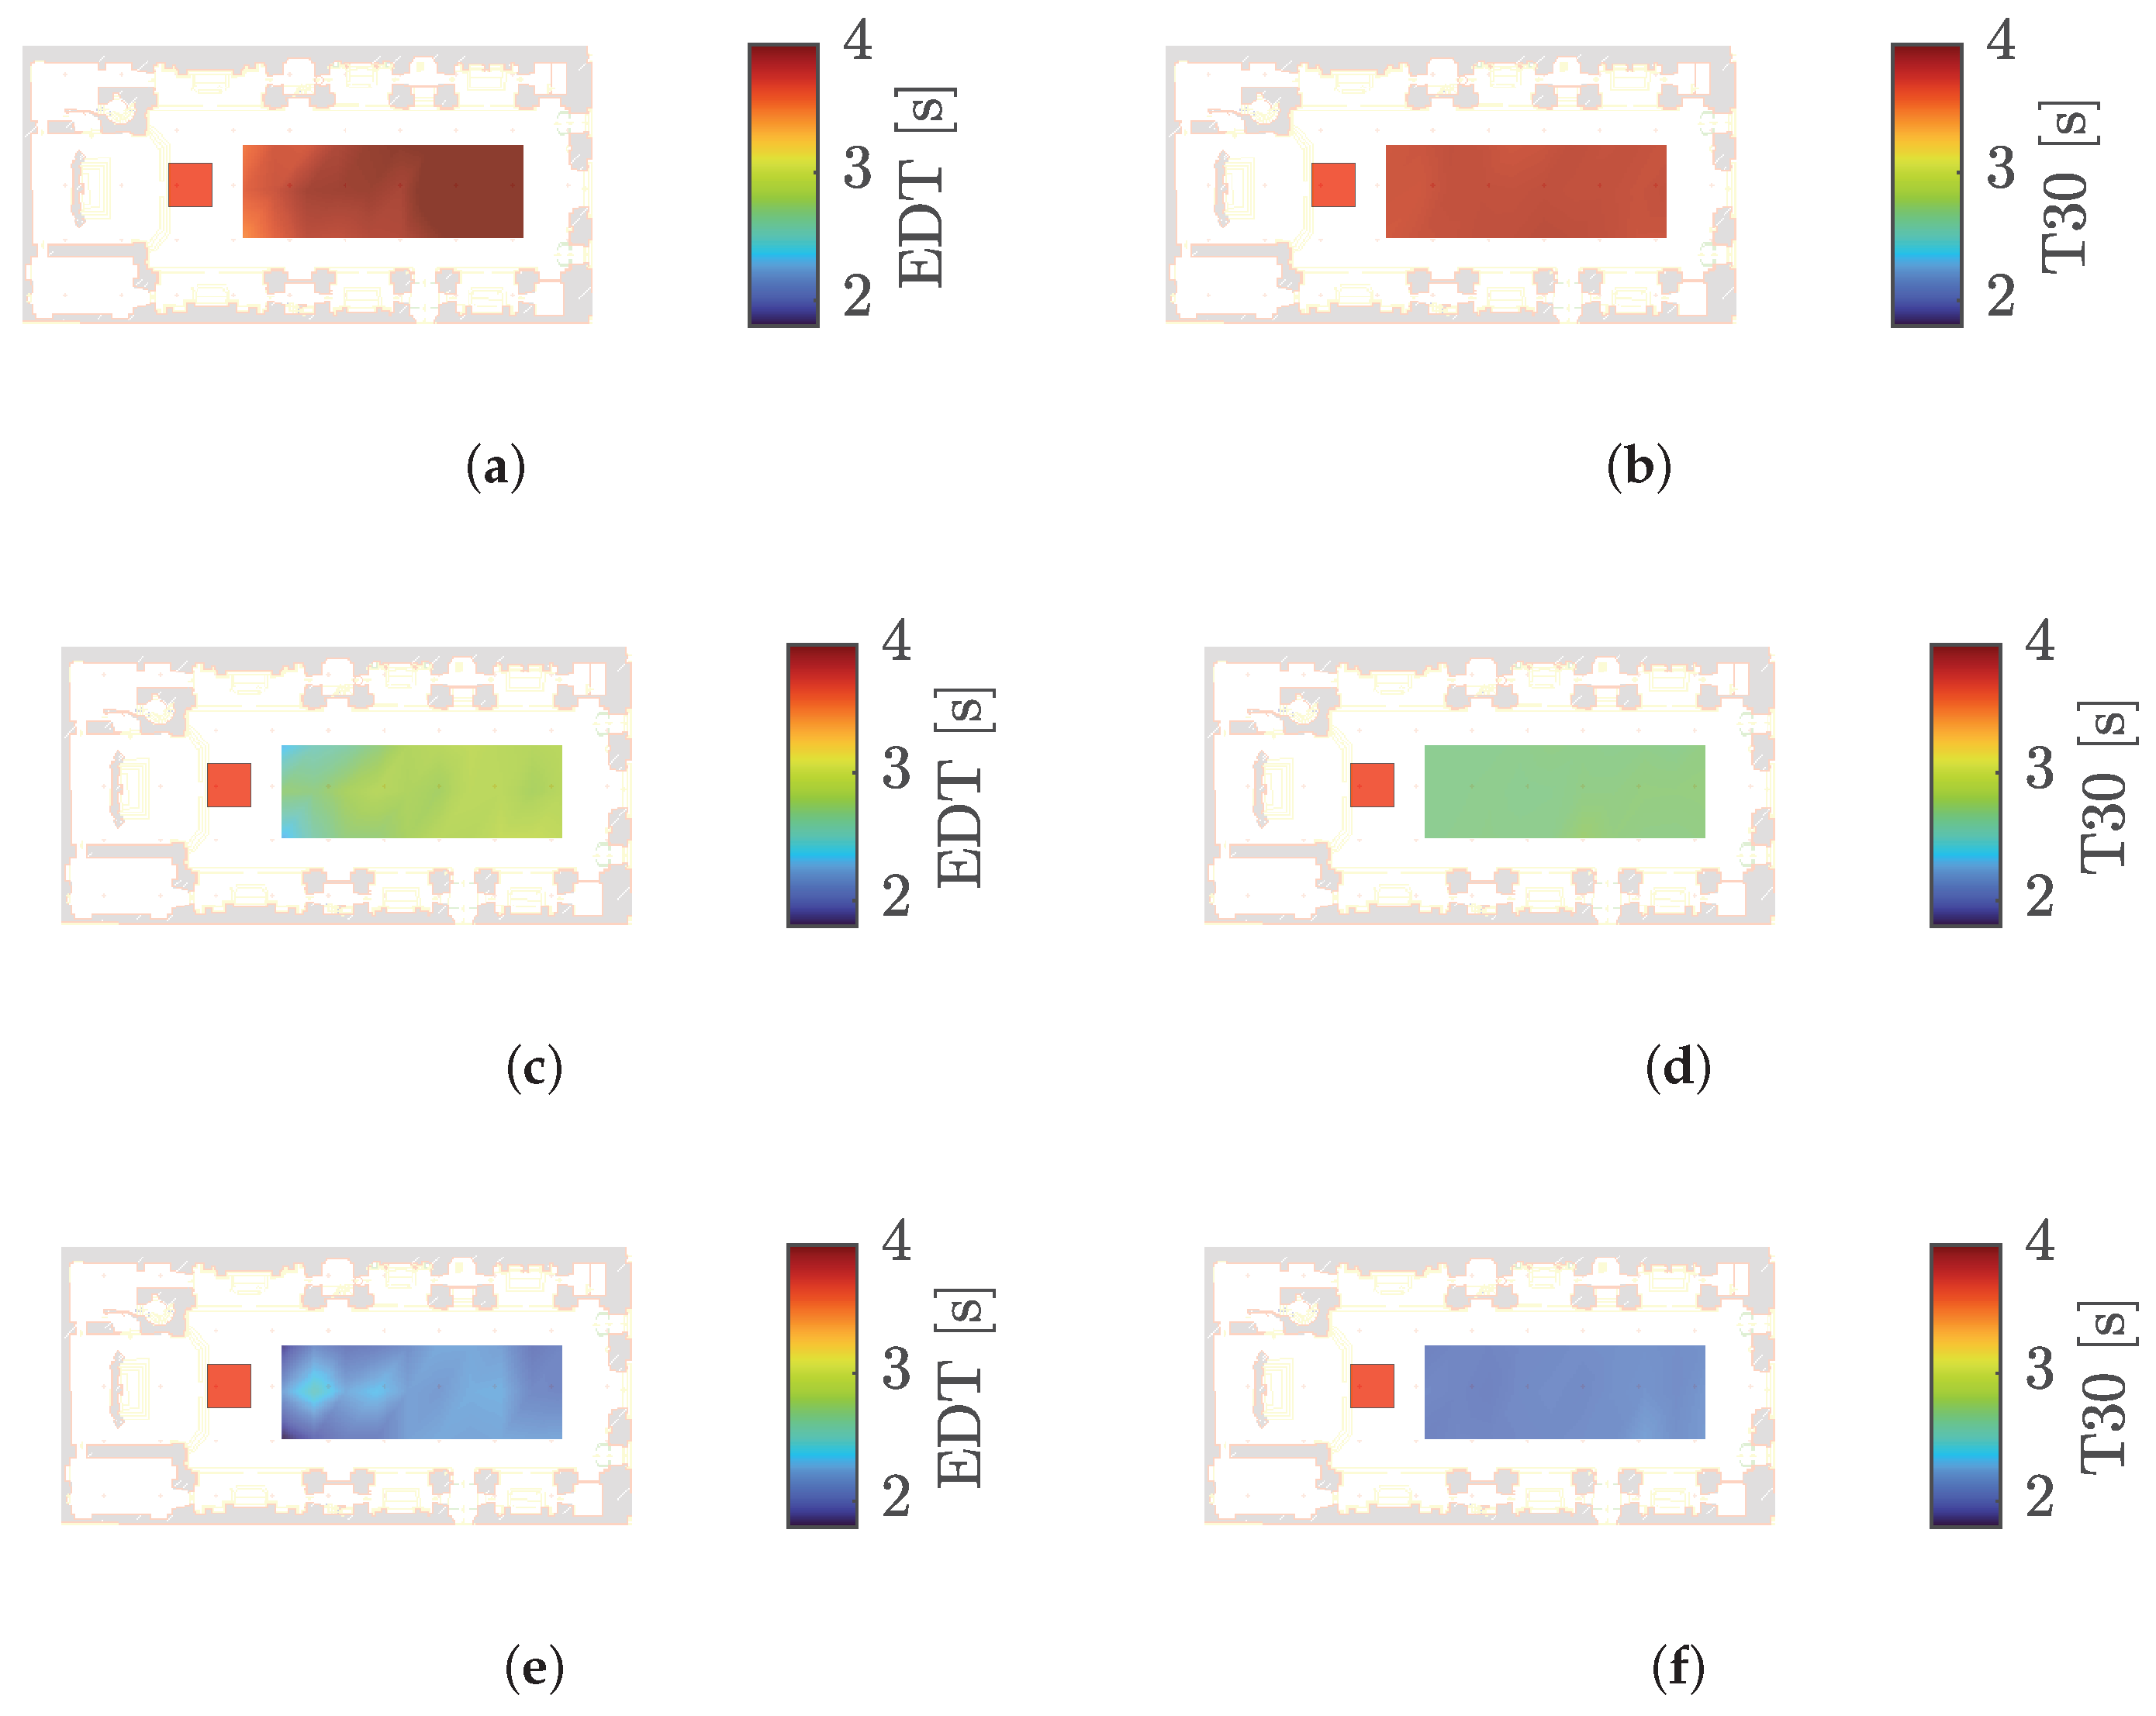
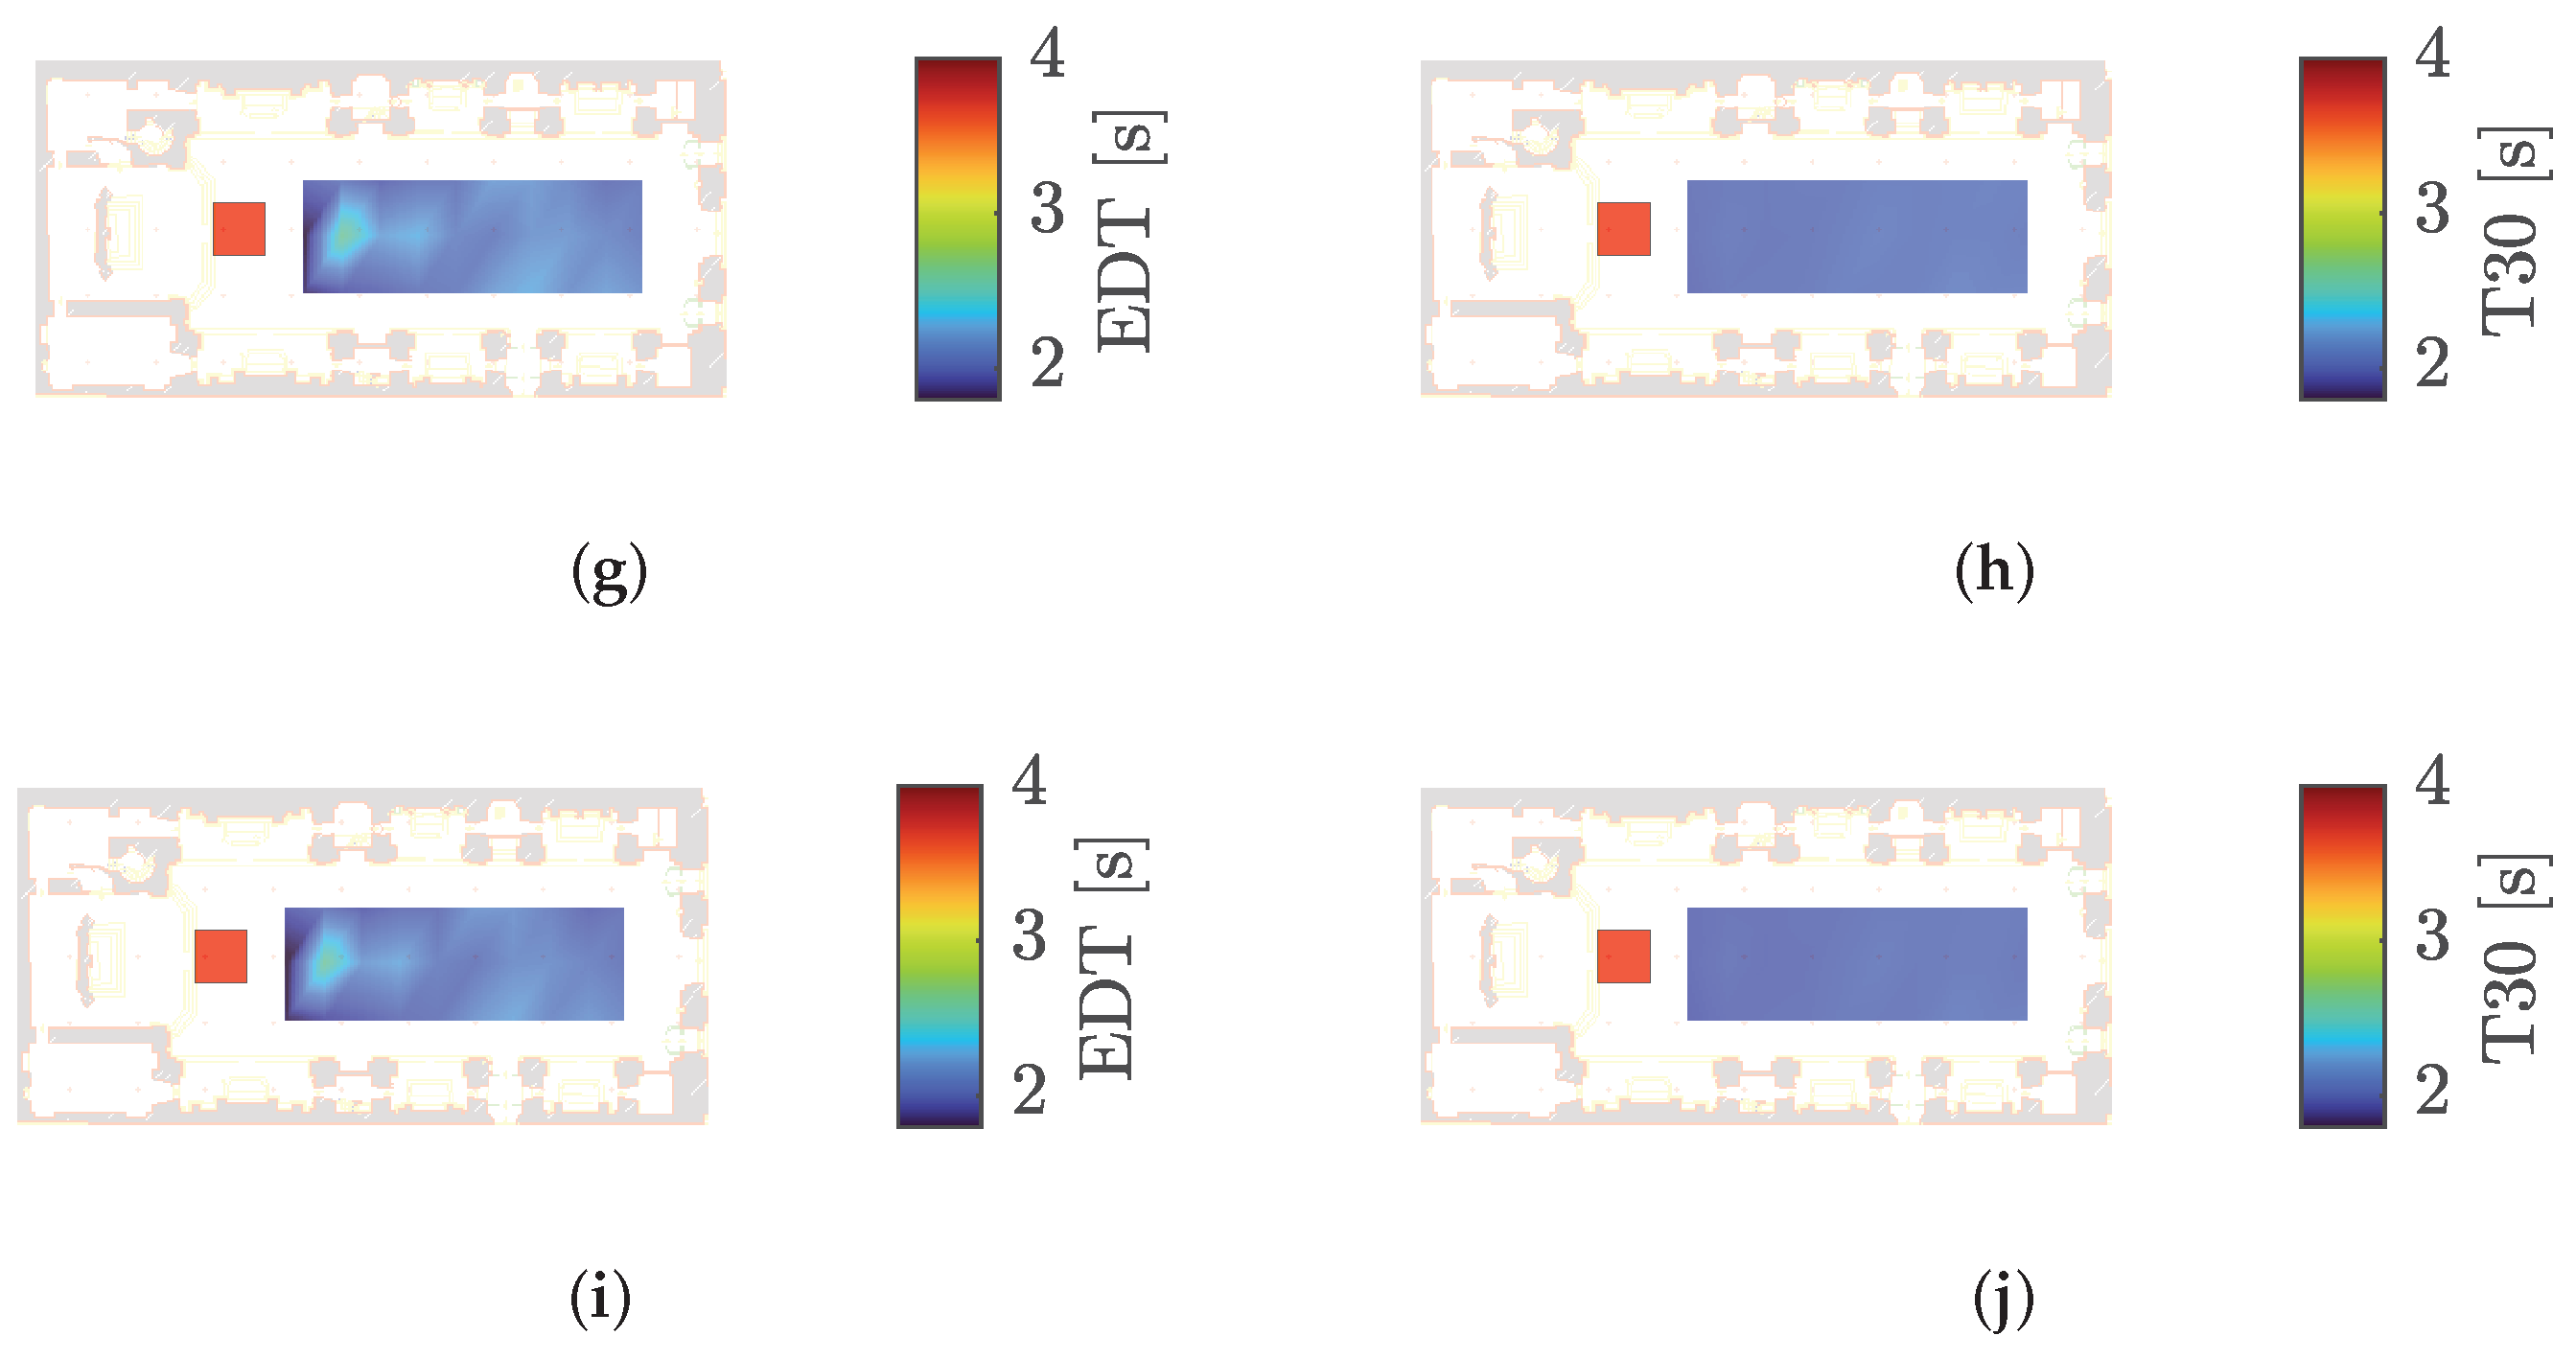
As a first solution, we propose to introduce the LAMM L213 seating elements, as shown in Figure 6a. The second proposal, instead, includes the installation of cotton drapery near the arches facing the lateral chapels and the transept (see Figure 6c), in addition to the seating proposal introduced in the first proposal. The third proposal entails the installation of the acoustic panels depicted in Figure 6g. These elements are introduced in addition to the LAMM L213 seating and the cotton curtains. Finally, in the fourth proposal, in addition to all the solutions presented so far, we introduce the wooden floor.
Figure 20 depicts the EDT and T 30 along the nave, interpolating the values obtained in each measurement point and averaging over the whole frequency range. The red square indicates the position of the omnidirectional sound source. The introduction of seating alone already leads to a reduction in reverberation time values with respect to the original proposal. This minimal yet fundamental adjustment yields results that approach an acoustically comfortable environment. The addition of drapery, instead, leads to a greater improvement of the reverberation time, more suitable for a space oriented to performance purposes, achieving a balanced acoustic response across both low and high frequency ranges. With the third and fourth proposals, which include the addition of panels and a wooden floor, the values of the considered metrics are slightly better compared to the proposal with only seating and curtains. However, as shown in Figure 20, the difference is not particularly significant, except for a slight reduction in values along the nave.
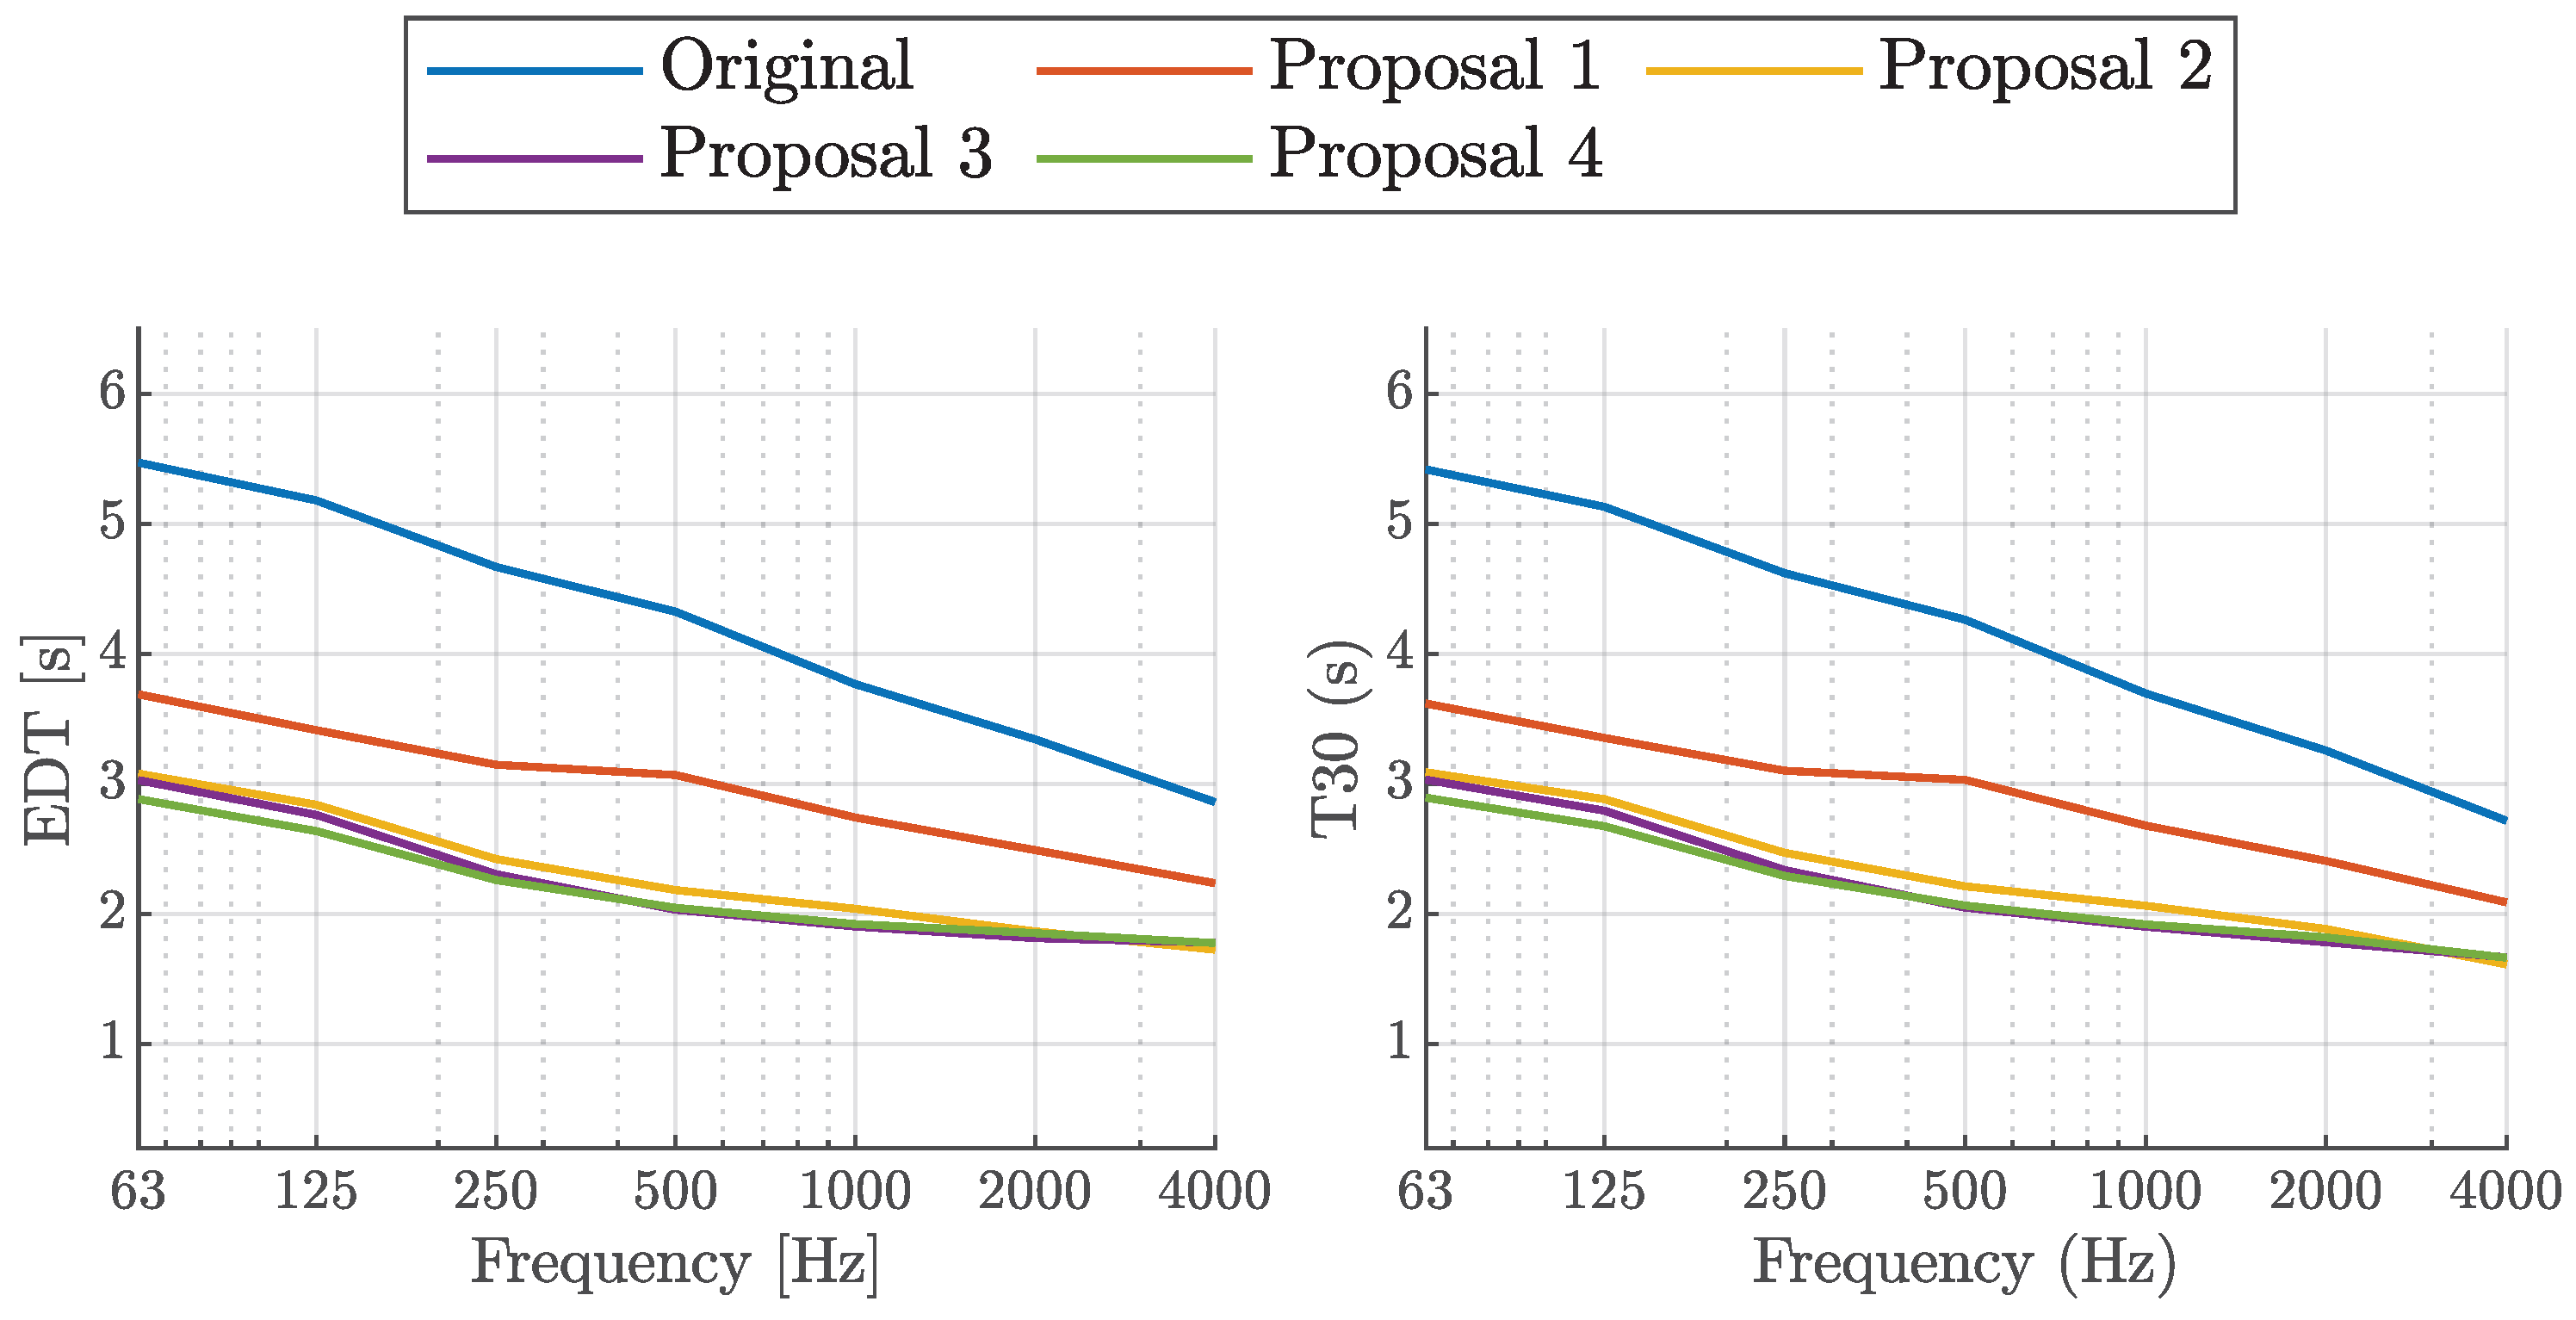
The graphs in Figure 21 illustrate the reverberation time averaged over the positions as a function of frequency, comparing the different proposals with the original simulated condition.
It is evident that there is an improvement in the frequency response with the first and second proposals, the latter providing values that fall within the appropriate range for concert halls. By contrast, the third and fourth proposals show significantly smaller improvements, as they involve more refined and subtle modifications.

4. Discussion

This section summarizes the proposed acoustic treatment solutions, while comparing their features. The aim is to highlight each proposal’s main strengths and limitations in terms of reverberation control, sound distribution, implementation complexity, and overall acoustic performance. The four proposals are structured to progressively address the acoustic issues of the church, starting with solutions based on extensive use of highly absorbent materials, and evolving toward more refined and selective implementations aimed at optimizing specific acoustic requirements. The first proposal involves only the introduction of seating, which proves to be particularly effective in reducing the reverberation time. The simulation assumes the presence of seated people along the entire nave, but even without an audience, the seats maintain high acoustic absorption. This proposal represents a baseline functional solution that already leads to remarkable acoustic improvements. However, this approach does not fully address issues such as frequency balance. The second proposal adds curtains to the seating arrangement, offering a substantial improvement over the first option. Curtains act effectively in further reducing reverberation time, making this proposal a reasonable compromise between implementation complexity and acoustic benefit. The third proposal extends the treatment by introducing acoustic panels and bass traps. While the third simulation shows only marginal global improvements in reverberation metrics compared to the second proposal, better performance is noticeable in the mid-frequency range (see Figure 21, 250–2000 Hz), which could be further enhanced by increasing the number of panels and, thus, the overall absorbing surface. However, the contributions of the bass traps panels have a low impact for the characterization of this environment, which predominantly lays in the statistically reverberant region (see Equation (11)) and is less affected by the contribution that these panels may guarantee. Given its higher complexity, this proposal may be more suitable as a subsequent refinement step rather than an initial adjustment. Finally, the fourth proposal includes the addition of a wooden floor over the existing surface. This is the most comprehensive and ambitious implementation. The parquet contributes to a slight improvement in sound diffusion and a slightly more consistent frequency response. On the downside, this proposal also presents challenges related to installation and future maintenance.
Concluding the discussion, the second proposal proves to be the best compromise as far as benefits and ease of modifications are concerned. It provides a significant improvement in acoustic comfort without the implementation complexities of the more elaborate solutions. Also, it can be later on turned into proposal 3 by installing the above mentioned panels, making proposal 2 an important solution also as far as flexibility is concerned.

5. Conclusions

In this article, we presented the acoustic analysis and renovation simulations carried out for the church of SS Marcellino and Pietro, located in the city center of Cremona (Italy). Our work is part of a broader renovation plan to repurpose the space as a concert hall. Through in-situ measurements and spatial acoustic analysis, we identified critical issues such as an excessively long reverberation time, particularly in the low frequency range, as well as shortcomings in acoustic performance throughout the space, as typically expected in a large volume interior like that of a church. These anomalies are largely attributed to sound reflections originating from the lateral loggias and transept, which compromise clarity and frequency balance, i.e., features necessary in non-liturgical music contexts. The church exhibits an overall reverberation time ( T 30 ) of approximately 4.1 s, computed starting from the measurement data. Simulation results reveal a significant variation of 3.77 s in T 30 between the lowest octave band (125 Hz) and the highest (8000 Hz). This situation indicates a lack of balance in the site frequency response, highlighting the need for corrective changes to improve the acoustics in a specific manner and achieve parameters closer to those considered optimal for concert halls. To address these issues, we proposed four implementation strategies after simulations in Odeon software. Each proposed solution aims to enhance the acoustic comfort of the space while preserving its historical and architectural value. Among them, the second proposal, which includes the addition of curtains and audience padded seating, proved to grant the space a satisfactory acoustic performance with limited intervention, achieving a notable reduction in reverberation, especially at low frequencies. Instead, the most ambitious solution, which entails the installation of acoustic panels and a wooden floor, demonstrated the highest level of improvement, bringing the reverberation time closer to optimal values for concert halls, with a more consistent frequency response. For instance, in this case, the average reverberation time is reduced to 1.94 s with a difference of 1.47 s between the highest and lowest octave bands.
In conclusion, the work presented in this article offers several solutions for repurposing the site for non-liturgical musical events, successfully reconciling acoustic functionality with heritage conservation, and ultimately laying the foundation for returning the space to the local community as a concert hall.

Author Contributions

Conceptualization, S.P., R.G., A.G.L. and F.A.; methodology, S.P., R.G. and F.A.; software, S.P. and R.G.; validation, S.P. and R.G.; investigation, S.P. and R.G.; resources, S.P. and R.G.; data curation, S.P. and R.G.; writing—original draft preparation, S.P.; writing—review and editing, S.P., R.G., A.G.L. and F.A.; visualization, S.P. and R.G.; supervision, A.G.L. and F.A.; project administration, A.G.L. and F.A.; funding acquisition, A.G.L. and F.A. All authors have read and agreed to the published version of the manuscript.

Funding

This work has been funded by Regione Lombardia and Fondazione Cariplo under the “Casa Grasselli, Il palazzo della musica: poli e proposte culturali per una Città Creativa” project (ref. 2020-1324).

Data Availability Statement

Data are contained within the article “Giampiccolo, R.; Parrinelli, S.; Antonacci, F. ChurchIR: A Dataset of Multichannel Church Impulse Responses for Spatial Audio Applications. In Proceedings of the 33rd European Signal Processing Conference, Palermo, Italy, 8–12 September 2025” [36].

Conflicts of Interest

The authors declare no conflicts of interest.

References

  1. Cirillo, E. L’Acustica delle Chiese. In Proceedings of the Giornata di Studio “Il Progetto Acustico delle Chiese”, Politecnico di Bari, Dipartimento ICAR, Bari, Italia, 13 April 2013. [Google Scholar]
  2. Fang, E. Research on the Evolution of the Architectural Style of Catholic Church in Europe from the Middle Ages to the Renaissance. In Proceedings of the International Conference on Interdisciplinary Humanities and Communication Studies, Ningbo, China, 24–25 June 2022. [Google Scholar] [CrossRef]
  3. Benedetti, S. Architettura del Cinquecento Romano; Istituto Poligrafico e Zecca dello Stato: Roma, Italy, 2011. [Google Scholar]
  4. Lauro, P. Le Chiese Costruite a Roma all’Indomani del Concilio di Trento. Analisi delle Forme e dei Contenuti. Thesis, Università degli Studi di Roma, Roma, Italy, 2009. [Google Scholar]
  5. Briatore, S. Suono e Acustica nella Trattatistica Gesuitica del Seicento. Il Caso di Mario Bettini. Forum Ital. J. Ital. Stud. 2015, 49, 322–337. [Google Scholar] [CrossRef]
  6. Alberdi, E.; Galindo, M.; León-Rodríguez, A.L.; León, J. Acoustics in Baroque Catholic Church Spaces. Acoustics 2024, 6, 911–932. [Google Scholar] [CrossRef]
  7. Ciofarani, R. La Chiesa del Gesù—Roma. 2018. Available online: https://www.eventiculturalimagazine.com/arte-e-cultura/la-chiesa-del-gesu-roma-2/ (accessed on 5 April 2025).
  8. Sendra, J.J.; Galindo, M.; León-Rodríguez, A.L.; León, J. La Evolución de las Condiciones Acústicas en las Iglesias: Del Paleocristiano al Tardobarroco; Revista De Edificación, Instituto Universitario de Ciencias de la Construcción; Universidad de Sevilla: Sevilla, Spain, 1997. [Google Scholar]
  9. Alvarez-Morales, L.; Lopez, M. Cathedral Acoustics: A Research Project Exploring the Acoustics of Historic Cathedrals. 2020. Available online: http://emsoundscapes.co.uk/cathedral-acoustics-in-early-modern-england-exploring-and-recreating-the-sounds-of-the-past (accessed on 28 April 2025).
  10. Girón, S.; Álvarez Morales, L.; Zamarreño, T. Church Acoustics: A State-of-the-Art Review After Several Decades of Research. J. Sound Vib. 2017, 411, 378–408. [Google Scholar] [CrossRef]
  11. Rosseel, H.; van Waterschoot, T. A State-of-the-Art Review on Acoustic Preservation of Historical Worship Spaces Through Auralization. Signal Process. 2025, 234, 109992. [Google Scholar] [CrossRef]
  12. Ansay, S.; Zannin, P.H.T. Evaluation of the Acoustic Environment in a Protestant Church Based on Measurements of Acoustic Descriptors. J. Build. Constr. Plan. Res. 2016, 4, 172–189. [Google Scholar] [CrossRef]
  13. Cirillo, E.; Martellotta, F. Worship, Acoustics and Architecture; Multi-Science Publishing: Brentwood, CA, USA, 2007. [Google Scholar]
  14. Cirillo, E.; Martellotta, F. Sound Propagation and Energy Relations in Churches. J. Acoust. Soc. Am. 2005, 118, 232–248. [Google Scholar] [CrossRef]
  15. Martellotta, F.; Cirillo, E.; Carbonari, A.; Ricciardi, P. Guidelines for Acoustical Measurements in Churches. Appl. Acoust. 2008, 70, 378–388. [Google Scholar] [CrossRef]
  16. Dick, D.A.; Vigeant, M.C. A Comparison of Measured Room Acoustics Metrics Using a Spherical Microphone Array and Conventional Methods. Appl. Acoust. 2016, 107, 34–45. [Google Scholar] [CrossRef]
  17. Magrini, A.; Ricciardi, P. Churches as Auditoria: Analysis of Acoustical Parameters for a Better Understanding of Sound Quality. Build. Acoust. 2003, 10, 135–157. [Google Scholar] [CrossRef]
  18. D’Orazio, D.; Fratoni, G.; Garai, M. Acoustic of A Chamber Music Hall Inside A Former Church By Means of Sound Energy Distribution. Can. Acoust. 2017, 45, 7–16. [Google Scholar]
  19. Bartalucci, C.; Borchi, F.; Carfagni, M.; Luzzi, S.; Busa, L. The Acoustic Design and Requalification of an Auditorium in a Church and of a Historical Theater. In Proceedings of the IOP Conference Series: Materials Science and Engineering, Florence, Italy, 16–18 May 2018; Volume 364. [Google Scholar] [CrossRef]
  20. Ente Italiano di Normazione. UNI 11367:2023 Acustica in Edilizia—Classificazione Acustica delle Unità Mmmobiliari—Procedura di Valutazione e Verifica in Opera. 2023. Available online: https://store.uni.com/uni-11367-2023 (accessed on 5 April 2025).
  21. Garai, M.; Monari, M.; Tavernelli, C. Progettazione Acustica per il Recupero della ex Chiesa di Santa Maria del Carmine. In Proceedings of the XXVII National Conference of Associazione Italiana di Acustica, Associazione Italiana di Acustica, Genoa, Italy, 26–28 May 1999. [Google Scholar]
  22. Alonso, A.; Sendra, J.J.; Suárez, R.; Zamarreño, T. Acoustic Evaluation of the Cathedral of Seville as a Concert Hall and Proposals for Improving the Acoustic Quality Perceived by Listeners. J. Build. Perform. Simul. 2014, 7, 360–378. [Google Scholar] [CrossRef]
  23. Tămaș-Gavrea, D.R.; Munteanu, C.; Fernea, R.; Babotă, F.; Mureșan, L. Study on the Acoustic Rehabilitation of a Church. In Proceedings of the Procedia Manufacturing, 11th International Conference Interdisciplinarity in Engineering, Cluj-Napoca, Romania, 5–6 October 2018; Volume 22, pp. 384–391. [Google Scholar] [CrossRef]
  24. Buratti, C.; Belloni, E.; Merli, F.; Ambrosi, M.; Shtrepi, L.; Astolfi, A. From Worship Space to Auditorium: Acoustic Design and Experimental Analysis of Sound Absorption Systems for the New Auditorium of San Francesco al Prato in Perugia (Italy). Appl. Acoust. 2022, 191, 108683. [Google Scholar] [CrossRef]
  25. Caniato, M.; Bettarello, F.; Masoero, M. The Royal Church of San Lorenzo in Turin: Guarino Guarini and the Baroque Architectural Acoustics. J. Acoust. Soc. Am. 2008, 123, 108683. [Google Scholar] [CrossRef]
  26. Bettarello, F.; Caniato, L.; Caniato, M. Seven Centuries of Church Architectural Evolution and Its Influence on Indoor Acoustics: The Case of the Dome of Conegliano in Italy. Buildings 2023, 13, 299. [Google Scholar] [CrossRef]
  27. Katz, B.; Cros, C.; Peichert, S.; De Muynke, J. The Past Has Ears at Notre-Dame: Acoustic Digital Twins for Research and Narration. Digit. Appl. Archaeol. Cult. Herit. 2024, 34, e00369. [Google Scholar] [CrossRef]
  28. Gagliano, A.; Nocera, F.; Cicero, A.; Cascio Gioia, M.; Agrifoglio, A. Analysis and Acoustic Correction of a Contemporary Italian Church. In Proceedings of the 6th International Building Physics Conference, Energy Procedia, Torino, Italy, 14–17 June 2015; Volume 78, pp. 1623–1628. [Google Scholar]
  29. Martellotta, F. L’Acustica delle Chiese: Materiali, Forme e Dimensioni. ANIT 2013, 45, 5–12. [Google Scholar]
  30. Recreating the Acoustics of Notre-Dame de Paris. 2019. Available online: https://www.sorbonne-universite.fr/en/dossiers/notre-dame-de-paris/recreating-acoustics-notre-dame-de-paris (accessed on 23 April 2025).
  31. Autio, H.; Barbagallo, M.; Ask, C.; Hagberg, D.B.; Sandgren, E.L.; Lagergren, K.S. Historically Based Room Acoustic Analysis and Auralization of a Church in the 1470s. Appl. Sci. 2021, 11, 1586. [Google Scholar] [CrossRef]
  32. Landi, A.G.; Zamperini, E. Technique at the Service of a New Liturgical Model: The Timber Roof of the Church of Saints Marcellino and Pietro in Cremona. Technol. Eng. Mater. Archit. 2022, 8, 120–136. [Google Scholar] [CrossRef]
  33. Visintainer, C. La Chiesa dei SS. Marcellino e Pietro a Cremona. Indagine Storica e Rilievi Preliminari per l’Adeguamento a Sala da Musica Barocca. Master’s Thesis, ARC I-Scuola di Architettura Urbanistica Ingegneria delle Costruzioni, Politecnico di Milano, Milan, Italy, 2021. [Google Scholar]
  34. Bellanova, M. The Church of SS. Marcellino and Pietro in Cremona: Intervention Proposal for the Reinforcement of the Main Facade. Master’s Thesis, ARC I-Scuola di Architettura Urbanistica Ingegneria delle Costruzioni, Politecnico di Milano, Milan, Italy, 2022. [Google Scholar]
  35. Monteverdi Festival Cremona Website, Chiesa di San Marcellino. Available online: https://www.monteverdifestivalcremona.it/luogo/chiesa-di-san-marcellino/ (accessed on 13 March 2025).
  36. Giampiccolo, R.; Parrinelli, S.; Antonacci, F. ChurchIR: A Dataset of Multichannel Church Impulse Responses for Spatial Audio Applications. In Proceedings of the 33rd European Signal Processing Conference, Isola delle Femmine, Palermo, Italy, 8–12 September 2025. [Google Scholar]
  37. ISO 3382-1; Acoustics Measurement of Room Acoustic Parameters-Part 1: Performance Spaces. ISO: Geneva, Switzerland, 2009.
  38. Farina, A. Advancements in Impulse Response Measurements by Sine Sweep. In Proceedings of the 122nd Audio Engineering Society Convention, Vienna, Austria, 5–8 May 2007. Number 7121. [Google Scholar]
  39. Nebraska Acoustics Group. Concert Halls. Available online: https://www.concerthalls.org/?page_id=19 (accessed on 13 March 2025).
  40. Barron, M. Measured Early Lateral Energy Fractions in Concert Halls and Opera Houses. J. Sound Vib. 2000, 232, 79–100. [Google Scholar] [CrossRef]
  41. Protheroe, D.; Day, C. Validation of Lateral Fraction Results in Room Acoustic Measurements. In Proceedings of the 43rd International Congress on Noise Control Engineering: Improving the World Through Noise Control, Melbourne, Australia, 16–20 November 2014. [Google Scholar]
  42. Protheroe, D.; Day, C.L. Lateral Fraction Measurements with a 3-D Microphone Array. Acoust. Aust. 2015, 43, 69–76. [Google Scholar] [CrossRef]
  43. Barron, M.; Marshall, A.H. Spatial Impression due to Early Lateral Reflections in Concert Halls: The Derivation of a Physical Measure. J. Sound Vib. 1981, 77, 211–232. [Google Scholar] [CrossRef]
  44. Barron, M. Late Lateral Energy Fractions and the Envelopment Question in Concert Halls. Appl. Acoust. 2001, 62, 185–202. [Google Scholar] [CrossRef]
  45. ODEON A/S. ODEON Room Acoustics Software: User’s Manual; Version 18; DTU Science Park: Kgs. Lyngby, Denmark, 2023. [Google Scholar]
  46. ODEON A/S. Material Database. 2024. Available online: https://odeon.dk/downloads/materials/ (accessed on 10 May 2025).
  47. Seating LAMM® L 213. Available online: https://www.lamm.it/it/prodotti/conference/l213/ (accessed on 24 November 2024).
  48. Aural Exchange Advanced Acoustics. Acoustic Absorption Coefficient of Human Body in Octave Bands. 2020. Available online: https://www.auralexchange.com/knowledgebase/acoustic-absorption-coefficient-of-human-body-in-octave-bands/ (accessed on 5 December 2024).
  49. Beranek, L.L. Audience and Seat Absorption in Large Halls. J. Acoust. Soc. Am. 1960, 32, 661–670. [Google Scholar] [CrossRef]
  50. Marconi, N. Know How to Restore: Construction Techniques in Baroque Rome—Practices, Devices and “Secrets”. Struct. Stud. Repairs Maint. Herit. Archit. IX 2005, 83, 73–82. [Google Scholar]
  51. Robbins, J. Baroque Stage Curtains: Space, Spectacle and the Monarch. Bull. Span. Stud. 2015, 92, 347–367. [Google Scholar] [CrossRef]
  52. Nova, A. Hangings, Curtains, and Shutters of Sixteenth-Century Lombard Altarpieces. In Italian Altarpieces 1250–1550: Function and Design; Oxford University Press: Oxford, UK, 1994; pp. 177–189. [Google Scholar] [CrossRef]
  53. Instructionum Fabricae et Supellectilis Ecclesiasticae: Istruzioni Intorno alla Fabbrica ed alla Suppellettile Ecclesiastica; Apud Pacificum Pontium: Mediolani. 1577. Available online: https://www.memofonte.it/home/files/pdf/scritti_borromeo.pdf (accessed on 17 February 2025).
  54. Braun, J. Die Belgischen Jesuitenkirchen: Ein Beitrag zur Geschichte des Kampfes Zwischen Gotik und Renaissance; Herder: Freiburg im Breisgau, Germany, 1907. [Google Scholar]
  55. Prisma Panels, Acustico®. Available online: https://www.acustico.com (accessed on 24 November 2024).
  56. Modex Corner Panels®. Available online: https://www.rpgacoustic.com/product/modex-corner/ (accessed on 24 November 2024).
  57. Meyer, J. Kirchenakustik; Verlag Erwin Bochinsky GmbH & Co. KG: Frankfurt am Main, Germany, 2003. [Google Scholar]
  58. Benedetto, G.; Fringuellino, M.; Iannace, G.; Schiavi, A.; Spagnolo, R. Acustica dei Materiali e dei Sistemi Edilizi. In Acustica; Chapter 22; UTET Università: Torino, Italy, 2015. [Google Scholar]
  59. Italia, S.-G. Manuale Tecnico di Acustica Edilizia: Approccio Teorico e Normativo. Le Soluzioni Saint-Gobain Italia; Saint-Gobain Italia: Milan, Italy, 2021. [Google Scholar]
  60. Schroeder, M.R.; Kuttruff, K.H. On Frequency Response Curves in Rooms. Comparison of Experimental, Theoretical, and Monte Carlo Results for the Average Frequency Spacing between Maxima. J. Acoust. Soc. Am. 1962, 34, 76–80. [Google Scholar] [CrossRef]
  61. Schroeder, M.R. The ‘Schroeder Frequency’ Revisited. J. Acoust. Soc. Am. 1996, 99, 3240–3241. [Google Scholar] [CrossRef]
  62. Kuttruff, H. Room Acoustics, 6th ed.; CRC Press: Boca Raton, FL, USA, 2017. [Google Scholar]
  63. Rafaely, B.; Khaykin, D. Optimal Model-Based Beamforming and Independent Steering for Spherical Loudspeaker Arrays. IEEE Trans. Audio Speech Lang. Process. 2011, 19, 2234–2238. [Google Scholar] [CrossRef]
  64. Pätynen, J.; Lokki, T. Concert Halls with Strong and Lateral Sound Increase the Emotional Impact of Orchestra Music. J. Acoust. Soc. Am. 2016, 139, 1214–1224. [Google Scholar] [CrossRef]
  65. Barron, M. Basic Design Techniques to Achieve Lateral Reflections in Concert Halls. In Proceedings of the International Symposium on Room Acoustics (ISRA), Amsterdam, Netherlands, 15–17 September 2019. [Google Scholar]
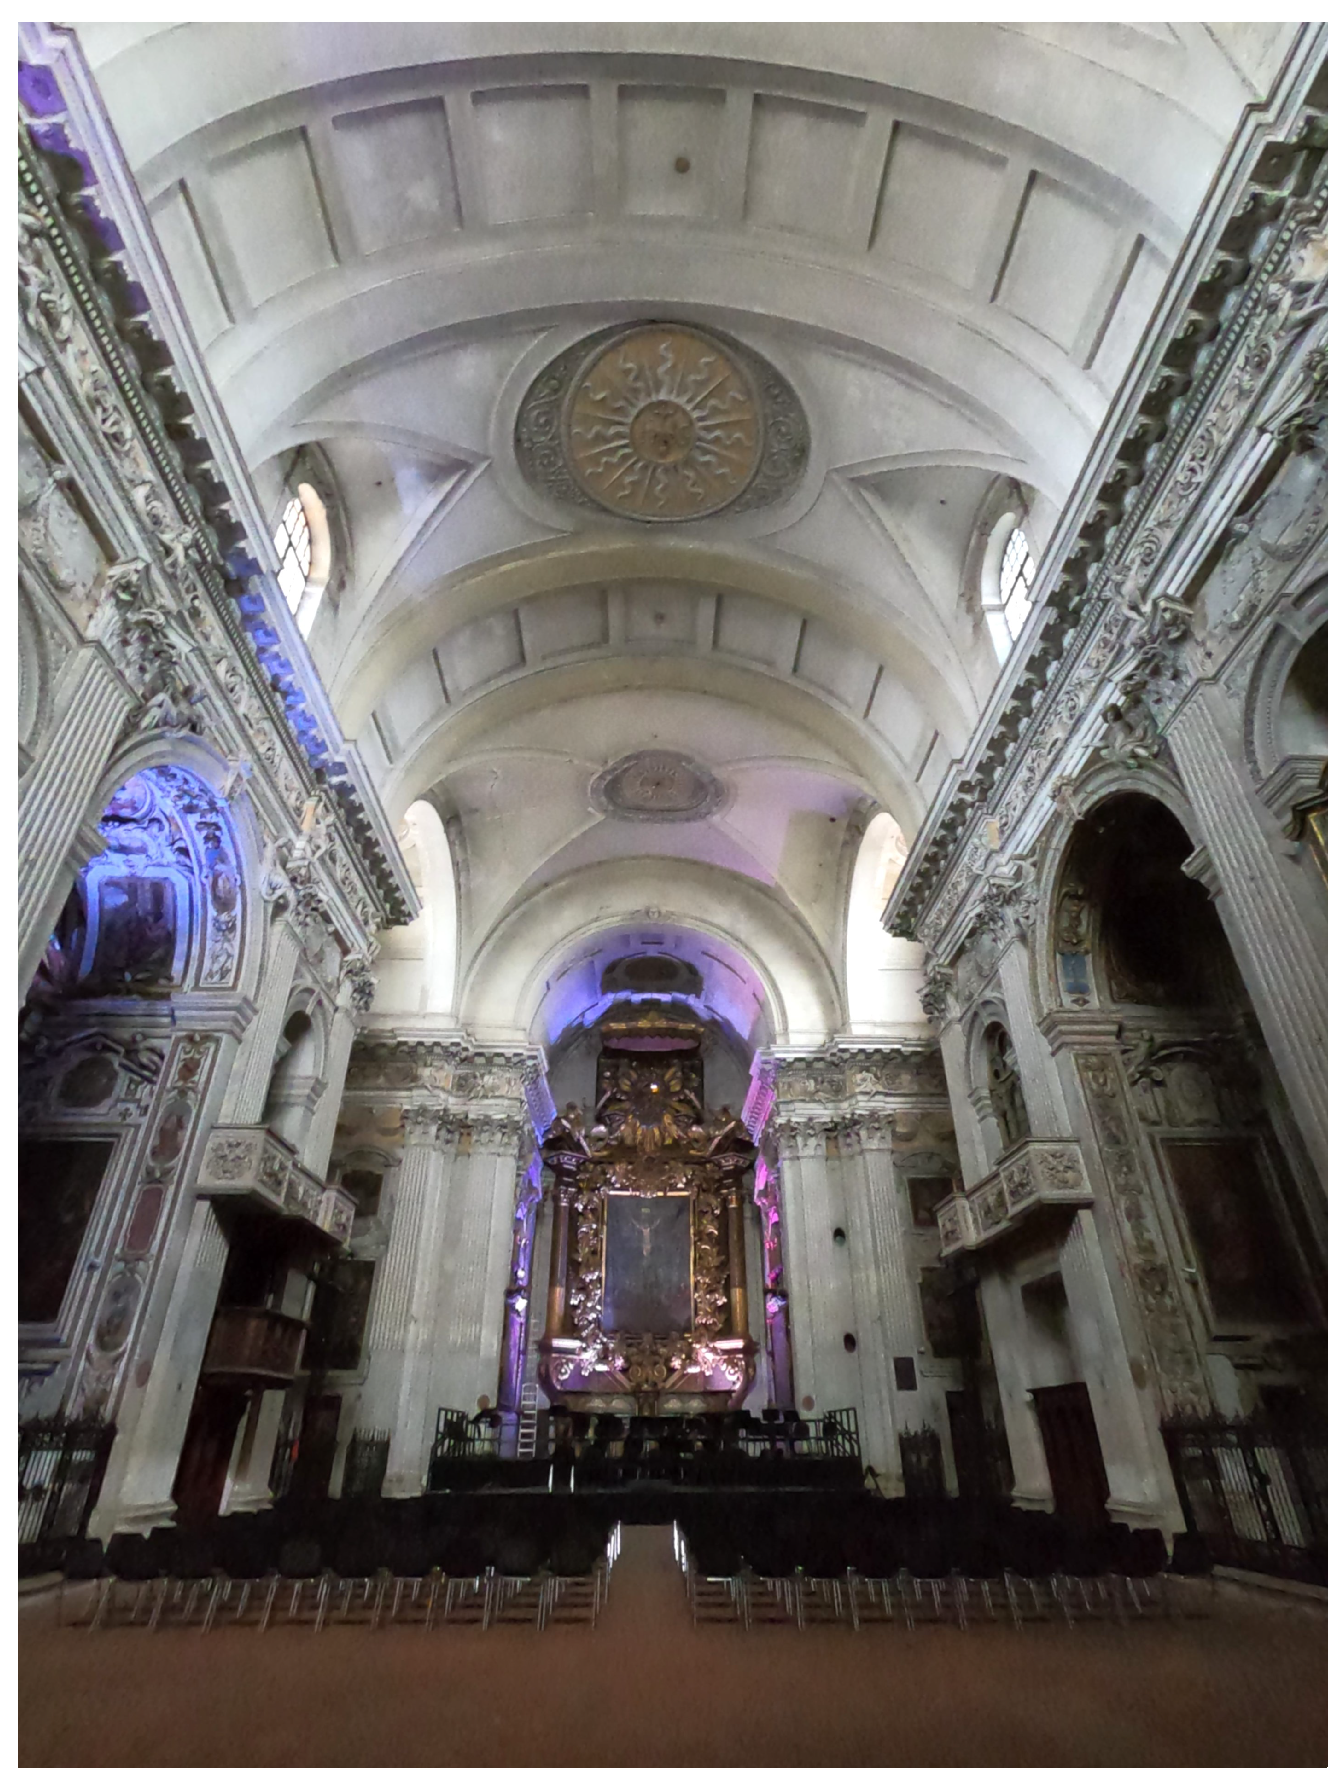
Figure 1. Church of Saints Marcellino and Pietro nowadays.
Acoustics 07 00042 g001
Figure 2. Setup of the acoustic measurement campaign: placement of the omnidirectional sound source and of the two receivers in the empty nave.
Acoustics 07 00042 g002
Figure 3. Measurement campaign setup.
Acoustics 07 00042 g003
Figure 4. Floor plan of the Saints Marcellino and Pietro church, showing the positions of sources (in red) and receivers (in blue) used during the measurement campaign. The sources are labeled as R (right), C (center), and L (left). The receivers are numbered from 1 to 10, ordered according to their increasing distance from the source line.
Acoustics 07 00042 g004
Figure 5. Absolute percentage discrepancies between in-situ measurements and simulated values using the model built in Odeon. Values are shown for each octave band, excluding 125 Hz.
Acoustics 07 00042 g005
Figure 6. 3D model built in Odeon: (a,b) seating arrangement, (c) curtains arrangement indicated through the red arrow, (d) extracted curtain section, (e) bass traps arrangement, (f) suspended acoustic panels, and (g) general panel arrangement.
Acoustics 07 00042 g006
Figure 7. Measurement campaign results. Color maps of the interpolated EDT values across the floor plan, obtained from measurements at receiver positions: in (a) octave band centered in 125 Hz; in (b), octave band centered in 250 Hz; in (c), octave band centered in 500 Hz; in (d), octave band centered in 1000 Hz; in (e) octave band centered in 2000 Hz; in (f) octave band centered in 4000 Hz.
Acoustics 07 00042 g007
Figure 8. Measurement campaign results. Color maps of the interpolated T 20 values across the floor plan, obtained from measurements at receiver positions: in (a) octave band centered in 125 Hz; in (b), octave band centered in 250 Hz; in (c), octave band centered in 500 Hz; in (d), octave band centered in 1000 Hz; in (e) octave band centered in 2000 Hz; in (f) octave band centered in 4000 Hz.
Acoustics 07 00042 g008
Figure 9. Measurement campaign results. Early Decay Time values: in (a), color map of the interpolated overall broadband values along the floor plan, obtained from measurements at receiver positions; in (b), value distribution as a function of frequency bands, averaged over the measurement positions together with their standard deviation.
Acoustics 07 00042 g009
Figure 10. Measurement campaign results. T 20 values: in (a), color map of the interpolated overall broadband values along the floor plan, obtained from measurements at receiver positions; in (b), value distribution as a function of frequency bands, averaged over the measurement positions together with their standard deviation.
Acoustics 07 00042 g010
Figure 11. Measurement campaign results. Color maps of the interpolated T 30 values across the floor plan, obtained from measurements at receiver positions: in (a), octave band centered in 250 Hz; in (b), octave band centered in 500 Hz; in (c), octave band centered in 1000 Hz; in (d), octave band centered in 2000 Hz, in (e), octave band centered in 4000 Hz.
Acoustics 07 00042 g011
Figure 12. Measurement campaign results. T 30 values: in (a), color map of the interpolated overall broadband value along the floor plan, obtained from measurements at receiver positions; in (b), value distribution as a function of frequency bands, averaged over the measurement positions together with their standard deviation.
Acoustics 07 00042 g012
Figure 13. Measurement campaign results. Clarity ( C 80 ) values: in (a), color map of the interpolated overall broadband values along the floor plan, obtained from measurements at receiver positions; in (b), value distribution as a function of frequency bands, averaged over the measurement positions together with their standard deviation.
Acoustics 07 00042 g013
Figure 14. Measurement campaign results: color map of the interpolated Bass Ratio (BR) values along the floor plan obtained from measurements at receiver positions.
Acoustics 07 00042 g014
Figure 15. Measurement campaign results. Interpolated color maps of LEF values across the floor plan, obtained from measurements at receiver positions: in (a), octave band centered in 250 Hz; in (b), octave band centered in 500 Hz; in (c), octave band centered in 1000 Hz; octave band centered (d) 2000 Hz.
Acoustics 07 00042 g015
Figure 16. Measurement campaign results. Lateral Energy Fraction LEF: in (a), color map of the interpolated overall broadband values along the floor plan, obtained from measurements at receiver positions; in (b) value distribution as a function of frequency bands, averaged over the measurement positions together with their standard deviation.
Acoustics 07 00042 g016
Figure 17. Measurement campaign results. Pseudo-spectra computed considering the source placed in the central position. The array is oriented towards the altar, aligned with the nave. (a) Position ML1; (b) position MC1, (c) position MR1; (d) position ML5; (e) position MC5, (f) position MR5; (g) position ML10; (h) position MC10, (i) position MR10.
Acoustics 07 00042 g017
Figure 18. Measurement campaign results, directivity plots across different octave bands, with the source placed in a central position: (a) octave band centered at 125 Hz, (b) octave band centered at 250 Hz, (c) octave band centered at 500 Hz, (d) octave band centered at 1000 Hz, (e) octave band centered at 2000 Hz, (f) octave band centered at 4000 Hz.
Acoustics 07 00042 g018
Figure 19. Results of the measurement campaign at four different receiver positions (ac). Each subfigure displays the impulse responses (top row), with the analysis time window highlighted by red vertical lines, and the corresponding beamforming pseudo-spectra computed for three different time windows (in bottom row). The array is oriented towards the altar and aligned with the nave. Values are normalized between 0 and 1 for each receiver position.
Acoustics 07 00042 g019
Figure 20. EDT and T 30 results averaged over the frequency range of interest. Each subfigure shows interpolated measurements along the nave: (a,b) correspond to the original proposal; (c,d) correspond to Proposal 1 (seating only); (e,f) correspond to Proposal 2 (seating and curtains); (g,h) correspond to Proposal 3 (seating, curtains, and panels); (i,j) correspond to Proposal 4 (seating, curtains, panels, and wooden floor).
Acoustics 07 00042 g020aAcoustics 07 00042 g020b
Figure 21. Comparison of EDT (left) and T 30 (right) across frequencies. Solid colored lines represent the average values along frequencies. Results are shown for the original proposal (cyan) and for four modified proposals: Proposal 1 (red), Proposal 2 (yellow), Proposal 3 (purple), and Proposal 4 (green). All results are averaged across measurement positions.
Acoustics 07 00042 g021
Table 1. Materials included in the model and corresponding settings in Odeon.
MaterialDescription of Selected MaterialSurface Type in OdeonApplied Scattering
Terracotta floorSmooth terracotta tilesNormal0.03
Marble floorMarbleNormal0.01
Smooth wallsPlastered concreteNormal0.02
FriezesPlastered concreteNormal0.45
Fluted pilastersPlastered concreteNormal0.35
CeilingsPlastered concreteFractional0.02
Wall frescoesPlastered concreteNormal0.02
Ceiling frescoesPlastered concreteFractional0.02
Painted canvasesPainted fabricNormal0.01
Inlaid woodSolid wood (doors)Normal0.35
Carved and painted woodSolid wood (doors)Normal0.45
Aged wood (doors and confessionals)Solid wood (doors)Normal0.02
Light wood (main entrance area)2.5 cm wood panel over air gapNormal0.30
GlassSingle glazingNormal0.01
Stone sculpturesPlastered concreteNormal0.50
Table 2. Absorption coefficients of the materials used in the model for different octave bands. In yellow the absorption coefficient data taken from the Odeon Library [46], in green the coefficients specifically tuned to improve the matching with the measurement data.
Material63 Hz125 Hz250 Hz500 Hz1000 Hz2000 Hz4000 Hz8000 Hz
Terracotta floor0.080.080.090.120.160.220.240.24
Marble floor0.010.010.010.010.010.020.020.02
Smooth walls0.050.060.090.090.100.100.100.10
Friezes0.050.060.090.090.100.100.100.10
Fluted pilasters0.050.060.090.090.100.100.100.10
Ceilings0.050.060.090.090.100.100.100.10
Wall frescoes0.110.110.080.070.060.050.050.05
Ceiling frescoes0.110.110.080.070.060.050.050.05
Painted canvases0.950.900.700.500.350.250.150.15
Inlaid wood0.140.140.100.060.080.100.100.10
Carved painted wood0.140.140.100.060.080.100.100.10
Aged wood (doors and confessionals)0.140.140.100.060.080.100.100.10
Light wood (main entrance area)0.190.190.140.090.060.060.050.05
Glass0.180.180.060.040.030.020.020.02
Stone sculptures0.050.060.090.090.100.100.100.10
Table 3. Absorption coefficients of additional materials introduced in the proposed configurations for different octave bands.
Material63 Hz125 Hz250 Hz500 Hz1000 Hz2000 Hz4000 Hz8000 Hz
Chairs LAMM L2130.851.001.001.001.000.900.600.20
Audience0.290.290.430.510.680.710.730.73
Chairs LAMM L213 + Audience0.570.6450.7150.7550.840.8050.6650.465
Curtains0.300.300.450.650.560.590.710.71
Prisma by Acustico®0.100.170.600.930.910.950.950.85
Modex Corner bass traps by Acoustic GRG®1.000.420.390.220.300.380.420.42
Parquet Flooring0.200.200.150.100.100.050.100.10
Stage Platform0.400.400.300.200.170.150.100.10
Table 4. Overall acoustic parameters averaged over all the measurement positions.
Acoustic ParameterAverage
EDT (s)3.76 s
T 20 (s)3.97 s
T 30 (s)4.14 s
C 80 (dB)−4.61 dB
BR1.21
LF0.15
Disclaimer/Publisher’s Note: The statements, opinions and data contained in all publications are solely those of the individual author(s) and contributor(s) and not of MDPI and/or the editor(s). MDPI and/or the editor(s) disclaim responsibility for any injury to people or property resulting from any ideas, methods, instructions or products referred to in the content.