Abstract
Hexaconazole, a triazole-class fungicide, demonstrates broad-spectrum protective and therapeutic activity against fungal pathogens, particularly those from Basidiomycota and Ascomycota, such as brown spot and powdery mildew. Despite its efficacy in controlling Actinidia brown spot disease in kiwifruit, excessive hexaconazole residues pose significant health risks due to its high toxicity. To address this challenge, a rapid analytical method for detecting hexaconazole residues in kiwifruit was developed using surface-enhanced Raman spectroscopy (SERS). The methodology employed silver colloid (C-AgNPs) as the active substrate and 1 mol/L NaCl as the aggregation agent, optimized through systematic testing, resulting in an optimal volume ratio of 400:225 between C-AgNPs and hexaconazole solution and a sequential mixing order of C-AgNPs + NaCl + Hexaconazole, followed by a 20 min incubation period. The characteristic Raman peak at 1584 cm−1 was identified as the spectral signature for hexaconazole quantification. Analytical validation revealed a linear detection range of 0.25–2.25 mg/L (R2 = 0.9870), precision with a relative standard deviation (RSD) of 1.7%, and an average recovery rate of 88.40–105.50%, confirming the method’s robustness. This approach enables rapid, non-destructive analysis with minimal sample pretreatment, offering high sensitivity and stability. This method demonstrates great potential for detecting hexaconazole residues in agricultural products.
1. Introduction
The enhancement principle of surface-enhanced Raman spectroscopy (SERS) mainly relies on the electromagnetic field enhancement generated by noble metal nanostructures. Under laser excitation, local surface plasmon resonance is produced on the metal surface, forming a huge electromagnetic field in the “hot spot” area, thereby amplifying the Raman signal of adsorbed molecules by millions of times [1]. Chemical enhancement provides a secondary contribution. Surface-enhanced Raman spectroscopy has emerged in recent years as one of the most promising analytical techniques, driven by advancements in laser technology, nanophotonics, and plasmonics. This method enhances the electromagnetic field on the surfaces of noble metal nanostructures or within nanogaps by combining Raman spectroscopy with localized surface plasmon resonance effects [2,3]. Its primary goal is to address the issue of weak Raman scattering signals from molecules, thereby effectively amplifying faint Raman signals. It is suitable for rapid detection and trace analysis in fields such as food and clinical diagnostics, with particularly widespread applications in pesticide residue detection [4,5,6]. The enhancement effect of SERS relies on active substrates; when target molecules are adsorbed onto the SERS substrate surface, their Raman signals can be amplified by up to 106 times, significantly lowering the detection limit for analytes. Therefore, SERS is widely applied in environmental analysis and food analysis (Table 1).

Table 1.
Comparison of different SERS substrates for the detection of contaminants.
The advent of portable Raman spectrometers has addressed the need for rapid, low-cost acquisition of specific fingerprint signals from target substances and enabled on-site sample detection. Silver nanoparticles exhibit significant advantages in surface-enhanced Raman spectroscopy. Their electromagnetic field enhancement effect is extremely strong, capable of generating particularly intense localized surface plasmon resonance in the visible-light region, thereby achieving higher detection sensitivity and often yielding strong signals [13,14].
Hexaconazole, also known as Anvil, provides broad-spectrum protective and therapeutic effects against diseases caused by fungi, particularly those of the Basidiomycota and Ascomycota phyla [15]. Its primary mechanism of action involves disrupting and inhibiting the biosynthesis of ergosterol, a key component of fungal cell membranes, leading to membrane failure and subsequent death of the pathogen [16]. Hexaconazole is commonly used on kiwifruit to control brown spot disease, and it has a strong irritating effect on the skin and eyes. It has been classified by the European Union (EU) and the World Wide Fund for Nature (WWF) as a compound with reproductive and endocrine-disrupting toxicity. According to the EU Pesticide Database, the maximum residue limit (MRL) for hexaconazole in vegetables is 0.1 mg/kg [17]. Establishing MRLs for hexaconazole in kiwifruit provides crucial support for local regulatory agencies in effectively managing pesticide residues in fruits and offers reliable data for future revisions of MRLs. Therefore, developing a rapid and quantitative method for detecting hexaconazole in fruits and vegetables is of significant importance. Current detection methods for hexaconazole include Gas Chromatography (GC) [18], Ultra-High-Performance Liquid Chromatography–Tandem Mass Spectrometry (UPLC-MS/MS) [19], and Gas Chromatography with Electron Capture Detection (GC-ECD) [20]. However, these techniques are associated with several limitations, including stringent operational environments, complex pretreatment procedures, significant cost, and lengthy processing. SERS emerges as a promising solution that is portable, rapid, low-cost, and well-suited for large-scale field screening.
Currently, there are no reported SERS-based methods for detecting hexaconazole in kiwifruit. This study employs SERS technology using silver sol as the active substrate and salt solution as the aggregating agent to form signal-enhancing hot spots, thereby achieving Raman signal amplification. By optimizing the detection conditions, the sensitivity of the method was further improved. A rapid, simple, highly stable, and high-recovery SERS-based method for detecting hexaconazole in kiwifruit has been successfully established. The specific experimental procedure is shown in Figure 1.
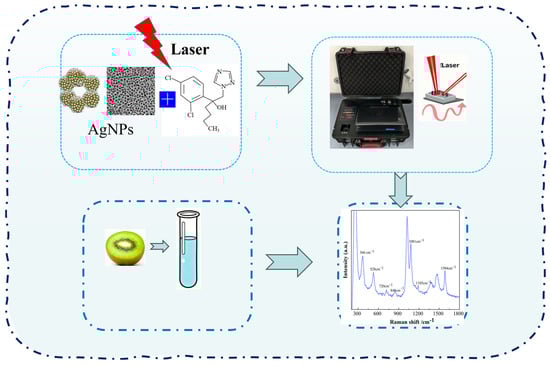
Figure 1.
The schematic diagram of this work.
2. Materials and Methods
2.1. Instruments and Reagents
The equipment used in this study included a Prelab-100 portable laser Raman spectroscopy detection system (Changchun Zhongyuan Instrument Co., Changchun, China); a Cary50 UV-Vis spectrophotometer (UV-Vis, Varian Inc., Palo Alto, CA, USA); an FEI Tecnai G2 F30 field emission transmission electron microscope (TEM, FEI Inc., Hillsboro, OR, USA); and a Zetasizer NanoZS ZS90 nanoparticle size analyzer (Malvern Instruments Ltd., Malvern, UK).
Hexaconazole (98%), AgNO3 (purity 99.8%), and Sodium Citrate (purity 99%) were purchased from the Aladdin Reagent Company, Shanghai, China; HCl, HNO3, and NaCl were all of analytical grade. The water used in the experiments was ultrapure water (>18 MΩ·cm). All glassware was soaked in aqua regia overnight and rinsed thoroughly with ultrapure water before use.
A 100 mg/L hexaconazole standard solution was prepared by accurately weighing 10.0 mg of hexaconazole reference standard, transferring it to a 100 mL volumetric flask, and diluting to volume with methanol. The solution was stored at 4 °C for use.
A 1% Sodium Citrate solution was prepared by precisely weighing 1.00 g of sodium citrate, transferring it to a 100 mL volumetric flask, dissolving it with ultrapure water, and diluting to volume. The solution was stored at 4 °C for use.
A 1 mol/L NaCl solution was prepared by accurately weighing 5.84 g of NaCl, transferring it to a 100 mL volumetric flask, dissolving it with ultrapure water, and diluting to volume. The solution was stored at 4 °C for use.
Kiwifruit samples were collected from three fruit supermarkets in the Anshan area of Liaoning Province, labeled as samples X1, X2, and X3.
2.2. Preparation of Silver Nanoparticle Sol (C-AgNPs)
A total of 18.0 mg of AgNO3 was weighed accurately and added into a 100 mL volumetric flask, dissolved, and diluted with ultrapure water. The resulting solution was transferred to a 250 mL round-bottom flask equipped with a reflux condenser. Under reflux conditions with vigorous mechanical stirring, the solution was boiled, 2 mL of 1% sodium citrate solution was added, and the mixture was maintained at a slight boil for 1 h. The reaction mixture was allowed to cool gradually to ambient temperature. The resulting silver nanoparticle colloid was stored at 4 °C for subsequent applications.
2.3. SERS Measurement Preparation
Parameters of the Raman spectroscopy detection system were as follows: excitation wavelength, 785 nm; maximum laser power, 500 mW; spectral resolution, 10 cm−1; quartz cuvette (1 cm). A laser power of 250 mW and an integration time of 5 s were used for all measurements.
2.4. Preparation of the Raman Spectrum of Hexaconazole
The sample was prepared in a centrifuge tube by mixing 200 μL of hexaconazole (10 mg/L) with 400 μL of C-AgNP solution and 200 μL of NaCl (1 mol/L). The mixture was then brought to a final volume of 1 mL with deionized water, vortex-mixed for 20 min, and transferred to a quartz cuvette (1 cm) for Raman spectroscopy measurement.
2.5. Preparation of the Sample Solutions
Samples X1, X2, and X3 were not peeled and were juiced, and the juice was placed in a beaker as the experimental samples. Each sample was divided into three portions, and 20.0 g of each was transferred into 50 mL centrifuge tubes. Then, 20 mL of methanol was added, and the mixtures were subjected to ultrasonic extraction for 10 min at room temperature, followed by centrifugation at 2000 r/min for 20 min. The entire supernatant was transferred into centrifuge tubes and evaporated to dryness under a stream of nitrogen. The residue was redissolved in 0.5 mL of methanol to obtain the sample solutions.
3. Results
3.1. Characterization of C-AgNPs
The morphology, particle size distribution, and dispersity of C-AgNPs were characterized using UV-Vis spectroscopy, TEM, and nanoparticle size analysis. As shown in Figure 2a, the UV-Vis spectrum of C-AgNPs exhibited a maximum absorption wavelength (λmax) at 421.0 nm with a full width at half maximum of approximately 90 nm, indicating that the prepared C-AgNPs had relatively uniform particle sizes. The TEM image in Figure 2b reveal that the C-AgNPs exhibited spherical and short rod-like structures, consistent with findings in the literature [21]. The prepared C-AgNPs demonstrated uniform particle sizes and a narrow distribution range, which can effectively enhance the surface enhancement effect.
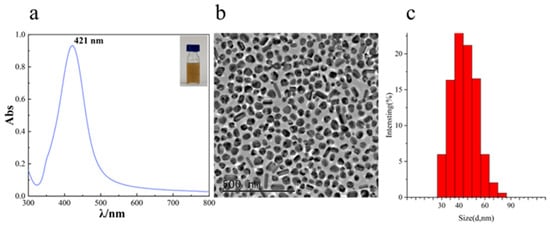
Figure 2.
UV-Vis absorption spectrum (a); a representative TEM image of C-AgNPs (b); a particle size distribution graph of C-AgNPs (c).
3.2. SERS Spectroscopy of Hexaconazole
Since the shifts in Raman spectra correspond to the vibrational or rotational frequencies of chemical bonds, the molecular structure can be determined based on the characteristic Raman peak positions [22]. Figure 3 shows the surface-enhanced Raman spectrum of hexaconazole. The Raman signal at 528 cm−1 can be attributed to the in-plane breathing vibration of the five-membered ring. The peak at 845 cm−1 corresponds to the bending vibration of C-N-N, while the Raman peak at 1081 cm−1 is assigned to the stretching vibration of the C-Cl bond. The Raman signal at 1584 cm−1 represents the C=N stretching vibration of the triazole ring in hexaconazole, serving as a characteristic identification peak for the molecule. Comparative analysis revealed that the peak area at 1584 cm−1 exhibited better linearity than those at 528 cm−1, 845 cm−1, and 1081 cm−1. Therefore, the peak area at 1584 cm−1 was selected for quantitative analysis.
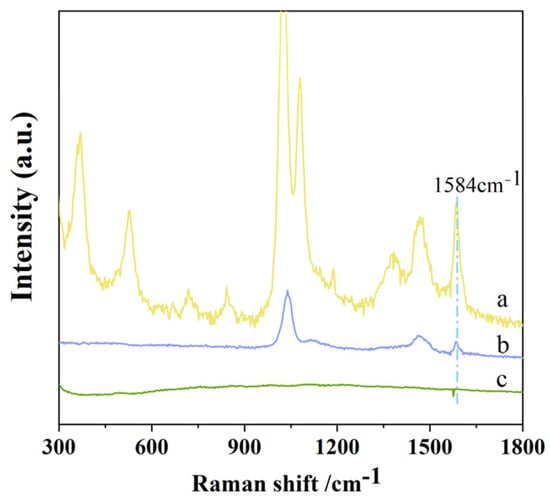
Figure 3.
Raman spectrum of C-AgNPs + Hexaconazole + NaCl (a); Raman spectrum of 10 g/L hexaconazole (methanol aqueous); (b) and Raman spectrum of C-AgNPs + NaCl solution (c).
The enhancement factor (EF) is an important indicator used to describe the performance of SERS substrates. A 10 mg/L hexaconazole solution was selected at the SERS peak at 1584 cm−1 to estimate the enhancement factor of C-AgNPs. Here, the SERS enhancement factor is , which was estimated according to the following formula [23]:
3.3. Optimization of Experimental Conditions
To determine the optimal experimental conditions, a 10 mg/L hexaconazole standard solution was used to evaluate the effects of five factors on SERS intensity, including mixing order, volume of C-AgNP solution, volume of hexaconazole solution, volume of NaCl solution, and mixing time.
3.3.1. Effect of Mixing Order
Surface plasmon resonance is the primary contributor to Raman signal enhancement. These “hot spots” in plasmonic nanostructures account for the majority of the overall SERS signal. Non-plasmonic micro/nanostructures can not only act as plasmonic enhancers, but also reduce energy loss and improve Raman efficiency [24,25]. Due to the enhanced electric field around the particles, the incident light’s electric field is amplified, leading to intensified Raman scattering. Different mixing orders result in distinct enhancement systems and varying enhancement effects. SERS measurements were performed using different mixing sequences, and the results are shown in Figure 4. The mixing order of C-AgNPs + NaCl + Hexaconazole yielded the highest peak area at 1584 cm−1 and was therefore selected for subsequent experiments.
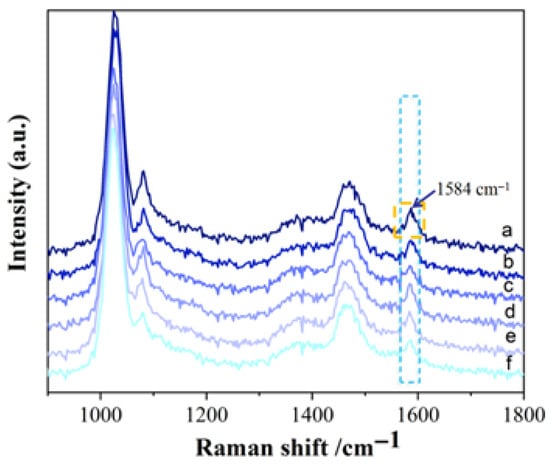
Figure 4.
Effect of mixing orders on SERS intensity of hexaconazole (a. C-AgNPs + NaCl + Hexaconazole; b. C-AgNPs + Hexaconazole + NaCl; c. NaCl + Hexaconazole + C-AgNPs; d. NaCl + C-AgNPs + Hexaconazole; e. Hexaconazole + NaCl + C-AgNPs; f. Hexaconazole + C-AgNPs + NaCl).
3.3.2. Effects of C-AgNPs and Hexaconazole Solution Volumes
The strength of the surface-enhanced Raman signal is related to the activity of the substrate, which is directly influenced by the relative concentrations of the substrate and the target molecule. Therefore, it is essential to investigate the relative concentrations of the silver sol and the target molecule.
Following the optimal mixing order, different volumes of C-AgNP solution (50–500 μL) were transferred, followed by the addition of 200 μL of 1 mol/L NaCl solution and 200 μL of 10 mg/L hexaconazole standard solution. The mixture was homogenized, allowed to stand for 5 min, diluted to 1 mL with methanol, and then subjected to SERS intensity measurement. The results are shown in Figure 5a. The peak area at 1584 cm−1 was the highest when 400 μL of C-AgNP solution was used, compared to other volumes. Thus, 400 μL of C-AgNP solution was selected for subsequent experiments.
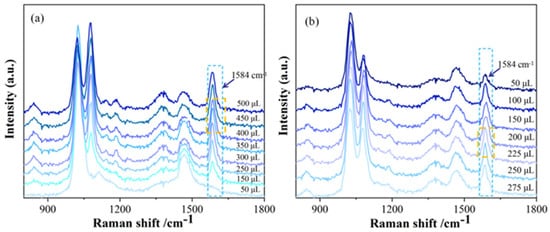
Figure 5.
Effect of different volumes of C-AgNPs and hexaconazole solution on SERS intensity of hexaconazole ((a) Effects of C-AgNP volumes; (b) effects of hexaconazole solution volumes).
Next, 400 μL of C-AgNP solution and 200 μL of 1 mol/L NaCl solution were transferred, followed by the addition of different volumes of 10 mg/L hexaconazole standard solution (50–275 μL). The mixture was homogenized, allowed to stand for 5 min, diluted to 1 mL with methanol, and then subjected to SERS intensity measurement. The results are shown in Figure 5b. As the volume of hexaconazole solution increased, the SERS intensity initially increased and then decreased. In this system, hexaconazole and silver nanoparticles mainly combine through adsorption. As the volume of the solution changes, the adsorption effect will change and thus affects the hot spot of the system and leads to a change in the signal enhancement effect. The peak area at 1584 cm−1 reached its maximum when 225 μL of hexaconazole solution was added. Therefore, 225 μL of hexaconazole solution was selected as the optimal volume.
3.3.3. Volume of NaCl Solution
The extent of charge-based interaction between metal nanoparticles and target analyte molecules varies. Adding the aggregating agent NaCl solution to the silver sol can accelerate the binding kinetics between metal particles and analyte molecules, thereby improving the surface enhancement effect of the silver sol. The introduction of electrolyte disrupts the charge balance of Ag+, facilitating aggregation between particles and the analyte and rapidly creating more “hot spots” to enhance the SERS effect.
Following the optimal mixing sequence, 400 μL of C-AgNP solution, different volumes of 1 mol/L NaCl solution (0–300 μL), and 225 μL of 10 mg/L hexaconazole standard solution were successively added. The mixture was homogenized, allowed to stand for 5 min, diluted to 1 mL with methanol, and then subjected to SERS intensity measurement. The results are shown in Figure 6. The peak area at 1584 cm−1 reached its maximum when 200 μL of NaCl solution was used, compared to other volumes. Therefore, 200 μL of NaCl solution was selected as the optimal volume.
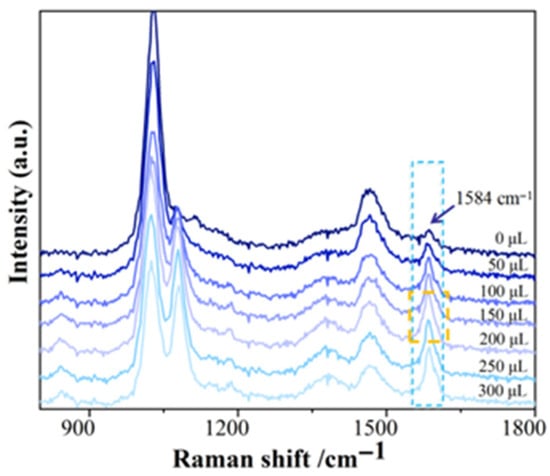
Figure 6.
Effect of different volumes of NaCl solution on SERS intensity of hexaconazole.
3.3.4. Mixing Time
Following the optimal mixing sequence and the predetermined optimal volumes of solutions, 400 μL of C-AgNP solution, 200 μL of 1 mol/L NaCl solution, and 225 μL of 10 mg/L hexaconazole standard solution were sequentially transferred into a centrifuge tube. The mixture was diluted to 1 mL with methanol and measured at different reaction times to evaluate the effect on SERS intensity, each solution was measured three times. The results are shown in Figure 7.
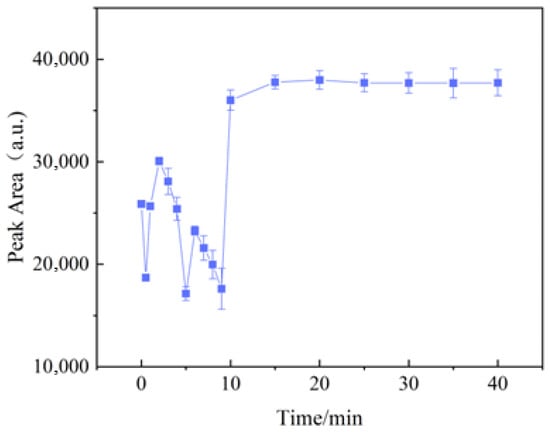
Figure 7.
Effect of mixing time on SERS intensity of hexaconazole (n = 3).
Initially, the SERS intensity was unstable, fluctuating significantly, likely due to inconsistent adsorption of hexaconazole molecules onto the silver nanoparticles. After 15 min, the SERS intensity stabilized. Therefore, a mixing time of 20 min was selected for subsequent experiments.
3.4. Detection of Hexaconazole
3.4.1. Calibration Curve
A series of hexaconazole standard solutions at different concentrations was prepared and their SERS intensities were measured under optimal conditions to construct a calibration curve, and each solution was measured three times. The results demonstrated a good linear relationship between the SERS intensity (ISERS) and the concentration (C) of hexaconazole in the range of 0.25–2.25 mg/L, with the regression equation expressed as ISERS = 51,671.35 C + 38,408.91 (R2 = 0.9870) (shown as Figure 8), and the lowest detection limit (LOD) of hexaconazole was 0.072 mg/L (3σ/k, where σ is the standard deviation of the blank sample and k is the slope of the standard curve).
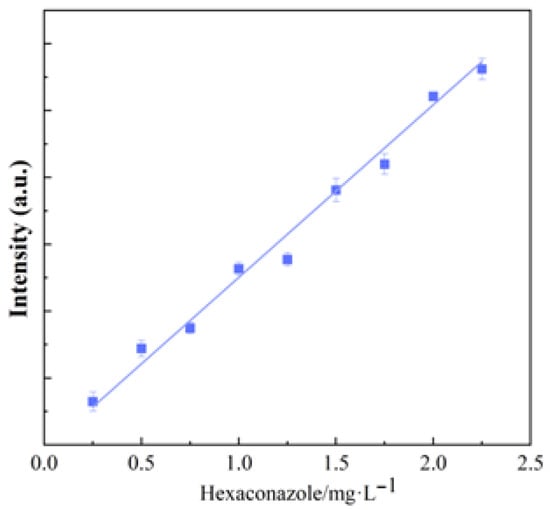
Figure 8.
The relationships of peak intensities (band 1584 cm−1) and the concentrations of hexaconazole (n = 3).
3.4.2. Stability and Precision Experiments
To evaluate the stability of the system, method stability and precision experiments were conducted. Three reference solutions with concentrations of 0.25 mg/L, 1 mg/L, and 2 mg/L were tested 3 times over a period of 10 days. The results, as shown in Figure 9a, demonstrate a relative standard deviation (RSD) below 2.99%, indicating good system stability. To assess the precision of the system, a reference solution with a concentration of 1 mg/L was measured 11 times. The results, presented in Figure 9b, show an RSD of 1.68%, confirming the high precision of the system.
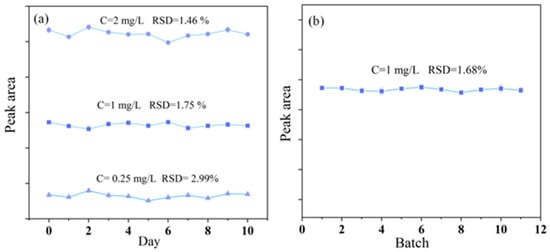
Figure 9.
(a) The inter-day precision was assessed by analyzing reference solutions at three different concentrations of 0.25, 1, and 2 mg/L (n = 3). (b) The precision of the system was assessed by analyzing a reference solution with a concentration of 1 mg/L 11 times.
3.4.3. Analysis of Kiwifruit Samples
Based on the optimal experimental conditions determined in Section 3.3, 400 μL of C-AgNP solution, 200 μL of NaCl solution (1 mol/L), and 225 μL of the sample solution prepared in Section 2.5 were pipetted into a centrifuge tube. The mixture was shaken well and allowed to stand for 20 min. Afterward, methanol was added to adjust the volume to 1 mL, and SERS detection was performed. The results are shown in Table 2.
Table 2.
Results of the detection of hexaconazole in kiwifruit by SERS (n = 3).
The residue of hexaconazole in sample X2 was detected at a level of 0.0091 mg/kg, which is below the maximum residue limit (MRL) set by the European Commission. No residues were detected in samples X1 and X3.
3.4.4. Recovery Experiment
To validate the accuracy of the method, a spike recovery experiment was conducted. Standard solutions were spiked at a gradient of concentrations, and sample X1 was processed following the procedure described in Section 3.4.3. The recovery rates were calculated based on the measurement results. As shown in Table 3, the recovery rates ranged from 88.40% to 105.5%, demonstrating good accuracy of the method and its applicability for detecting hexaconazole residues in kiwifruit samples.
Table 3.
Recoveries found in standard addition experiment (n = 3).
4. Discussion
This study developed a rapid quantitative method for detecting hexaconazole in kiwifruit based on surface-enhanced Raman spectroscopy (SERS). Using a portable Raman spectrometer as the detection platform, colloidal silver nanoparticles (C-AgNPs) as the SERS-active substrate, and 1 mol/L NaCl as the aggregating agent for the silver colloid, SERS enhancement was achieved by inducing signal “hot spots,” enabling rapid acquisition of the fingerprint spectrum of hexaconazole for qualitative and quantitative analysis. The experimental conditions were optimized and thoroughly discussed, leading to the establishment of a corresponding analytical method. The results indicated that the optimal mixing sequence was the addition of C-AgNPs first, followed by NaCl, and finally hexaconazole. The SERS intensity stabilized after 15 min of mixing, and 20 min was selected as the optimal mixing time. The characteristic peak at 1584 cm−1 was identified as the fingerprint signal for hexaconazole.
Under the optimized conditions, the method exhibited a good linear relationship in the concentration range of 0.25–2.25 mg/L, with a regression equation of ISERS = 51,671.35 C + 38,408.91 (R2 = 0.9870). The stability test showed a relative standard deviation (RSD) below 2.99%, the precision test yielded an RSD of 1.68%, and the average recovery rate ranged from 88.40% to 105.50%.
5. Conclusions
This study successfully established a rapid and highly sensitive detection method based on SERS for the quantitative analysis of hexaconazole in kiwifruit. This method offers advantages such as rapid detection, low cost, and on-site real-time analysis, making it suitable for determining hexaconazole levels in kiwifruit and other agricultural products. Through further development of portable integrated devices and multi-channel detection chips, it is expected to achieve simultaneous and high-throughput detection of multiple agricultural residues in the future, and has broad application prospects in the field of food safety supervision.
Author Contributions
Q.D.: formal analysis, visualization, and writing—original draft. L.S.: formal analysis. L.L.: investigation and methodology. T.L.: resources, and writing—review and editing. J.P.: investigation and methodology. W.L.: conceptualization, funding acquisition, project administration, resources, supervision, and writing—review and editing. All authors have read and agreed to the published version of the manuscript.
Funding
This research was funded by the PhD Initiation Fund of the Liaoning Science and Technology Department, Grant/Award Number: 2024-BS-282, and by the Education Department of Liaoning Province, Grant/Award Number: LJ212510169008.
Data Availability Statement
The authors confirm that the data supporting the findings of this study are available within the article.
Conflicts of Interest
The authors declare no conflicts of interest.
Abbreviations
The following abbreviations are used in this manuscript:
| SERS | Surface-Enhanced Raman Spectroscopy |
References
- Cialla, D.; März, A.; Böhme, R.; Theil, F.; Weber, K.; Schmitt, M.; Popp, J. Surface-Enhanced Raman Spectroscopy (Sers): Progress and Trends. Anal. Bioanal. Chem. 2012, 403, 27–54. [Google Scholar] [CrossRef]
- Wicaksono, W.P.; Dang, H.; Lee, S.; Choo, J. Electrochemical Surface-Enhanced Raman Spectroscopy Analysis of Malachite Green on Gold Substrates. Appl. Surf. Sci. 2024, 649, 159163. [Google Scholar] [CrossRef]
- Farcau, C.; Astilean, S. Mapping the Sers Efficiency and Hot-Spots Localization on Gold Film over Nanospheres Substrates. J. Phys. Chem. C 2010, 114, 11717–11722. [Google Scholar] [CrossRef]
- Zhang, D.; Liang, P.; Chen, W.; Tang, Z.; Li, C.; Xiao, K.; Jin, S.; Ni, D.; Yu, Z. Rapid Field Trace Detection of Pesticide Residue in Food Based on Surface-Enhanced Raman Spectroscopy. Microchim. Acta 2021, 188, 370. [Google Scholar] [CrossRef]
- Xu, M.-L.; Gao, Y.; Han, X.X.; Zhao, B. Detection of Pesticide Residues in Food Using Surface-Enhanced Raman Spectroscopy: A Review. J. Agric. Food Chem. 2017, 65, 6719–6726. [Google Scholar] [CrossRef]
- Pang, S.; Yang, T.; He, L. Review of Surface Enhanced Raman Spectroscopic (Sers) Detection of Synthetic Chemical Pesticides. TrAC Trends Anal. Chem. 2016, 85, 73–82. [Google Scholar] [CrossRef]
- Zhang, H.; Deng, X.; Fu, J.; Chen, Y.; Jin, S. Flexible Sponge Surface Enhances Raman Scattering (Sers) Substrate with Patterned Superwettability for Ultrasensitive Pesticide Detection. ACS Appl. Nano Mater. 2024, 7, 10852–10859. [Google Scholar] [CrossRef]
- Chen, J.; Zeng, Y.; Zhang, D.; Qi, P.; Liu, X.; Song, R.; Wang, P. Immunoassay Analysis of Escherichia Coli and Staphylococcus Aureus Based on Sandwich-Structured Complex Probe and Target-Induced Strand Displacement. Microchim. Acta 2023, 191, 17. [Google Scholar] [CrossRef]
- Tang, Y.; Zhang, X.; Wang, R.; Zhang, H.; Yang, L.; Jiang, X.; Zhao, B. A TiO2/ZnO (Nanoparticle/Quantum Dot) Heterojunction with Strong Interfacial Coupling for Ultrasensitive Sers Sensing of Antibiotic Residues in Environment (Water and Soil) and Their Efficient Degradation. J. Environ. Chem. Eng 2025, 13, 115287. [Google Scholar] [CrossRef]
- Ma, L.; Xu, Q.; Yin, L.; Wu, W.; Han, E.; Wang, C.; Zhou, R.; Bai, J.; Cai, J. Simultaneous Detection of Acetamiprid and Carbendazim Based on Raman-Silent Spectral Window Tags-Mediated Surface-Enhanced Raman Scattering Aptasensor Coupled with Magnetic Separation. Sens. Actuators B Chem. 2024, 400, 134792. [Google Scholar] [CrossRef]
- Liu, E.; Fan, X.; Yang, Z.; Han, L.; Li, S.; Huang, Y.; Liao, K.; Cai, L. Rapid and Simultaneous Detection of Multiple Illegal Additives in Feed and Food by Sers with Reusable Cu2o-Ag/Af-C3n4 Substrate. Spectrochim. Acta Part A Mol. Biomol. Spectrosc. 2022, 276, 121229. [Google Scholar] [CrossRef]
- Feng, Z.; Zhang, P.; Yang, X.; Guo, X.; Yu, J.; Du, L.; Shao, J.; Liang, H.; Jiang, H. Simultaneous Detection of Two Pesticide Residues in Tobacco Leaves Using Sio2@Ag-Sers Substrate and Portable Raman Spectrometer. J. Food Compos. Anal. 2024, 133, 106461. [Google Scholar] [CrossRef]
- Zhou, J.-Y.; Zhu, J.; Weng, G.-J.; Li, J.-J.; Zhao, J.-W. Fabrication of Sers Composite Substrates Using Ag Nanotriangles-Modified Sio2 Photonic Crystal and the Application of Malachite Green Detection. Spectrochim. Acta Part A Mol. Biomol. Spectrosc. 2024, 318, 124472. [Google Scholar] [CrossRef] [PubMed]
- Lee, J.; Min, K.; Kim, Y.; Yu, H.K. Surface-Enhanced Raman Spectroscopy (Sers) Study Using Oblique Angle Deposition of Ag Using Different Substrates. Materials 2019, 12, 1581. [Google Scholar] [CrossRef]
- Sadhu, V.A.; Jha, S.; Mehta, V.N.; Miditana, S.R.; Park, T.J.; Kailasa, S.K. Green Synthetic Approach for the Preparation of Blue Emitting Gold Nanoclusters: A Simple Analytical Method for Detection of Hexaconazole Fungicide. J. Fluoresc. 2025, 35, 2943–2956. [Google Scholar] [CrossRef] [PubMed]
- Wang, Y.; Zhu, W.; Qiu, J.; Wang, X.; Zhang, P.; Yan, J.; Zhou, Z. Monitoring Tryptophan Metabolism after Exposure to Hexaconazole and the Enantioselective Metabolism of Hexaconazole in Rat Hepatocytes in Vitro. J. Hazard. Mater. 2015, 295, 9–16. [Google Scholar] [CrossRef]
- Liang, H.; Li, L.; Li, W.; Wu, Y.; Liu, F. The Decline and Residues of Hexaconazole in Tomato and Soil. Environ. Monit. Assess. 2012, 184, 1573–1579. [Google Scholar] [CrossRef]
- Deng, Z.; Hu, J.; Qin, D.; Li, H. Simultaneous Analysis of Hexaconazole, Myclobutanil, and Tebuconazole Residues in Apples and Soil by Spe Clean-up and Gc with Nitrogen–Phosphorus Detection. Chromatographia 2010, 71, 679–684. [Google Scholar] [CrossRef]
- Luo, G.; Pang, J.; Sun, D.; Zhang, Q. Stereoselective Toxicokinetic and Distribution Study on the Hexaconazole Enantiomers in Mice. Toxics 2023, 11, 145. [Google Scholar] [CrossRef] [PubMed]
- Paramasivam, M. Determination of Synthetic Pyrethroids and Hexaconazole Residues in Curry Leaves and Decontamination through Household Techniques. J. Food Sci. Technol. 2022, 59, 1549–1557. [Google Scholar] [CrossRef] [PubMed]
- Shao, D.; Bi, S.; Zhao, R.; Sun, X.; Li, X.; Yu, J. Selective Determination of Dinitolmide and Toltrazuril by Surface-Enhanced Raman Spectroscopy (Sers) Using Agnps as Substrate. Sens. Actuators B Chem. 2020, 307, 127644. [Google Scholar] [CrossRef]
- Kumar, S.; Goel, P.; Singh, J.P. Flexible and Robust Sers Active Substrates for Conformal Rapid Detection of Pesticide Residues from Fruits. Sens. Actuators B Chem. 2017, 241, 577–583. [Google Scholar] [CrossRef]
- Zhang, J.; Qu, S.; Zhang, L.; Tang, A.; Wang, Z. Quantitative Surface Enhanced Raman Scattering Detection Based on the “Sandwich” Structure Substrate. Spectrochim. Acta Part A Mol. Biomol. Spectrosc. 2011, 79, 625–630. [Google Scholar] [CrossRef] [PubMed]
- Rao, J.; Yang, R.; Yuan, H.; Qiu, C. Ultrasensitive Trace Detection of Dye Molecules Based on Scanning Microsphere-Coupled Surface-Enhanced Raman Spectroscopy. J. Phys. Chem. C 2024, 128, 8418–8425. [Google Scholar] [CrossRef]
- Qiu, X.; Wang, F.; Gao, X.; Zhang, H.; Wu, H.; Gong, X.; Lin, J. Detection of Hyaluronidase in Urine Using Hyaluronic Acid-Coated Silver Nanoparticles-Based Surface-Enhanced Raman Spectroscopy for the Diagnosis of Bladder Cancer. Talanta 2025, 294, 128139. [Google Scholar] [CrossRef]


Disclaimer/Publisher’s Note: The statements, opinions and data contained in all publications are solely those of the individual author(s) and contributor(s) and not of MDPI and/or the editor(s). MDPI and/or the editor(s) disclaim responsibility for any injury to people or property resulting from any ideas, methods, instructions or products referred to in the content. |
© 2025 by the authors. Licensee MDPI, Basel, Switzerland. This article is an open access article distributed under the terms and conditions of the Creative Commons Attribution (CC BY) license (https://creativecommons.org/licenses/by/4.0/).