Abstract
Here, we discuss the effect of In2O3 nanoparticles on the reduced graphene oxide (rGO) gas-sensing potentialities. In2O3 nanoparticles were prepared with the polymer precursors method, while the nanocomposites were prepared by mixing an In2O3 nanoparticle suspension with an rGO suspension in different proportions. The gas-sensing performance of our materials was tested by exposing our materials to known concentrations of a target toxic gas in a dry airflow. Our results demonstrate that In2O3 nanoparticles enhance the rGO sensitivity for strong oxidizing species such as O3 and NO2, while a negative effect on its sensitivity for NH3 sensing is observed. Furthermore, our measurements towards H2S suggest that the concentration of In2O3 nanoparticles can induce an uncommon transition from p-type to n-type semiconductor nature when rGO–In2O3 nanocomposites operate at temperatures close to 160 °C.
1. Introduction
Graphene’s remarkable physical properties justify the emergence of several studies investigating this material as a sensing material. Its high electronic mobility, intrinsic surface area, high transparency, and excellent mechanical properties make graphene-based materials and devices great potentials to develop new technologies [1]. Furthermore, the relativistic nature of the electronic conduction in graphene and its high surface area has opened several research opportunities to implement these materials as different sensing elements. For instance, there are significant recent advances in graphene-based sensors for human health monitoring [2], FET-based electrochemical sensors and biosensors [3,4,5], flexible electronics [6,7], strain sensors [8,9,10,11], and printed electronics [12,13], among other applications.
Within this context, graphene-based gas sensors have been extensively studied in the recent past [14]. The pioneering work of Schedin et al. [15] demonstrated that pristine graphene could detect low concentrations of typical pollutants when operating at room temperature. There are significant achievements worth noting in graphene-based gas sensors. For instance, they are especially sensitive for nitrogen-reactive species detection such as nitrogen dioxide (NO2) or ammonia (NH3) [16,17,18,19,20,21]. Flexible and printed gas sensors based on graphene derivatives have also been developed with excellent sensitivity [22,23,24,25]. One form of graphene that has been especially explored as chemical sensors is the so-called reduced graphene oxide (rGO). rGO can be depicted as a few layers of graphene-like sheets piled up with a high density of crystalline defects and a small concentration of oxygenated groups (-OH, -COOH, C-O-C) bonded to its surface [26,27]. This material can have its most fundamental physical properties depending on the concentration of the oxygenated groups remaining from the reduction process of graphene oxide [28]. A redox reaction mediates the phenomenon of gas detection by semiconductors between the gas and the material’s surface. Consequently, the gas-sensing properties of rGO should be strongly dependent on the reduction process and the remaining oxygenated groups on its surface.
Some recent strategies to tailor and improve these materials’ performance as gas-sensitive layers are based on combining rGO with other nanostructured materials such as metal nanoparticles [29,30], quantum dots [31,32], transition metal dichalcogenides [33,34,35,36], and semiconducting metal oxides (SMOx) nanoparticles [37]. Recent work on nanocomposites based on rGO-SMOx demonstrated that these materials should achieve high-performance at a low-temperature range (<150 °C). When combined, these materials form heterojunctions, whose nature depends on the materials used. Frequently, these hybrid materials exhibit superior gas sensing performances to the materials isolated. For instance, rGO–WO3 nanocomposites form p–n heterojunctions and perform well for several gases [38,39,40,41,42]. Some studies have reported rGO–WO3 nanocomposites operating at room temperature for NH3 [43,44], NO2 [45]. Another rGO–WOx nanocomposite was successfully implemented to detect toluene for concentrations as low as one ppm [46]. Zinc oxide is another SMOx used to elaborate rGO-based nanocomposites for gas sensing applications. These nanocomposites also demonstrated excellent sensing properties for NH3 [47], NO2 [48], and H2S [49]. Some important developments regarding ternary nanocomposites based on rGO, ZnO, and noble metals are also reported. For instance, ternary rGO–ZnO–Au nanocomposites showed low temperature sensing properties for H2 [50] and VOCs [51]. In this context, Pt can also be used to reduce the operating temperature of these devices, showing excellent selectivity for H2 at 100 °C [52]. More recently, important results obtained by Moon et al. [53] demonstrated remarkable room temperature sensing properties of flexible sensors based on rGO–ZnO nanocomposites. It is important to note that other semiconducting metal oxides such as SnO2 [54,55,56], Cu2O [57], and Co3O4 [58] are also being extensively studied to form nanocomposites with rGO and exhibiting promising results. rGO–SMOx nanocomposites have been recently explored with promising results regarding the detection of volatile organic compounds (VOCs) [59,60].
Among these semiconducting metal oxides, In2O3 is a well-known gas-sensitive material that has been extensively studied. This material can be grown in different nanostructures [61,62,63,64] and exhibits a wide bandgap of 2.9 eV [65]. Some significant efforts to combine this material with rGO have been fruitful in enhancing its sensing performances. The work of Andre et al. [66], for example, demonstrated that nanofibers of In2O3 can be used to prepare rGO-based nanocomposites with higher sensitivity, faster response, and recovery for NH3 detection. The detection of NO2 by rGO–In2O3 nanocomposites has already revealed remarkable results at low and room temperature sensing [67,68] and as flexible sensors [69]. Generally, the processing and fabrication techniques of rGO-In2O3 nanocomposites and rGO–SMOx nanocomposites are typically based on hydrothermal processes [65,66,67,68,69], because this technique provides an excellent junction between the two materials. Additionally, it provides a path to control the size and the morphology of the nanostructured materials. However, such techniques require specific equipment and further heat treatments to oxidize the SMOx precursors and form the heterojunction.
It is important to note that most strategies to tailor the sensing properties of semiconductor-based gas sensors are frequently focused on enhancing the sensitivity and decreasing the response time. However, arguably, the greatest challenge for developing the new generation of gas sensors based on semiconductor materials is the capacity of a particular material to react only with a particular gaseous species. In other words, the new generation of gas sensors must have better selectivity. The selectivity of semiconductor-based gas sensors is poor, and more experimentation is necessary to assess this particular property of rGO-based nanocomposites. Here, we propose a simple procedure to synthesize and implement rGO–In2O3 nanocomposites in gas-sensing devices. To investigate the nature of the interaction between the material and the gases, we tested our materials for common cross-reactive oxidizing (O3 and NO2) and reducing gases (NH3 and H2S). A systematic sequence of characterization of these nanocomposites through X-ray diffraction, Raman spectroscopy, X-ray photoelectron spectroscopy (XPS), and scanning electron microscopy (SEM) materials is presented.
Furthermore, we show that the performance of such materials towards the detection of typical pollutants (NH3, H2S, NO2, and O3) can be tailored by controlling the ratio between rGO and In2O3 nanoparticles. Our results demonstrate that In2O3 nanoparticles can improve the rGO’s sensing performance towards NO2, which agrees with previous literature results. Regarding O3 detection, our results suggest that the strong oxidizing nature of this pollutant promotes a permanent oxidation reaction between the gas and the rGO as the operating temperature increases. Towards NH3, the addition of In2O3 nanoparticles decreases the sensors’ response and increases its response time. Regarding the performance for H2S detection, our results highlight that it is possible to induce a change of the fundamental type of response of the rGO–In2O3 nanocomposites exposed to this gas. Consequently, the nanocomposites layers could interact with H2S as a p or n-type semiconductor depending on the operating temperature and the concentration of In2O3 nanoparticles used to fabricate the sensing device.
2. Materials and Methods
A suspension of reduced graphene oxide 10 mg/mL and indium nitrate (In(NO3)3·H2O) were used as raw materials and were purchased from Sigma Aldrich Brazil. Nanostructured In2O3 was prepared through the polymeric precursor method. This method is based upon the formation of metallic complexes using hydrocarboxylic acid followed by a polymerization reaction that is promoted by increasing the temperature of this metallic complex in the presence of a polyalcohol. Here, In2O3 nanoparticles were prepared using indium nitrate as the precursor, citric acid as a complexing agent, and ethylene glycol for the polymerization reaction that forms a resin containing In3+ ions. For this reaction, the optimal molar ratio between citric acid and indium nitrate was 3:1, while the optimal volume ratio between the citric acid solution and ethylene glycol was 3:2, respectively. The nanoparticles are formed after a heat-treatment of the resin at 500 °C for 1 h. The nanocomposites were prepared by diluting the rGO suspension in deionized water to 0.1 mg/mL. Similarly, 50 mg of the In2O3 powder were dispersed in 20 mL of deionized water (2.5 mg/mL). Then, these two dispersions were sonicated for 30 min and mixed in four different proportions: 0, 5, 15, and 50 v/v% of In2O3 to rGO.
The structural characterization was carried out using conventional θ-2θ X-ray powder diffraction in a Rigaku Ultima IV diffractometer using Cu-Kα radiation (λ = 1.5418 Å) and LiF (100) monochromator. The Rietveld refinement was carried out with GSAS-II [70] and the 3D structure representations with VESTA Crystallography [71]. After exciting the samples with an Ion-Ar laser beam, the Raman spectra were collected in a Witec microscope equipped with a Peltier cooled CCD (λ = 514 nm). The sensing materials and films’ morphology was evaluated with a Zeiss Sigma Field Emission Scanning Electron Microscope. The SEM images analysis was carried out with ImageJ software [72]. The surface area ratio between rGO and In2O3 was estimated for each image using contrast differences, while the nanoparticle size was estimated by measuring the largest dimension of more than 300 nanoparticles measured from the images.
The chemical state of the surface elements was evaluated using a Scientia Omicron ESCA spectrometer with a monochromatic X-ray source Al-Kα (1486.7 eV, with a power of 280 W and a constant pass energy mode of 50 eV).
For the gas sensing performance characterization, the nanocomposites dispersions were drop-casted onto high-density alumina substrates built with screen-printed Pt interdigitated electrodes on the upper side and a screen-printed Pt heater on the bottom side. The electrical measurements and control were carried out in a lab-built experimental setup that enables complete control of experimental conditions: temperature, flow parameters, and pollutant concentration. Additionally, this system allows one to record the electrical resistance data of up to four samples simultaneously measured by the two-probe method and stored synchronously with the operating conditions. All instruments are controlled by a lab-made virtual instrument (VI) developed in LabVIEW. The gas sensing behavior was assessed by continuously monitoring each devices’ electrical resistance upon controlled exposure to the gases of interest. Our typical experiments consisted of stabilizing the devices at constant airflow for 12 h until equilibrium, followed by a step of controlled exposures (1, 2, 5, and 10 ppm) of sensing devices to H2S, NH3, and NO2. For O3, the exposure concentrations were 250, 500, 750, and 1000 ppb. We compare datasets obtained with operating temperatures set to 100 and 160 °C. In this work, we have defined the sensor’s response as ΔR/R0 = (Rgas − R0)/R0, where Rgas is the resistance when the devices are exposed to the target gas, and R0 is the resistance under air. After 12 h of the stabilization process, the exposure–recovery cycles started after 50 min. For data visualization purposes, we compare each dataset with the normalized resistance, i.e., the electrical resistance values divided the value before the first target gas exposure R/R50min.
3. Results
3.1. Structural Characterization
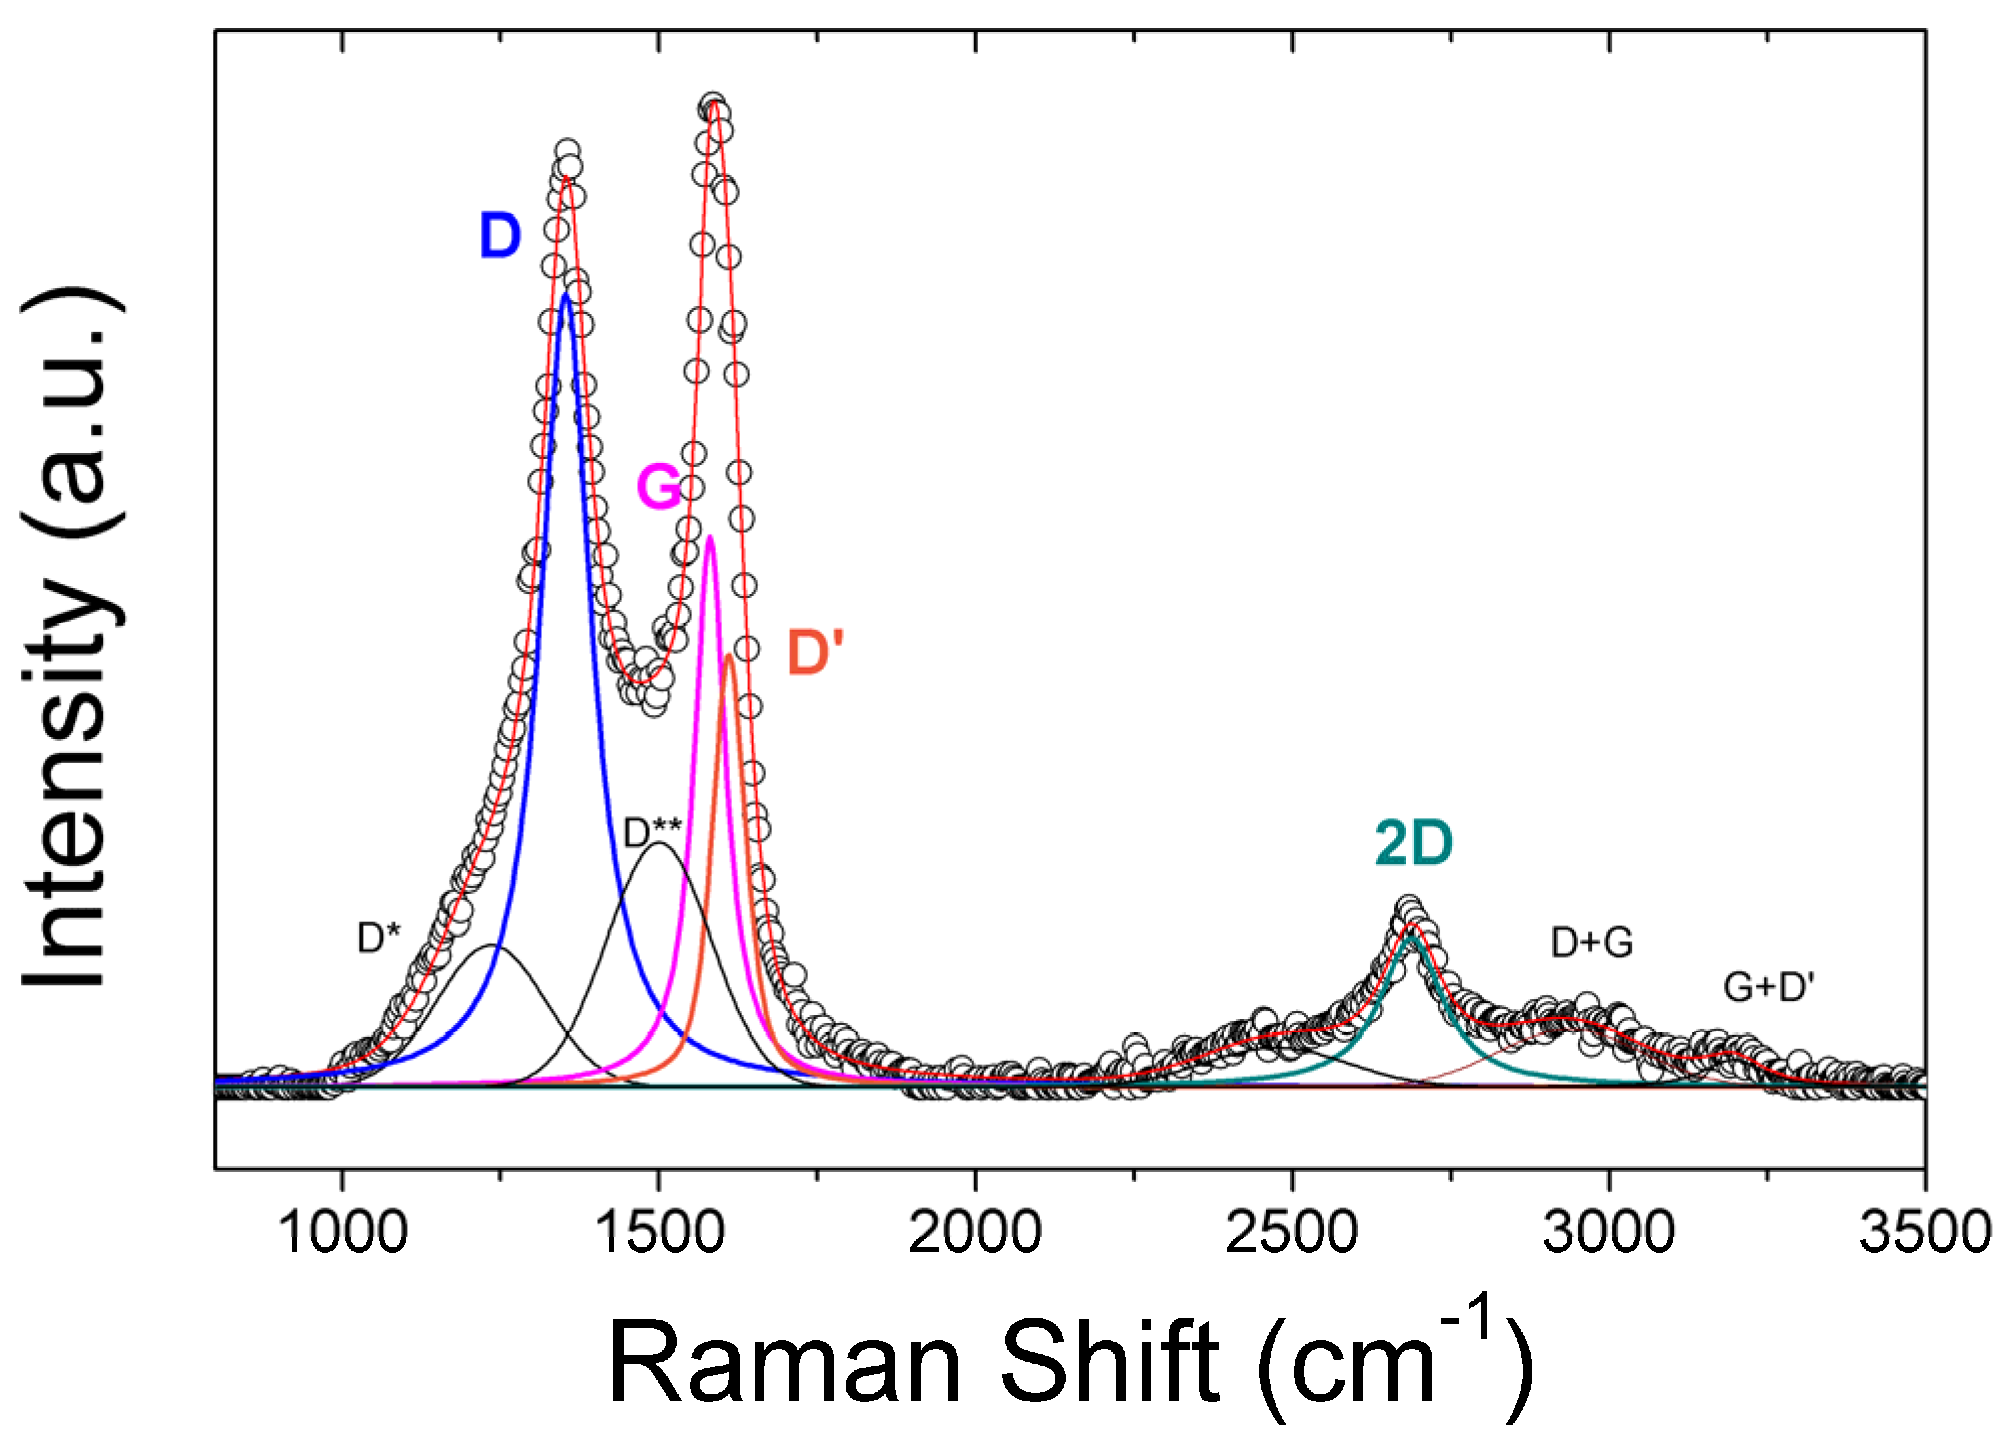
Figure 1 reports a typical Raman spectrum of the rGO used to elaborate the nanocomposites. Carbon-based materials exhibit several characteristic Raman vibration modes. The C-sp2 lattice vibration results in the well-known G-band (~1580 cm−1) present in graphite, carbon nanotubes, graphene, GO, and rGO. The D-band (~1350 cm−1) results from point defects vibration and is the most intense peak in GO and rGO-based materials. The D’ band is the first-order vibration mode of aromatic rings, while the 2D band is the second-order vibration mode of this structure. In ideal pristine graphene, the free π electrons are all confined in aromatic rings. Consequently, the relative intensity of this band should be twice higher than the G band in an ideal graphene sheet [73]. The intensity ratio between the 2D and G bands is a parameter often used to assess the quality of the rGO-based materials. Our samples exhibit I2D/IG = 0.28, which is comparable to the quality of rGO according to the study of Kaniyoor and Ramaprabhu [74].
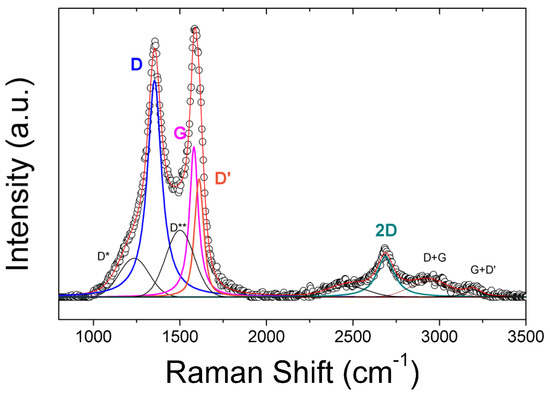
Figure 1.
Typical Raman spectra of the rGO used in this work. Highlighted peaks in this figure corresponds to the D (blue), G (pink), D’ (orange), and the second order 2D’. Black peaks represent other defect activated vibration modes such as D*, D**, D+G. G+D’.
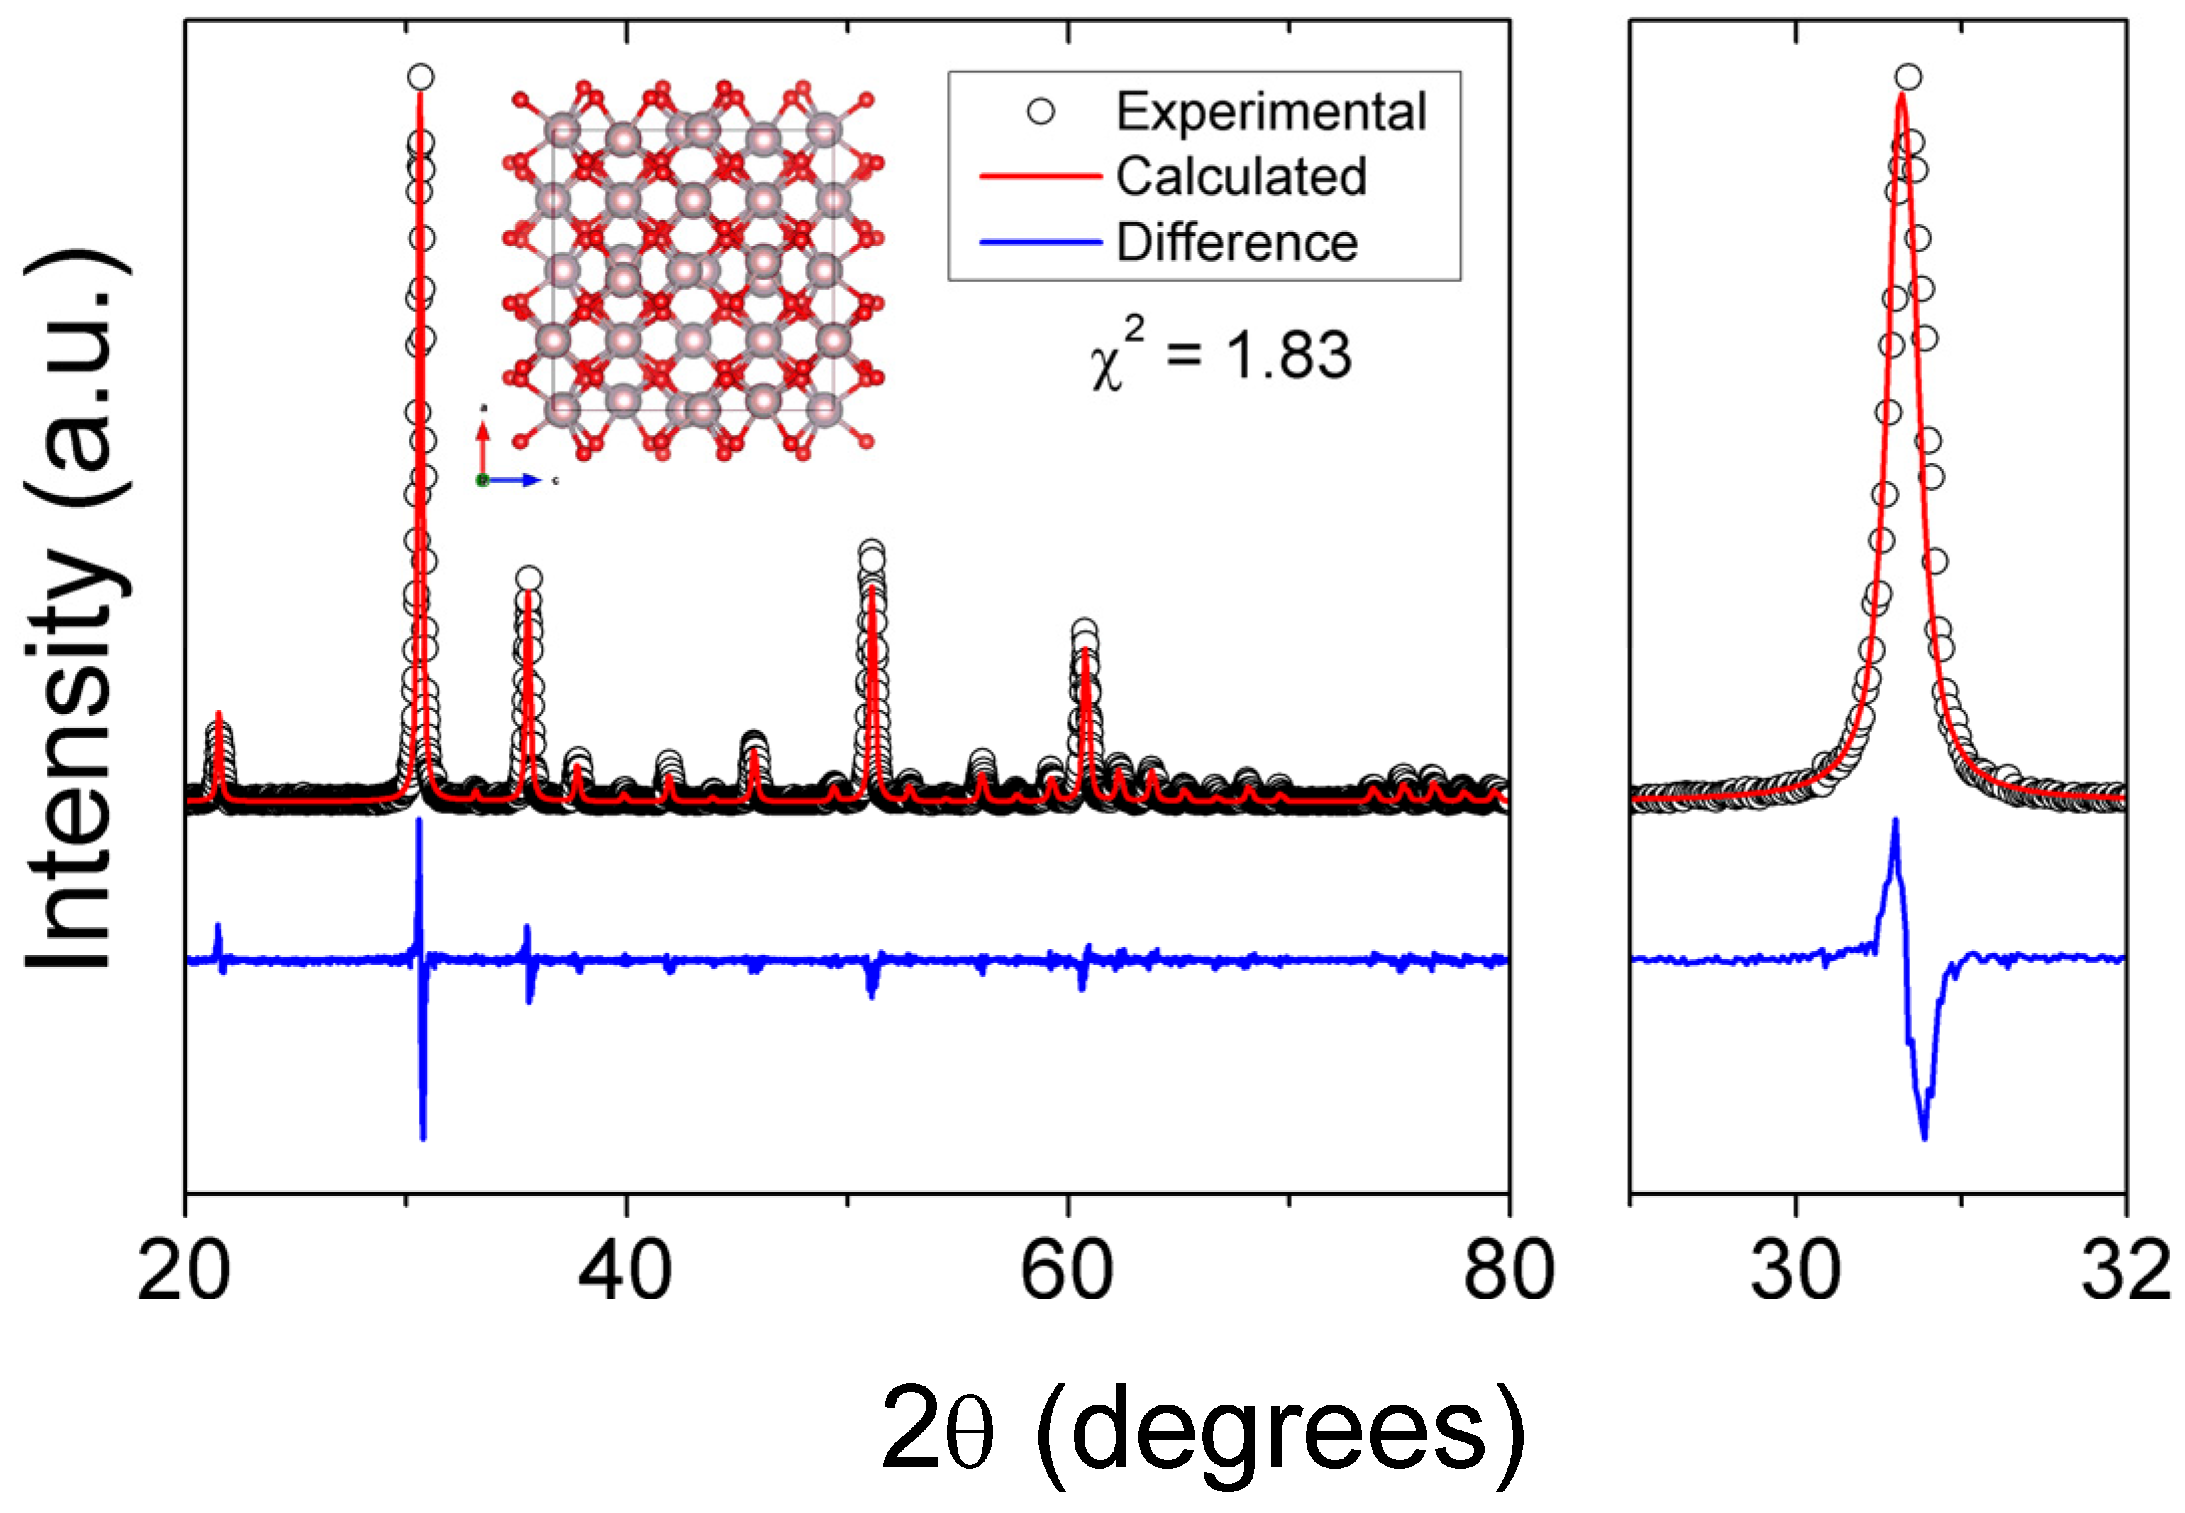
Figure 2 presents an X-ray diffraction pattern for an In2O3 sample prepared by the polymer precursor method described in Section 3.1 after heat-treating the resin at 500 °C. This oxide crystallizes in a cubic symmetry (space group Ia3). The lattice parameter was estimated at 1.01 nm through the Rietveld refinement. The refinement converged fast and yielded a goodness-of-fit of 1.83 and crystallite size estimated at 59 nm. The inset of Figure 2 shows a schematic representation of the typical bixbyite structure of In2O3.
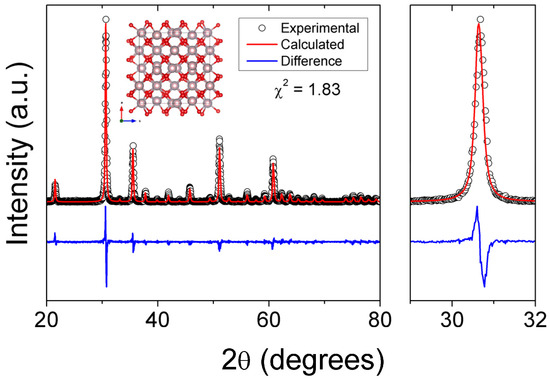
Figure 2.
θ-2θ X-ray diffraction pattern of the In2O3 nanoparticles. The inset presents the cubic crystal structure of In2O3.
3.2. Surface Characterization and Morphology
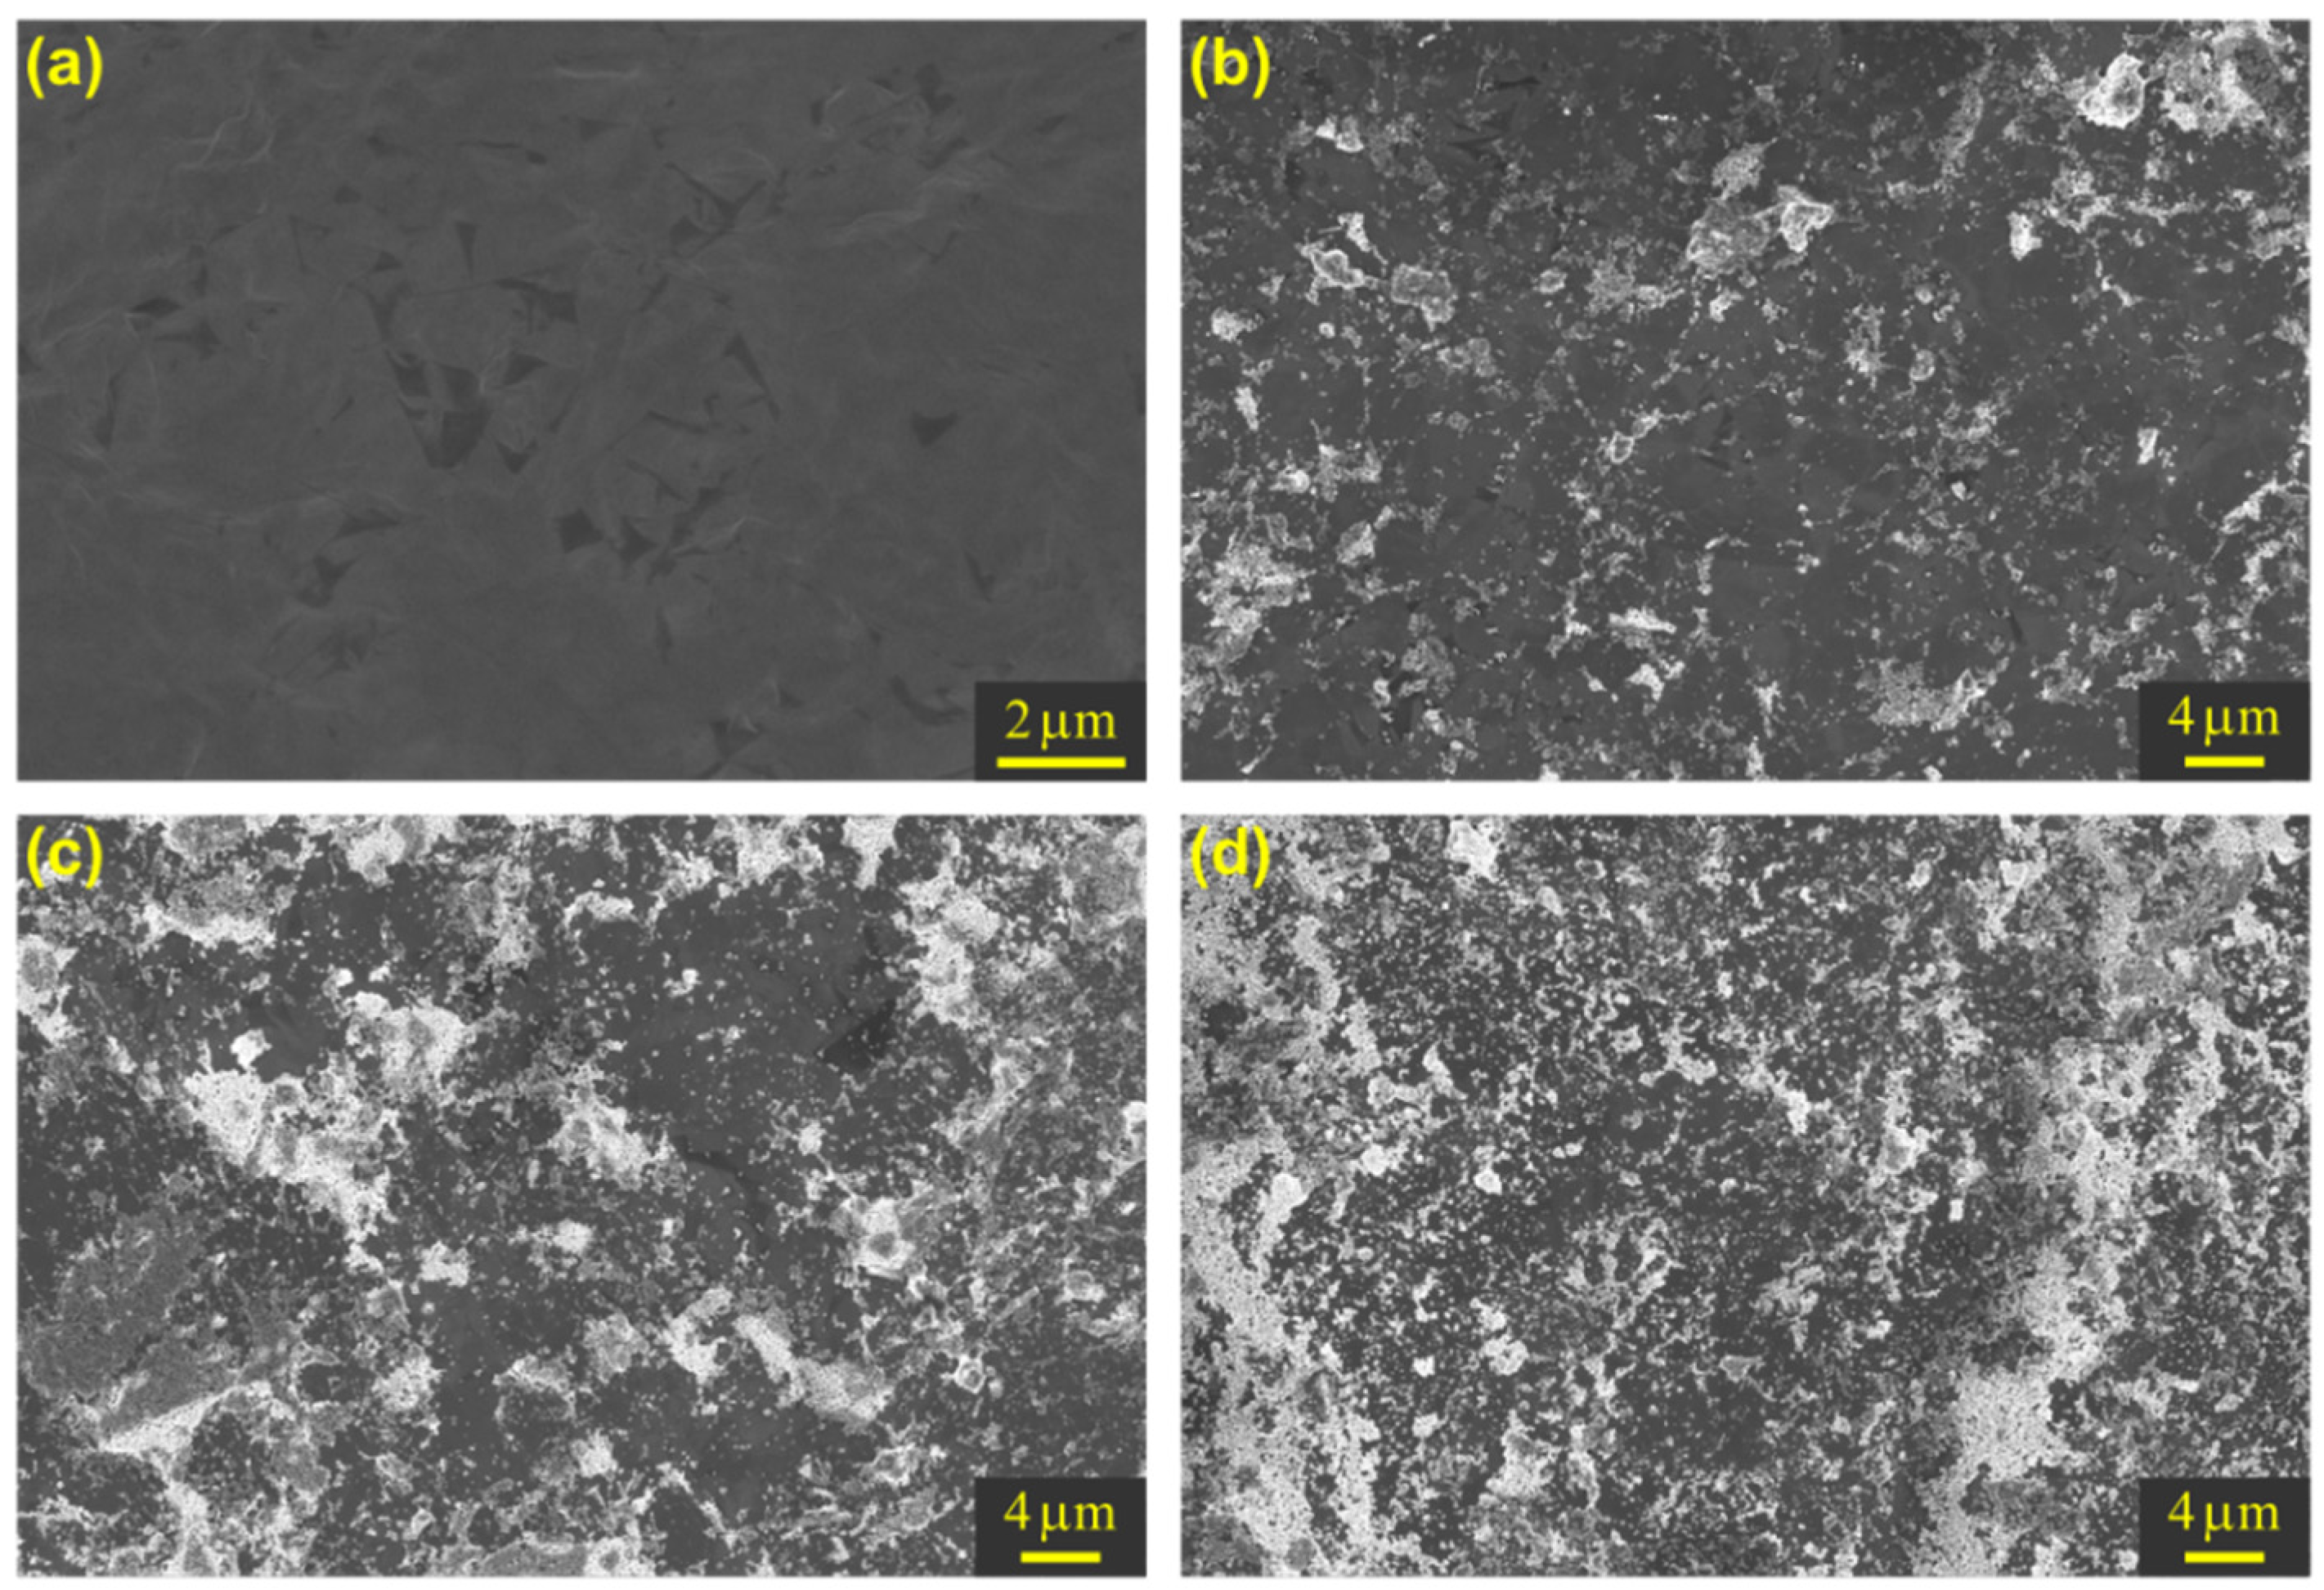
Figure 3 depicts SEM images of drop-casted nanocomposites samples. It is possible to observe in these micrographs that the amount of these In2O3 nanoparticles increases with the sample’s nominal composition. For example, Figure 3a–d show that the amount of nominal In2O3 nanoparticles increases from 0 to 50 v/v%. The Image J software [72] was used to estimate the surface area ratio between In2O3 nanoparticles and rGO (AIn2O3/ArGO). This ratio was calculated for the images in Figure 3b–d and was found to be 20.1%, 29.2%, and 46.3%, respectively. These results demonstrate that it is possible to tailor the chemical nature of the exposed surface to the atmosphere of such nanocomposites.
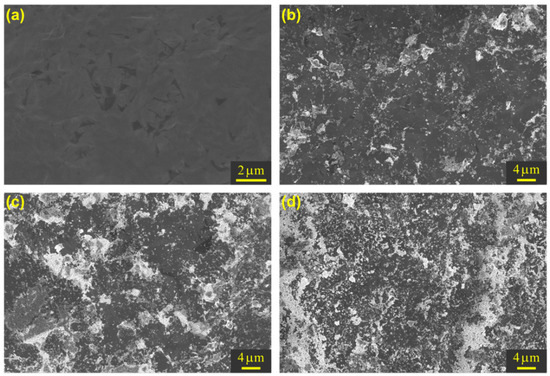
Figure 3.
Scanning electron microscopy images of (a) rGO and its mixture with (b) 5, (c) 15, and (d) 50 v/v% of In2O3 nanoparticles suspension.
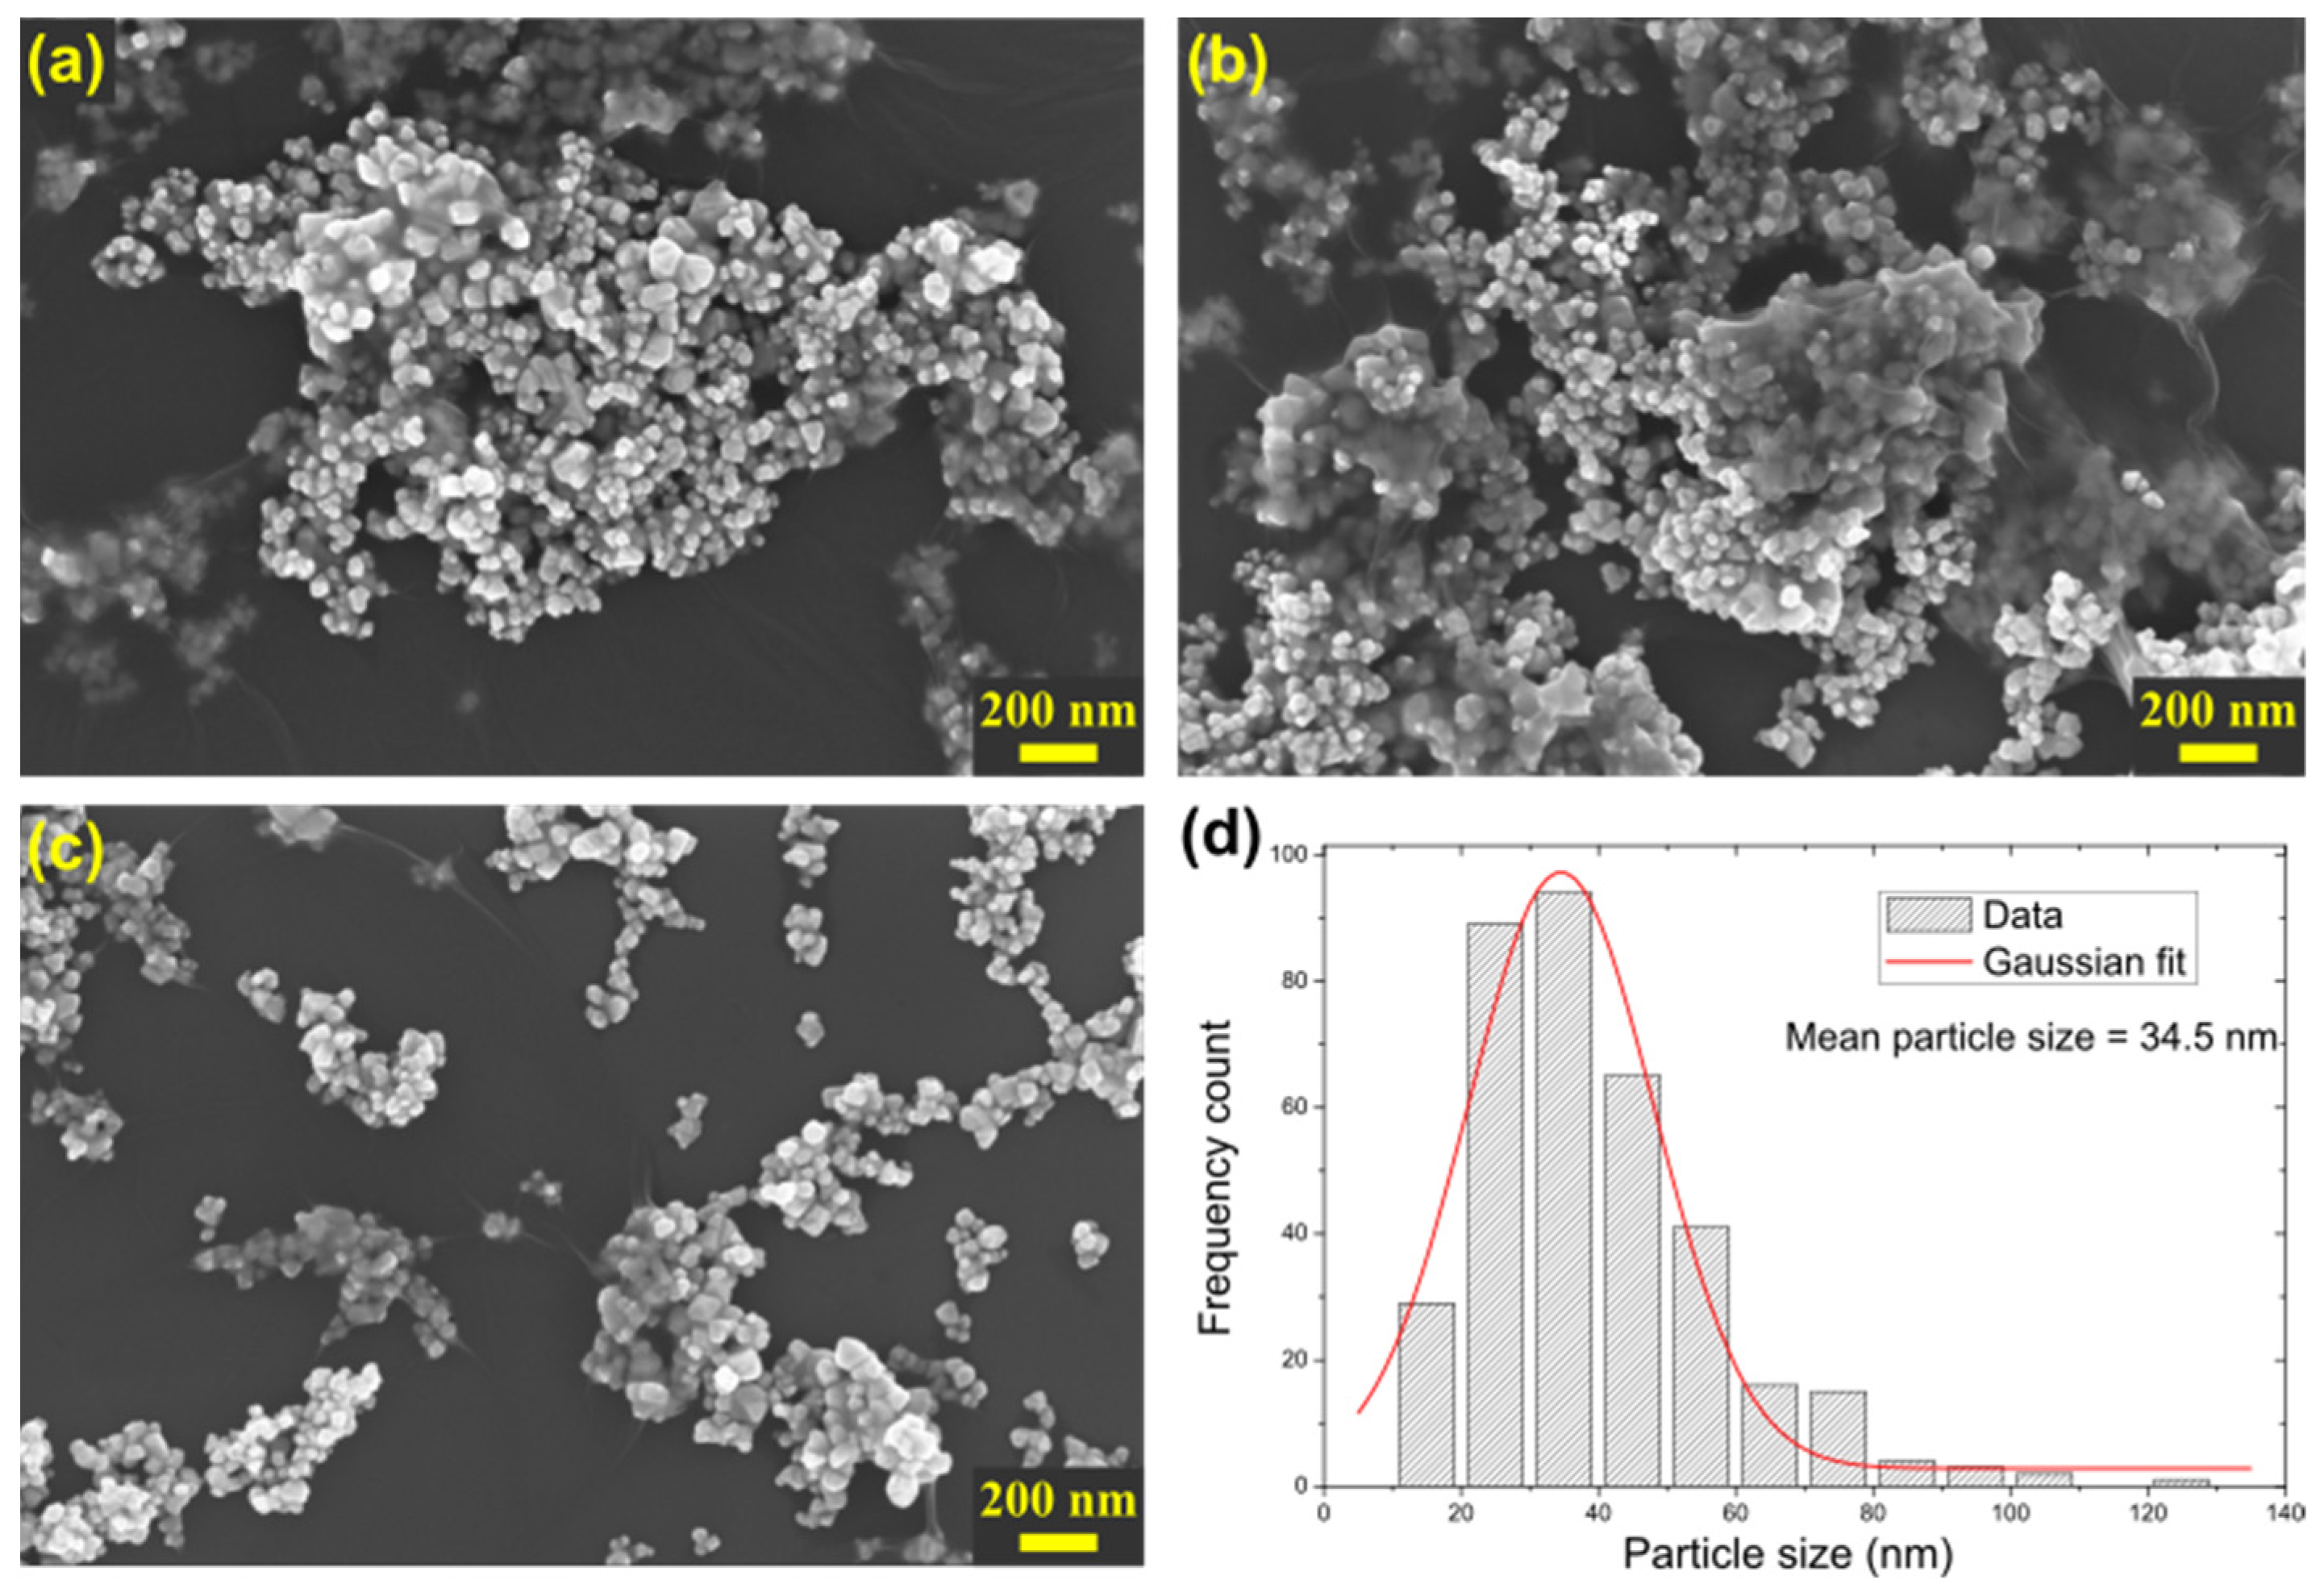
Figure 4 presents SEM images with higher magnification to better define the morphology aspects of our nanocomposites. One can observe three main features in these images. For instance, Figure 4a shows an agglomerate of In2O3 nanoparticles that are fully exposed to the atmosphere. Figure 4b shows the formation of regions where In2O3 nanoparticles agglomerates are partially incorporated into the rGO-layers. Finally, Figure 4c shows a region in which the particles are better dispersed into the matrix, exhibiting a great In2O3 area exposed to the atmosphere. The average particle size can be defined as the highest dimension of a particle, and by measuring these values of more than 300 particles from the images shown below, it is possible to estimate that the mean particle size of the In2O3 nanoparticles should lie in the vicinity of 34.5 nm after a Gaussian fit, which is in the same order of magnitude as the crystallite size estimated in the Rietveld refinement.
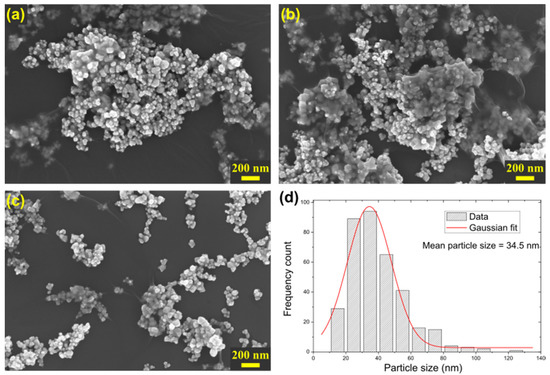
Figure 4.
Scanning electron microscopy image of samples prepared with (a) 5, (b) 15, and (c) 50 v/v% of In2O3 nominal compositions. (d) Particle size distribution and a Gaussian fit with an average particle size of 34.5 nm.
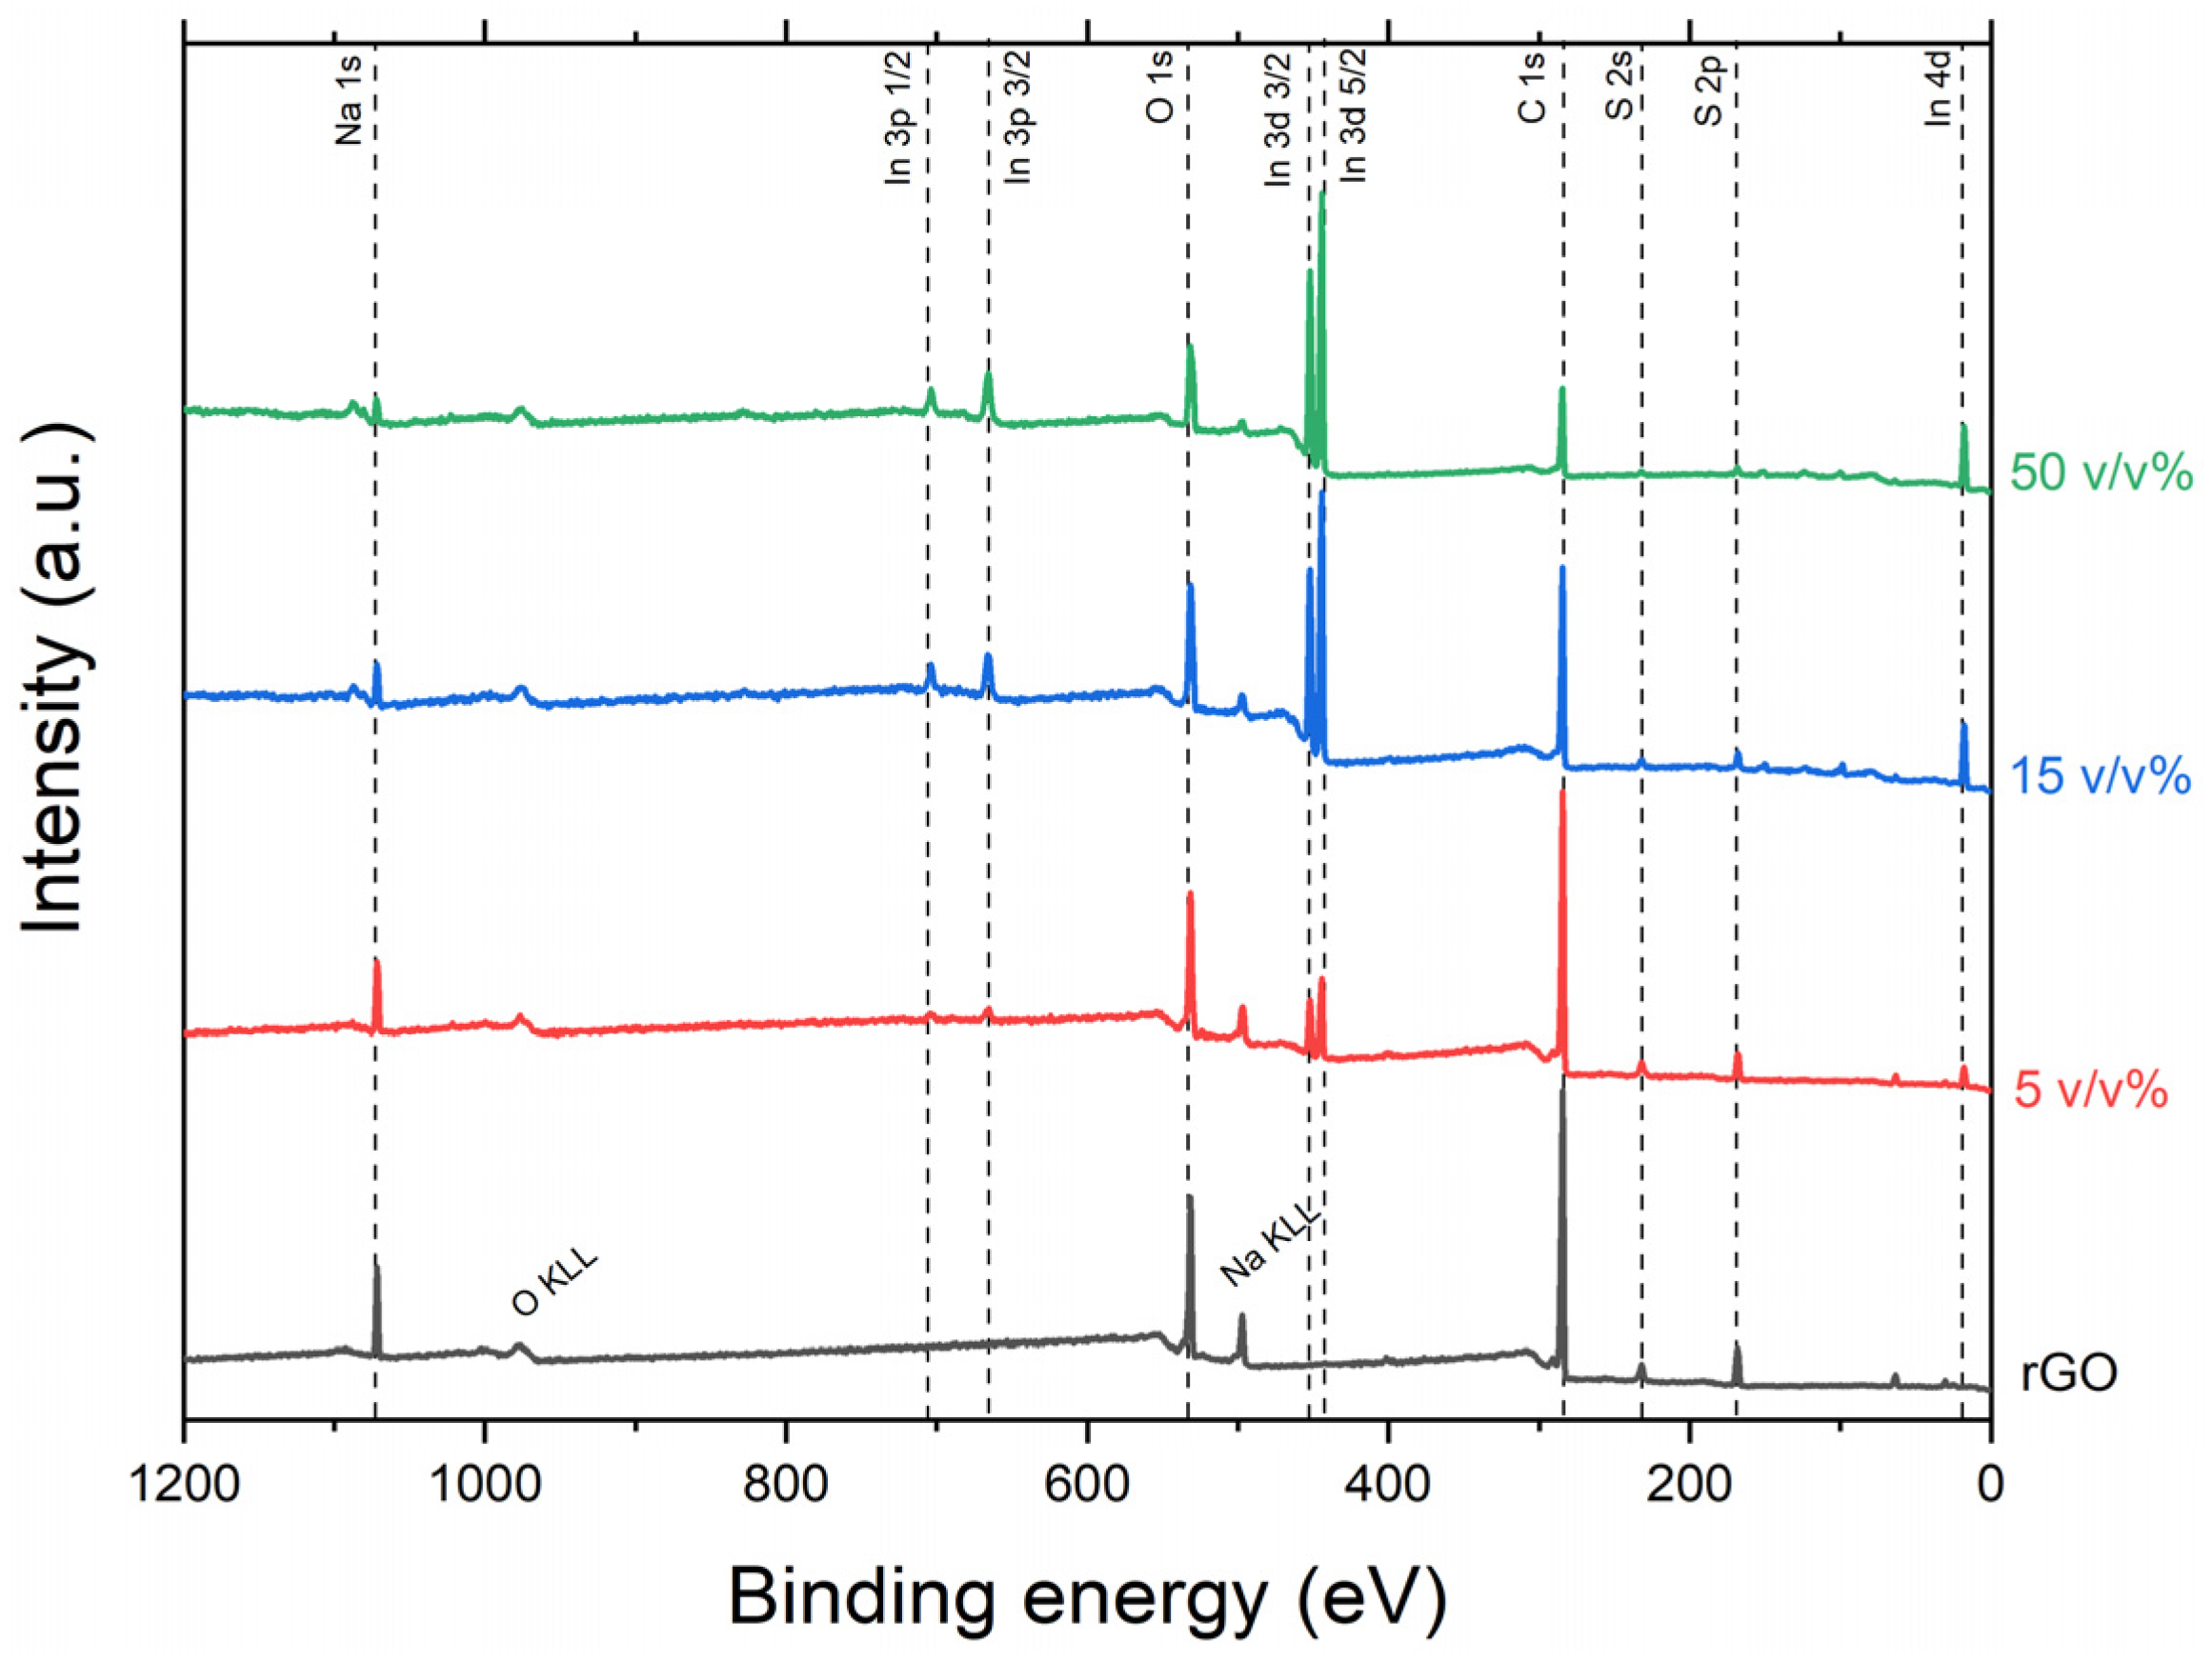
Figure 5 shows the XPS spectra evolution as the amount of In2O3 used in the fabrication of the nanocomposites increases. It is possible to observe that the intensity ratio of the peaks related to the In chemical surface states increases as the nominal composition of the samples increase. The surface atomic concentration of the two In 3d degenerate states are 1.5, 6.4, and 11.3% for the samples with 5, 15, and 50 v/v% of In2O3 nanoparticles. XPS results are summarized in Table 1.
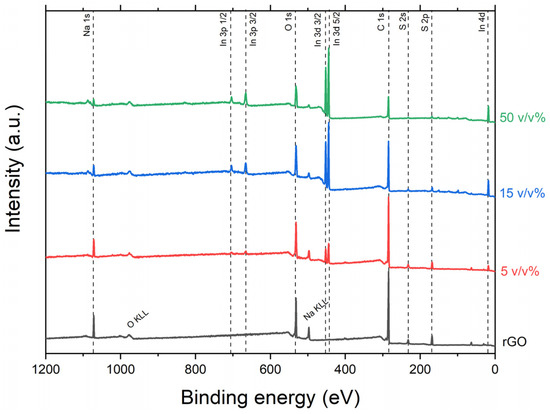
Figure 5.
X-ray photoelectron spectra of the rGO and rGO-In2O3 nanocomposites.

Table 1.
Analysis of the chemical surface states of the elements.
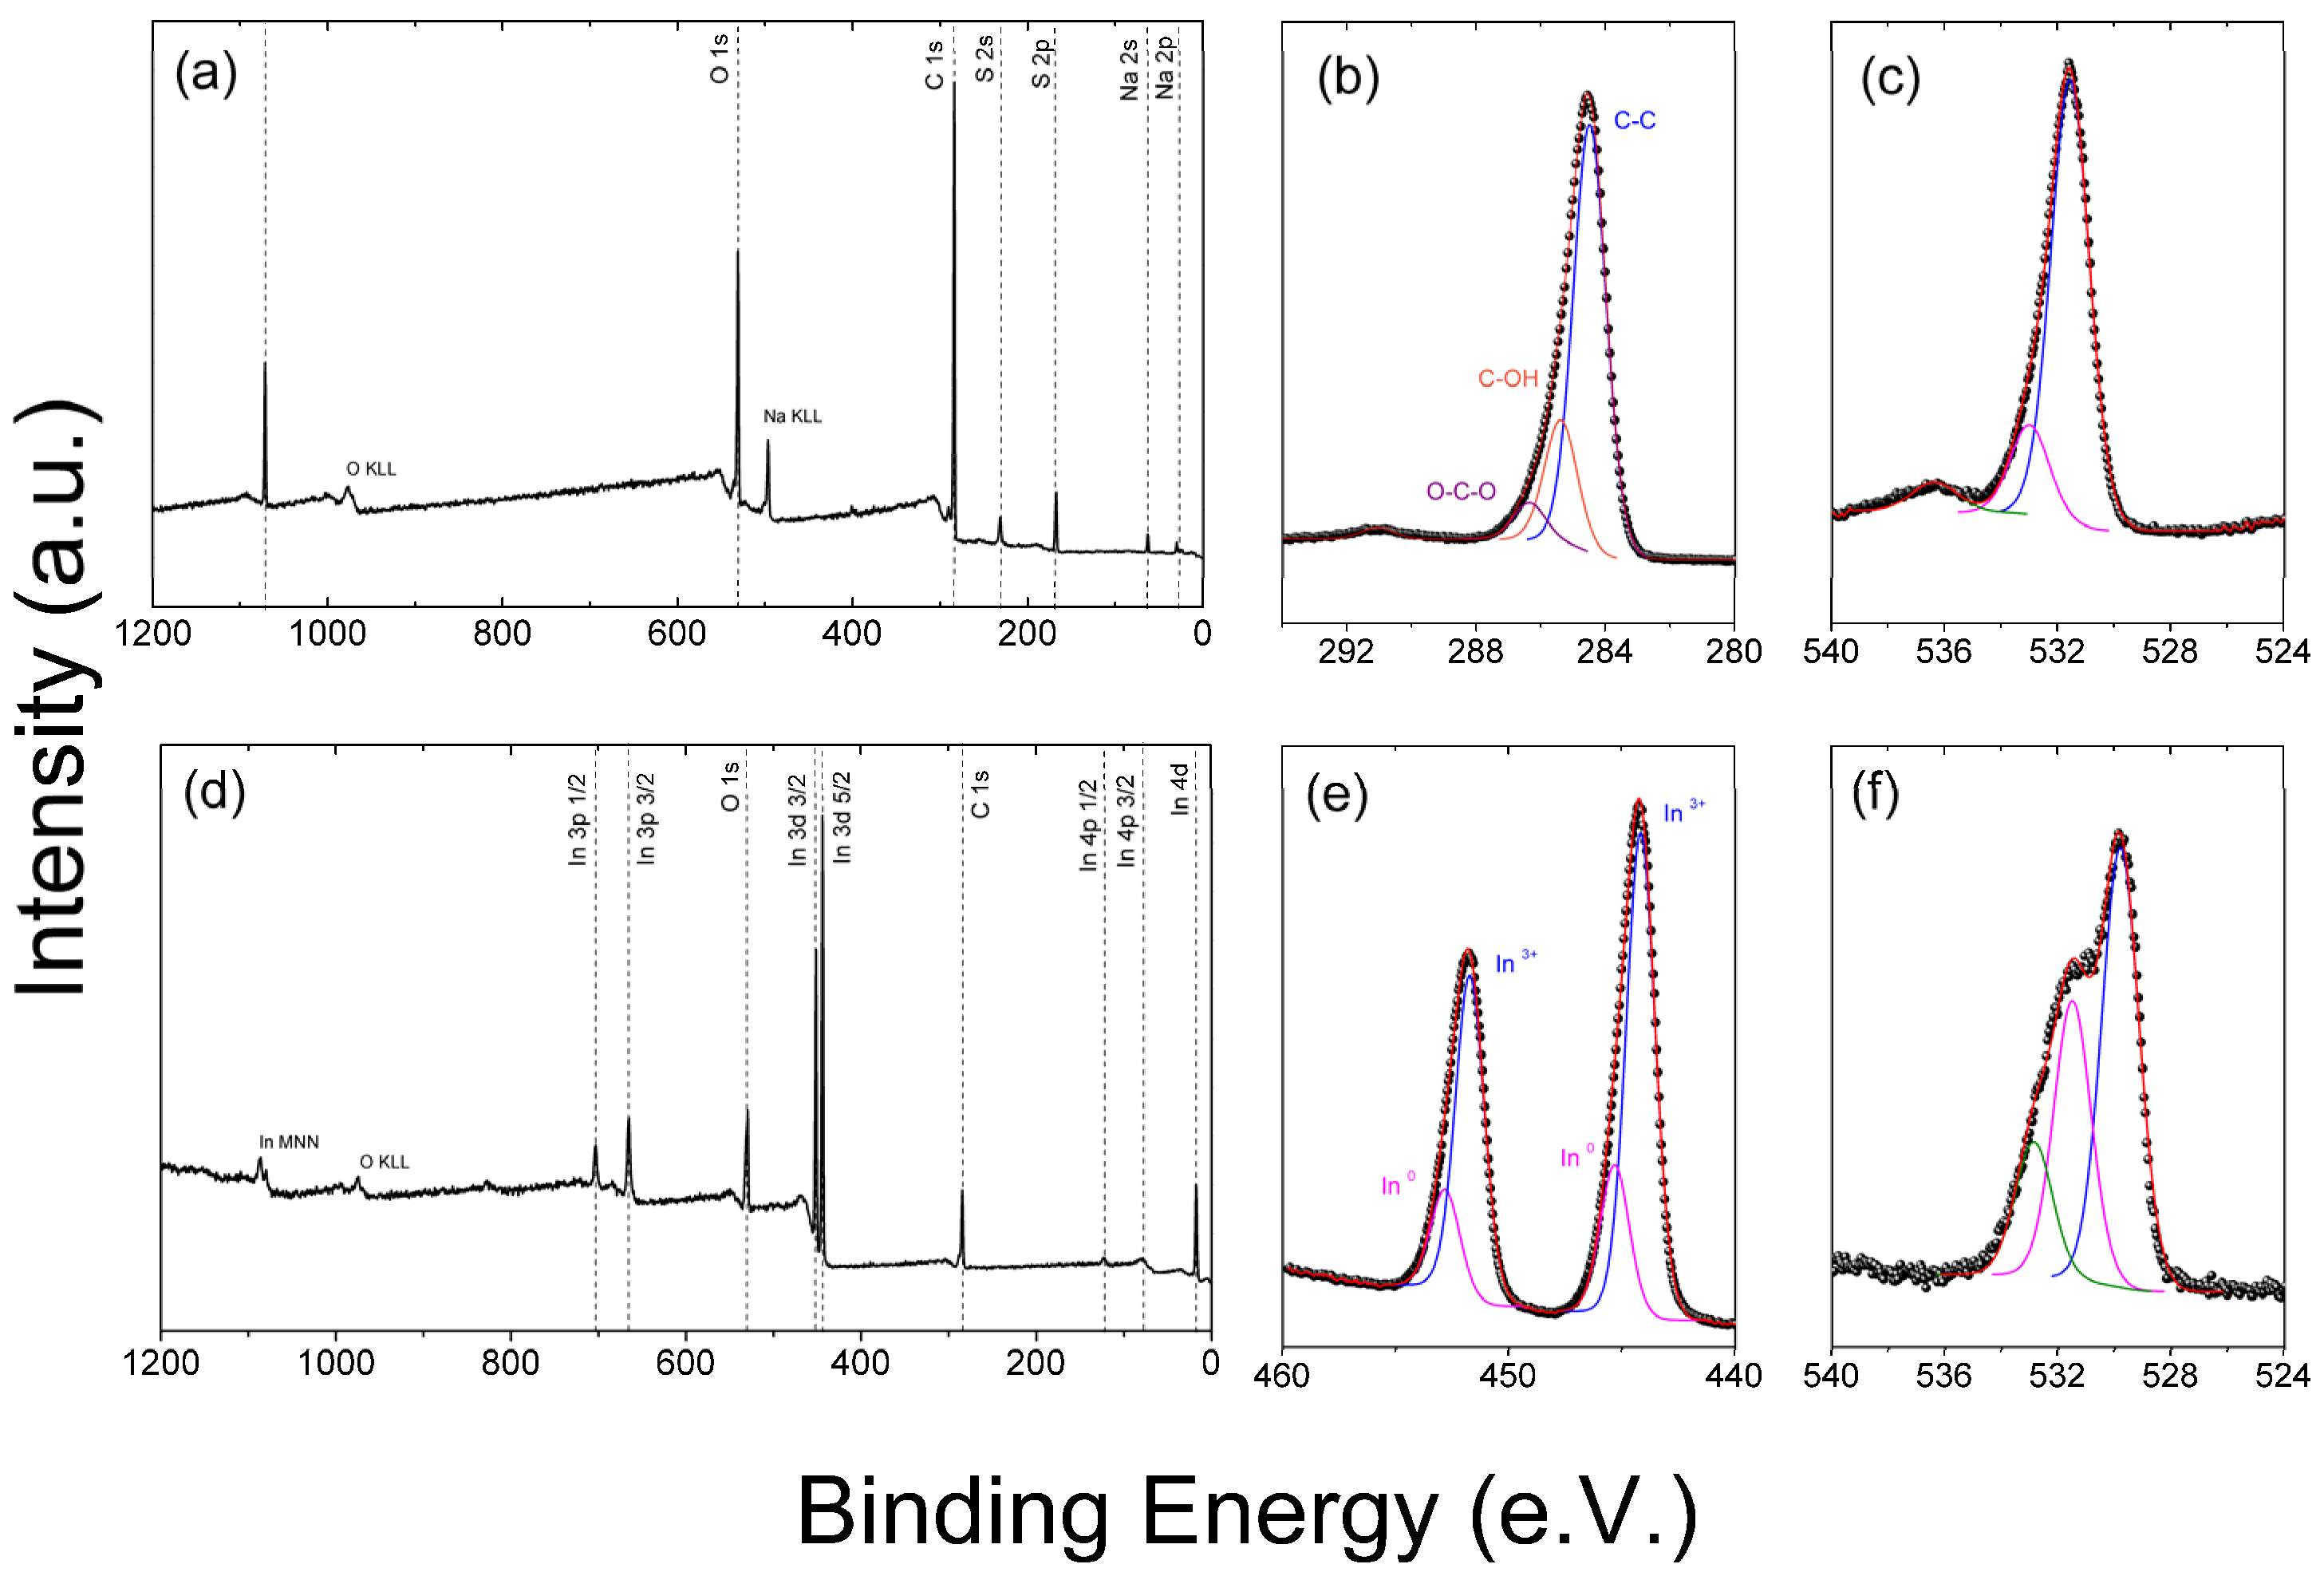
Figure 6a–f present typical X-ray photoelectron spectra of the rGO and In2O3 used in this work separately. Here, it is possible to observe that the rGO survey spectrum shown in Figure 6a exhibits not only C and O but also signals from Na and S. The presence of Na and S are related to the chemical route used to prepare this material; S is present due to oxidation of graphite with sulfuric acid (H2SO4). At the same time, Na is related to the reducing agents used to reduce the GO, such as sodium borohydride (NaBH4) or sodium citrate (Na3C6H5O7). The atomic composition of C, O, Na, and S accounts for 76.6, 14.5, 2.8, and 6.1% of this spectrum’s surface’s chemical states. The high-resolution C 1s and O 1s spectra shown in Figure 6b,c show that the carbon states are related to a massive presence of C-sp2 (71.1%) and C-sp3 (20.6%). C atoms bonded to O accounts for 8.35% of the C present on the surface. The high-resolution O spectra show two main components of O: one is related to O bonded to C, and the other is related to O bonded to S. Weakly adsorbed oxygenated species such as OH are also present. In this spectrum, O-C, O-S, and –OH account for 77.8, 15.8, and 6.3%, respectively.
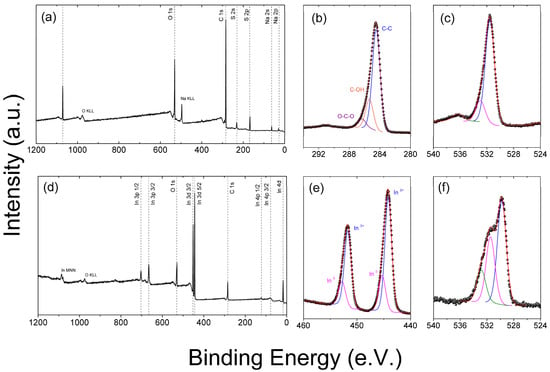
Figure 6.
Typical X-ray photoelectron spectra of the commercial (a–c) rGO and synthesized (d–f) In2O3. (a,d) corresponds to survey spectra, (b,e) to high-resolution C 1s, and (c,f) to high-resolution O 1s.
Figure 6d presents the a typical In2O3 survey spectrum, in which it is possible to observe peaks related to In 3p 1/2 (~702 eV), In 3p 3/2 (~664 eV), O 1s (~532 eV), C 1s (~284.5 eV), In 3d 3/2 (~451 eV), In 3d 5/2 (~443 eV), and In 4d (~16 eV). The In 3d peaks are shown in Figure 6e. The high-resolution spectra in the In 3d region shown in Figure 6e suggest that two chemical states are present in our samples, one assigned to In3+ and another to metallic In. Figure 6f presents the high-resolution spectra of O 1s peak, exhibiting three major components, assigned to structural oxide ions (O2−) at 530.5 eV, to weakly adsorbed species at the surface, such as peroxide ions (O−) or hydroxide ions (OH−) at 531.8 eV, and C-O bonds from adventitious carbon at 532.9 eV. These O components account for 51.5, 32.8, and 15.7% of the oxygen states on the surface, which is in agreement with the literature [75,76].
3.3. Gas Sensing Properties
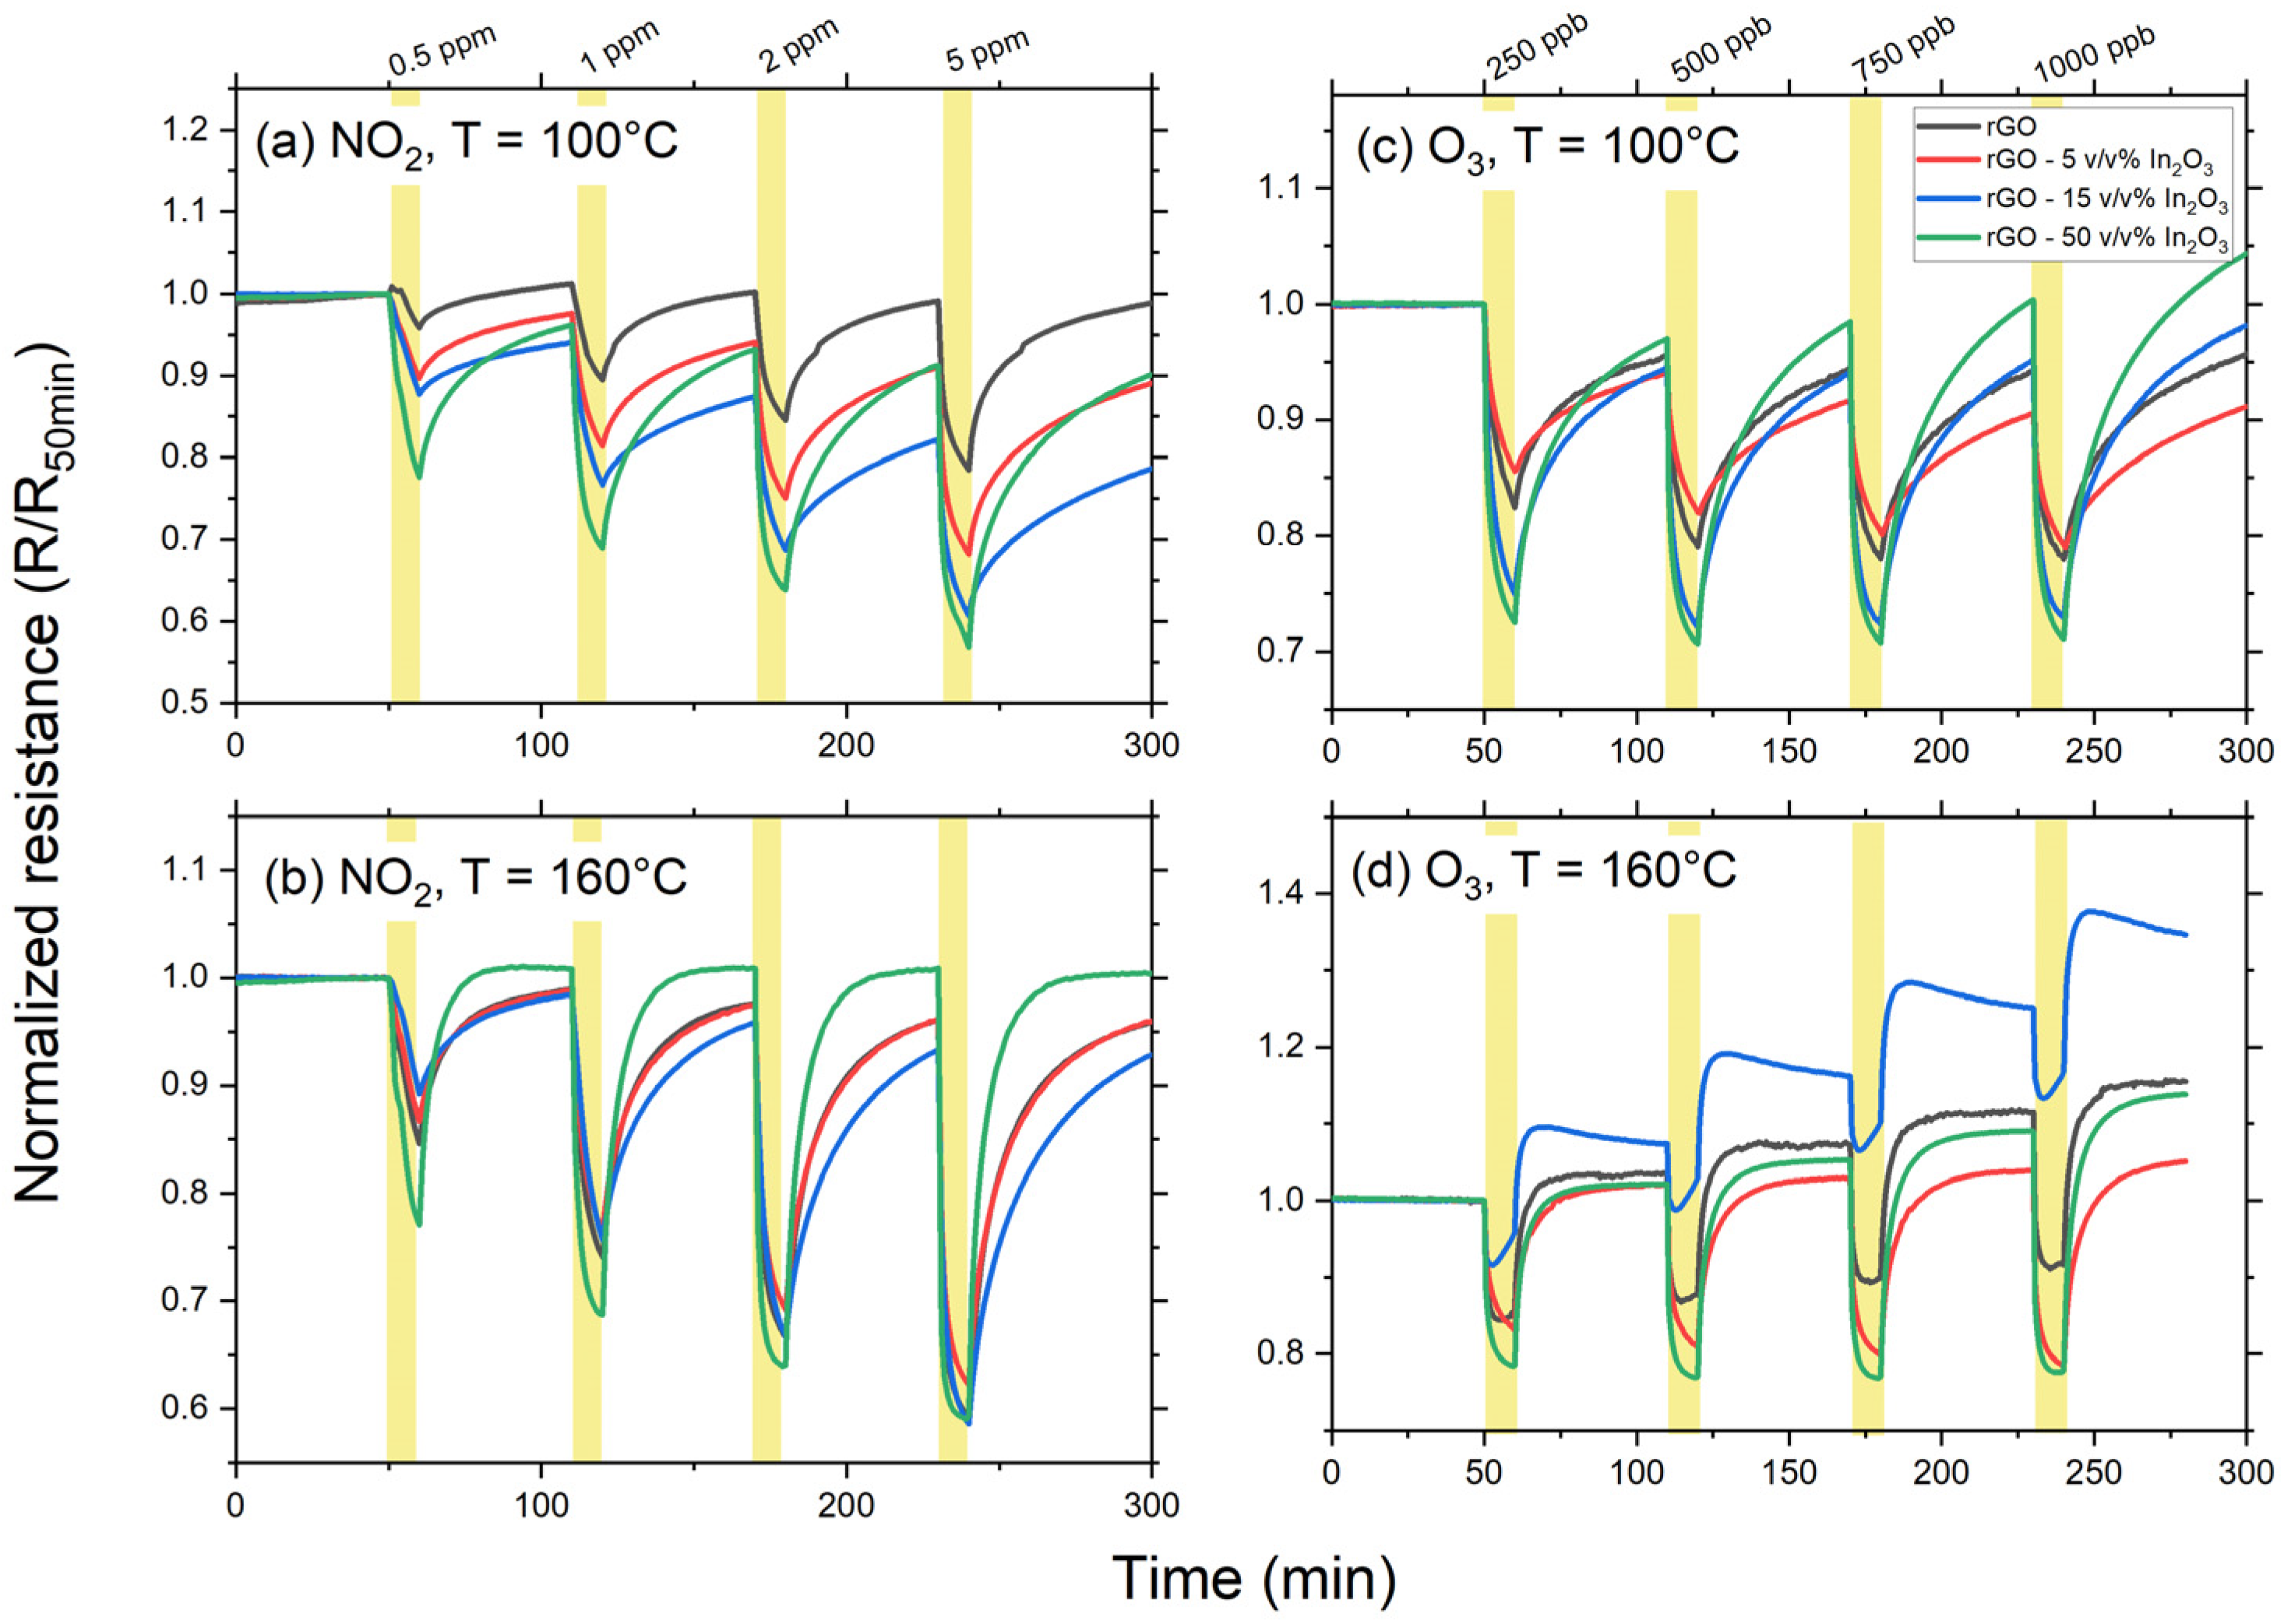
rGO-based gas sensors are well-known to exhibit high and fast responses towards NO2. Figure 7a,b present a dynamic response-recovery dataset of four sensors prepared with an increasing nominal composition of In2O3 nanoparticles to prepare the nanocomposites, as described in Section 2 of this manuscript. Two features should be noted in these figures. One is that the In2O3 nanoparticles tend to increase the sensors’ response towards NO2, which can be explained by the formation of p–n heterojunctions between p-type rGO and n-type In2O3 [69]. Moreover, the second feature is that the devices’ responses are higher as the operating temperature increases.
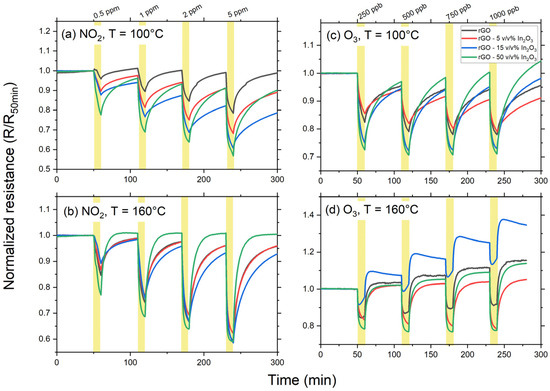
Figure 7.
Dynamic response–recovery curves from sensors based on rGO–In2O3 nanocomposites towards (a,b) NO2, and (c,d) O3.
Similar to what was observed for NO2, the addition of In2O3 nanoparticles also increased the sensors’ responses towards O3. However, some differences should be underlined. It is possible to observe that the responses of these sensors are independent of the O3 concentration when operating at 100 °C, suggesting that, at this temperature, the kinetics of the O3 adsorption reaction are low, and the steady-state under our experimental setup would take a long time. Another possibility is the low lifetime of O3 on the nanocomposite’s surface with a fast decomposition into oxygen species. The sensors’ responses are higher and faster when operating at higher temperatures, as shown in Figure 7d at 160 °C. However, samples operating at these conditions tend to exhibit a strong baseline drift towards higher resistance after each period of recovery. Such behavior is observed for every In2O3 nanoparticles concentration. It suggests that our nanocomposites react irreversibly with O3 through an ozonolysis process [77], affecting the rGO matrix. This phenomenon is activated by including In2O3 nanoparticles acting as a reaction catalyst. Preliminary XPS results demonstrate that the oxygen surface states can increase to levels of graphene oxide after exposing an rGO-based nanocomposite to one complete cycle of electrical resistance variations towards five exposure–recovery cycles of O3 concentrations between 250 and 1000 ppb.
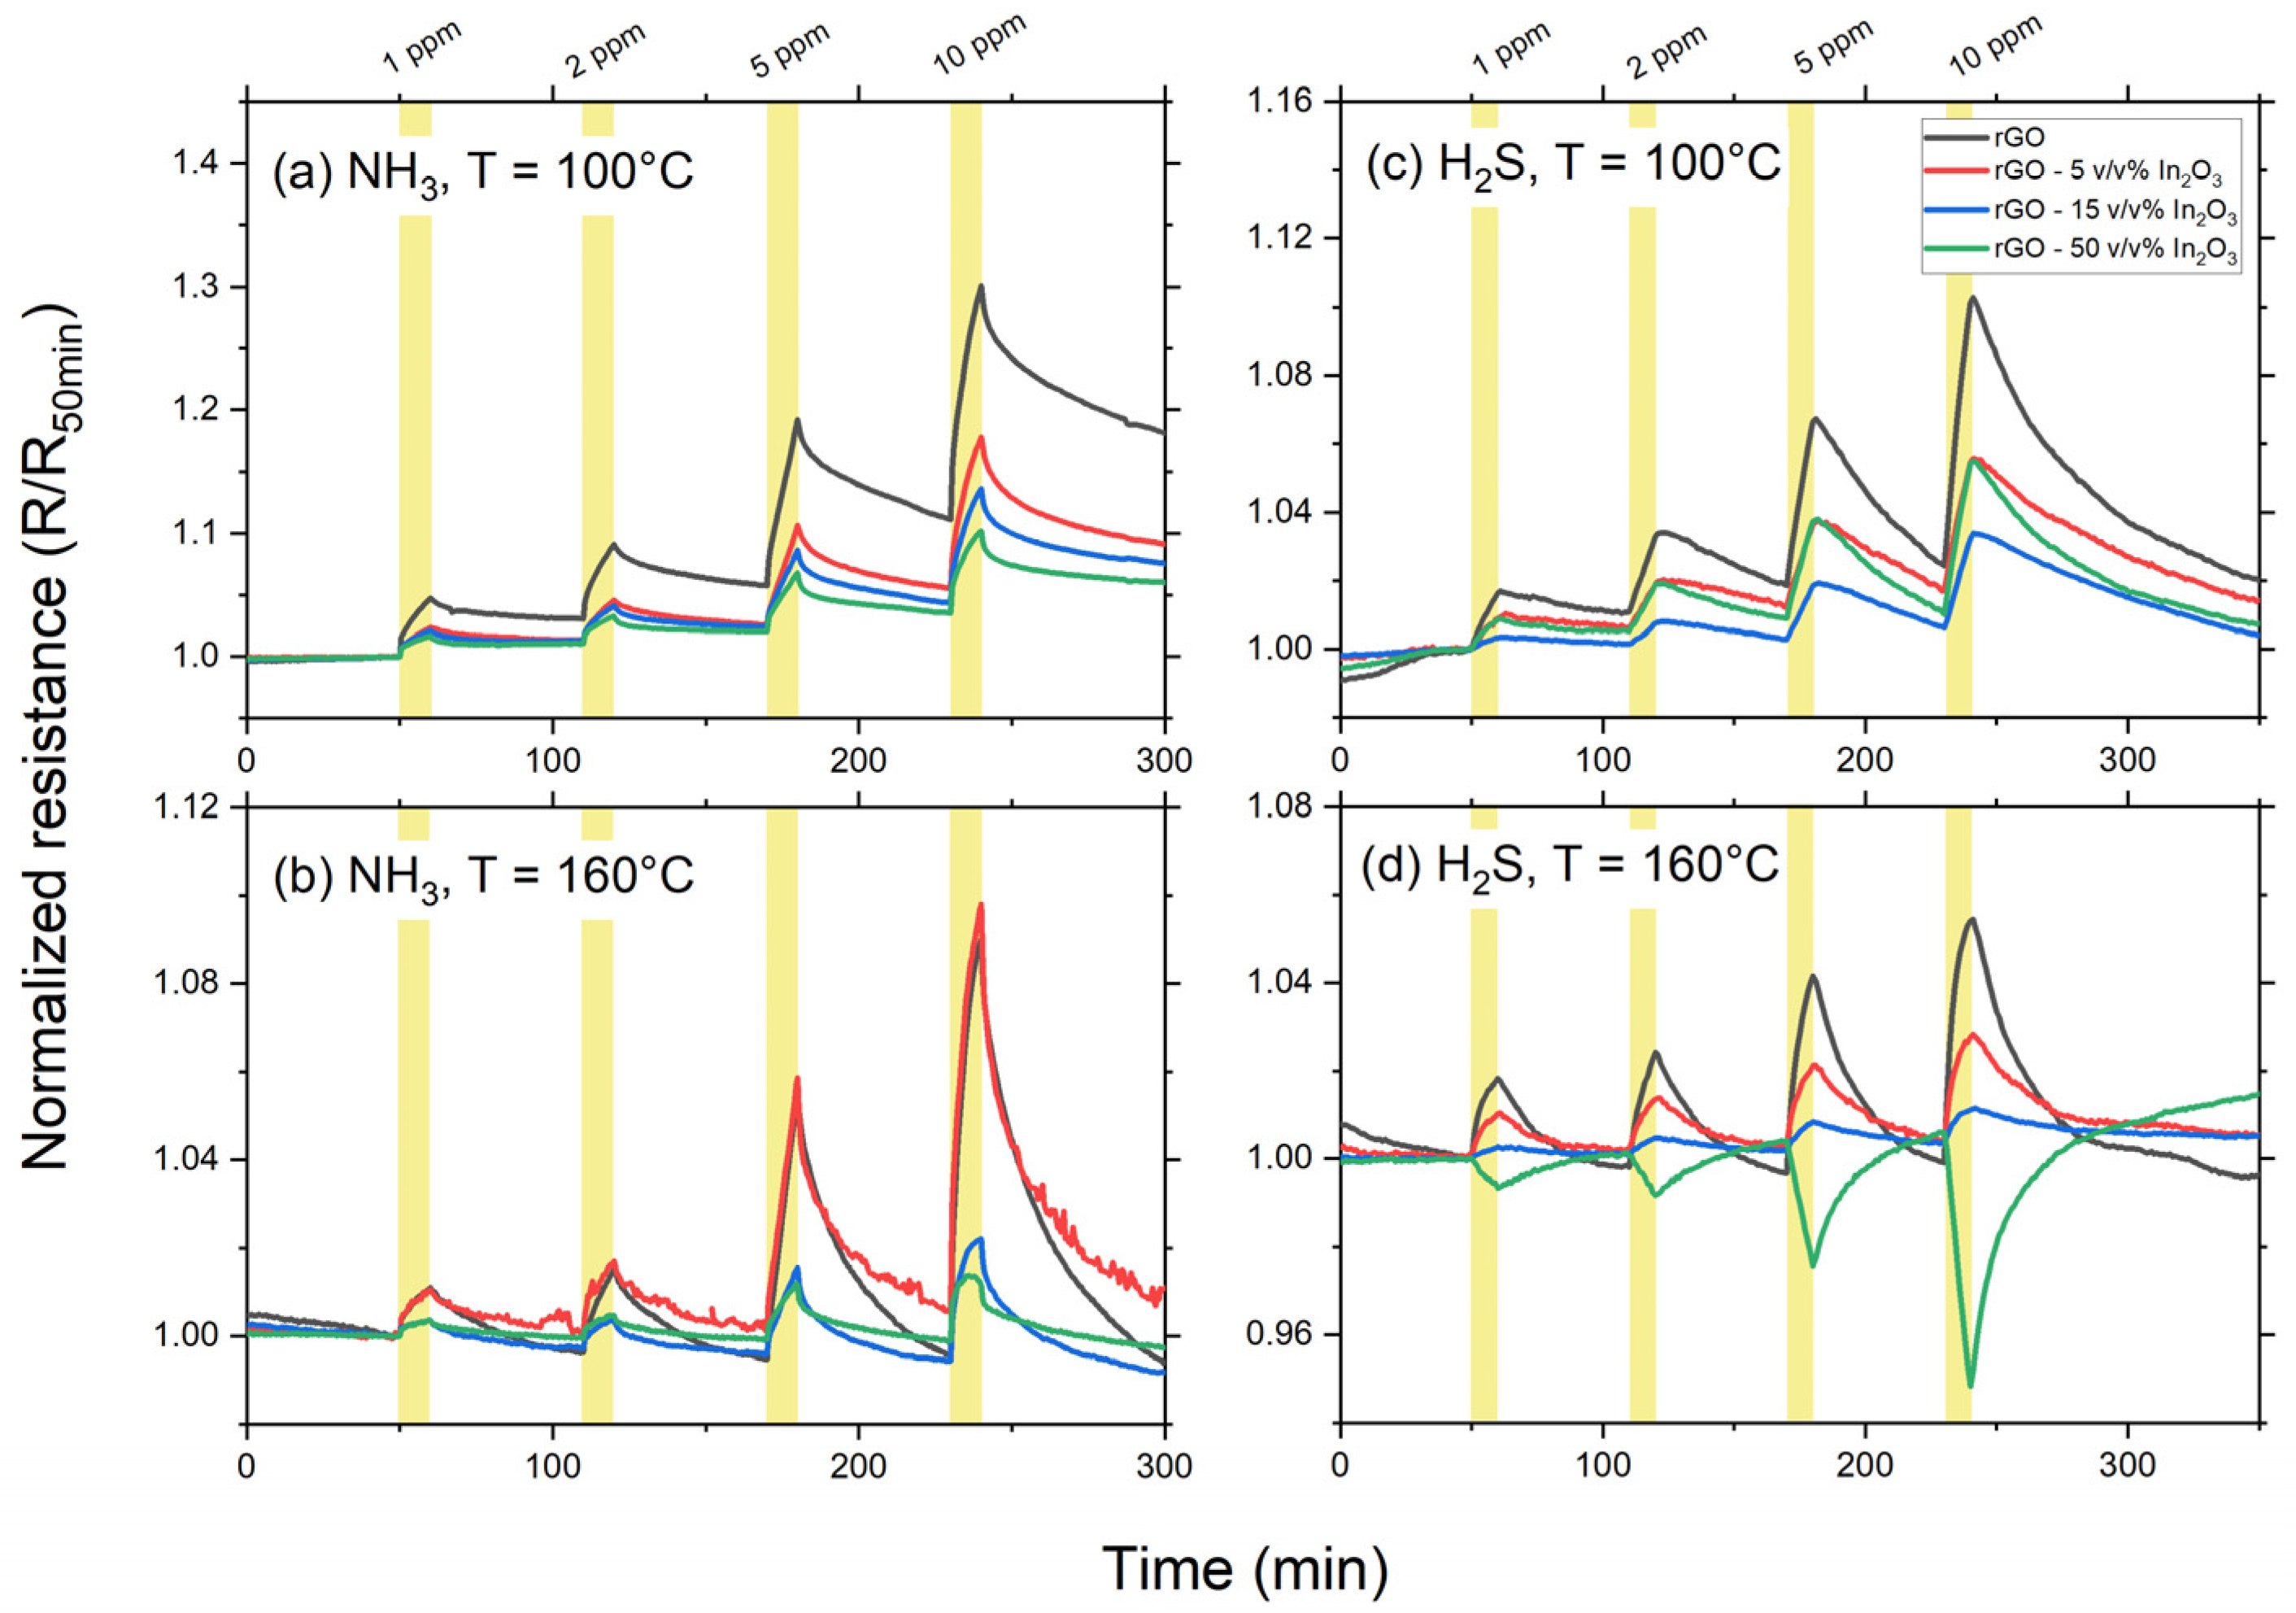
Figure 8a,b present a comparison between the sensing behavior of rGO-In2O3 based sensors towards NH3 controlled exposure at 100 and 160 °C. Interestingly, the addition of In2O3 nanoparticles has a negative impact on the sensing properties of rGO decrease as the In2O3 nanoparticles’ nominal composition increases. For example, the response ΔR/R0 calculated for pure rGO and rGO-50 v/v%-In2O3 at 10 ppm of NH3 is 15 and 6%, respectively, when operating at 100 °C. Similarly, the response decreases when the operating temperature increases. The response ΔR/R0 for 10 ppm of NH3 is 17% to 9% for pure rGO when operating at 100 and 160 °C, respectively.
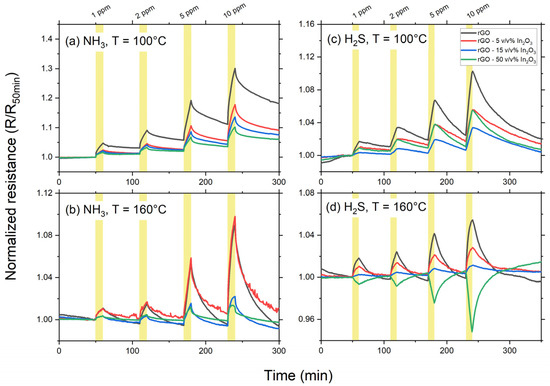
Figure 8.
Dynamic response–recovery curves from sensors based on rGO-In2O3 nanocomposites towards NH3 at 100 °C (a) and 160 °C (b), and towards H2S at 100 °C (c) and 160 °C (d).
Figure 8c,d show the response–recovery data obtained after controlled H2S exposures. When operating at 100 °C, the addition of In2O3 nanoparticles has a similar effect to what was observed for NH3 (Figure 8a). The response decreases as the In2O3 concentration increases. An interesting effect can be noted on the gas sensing behavior of the rGO-In2O3 nanocomposites by increasing the operating temperature. Figure 8d shows the dynamic recovery curves for rGO–In2O3 operating at 160 °C. At this temperature, the electrical resistance can be tuned down and even change the nature of the interaction between the material and the gas. In other words, the p-type nature observed for all gases interaction rGO showed in this study undergoes a change to an n-type nature upon interaction with H2S in temperatures in the range of 160 °C.
Figure 8a,b report the sensing behavior of rGO–In2O3-based sensors towards NH3 controlled exposure at 100 and 160 °C. Interestingly, the addition of In2O3 nanoparticles has a negative impact on the sensing properties of rGO towards ammonia. A decrease in the sensor response is observed as the In2O3 nanoparticles’ nominal composition increases. Moreover, the response decreases when the operating temperature increases. For example, the response ΔR/R0 calculated for pure rGO and rGO-50 v/v%-In2O3 at 10 ppm of NH3 is 15 and 6%, respectively, when operating at 100 °C. To compare, the response ΔR/R0 for 10 ppm of NH3 is 17% to 9% for pure rGO when operating at 100 and 160 °C, respectively.
Figure 8c,d show the response–recovery data obtained after controlled H2S exposures. When operating at 100 °C, the addition of In2O3 nanoparticles has a similar effect to what was observed for NH3 (Figure 8a), i.e., the response decreases as the In2O3 concentration increases. Nevertheless, an interesting effect can be underlined on the gas sensing behavior of the rGO–In2O3 nanocomposites by increasing the operating temperature. Figure 8d shows the dynamic recovery curves for rGO–In2O3 operating at 160 °C. At this temperature, the electrical resistance can be tuned down and even change the nature of the interaction between the material and the gas. In other words, the p-type sensing behavior observed for rGO in interaction with all gases investigated in this study changes to an n-type behavior for rGO–50 v/v%–In2O3 interacting with H2S in temperatures in the range of 160 °C. The high density of In2O3 particles at the rGO surface led to this switch in the electrical behavior of the sensing device.
4. Discussion
The structural characterization by XRD and Raman spectroscopy show that the materials used in the synthesis of the nanocomposites consisted of mixing each component that had already been prepared previously. Our results demonstrate that this simple technique can modify the gas sensing properties of the raw materials with a more straightforward path than the traditional techniques based upon hydrothermal processes. Figure 1 and Figure 2 show these results. Both figures show an excellent agreement between the structural features observed on our materials with results from the literature [43,45,47,48,65,66,67,68,69]. Furthermore, the morphology and surface characterization with SEM and XPS demonstrate that, by changing the proportions between rGO and In2O3, one can change the nature of the surface exposed to the gas, and consequently, change and tune the type of solid–gas interaction that takes place for these materials.
Since rGO is a p-type semiconductor and In2O3 is an n-type semiconductor, increasing the amount of In2O3 nanoparticles in the rGO suspension provides a simple path to tune its gas sensing properties. Our results agree with previous literature reports regarding the detection of oxidizing gases, demonstrating that In2O3 can be combined with rGO in a synergic manner, increasing the material’s sensitivity and decreasing the response time. Additionally, even though samples with high In2O3 concentrations tend to exhibit higher ozone sensitivity, our synthesis method did not prevent irreversible chemisorption of O3 molecules and the rGO layers. This effect is known as ozonolysis, and the kinetics of the degradation of the material is higher as the operating temperature rises.
Several authors have observed a synergic effect when rGO and In2O3 are applied as gas-sensitive nanocomposites for oxidizing species. According to Choi and collaborators [78], the NO2 sensing is highly dependent on hydroxyl groups remaining on the rGO’s surface. Hence, when rGO is combined with In2O3 nanostructures, NO2 molecules react with p-type rGO and n-type In2O3. However, in these hybrid materials, the depletion layer formed on the In2O3 nanoparticles expands and increases the potential barriers of conduction charges in the rGO matrix, leading to higher electrical resistance variations upon interaction with the same gas concentration [68,69]. Even though there are no studies regarding the mechanisms for O3 sensing of rGO–In2O3 nanocomposites, our results suggest that the mechanism of the reaction is composed of two processes: (1) a reversible adsorption of O3 molecules on the surface leading to adsorbed O− or O2− into the sensing layer and irreversible chemisorption of O3 molecules leading to the break of carbon-carbon double bonds of the rGO matrix responsible of the slow degradation of the sensing material with successive ozone exposures.
Similar to what is observed for NO2 detection, the interaction between NH3 and rGO-based materials is strongly dependent on the rGO’s remaining surface oxygenated groups. Furthermore, the interaction rate between In2O3 nanoparticles and NH3 occurs at higher operating temperatures [79]. Consequently, the addition of In2O3 nanoparticles when the devices operate close to 160 °C decreases the active surface area towards NH3 and decreases the device’s response. Therefore, we can interpret that the interactions of NH3 molecules on rGO-In2O3 nanocomposites are more localized on rGO matrix. Consequently, as the In2O3 nanoparticles reduce the rGO surface area, the available active sites density for NH3 adsorption decreases. Therefore, towards NH3, SMOx does not act as a catalyst. It is also important to note that the NH3 detection mechanism is strongly dependent on traces of humidity present in the air [80]. Consequently, our devices’ responses can decrease as the operating temperature increases because the level of humidity tends to decrease at higher temperatures.
Regarding the H2S detection, one of the most important results from our measurements demonstrated that adding an n-type SMOx semiconductor to a p-type rGO matrix can induce a p-to-n-type transition of the rGO–In2O3 nanocomposites when interacting with H2S at a higher temperature. This effect is a consequence of both materials being active towards H2S detection [81,82,83]. In other words, as the n-type In2O3 active surface increases, the overall sensor’s response decreases because the net measured signal is the sum of the rGO p-type interaction and In2O3 n-type interaction with the H2S gas. The response decreases up to a threshold value, in which there is more H2S molecules interaction with In2O3 than with the original rGO surfaces, which explains the observed transition. This effect is temperature dependent because the number of free carriers in the In2O3 nanoparticles increases more rapidly over temperature than the density of holes in the rGO matrix achieving a global n-type behavior.
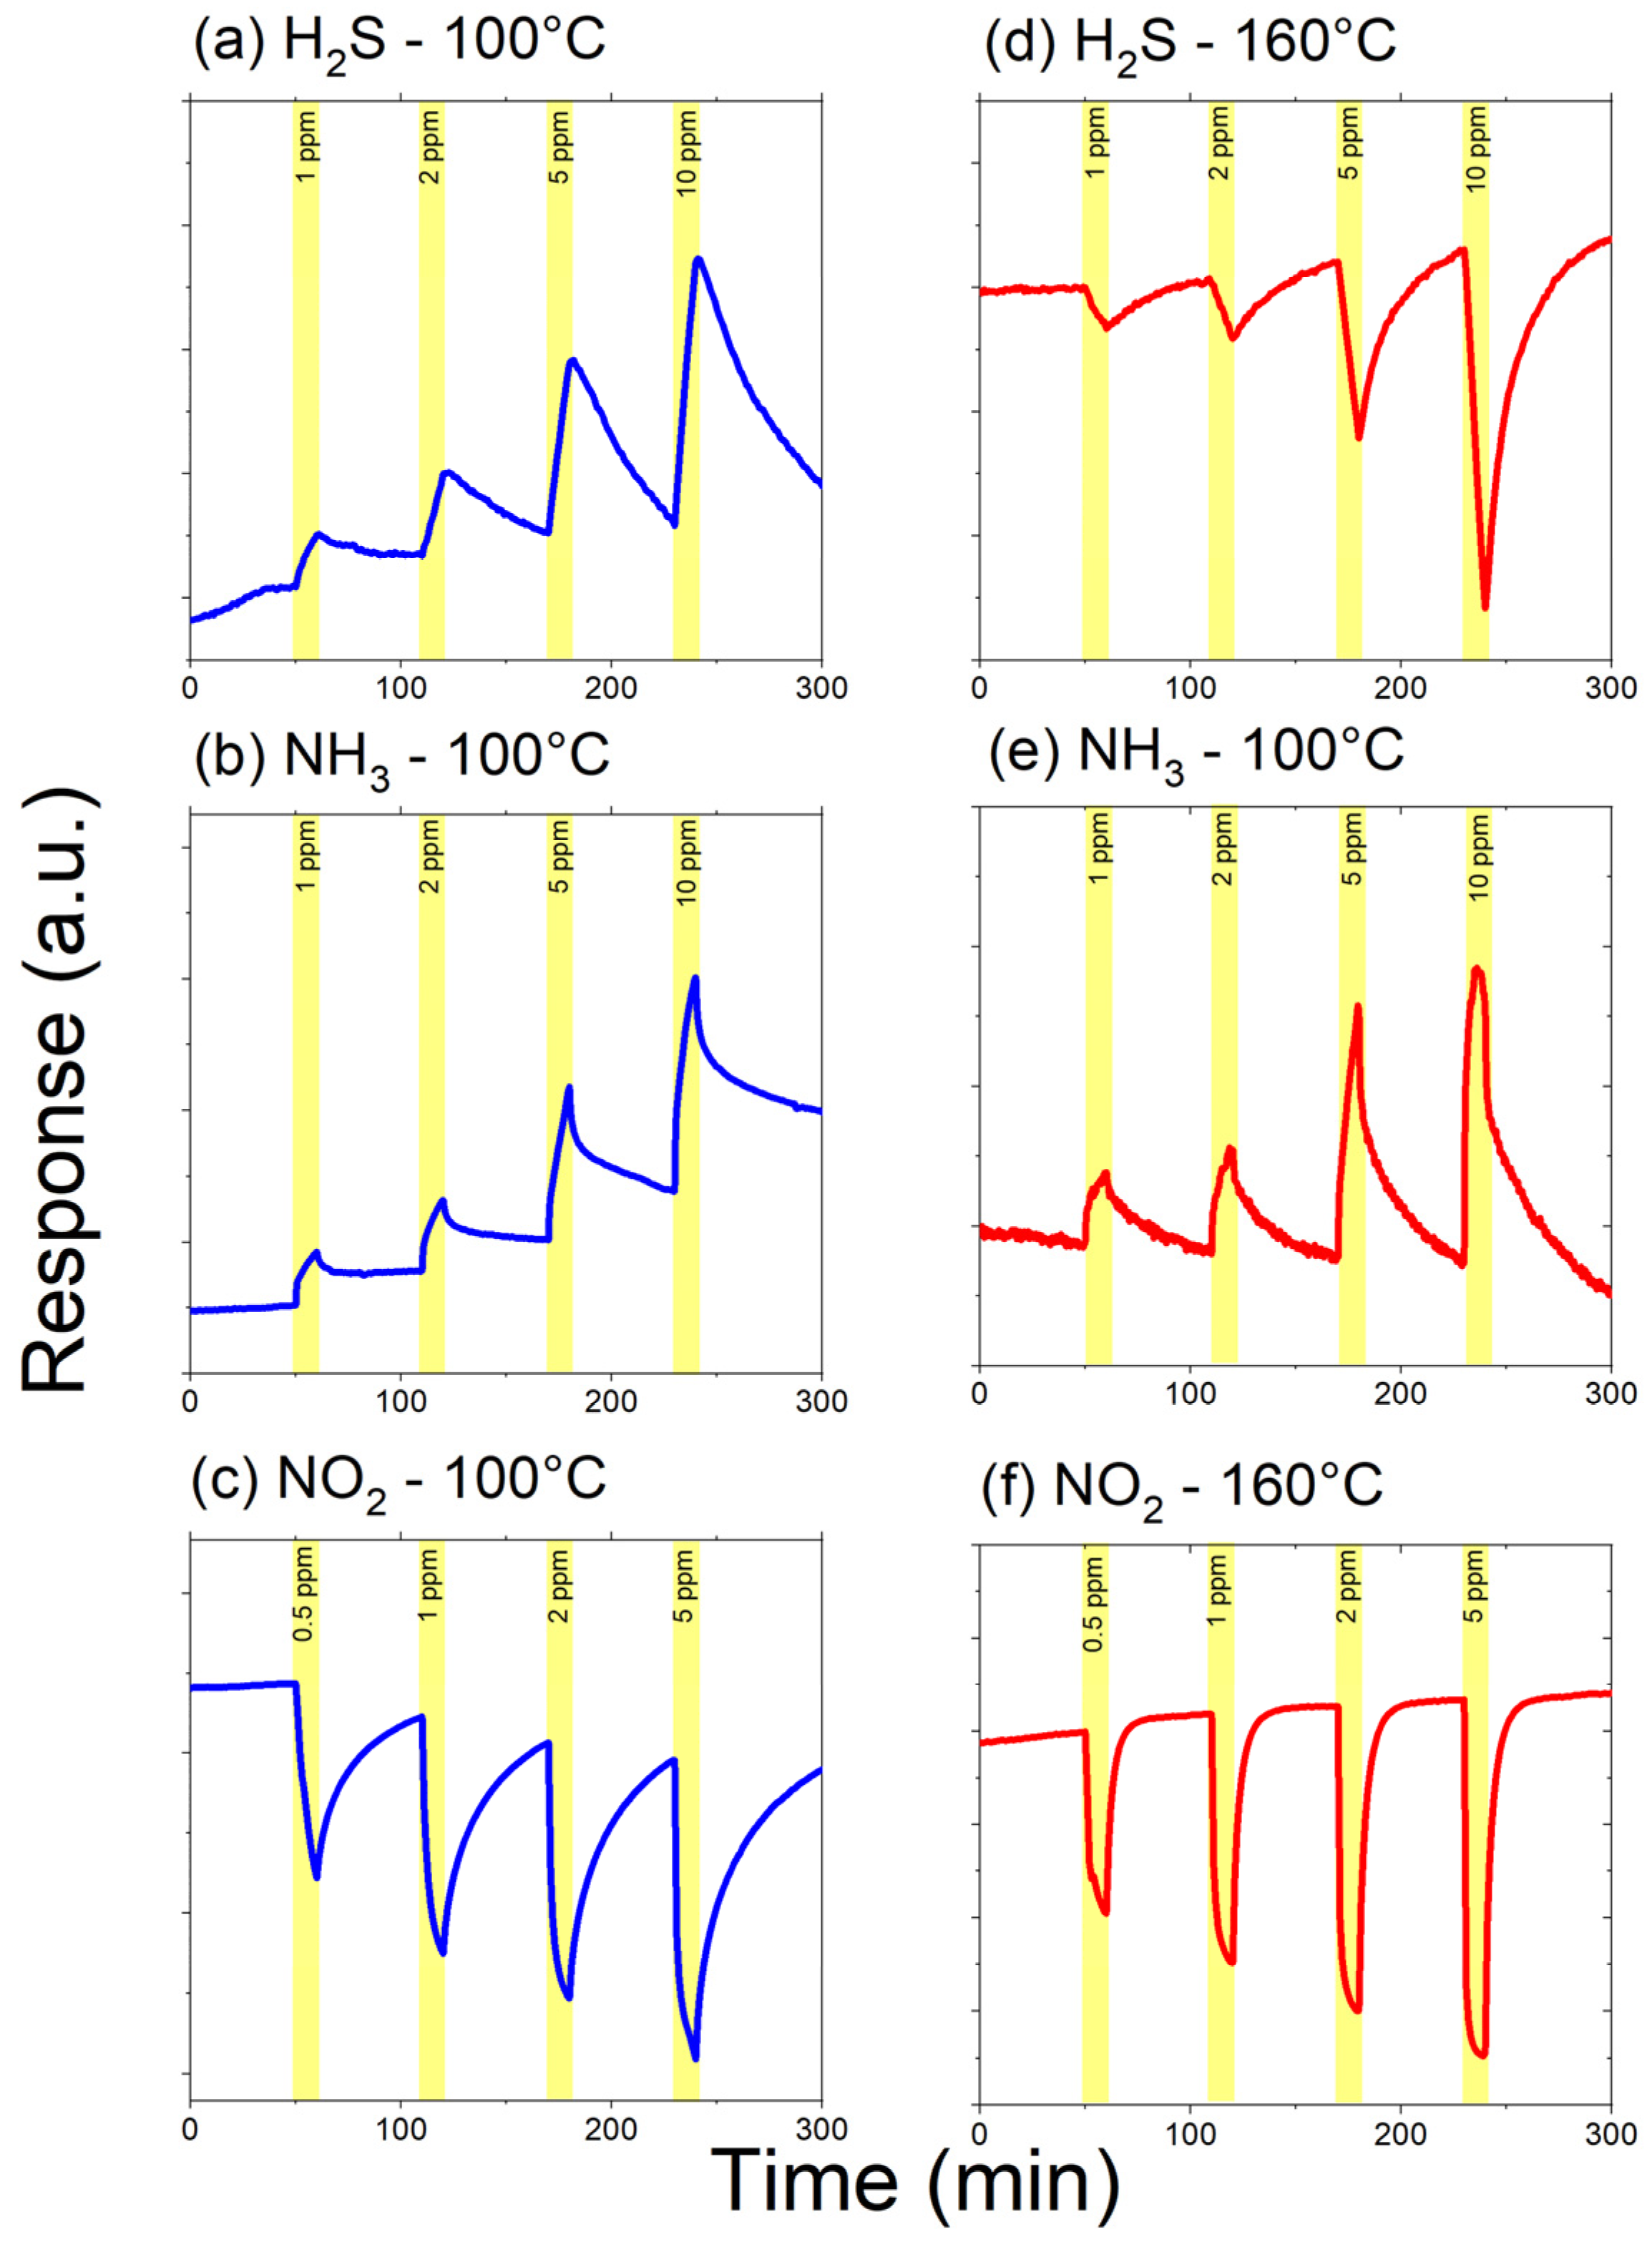
While such microsensors are insensitive to gaseous species not involving redox reactions with the sensing nanocomposite (such as BTEX), they remain not selective to one of the target pollutants. Nevertheless, it remains possible to identify the nature of the pollutant present in the probing gaseous phase using two identical microsensors working at two different temperatures. Figure 9 shows the response of two sensors prepared with rGO–50 v/v%–In2O3. The curves shown in the left panels are related to the signals from a sensor operating at 100 °C, while the curves at the right panels are the signals delivered by the sensor operating at 160 °C. As can be seen in this figure, the interaction with H2S produces a positive electrical resistance variation on the sensing element operating at 100 °C (Figure 9a), while a negative electrical resistance variation is observed for the sensing element operating at 160 °C (Figure 9d). On the other hand, a positive variation of the electrical resistance in both sensing elements indicates that the devices interact with NH3. If both elements exhibit a decrease in electrical resistance, the target gas must be NO2. The recognition method is based on studying the various function of the resistance during a few seconds of sensor exposure to gas. Table 2 summarizes how H2S, NH3, or NO2 can be discriminated by this method. Once the gas has been identified, the microsensors exhibiting the best sensing performances can be used to quantify gas concentration. Consequently, our measurements open new perspectives for studying rGO–SMOx-based gas sensors in the multi-sensor array or electronics nose context [84], since rGO–In2O3 nanocomposites could readily differentiate these two common cross-reactive species [85]. Additionally, a further experimental investigation is necessary to assess the influence of environmental humidity on the gas sensing properties of rGO–SMOx nanocomposites and to further comprehend the reaction mechanism towards both NH3 and H2S.
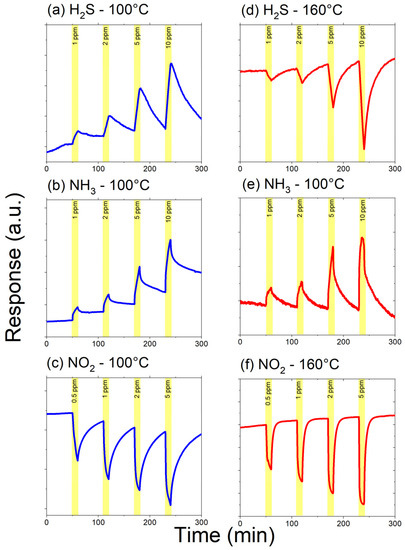
Figure 9.
Dynamic response–recovery curves from sensors based on rGO–50 v/v%–In2O3 nanocomposites operating at different temperatures towards H2S at 100 °C (a) and 160 °C (d); towards NH3 at 100 °C (b) and 160 °C (e); and towards NO2 at 100 °C (c) and 160 °C (f).

Table 2.
Variation function of microsensor resistance during exposure step to gases for 2 different working temperatures. The gas can be identified from the sign of resistance variations.
5. Conclusions
This manuscript described a systematic study on the gas sensing properties of rGO-In2O3 nanocomposites. Our results demonstrated that the electrons from the n-type In2O3 nanoparticles make the rGO matrix more sensitive towards oxidizing gases such as NO2 and O3, which agrees with the literature for these nanocomposites. Regarding the O3 detection, it is critical to note that the strong oxidative nature of O3 can permanently react with rGO when the devices are operating at temperatures of 160 °C. Regarding the interaction of the rGO–In2O3 nanocomposites with reducing gases, our results strongly suggest that NH3 reacts preferably with the rGO layers, since the reactivity of such nitrogenated species (NO2 and NH3) are strongly dependent on the remaining oxygenated groups on the rGO’s surface. On the other hand, the interaction with H2S occurs at the p-type layers of rGO and the n-type In2O3 nanoparticles. In other words, there is a competitive phenomenon between the free adsorption sites at the rGO layers and the In2O3 nanoparticles. For instance, at lower temperatures, the H2S molecules would find more adsorption sites on the rGO layers than on the In2O3 nanoparticles, because the carrier density of In2O3 at low temperatures is low. On the other hand, as the In2O3 nanoparticles concentration and the operating temperature increase, the number of free electrons available to interact with the gas also increases. Consequently, the measured electrical resistance would be a consequence of the net interaction of the gas and the type of adsorption sites available to be adsorbed. Regarding research perspectives, this work has demonstrated the need for further experimental efforts to prepare and investigate the sensing behavior of samples with higher concentrations of In2O3 nanoparticles on the rGO matrix. Additionally, it is necessary to investigate if similar p-to-n transitions are observed when other SMOx such as SnO2, WO3, and ZnO are used to prepare the nanocomposites. Moreover, further experimentation is also necessary to shed light on ambient humidity’s role and influence in the mechanism of H2S detection.
Author Contributions
Conceptualization: B.S.d.L., J.B. and V.R.M., Formal analysis: B.S.d.L., A.A.K., A.L.N., M.I.B.B. and J.B., Methodology: B.S.d.L., A.A.K., A.L.N., M.I.B.B., Formal analysis: B.S.d.L., A.A.K., A.L.N., M.I.B.B. and J.B., Validation: B.S.d.L., A.A.K., A.L.N., M.I.B.B. and J.B., Data curation: B.S.d.L. and J.B., Writing—original draft preparation: B.S.d.L., Writing—review and editing: B.S.d.L., Resources: J.B. and V.R.M., Supervision: J.B. and V.R.M., Project administration: J.B. and V.R.M., Funding acquisition: B.S.d.L., J.B. and V.R.M. All authors have read and agreed to the published version of the manuscript.
Funding
This research was funded by the Sao Paulo Research Foundation (grants numbers 2018/07517-2, 2019/22899-1).
Institutional Review Board Statement
Not applicable.
Informed Consent Statement
Not applicable.
Data Availability Statement
The data that support the results presented in this manuscript can be found in the following Mendeley repository: “Sanches de Lima, Bruno (2021), “Graphene and metal oxides composites: Application as toxic gas sensors”, Mendeley Data, V1, doi:10.17632/jvs4nr5b74.1”, under the folder “4. rGO-In2O3 nanocomposites characterization and gas sensing properties”.
Acknowledgments
The authors wish to acknowledge two other Brazilian national agencies, Conselho Nacional de Desenvolvimento Científico e Tecnológico (CNPq) and Coordenação de Aperfeiçoamento de Pessoal de Nível Superior (CAPES).
Conflicts of Interest
The authors declare no conflict of interest.
References
- Savage, N. Materials Science: Super Carbon. Nature 2012, 483, S30–S31. [Google Scholar] [CrossRef] [Green Version]
- Huang, H.; Su, S.; Wu, N.; Wan, H.; Wan, S.; Bi, H.; Sun, L. Graphene-Based Sensors for Human Health Monitoring. Front. Chem. 2019, 7, 399. [Google Scholar] [CrossRef] [Green Version]
- Justino, C.I.L.; Comes, A.R.; Freitas, A.C.; Duarte, A.C.; Rocha-Santos, T.A.P. Graphene Based Sensors and Biosensors. Trac-Trends Anal. Chem. 2017, 91, 53–66. [Google Scholar] [CrossRef]
- Ehtesabi, H. Carbon Nanomaterials for Salivary-Based Bioensors: A Review. Mater. Today Chem. 2020, 17, 100342. [Google Scholar] [CrossRef]
- Novodchuk, I.; Bajcsy, M.; Yavuz, M. Graphene-Based Field Effect Transistor Biosensors for Breast Cancer Detection: A Review on Biosensing Strategies. Carbon 2021, 172, 431–453. [Google Scholar] [CrossRef]
- Han, T.-H.; Kim, H.; Kwon, S.-J.; Lee, T.-W. Graphene-Based Flexible Electronic Devices. Mater. Sci. Eng. R-Rep. 2017, 118, 1–43. [Google Scholar] [CrossRef]
- You, R.; Liu, Y.-Q.; Hao, Y.-L.; Han, D.-D.; Zhang, Y.-L.; You, Z. Laser Fabrication of Graphene-Based Flexible Electronics. Adv. Mater. 2020, 32, 1901981. [Google Scholar] [CrossRef]
- Mehmood, A.; Mubarak, N.M.; Khalid, M.; Walvekar, R.; Abdullah, E.C.; Siddiqui, M.T.H.; Baloch, H.A.; Nizamuddin, S.; Mazari, S. Graphene Based Nanomaterials for Strain Sensor Application-A Review. J. Environ. Chem. Eng. 2020, 8, 103743. [Google Scholar] [CrossRef]
- Luo, Z.; Hu, X.; Tian, X.; Luo, C.; Xu, H.; Li, Q.; Li, Q.; Zhang, J.; Qiao, F.; Wu, X.; et al. Structure-Property Relationships In Graphene-Based Strain and Pressure Sensors for Potential Artificial Intelligence Applications. Sensors 2019, 19, 1250. [Google Scholar] [CrossRef] [Green Version]
- Wan, S.; Zhu, Z.; Yin, K.; Su, S.; Bi, H.; Xu, T.; Zhang, H.; Shi, Z.; He, L.; Sun, L. A Highly Skin-Conformal and Biodegradable Graphene-Based Strain Sensor. Small Methods 2018, 2, 1700374. [Google Scholar] [CrossRef]
- Jin, X.; Feng, C.; Ponnamma, D.; Yi, Z.; Parameswaranpillai, J.; Thomas, S.; Nisa, V.S. Review on Exploration of Graphene In The Design and Engineering of Smart Sensors, Actuators and Soft Robotics. Chem. Eng. J. Adv. 2020, 4, 100034. [Google Scholar] [CrossRef]
- Wang, X.; Zhang, J.; Mei, X.; Xu, B.; Miao, J. Laser Fabrication of Fully Printed Graphene Oxide Microsensor. Opt. Lasers Eng. 2021, 140, 106520. [Google Scholar] [CrossRef]
- Desai, J.A.; Chugh, S.; Michel, M.; Kaul, A.B. Inkjet Printed Graphene As an Interconnect for Optoelectronic Devices. J. Mater. Sci.-Mater. Electron. 2019, 30, 12500–12509. [Google Scholar] [CrossRef]
- Tian, W.C.; Liu, X.H.; Yu, W.B. Research Progress of Gas Sensor Based on Graphene and Its Derivatives: A Review. Appl. Sci. 2018, 8, 1118. [Google Scholar] [CrossRef] [Green Version]
- Schedin, F.; Geim, A.K.; Morozov, S.V.; Hill, E.W.; Blake, P.; Katsnelson, M.I.; Novoselov, K.S. Detection of Individual Gas Molecules Adsorbed on Graphene. Nat. Mater. 2007, 6, 652–655. [Google Scholar] [CrossRef] [PubMed]
- Yavari, F.; Castillo, E.; Gullapalli, H.; Ajayan, P.M.; Koratkar, N. High Sensitivity Detection of NO2 and NH3 in Air Using Chemical Vapor Deposition Grown Graphene. Appl. Phys. Lett. 2012, 100, 203120. [Google Scholar] [CrossRef]
- Chung, M.G.; Kim, D.H.; Lee, H.M.; Kim, T.; Choi, J.H.; Seo, D.K.; Yoo, J.-B.; Hong, S.-H.; Kang, T.J.; Kim, Y.H. Highly Sensitive NO2 Gas Sensor Based on Ozone Treated Graphene. Sens. Actuators B-Chem. 2012, 166, 172–176. [Google Scholar] [CrossRef]
- Yuan, W.; Liu, A.; Huang, L.; Li, C.; Shi, G. High-Performance NO2 Sensors Based on Chemically Modified Graphene. Adv. Mater. 2013, 25, 766–771. [Google Scholar] [CrossRef] [PubMed]
- Hu, N.; Yang, Z.; Wang, Y.; Zhang, L.; Wang, Y.; Huang, X.; Wei, H.; Wei, L.; Zhang, Y. Ultrafast and Sensitive Room Temperature NH3 Gas Sensors Based on Chemically Reduced Graphene Oxide. Nanotechnology 2014, 25, 025502. [Google Scholar] [CrossRef] [PubMed]
- Novikov, S.; Lebedeva, N.; Satrapinski, A.; Walden, J.; Davydov, V.; Lebedev, A. Graphene Based Sensor for Environmental Monitoring of NO2. Sens. Actuators B-Chem. 2016, 236, 1054–1060. [Google Scholar] [CrossRef]
- Wu, D.; Peng, Q.; Wu, S.; Wang, G.; Deng, L.; Tai, H.; Wang, L.; Yang, Y.; Dong, L.; Zhao, Y.; et al. A Simple Graphene NH3 Gas Sensor Via Laser Direct Writing. Sensors 2018, 18, 4405. [Google Scholar] [CrossRef] [Green Version]
- Huang, L.; Wang, Z.; Zhang, J.; Pu, J.; Lin, Y.; Xu, S.; Shen, L.; Chen, Q.; Shi, W. Fully Printed, Rapid-Response Sensors Based on Chemically Modified Graphene for Detecting NO2 at Room Temperature. Acs Appl. Mater. Interfaces 2014, 6, 7426–7433. [Google Scholar] [CrossRef]
- Mtz-Enriquez, A.I.; Padmasree, K.P.; Oliva, A.I.; Gomez-Solis, C.; Coutino-Gonzalez, E.; Garcia, C.R.; Esparza, D.; Oliva, J. Tailoring The Detection Sensitivity of Graphene Based Flexible Smoke Sensors By Decorating With Ceramic Microparticles. Sens. Actuators B-Chem. 2020, 305, 127466. [Google Scholar] [CrossRef]
- Pandhi, T.; Chandnani, A.; Subbaraman, H.; Estrada, D. A Review of Inkjet Printed Graphene and Carbon Nanotubes Based Gas Sensors. Sensors 2020, 20, 5642. [Google Scholar] [CrossRef] [PubMed]
- Luo, G.F.; Xie, L.L.; He, M.; Jaisutti, R.; Zhu, Z.G. Flexible Fabric Gas Sensors Based on Reduced Graphene-Polyaniline Nanocomposite for Highly Sensitive NH3 Detection at Room Temperature. Nanotechnology 2021, 32, 305501. [Google Scholar] [CrossRef]
- Wei, Z.; Wang, D.; Kim, S.; Kim, S.-Y.; Hu, Y.; Yakes, M.K.; Laracuente, A.R.; Dai, Z.; Marder, S.R.; Berger, C.; et al. Nanoscale Tunable Reduction of Graphene Oxide for Graphene Electronics. Science 2010, 328, 1373–1376. [Google Scholar] [CrossRef] [Green Version]
- Pei, S.F.; Cheng, H.M. The Reduction of Graphene Oxide. Carbon 2012, 50, 3210–3228. [Google Scholar] [CrossRef]
- Donarelli, M.; Ottaviano, L. 2D Materials for Gas Sensing Applications: A Review on Graphene Oxide, MoS2, WS2 and Phosphorene. Sensors 2018, 18, 3638. [Google Scholar] [CrossRef] [Green Version]
- Tjoa, V.; Jun, W.; Dravid, V.; Mhaisalkar, S.; Mathews, N. Hybrid Graphene-Metal Nanoparticle Systems: Electronic Properties and Gas Interaction. J. Mater. Chem. 2011, 21, 15593–15599. [Google Scholar] [CrossRef]
- Hoa, H.T.M.; Lee, K.J.; Pham, H.P.; Doan, T.A.; Nguyen, H.H.; Nguyen, T.Q.; Tran, Q.T.; Cuong, T.V. Ammonia Gas Sensing Behavior of Hybridization Between Reduced Graphene Oxide and Gold Nanoparticles. J. Nanomater. 2020, 2020, 7680508. [Google Scholar] [CrossRef]
- Dong, X.; Wu, K.; Zhu, W.; Wu, P.; Hou, J.; Wang, Z.; Li, R.; Wu, J.; Liu, Z.; Guo, X. TiO2 Nanotubes/G-C3N4 Quantum Dots/rGO Schottky Heterojunction Nanocomposites As Sensors for Ppb-Level Detection of NO2. J. Mater. Sci. 2019, 54, 7834–7849. [Google Scholar] [CrossRef]
- Zhou, Y.; Liu, G.; Zhu, X.; Guo, Y. Cu2O Quantum Dots Modified By rGO Nanosheets for Ultrasensitive and Selective NO2 Gas Detection. Ceram. Int. 2017, 43, 8372–8377. [Google Scholar] [CrossRef]
- Jung, M.W.; Kang, S.M.; Nam, K.-H.; An, K.-S.; Ku, B.-C. Highly Transparent and Flexible NO2 Gas Sensor Film Based on MoS2/rGO Composites Using Soft Lithographic Patterning. Appl. Surf. Sci. 2018, 456, 7–12. [Google Scholar] [CrossRef]
- Paolucci, V.; Emamjomeh, S.M.; Ottaviano, L.; Cantalini, C. Near Room Temperature Light-Activated WS2-Decorated rGO As NO2 Gas Sensor. Sensors 2019, 19, 2617. [Google Scholar] [CrossRef] [PubMed] [Green Version]
- Wang, J.; Deng, H.; Li, X.; Yang, C.; Xia, Y. Visible-Light Photocatalysis Enhanced Room-Temperature formaldehyde Gas Sensing By MoS2/rGO Hybrids. Sens. Actuators B-Chem. 2020, 304, 127317. [Google Scholar] [CrossRef]
- Jha, R.; Nanda, A.; Bhat, N. Ammonia Sensing Performance of rGO-Based Chemiresistive Gas Sensor Decorated With Exfoliated MoSe2 Nanosheets. IEEE Sens. J. 2021, 21, 10211–10218. [Google Scholar] [CrossRef]
- Majhi, S.M.; Mirzaei, A.; Kim, H.W.; Kim, S.S. Reduced Graphene Oxide (rGO)-Loaded Metal-Oxide Nanofiber Gas Sensors: An Overview. Sensors 2021, 21, 1352. [Google Scholar] [CrossRef]
- Chu Manh, H.; Do Quang, D.; Nguyen Van, D.; Vu Van, Q.; Nguyen Van, T.; Nguyen Van, H.; Nguyen Duc, H. Facile Synthesis of Ultrafine rGO/WO3 Nanowire Nanocomposites for Highly Sensitive Toxic NH3 Gas Sensors. Mater. Res. Bull. 2020, 125, 110810. [Google Scholar] [CrossRef]
- Su, P.-G.; Peng, S.-L. Fabrication and NO2 Gas-Sensing Properties of Reduced Graphene Oxide/WO3 Nanocomposite Films. Talanta 2015, 132, 398–405. [Google Scholar] [CrossRef]
- Liu, Y.; Huang, J.; Gong, Y.; Xu, X.; Li, H. Liquid Flame Spray Fabrication of WO3-Reduced Graphene Oxide Nanocomposites for Enhanced O-3-Sensing Performances. Ceram. Int. 2017, 43, 13185–13192. [Google Scholar] [CrossRef]
- Su, P.-G.; Zheng, Y.-L. Room-Temperature Ppb-Level SO2 Gas Sensors Based on rGO/WO3 and Mwcnts/WO3 Nanocomposites. Anal. Methods 2021, 13, 782–788. [Google Scholar] [CrossRef]
- Amarnath, M.; Gurunathan, K. Highly Selective CO2 Gas Sensor Using Stabilized NiO-In2O3 Nanospheres Coated Reduced Graphene Oxide Sensing Electrodes at Room Temperature. J. Alloy Compd. 2021, 857, 157584. [Google Scholar] [CrossRef]
- Jeevitha, G.; Abhinayaa, R.; Mangalaraj, D.; Ponpandian, N.; Meena, P.; Mounasamy, V.; Madanagurusamy, S. Porous Reduced Graphene Oxide (rGO)/WO3 Nanocomposites for the Enhanced Detection of NH3 at Room Temperature. Nanoscale Adv. 2019, 1, 1799–1811. [Google Scholar] [CrossRef] [Green Version]
- Punetha, D.; Pandey, S.K. Sensitivity Enhancement of Ammonia Gas Sensor Based on Hydrothermally Synthesized rGO/WO3 Nanocomposites. IEEE Sens. J. 2020, 20, 1738–1745. [Google Scholar] [CrossRef]
- Wang, T.; Hao, J.; Zheng, S.; Sun, Q.; Zhang, D.; Wang, Y. Highly Sensitive and Rapidly Responding Room-Temperature NO2 Gas Sensors Based on WO3 Nanorods/Sulfonated Graphene Nanocomposites. Nano Res. 2018, 11, 791–803. [Google Scholar] [CrossRef]
- Hassan, M.; Wang, Z.-H.; Huang, W.-R.; Li, M.-Q.; Liu, J.-W.; Chen, J.-F. Ultrathin Tungsten Oxide Nanowires/Reduced Graphene Oxide Composites for Toluene Sensing. Sensors 2017, 17, 2245. [Google Scholar] [CrossRef] [PubMed]
- Anasthasiya, A.N.A.; Kishore, K.R.; Rai, P.K.; Jeyaprakash, B.G. Highly Sensitive Graphene Oxide Functionalized Zno Nanowires for Ammonia Vapour Detection at Ambient Temperature. Sens. Actuators B-Chem. 2018, 255, 1064–1071. [Google Scholar] [CrossRef]
- Cao, P.; Cai, Y.; Pawar, D.; Navale, S.T.; Rao, C.N.; Han, S.; Xu, W.; Fang, M.; Liu, X.; Zeng, Y.; et al. Down to Ppb Level NO2 Detection By ZnO/rGO Heterojunction Based Chemiresistive Sensors. Chem. Eng. J. 2020, 401, 125491. [Google Scholar] [CrossRef]
- Shewale, P.S.; Yun, K.S. Synthesis and Characterization of Cu-Doped ZnO/rGO Nanocomposites for Room-Temperature H2s Gas Sensor. J. Alloys Compd. 2020, 837, 155527. [Google Scholar] [CrossRef]
- Drmosh, Q.A.; Hendi, A.H.; Hossain, M.K.; Yamani, Z.H.; Moqbel, R.A.; Hezam, A.; Gondal, M. Uv-Activated Gold Decorated rGO/ZnO Heterostructured Nanocomposite Sensor for Efficient Room Temperature H-2 Detection. Sens. Actuators B-Chem. 2019, 290, 666–675. [Google Scholar] [CrossRef]
- Peng, R.; Li, Y.; Chen, J.; Si, P.; Feng, J.; Zhang, L.; Ci, L. Reduced Graphene Oxide Wrapped Au@ZnO Core-Shell Structure for Highly Selective Triethylamine Gas Sensing Application at A Low Temperature. Sens. Actuators A-Phys. 2018, 283, 128–133. [Google Scholar] [CrossRef]
- Drmosh, Q.A.; Yamani, Z.H.; Hendi, A.H.; Gondal, M.A.; Moqbel, R.A.; Saleh, T.A.; Khan, M.Y. A Novel Approach to Fabricating A Ternary rGO/ZnO/Pt System for High-Performance Hydrogen Sensor at Low Operating Temperatures. Appl. Surf. Sci. 2019, 464, 616–626. [Google Scholar] [CrossRef]
- Moon, D.-B.; Bag, A.; Lee, H.-B.; Meeseepong, M.; Lee, D.-H.; Lee, N.-E. A Stretchable, Room-Temperature Operable, Chemiresistive Gas Sensor Using Nanohybrids of Reduced Graphene Oxide and Zinc Oxide Nanorods. Sens. Actuators B-Chem. 2021, 345, 130373. [Google Scholar] [CrossRef]
- Lee, J.-H.; Katoch, A.; Choi, S.-W.; Kim, J.-H.; Kim, H.W.; Kim, S.S. Extraordinary Improvement of Gas-Sensing Performances In SnO2 Nanofibers Due to Creation of Local P-N Heterojunctions By Loading Reduced Graphene Oxide Nanosheets. ACS Appl. Mater. Interfaces 2015, 7, 3101–3109. [Google Scholar] [CrossRef] [PubMed]
- Song, Z.; Wei, Z.; Wang, B.; Luo, Z.; Xu, S.; Zhang, W.; Yu, H.; Li, M.; Huang, Z.; Zang, J.; et al. Sensitive Room-Temperature H2s Gas Sensors Employing SnO2 Quantum Wire/Reduced Graphene Oxide Nanocomposites. Chem. Mater. 2016, 28, 1205–1212. [Google Scholar] [CrossRef]
- Sivakumar, R.; Krishnamoorthi, K.; Vadivel, S.; Govindasamy, S. Progress Towards A Novel NO2 Gas Sensor Based on SnO2/rGO Hybrid Sensors By A Facial Hydrothermal Approach. Diam. Relat. Mater. 2021, 116, 108418. [Google Scholar] [CrossRef]
- Huang, M.; Wang, Y.; Ying, S.; Wu, Z.; Liu, W.; Chen, D.; Peng, C. Synthesis of Cu2O-Modified Reduced Graphene Oxide for NO2 Sensors. Sensors 2021, 21, 1958. [Google Scholar] [CrossRef]
- Srirattanapibul, S.; Nakarungsee, P.; Issro, C.; Tang, I.M.; Thongmee, S. Enhanced Room Temperature NH3 Sensing of rGO/CO3O4 Nanocomposites. Mater. Chem. Phys. 2021, 272, 125033. [Google Scholar] [CrossRef]
- Sen, S.; Kundu, S. Reduced Graphene Oxide (rGO) Decorated ZnO-SnO2: A Ternary Nanocomposite Towards Improved Low Concentration Voc Sensing Performance. J. Alloys Compd. 2021, 881, 160406. [Google Scholar] [CrossRef]
- Gao, Y.W.; Chen, D.L.; Hou, X.H.; Zhang, Y.; Yi, S.S.; Ji, H.P.; Wang, Y.; Yin, L.; Sun, J. Microwave-Assisted Synthesis of Hierarchically Porous CO3O4/rGO Nanocomposite for Low-Temperature Acetone Detection. J. Colloid Interface Sci. 2021, 594, 690–701. [Google Scholar] [CrossRef] [PubMed]
- Liu, J.; Luo, T.; Meng, F.; Qian, K.; Wan, Y.; Liu, J. Porous Hierarchical In2O3 Micro-/Nanostructures: Preparation, formation Mechanism, and Their Application in Gas Sensors for Noxious Volatile Organic Compound Detection. J. Phys. Chem. C 2010, 114, 4887–4894. [Google Scholar] [CrossRef]
- Soulantica, K.; Erades, L.; Sauvan, M.; Senocq, F.; Maisonnat, A.; Chaudret, B. Synthesis of Indium and Indium Oxide Nanoparticles from Indium Cyclopentadienyl Precursor and Their Application for Gas Sensing. Adv. Funct. Mater. 2003, 13, 553–557. [Google Scholar] [CrossRef]
- Shu, S.; Yu, D.; Wang, Y.; Wang, F.; Wang, Z.; Zhong, W. Thermal-Induced Phase Transition and Assembly of Hexagonal Metastable In2O3 Nanocrystals: A New Approach to In2O3 Functional Materials. J. Cryst. Growth 2010, 312, 3111–3116. [Google Scholar] [CrossRef]
- Shen, Y.; Zhong, X.; Zhang, J.; Li, T.; Zhao, S.; Cui, B.; Wei, D.; Zhang, Y.; Wei, K. In-Situ Growth of Mesoporous In2O3 Nanorod Arrays on A Porous Ceramic Substrate for Ppb-Level NO2 Detection at Room Temperature. Appl. Surf. Sci. 2019, 498, 143873. [Google Scholar] [CrossRef]
- De Boer, T.; Bekheet, M.F.; Gurlo, A.; Riedel, R.; Moewes, A. Band Gap and Electronic Structure of Cubic, Rhombohedral, and Orthorhombic In2O3 Polymorphs: Experiment and Theory. Phys. Rev. B 2016, 93, 155205. [Google Scholar] [CrossRef] [Green Version]
- andre, R.S.; Mercante, L.A.; Facure, M.H.M.; Mattoso, L.H.C.; Correa, D.S. Enhanced and Selective Ammonia Detection Using In2O3/Reduced Graphene Oxide Hybrid Nanofibers. Appl. Surf. Sci. 2019, 473, 133–140. [Google Scholar] [CrossRef]
- Gu, F.; Nie, R.; Han, D.; Wang, Z. In2O3-Graphene Nanocomposite Based Gas Sensor for Selective Detection of NO2 at Room Temperature. Sens. Actuators B-Chem. 2015, 219, 94–99. [Google Scholar] [CrossRef]
- Liu, J.; Li, S.; Zhang, B.; Wang, Y.; Gao, Y.; Liang, X.; Wang, Y.; Lu, G. Flower-Like In2O3 Modified By Reduced Graphene Oxide Sheets Serving As A Highly Sensitive Gas Sensor for Trace NO2 Detection. J. Colloid Interface Sci. 2017, 504, 206–213. [Google Scholar] [CrossRef] [PubMed]
- Na, C.W.; Kim, J.-H.; Kim, H.-J.; Woo, H.-S.; Gupta, A.; Kim, H.-K.; Lee, J.-H. Highly Selective and Sensitive Detection of NO2 Using rGO-In2O3 Structure on Flexible Substrate at Low Temperature. Sens. Actuators B-Chem. 2018, 255, 1671–1679. [Google Scholar] [CrossRef]
- Toby, B.H.; Von Dreele, R.B. Gsas-Ii: The Genesis of A Modern Open-Source All Purpose Crystallography Software Package. J. Appl. Crystallogr. 2013, 46, 544–549. [Google Scholar] [CrossRef]
- Momma, K.; Izumi, F. Vesta 3 for Three-Dimensional Visualization of Crystal, Volumetric and Morphology Data. J. Appl. Crystallogr. 2011, 44, 1272–1276. [Google Scholar] [CrossRef]
- Schneider, C.A.; Rasband, W.S.; Eliceiri, K.W. Nih Image to Imagej: 25 Years of Image Analysis. Nat. Methods 2012, 9, 671–675. [Google Scholar] [CrossRef]
- Ferrari, A.C.; Meyer, J.C.; Scardaci, V.; Casiraghi, C.; Lazzeri, M.; Mauri, F.; Piscanec, S.; Jiang, D.; Novoselov, K.S.; Roth, S.; et al. Raman Spectrum of Graphene and Graphene Layers. Phys. Rev. Lett. 2006, 97, 187401. [Google Scholar] [CrossRef] [Green Version]
- Kaniyoor, A.; Ramaprabhu, S. A Raman Spectroscopic Investigation of Graphite Oxide Derived Graphene. Aip Adv. 2012, 2, 032183. [Google Scholar] [CrossRef] [Green Version]
- Dupin, J.C.; Gonbeau, D.; Vinatier, P.; Levasseur, A. Systematic Xps Studies of Metal Oxides, Hydroxides and Peroxides. Phys. Chem. Chem. Phys. 2000, 2, 1319–1324. [Google Scholar] [CrossRef]
- Reddy, I.N.; Reddy, C.H.V.; Cho, M.; Shim, J.; Kim, D. Structural, Optical and Xps Study of Thermal Evaporated In2O3 Thin Films. Mater. Res. Express 2017, 4, 086406. [Google Scholar] [CrossRef]
- Yang, F.; Zhao, M.L.; Wang, Z.; Ji, H.Y.; Zheng, B.Z.; Xiao, D.; Wu, L.; Guo, Y. The Role of Ozone In The Ozonation Process of Graphene Oxide: Oxidation Or Decomposition? Rsc Adv. 2014, 4, 58325–58328. [Google Scholar] [CrossRef]
- Choi, Y.R.; Yoon, Y.G.; Choi, K.S.; Kang, J.H.; Shim, Y.S.; Kim, Y.H.; Chang, H.J.; Lee, J.H.; Park, C.R.; Kim, S.Y.; et al. Role of Oxygen Functional Groups In Graphene Oxide for Reversible Room-Temperature NO2 Sensing. Carbon 2015, 91, 178–187. [Google Scholar] [CrossRef]
- Li, C.; Zhang, D.H.; Lei, B.; Han, S.; Liu, X.L.; Zhou, C.W. Surface Treatment and Doping Dependence of In2O3 Nanowires As Ammonia Sensors. J. Phys. Chem. B 2003, 107, 12451–12455. [Google Scholar] [CrossRef]
- Guo, P.F.; Pan, H.B. Selectivity of Ti-Doped In2O3 Ceramics As an Ammonia Sensor. Sens. Actuators B-Chem. 2006, 114, 762–767. [Google Scholar] [CrossRef]
- Xu, J.Q.; Wang, X.H.; Shen, J.N. Hydrothermal Synthesis of In2O3 for Detecting H2S In Air. Sens. Actuators B-Chem. 2006, 115, 642–646. [Google Scholar] [CrossRef]
- Liu, J.; Guo, W.; Qu, F.; Feng, C.; Li, C.; Zhu, L.; Zhou, J.; Ruan, S.; Chen, W. V-Doped In2O3 Nanofibers for H2S Detection at Low Temperature. Ceram. Int. 2014, 40, 6685–6689. [Google Scholar] [CrossRef]
- Reshak, A.H.; Auluck, S. Adsorbing H2S onto A Single Graphene Sheet: A Possible Gas Sensor. J. Appl. Phys. 2014, 116, 103702. [Google Scholar] [CrossRef] [Green Version]
- Jeong, S.Y.; Kim, J.S.; Lee, J.H. Rational Design of Semiconductor-Based Chemiresistors and Their Libraries for Next-Generation Artificial Olfaction. Adv. Mater. 2020, 32, 2002075. [Google Scholar] [CrossRef] [PubMed]
- Yuan, Z.; Bariya, M.; Fahad, H.M.; Wu, J.B.; Han, R.; Gupta, N.; Javey, A. Trace-Level, Multi-Gas Detection for Food Quality Assessment Based on Decorated Silicon Transistor Arrays. Adv. Mater. 2020, 32, 1908385. [Google Scholar] [CrossRef]
Publisher’s Note: MDPI stays neutral with regard to jurisdictional claims in published maps and institutional affiliations. |
© 2022 by the authors. Licensee MDPI, Basel, Switzerland. This article is an open access article distributed under the terms and conditions of the Creative Commons Attribution (CC BY) license (https://creativecommons.org/licenses/by/4.0/).

