Abstract
The protection of masterpieces from natural hazards is one of the most important goals regarding heritage conservation. This work studies the seismic response of “Marzocco” by Donatello, which is the heraldic symbol of Florence, currently exposed at the National Museum of Bargello (Florence, Italy). The sculpture stands over a marble base and a magnificent marble pedestal by Benedetto da Maiano, which is part of the piece of art. The artwork is placed on the first floor of the museum, and it is subjected to seismic accelerations, eventually amplified by the seismic response of the building itself. The dynamic response of Marzocco is checked with reference to the overturning and sliding collapse mechanisms. Three overturning models have been considered, involving respectively the statue only, the statue and the base, and the statue with base and pedestal. The seismic input has been assumed through an ensemble of seven ground motions, which is spectrum-compatible with the Code’s one. Both the acceleration histories at the ground and at the floor have been considered. The seismic response has been found by performing a time-history analysis on a finite element model. The analysis showed a satisfactory seismic performance of the case study, pointing out the role of the single modeling assumptions.
1. Introduction
The conservation and the safety of art collections have been gaining increasing interest in the academic community [1,2,3,4,5,6]. Artworks exhibited within museums are safer than those located outdoors since they are protected against some of the possible threats, such as vandalism, blasts [7,8], traffic, thermal variations and environmental actions [9,10]. However, at the occurrence of earthquakes, the building hosting the museum can increase the actions affecting the artworks [11,12] or, at least, amplify the seismic acceleration at the ground level. This amplification of seismic actions can especially occur for museums consisting of monumental buildings, which hardly respect the current safety standards.
Seismic performance—and safety—of artworks largely varies depending on their properties [13,14,15,16,17], such as dimension, shape, material, age, and state of conservation. The dynamic response of a standing object can be described on the basis of the following behaviors: sticking, sliding, rocking and free flight [18]. Sticking describes the stationarity of the object at the occurrence of the excitation, and it does not present any concern for the object’s safety. Sliding is the lateral displacement of the object across its base surface, and it occurs when the inertial force overcomes the friction between the contact surfaces. It can be dangerous for the artworks’ safety, since they can abruptly bump into other objects or the room’s walls. The rocking consists of the pivoting around the object’s base edge. It is very common for slender objects, having relevant height-to-width ratios, especially for high values of friction between the object’s foot and the bottom surface. It is the most dangerous dynamic response of artworks, since it can induce their overturning, which is often associated with severe damage. Finally, the free flight, considered to be a limit scenario, occurs when the object completely loses contact with its base, becoming airborne [19,20].
This work is focused on the combined occurrence of rocking and sliding. The considered case study is the artwork “Marzocco”, the stone masterpiece by Donatello, which is the heraldic symbol of Florence, currently exhibited at the National Museum of Bargello. It follows the investigation presented in Azzara et al. 2023 [21] on Marzocco, where its seismic performance was checked by means of a simplified approach, consisting of comparing the threshold displacement for overturning to the horizontal displacement of the statue found through the floor spectra provided by the Italian Technical Code [22]. In this work, the seismic response of the artwork is represented through a time-history analysis, where the seismic input consists of an ensemble of seven ground motions, whose average spectrum closely fits the elastic spectrum provided by the Italian Technical Code [22] for the location’ soil type. Since the statuary complex is located on the first floor of the building, the seismic action experienced by Marzocco can consistently differ from that at the ground level. Therefore, the dynamic analysis has been performed with reference to the seismic inputs both at the ground and at the floor levels, to check the difference between these two conditions.
The seismic action on the first floor has been found accounting for the transfer-effect of the building by means of a simplified SDOF model having the same frequency as the building, i.e., T = 0.35 s. Such frequency, in turn, has been found by the Authors in a former investigation, through dynamic monitoring by means of seismic motions, as described in [21].
The seismic performance of Marzocco has been checked with reference to both rocking and sliding. The most probable dynamic response of the case study depends on the consistency of the connection between its components to the corresponding support [23,24], which is difficult to predict without specific information about the artwork setup. As regards Marzocco, it appears to be cemented to its base through mortar. This connection between sculptures and their pedestals was quite common in past centuries, and it presents high friction. For this reason, overturning has been considered to be the main collapse mechanism of the case study, and a proper structural model, allowing the detachment between the statue and its support, has been assumed for the numerical analysis. Such modeling is not the most suitable for representing the material degradation, which has not been studied in the current research.
The artwork consists of a stone statue placed over a marble base and a further marble pedestal; therefore, three overturning mechanisms have been considered, respectively involving the statue only (Model A), the statue and the base (Model B), and the entire complex, i.e., the statue, the base, and the pedestal (Model C).
The dynamic response of the case study, represented through the three models, has been checked in terms of rocking angle and sliding displacement. The comparison between the dynamic response of the three models and the corresponding thresholds showed Model A (overturning of the statue only) to be the most compatible with the overturning collapse. Therefore, Model A has been selected to perform a further analysis, where a 2-dimensional seismic input has been assumed. In terms of the rocking, the response provided by the latter analysis has been very similar to that induced by the 1-dimensional seismic input. However, the lateral displacement due to sliding was largely increased by the two-dimensional input, affecting the seismic safety of the case study.
The obtained results show that Marzocco has a good seismic performance, and it does not overturn for earthquakes compatible with the seismic hazard of the area. The analysis shows the importance of considering floor accelerations, which are consistently larger than those acting at the ground level, inducing much larger seismic responses. The performed analysis leads to assessing the role of the various assumptions, such as the selection of the spectra, the choice of the structural model and the two-directionality of the seismic input.
2. Case-Study: Marzocco and the National Museum of Bargello
2.1. The National Museum of Bargello and “Sala Donatello”
The National Museum of Bargello is hosted by the “Bargello” palace, shown in Figure 1a, which is an important historical masonry construction of the Town of Florence, alongside the “Volognana”, a masonry tower with a height equal to 57 m. Bargello Palace was built in 1256 for the highest magistrate of the Florence City Council, and it has always played an important role in the social life of Florence. It has been used as a museum since 1865, when it was the first National Museum in Italy.
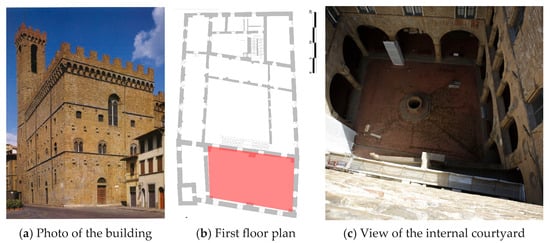
Figure 1.
National Museum of Bargello.
The building, shown in Figure 1, has a rectangular plan (see Figure 1b) with a central open courtyard (see Figure 1c). Marzocco is located on the first floor, in the “Donatello room”, marked in red in Figure 1b. The Donatello room, shown in Figure 2, is very large and high, and is covered by masonry vaults.
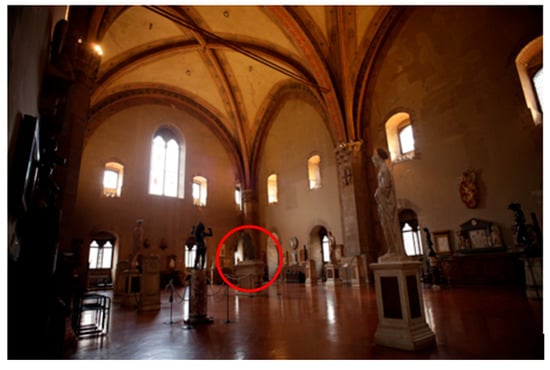
Figure 2.
Sala Donatello (Marzocco is shown in the red circle).
The dynamic response at the first level has been found through an experimental monitoring made by some of the authors and presented in [21]. The monitoring consisted of three pairs of seismic stations, placed respectively on the floor of the Donatello room and on one of the lower (ground) levels. The dynamic propagation of the monitored accelerations showed a peak of frequency (equal to 1 Hz) induced by the adjacent tower, and two further frequencies, equal to 2.6 Hz and 3.0 Hz, respectively, along the two directions, corresponding to Fundamental periods equal to 0.33 s and 0.38 s.
2.2. Marzocco and Its Pedestal
The statue “Marzocco” (see Figure 3), made by Donatello, is a boulder stone lion represented in a sitting position, with a paw on the shield; from the Middle Ages, Marzocco is the heraldic symbol of Florence [25,26].
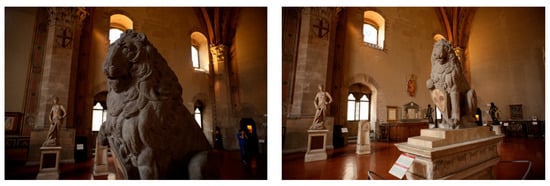
Figure 3.
Marzocco over its precious pedestal.
The sculpture dates back to 1418, and it was commissioned for the stairway of Santa Maria Novella’ cloister, in the occasion of the visit of Pope Martino V. There is not much information regarding the location of Marzocco from the dismantle of the stairway, at the beginning of the XVI century, and 1812, when it was placed in front of Palazzo Vecchio (the Florence’s city hall), where it stayed until 1847, when it was moved to internal museal rooms, to better preserve it [27]. The first museum where Marzocco was placed was the Uffizi Museum, where it remained until 1865, when it was placed at the National Museum of Bargello.
The statue Marzocco stands over a thin marble base, which, in turn, stands over a magnificent marble pedestal, which is a piece of art. The pedestal was made by Benedetto da Maiano at the end of the 15th century as the support of a former lion sculpture. It consists of a molded foot, a central body completed by four banisters and an entablature composed of architrave, frieze and frame, decorated with heraldic symbols of Florence’s Republic.
There is no information regarding the connection between the sculpture and base, or between the base and pedestal. The most probable technique consists of connecting the items with the mortar. Namely, the mortar is visible between the lion and the base, and the connection is evident between the base and the pedestal.
2.3. Geometrical and Structural Models
The geometrical model of the case study has been made on the basis of a detailed photogrammetric survey. In Figure 4, the lateral and the frontal views of the case study are shown, while Table 1 collects the main geometrical data, together with the position of the centers of mass of each constituting element: pedestal, base and statue.
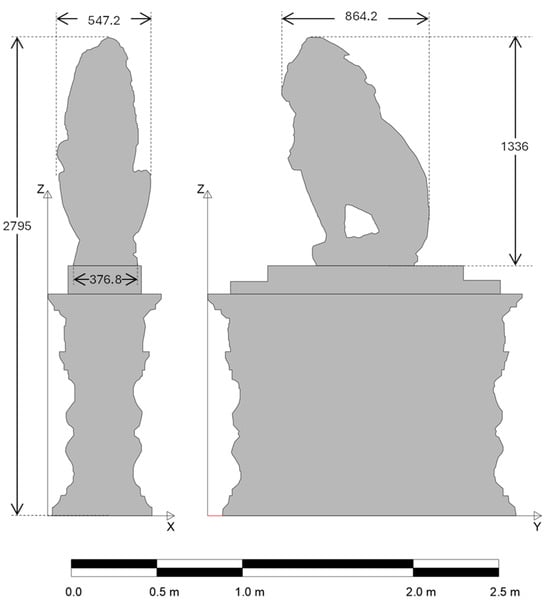
Figure 4.
Lateral and frontal views of the case study.

Table 1.
Geometrical data (in mm) of the case study (the center of mass refers to the bottom of the element).
For the structural analysis, a finite element model has been assumed, since it results in being very versatile and suitable to represent the main dynamic properties of artworks [7,23,28,29,30,31,32]. The FE model, shown in Figure 5, has been made based on a geometrical model, which has been opportunely arranged. The first step consisted of a simplification (i.e., reduction of points) of the lateral surface representing the system; the second step consisted of changing the surface model with a volume one, replacing the three-node polygons with four-node tetrahedra. The obtained 3D model is made of 120,741 tetrahedra: 31,040 in the statue, 12,083 in the base, and 77,618 in the pedestal. As a third step, each finite element has been associated with the proper mechanical property. Table 2 collects the main information regarding the mechanical properties of the materials. They have been assumed after previous experimental investigations made by some of the Authors [24] or provided by technical literature [33]. Namely, the value of the friction coefficient has been assumed to be equal to 0.8 after a dedicated experimental investigation [24].
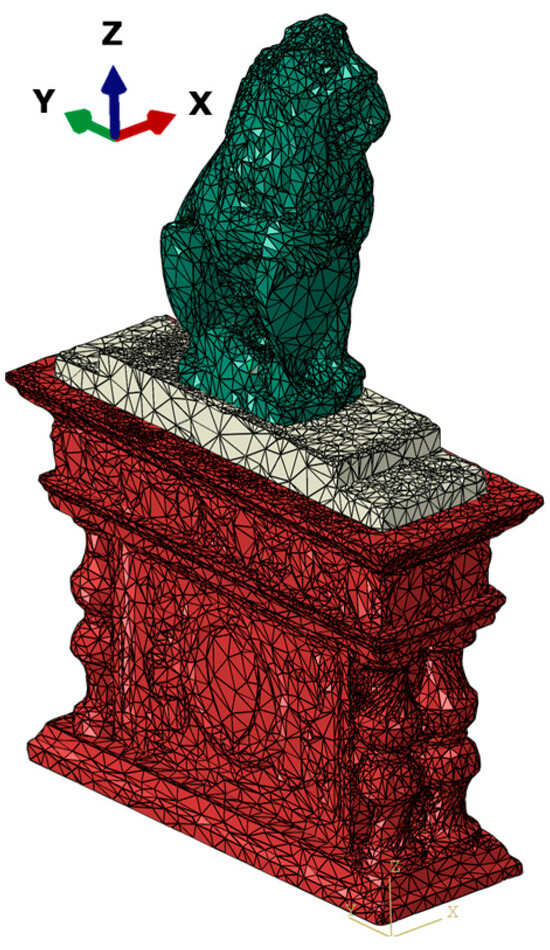
Figure 5.
Structural model and main mechanical properties of materials.
Table 2.
Main properties of the structural model.
2.4. The Considered Overturning Mechanisms
Standing rigid bodies are subjected to rocking and sliding, depending on the amount of friction between their foot and the surface below. For high values of friction coefficient, such as the one assumed in the analysis, rocking is usually the most dangerous dynamic response, since it leads to overturning, which can easily induce collapse. In this work, three overturning mechanisms have been considered, involving respectively the statue only (Model A), the statue and the base (Model B), and the entire artwork (Model C). Figure 6 shows the considered overturning mechanisms along the X-direction.
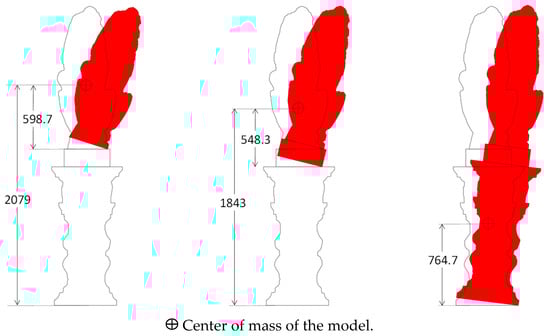
Figure 6.
Considered an overturning model with corresponding position of centers of mass (in mm) along the X-direction.
2.5. The Dynamic Properties of the Case-Study
The dynamic properties of the case study have been found by performing a modal analysis. Such an analysis has been made on the three systems described in Figure 6. Table 3 collects the main information provided by the modal analysis, while Figure 7 shows the first three vibrational modes of the three models.
Table 3.
Results of the model analysis.
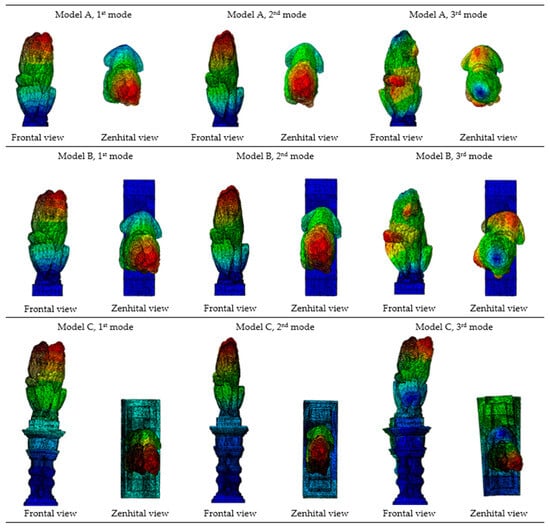
Figure 7.
Vibrational model provided by the modal analysis.
As shown, the dynamic behavior of models A and B is very similar to each other (first period equal to 0.0081 s and 0.0087 s, respectively), while model C slightly differs from the others, with a first period equal to 0.0224 s. All of them have a first mode along the X-direction.
The model analysis has confirmed the X-direction as the most meaningful for the dynamic response of the case study, as suggested by the geometry of the system. The time-history analysis, therefore, will be performed along the X-direction.
2.6. The Considered Collapse Thresholds
For each model, the limit rotations inducing overturning are assumed at the alignment of the center of mass with the two extremities (on the left and on the right) of the system’s footprint. Figure 8 shows the rotations of the three models along the X-direction, while Table 4 collects the values of overturning thresholds. Since the system is not symmetric, the thresholds are slightly different on the two sides.
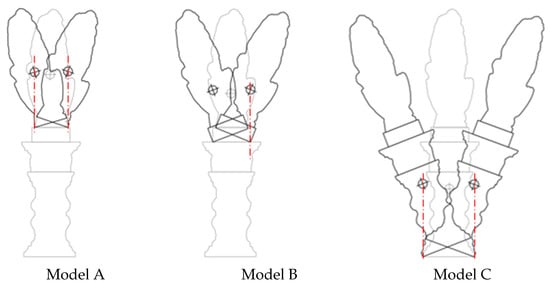
Figure 8.
Limit rotation for overturning.
Table 4.
Limit rotation angles (in °) for overturning due to rocking along the X-direction.
Due to the peculiar geometry of the case study, the overturning of Model A can be affected by sliding. Indeed, a small translation of the statue over its base leads the lion’s footprint to come out of the base (see Figure 9), affecting the overturning limit rotations shown in Table 4. For a larger amount of sliding, even the center of mass of the lion can come out of its footprint, with the consequent overturning of the lion, even without any rocking motion. Figure 9 shows the details of the lion’s position over the base (Model A sliding) and of the base over the pedestal (Model B sliding). As can be seen, even Model B’s overturning could be involved in the sliding between the base’s foot and the pedestal. However, in this case, the lateral displacement needed to affect the overturning domain would be much larger. The overturning of Model C is not affected by the possible sliding, since—due to the current artwork display—the pedestal can experience even large lateral displacements without pushing any wall or object. Table 5 collects the values of lateral displacement of the models, which can affect their rocking thresholds and those that induce their overturning.
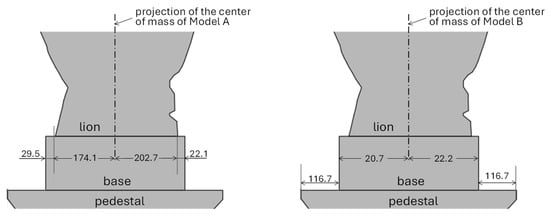
Figure 9.
Detail of the position of the lion over the base.
Table 5.
Limit the relative displacement due to sliding along the X-direction.
The interaction between the effects of rocking and sliding has been checked for Model A only, since it is the most sensitive to sliding; indeed, even a little amount of sliding (over 2.2 cm) can reduce the limit rocking threshold. Furthermore, it is with the higher center of mass, resulting in being the most vulnerable to overturning. Figure 10 shows, for the positive rotation of the statue, the overturning domain of Model A, involving rocking and sliding.
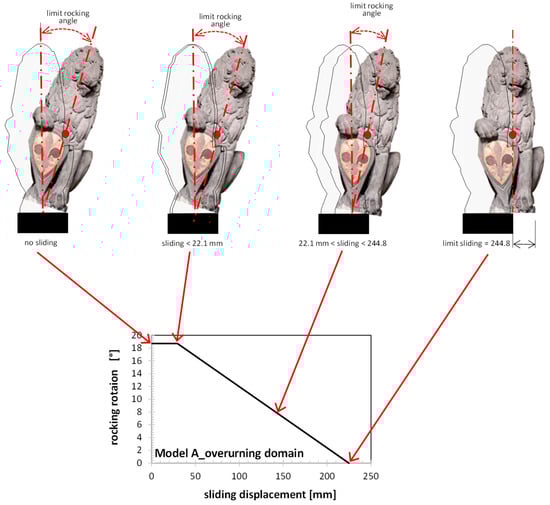
Figure 10.
Collapse the domain of the statue to rocking and sliding (Model A).
2.7. The Analysis
The investigation consists of two sets of time-history analyses. The first one focuses on the three models, assuming the seismic input along one direction only (the X-direction). Both the ground and floor excitations have been considered as seismic input, in order to check the effect of the transmission made by the building on the obtained results. The second set of analyses has been performed on Model A only, by considering the seismic input at the building floor along the two horizontal directions (X and Y). All the time-history analyses have been performed through the software ABAQUS [34]. A linear behavior has been assumed for the materials, since the work is focused on the rocking behavior of the artwork, and the elements can be considered as solid elements with infinite stiffness. Special attention has been paid to the interaction between the contact surfaces of each component of the system (i.e., statue, base, and pedestal), which has been assumed to be non-linear; it is described by two components, respectively normal and tangential to the surfaces. For the normal behavior, a “hard” contact has been adopted: the two corresponding points belonging to the two contact surfaces are separate from each other, i.e., the constraint is removed, when the contact pressure becomes zero or negative. The tangential behavior has been described through the Coulomb friction model with linear and isotropic behavior and a friction coefficient equal to 0.8 [24]. The Reyleigh coefficients (α, β) have been assumed, respectively, as: α = 8.2367711 and β = 0.0000378, on the basis of the modal analysis presented in Section 2.5, with a damping equal to 2% and a range of frequencies between 44.57 Hz and 123.82 Hz.
3. Seismic Input
3.1. The Seismic Input at the Ground Level
The National Museum of Bargello is located in the core of Florence. The entire area consists of Plio-Pleistocene palustrine and alluvial deposits, followed by two sedimentary cycles related to the paleo-Arno River and the Holocene geomorphic evolution [35]. The stratigraphy of Florence’s soil has been determined on the basis of extensive investigations, consisting of 36 down-hole tests and over 1800 drillings [36].
According to the soil classification provided by the Italian Technical Code, Florence’s soil is classified as a B-type, despite the mechanical properties of the most superficial layers, i.e., alluvional deposits, which depend on their consistency, which largely varies within the same areas. The soil of the museum has been the object of further detailed investigations, such as a capacitive electric tomography [37], which confirmed the soil classification. The Peak Ground Acceleration (PGA), defined for a rigid soil and an exceeding probability of 10% in 50 years, is equal to 0.13 g. For the analysis of Marzocco, the PGA has been assumed equal to 0.1764 g, corresponding to the Life Safety limit state (return period equal to 712 years).
The seismic input has been represented through an ensemble of 7 ground motions selected by the software Rexel [38], by assuming the following parameters: soil type B, class of use: 3, Topographic category: T1, Life Safety limit state, Return period equal to 712 years, Maximum number of selected spectra: 500, Excluded waveforms: None, Excluded locations: none, excluded events: none, types of magnitude considered (L = local, W = moment): WL, lower magnitude: 3.6, upper magnitude: 6.0, lower epicentral distance: 0 km, upper epicentral distance: 50 km. The analyses have been performed with the natural intensities of the assumed ground motions. Table 6 shows the main information of the assumed ground motions, while Figure 11a shows their spectra; their mean spectrum (in red) closely fits that of the Code (in black), especially for low periods, like those of the three considered models, as it is shown in Figure 11b.
Table 6.
Ground motions are assumed in the analysis.
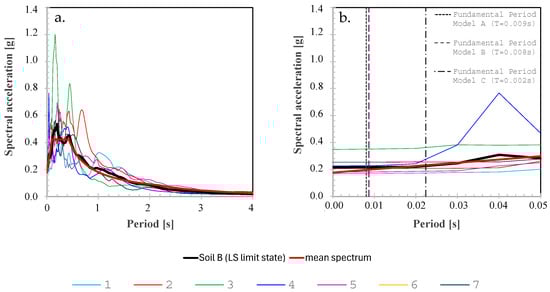
Figure 11.
Spectra of the seismic input assumed in the analysis.
3.2. The Seismic Input at the Floor Level
The seismic acceleration at the first floor has been found by arranging each ground motion through the software seismosignal (Academic Release) (https://seismosignal.software.informer.com/5.0/ (accessed on 15 February 2025)) on the basis of the dynamic properties found for the building, represented through a simplified SDOF system with the damping equal to 5%.
The Fundamental Period of the SDOF has been assumed equal to 0.35 s, which is the average value of the Fundamental Periods found for the building along the two main directions in the experimental investigation [21] resumed in Section 2.1. It should be noted that the obtained floor excitations could neglect some information about the dynamic response of the building, due to the adopted simplified approach. Namely, the obtained ground motions could underestimate the seismic excitation found for low periods.
Figure 12 shows the seven floor ground motions, together with their mean and the elastic floor spectrum provided by the Italian Technical Code. The same figure shows the ratio between each seismic input and the corresponding ground motion.
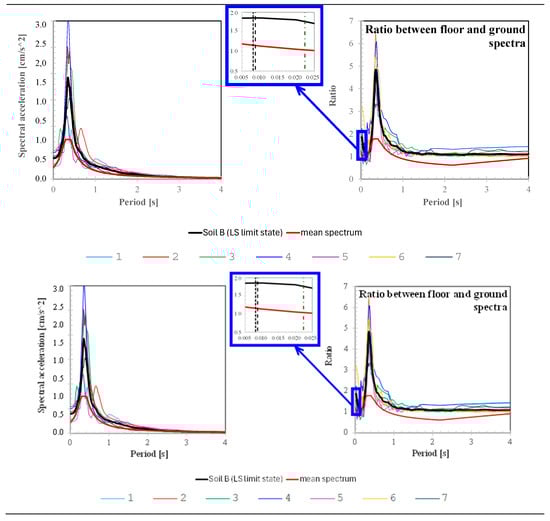
Figure 12.
Floor spectra of the seismic input assumed in the analysis.
As shown, the peak of the mean spectrum found as a result of the SDOF analysis is much larger than the floor Code’s spectrum, especially in the central range of periods.
4. Time-History Analysis for Seismic Input Along the X-Direction
4.1. Dynamic Response of the Considered Models
Model A: Rocking of the statue only. Figure 13 shows the dynamic response, in terms of rotation angle of the statue along the X-direction, due to the seismic input at the ground. In Figure 13, as in the following figures, only the first 20 s of the dynamic response of the system are represented, for the sake of clarity. As can be noted, the maximum rotation experienced by the system varies very much (two orders of magnitude), depending on the ground motion assumed as the input. The maximum response has been found for acc_3, which presents an impulsive trend. Please note that, due to the large difference in the seismic response to each ground motion, the results have been expressed in different scales. To show the difference among the results provided by each ground motion, in Figure 13, an additional diagram has been added, showing the minimum and the maximum rotations achieved in each analysis. The sliding that occurred between the statue’s foot and the base resulted in negligible (well below 1 mm) in all cases. The maximum and minimum sliding have been reported in each plot.
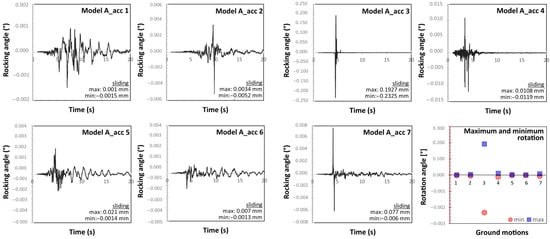
Figure 13.
Rocking angle of the artwork to the ground acceleration histories (Model A).
Figure 14 shows the dynamic response of the same system subjected to the seismic input at the floor. In this case, the system achieves much larger rotations. The obtained results provided by the various ground motions do not differ very much from each other, except for acc_1. Indeed, five of the ground motions (i.e., #2, 3, 4, 6, and 7) achieve a maximum rotation between 1.5° and 2.0°. The plots provide even the maximum and minimum values of sliding, which are negligible, well below the limit affecting the overturning threshold of the system, reported in Table 6.
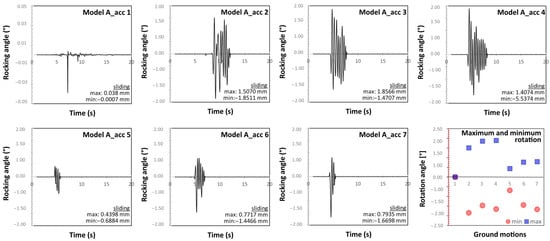
Figure 14.
Rocking angle of the artwork to the floor acceleration histories (Model A).
The safety performance of the system has been expressed through the Safety Index (SI), defined as the ratio between the capacity of the system and the maximum response achieved. Therefore, the safe performance of the system corresponds to an SI over unity. It should be noted that the performed analysis does not account for aleatoric or epistemic uncertainties. The values obtained for SI, therefore, should be considered as potentially affected by some variation. Table 7 collects the SI values found for positive and negative rotations. The effective SI of the system results in the smaller of the two values.
Table 7.
Safety Index found for Model A.
Model B: rocking of the system “statue + base”. Figure 15 shows the dynamic response of Model B to the seismic input at the ground. As can be noted, the trend of the response of Model B to each ground motion is very similar to that of Model A. However, the amount of rocking rotation is smaller than that found for Model A.
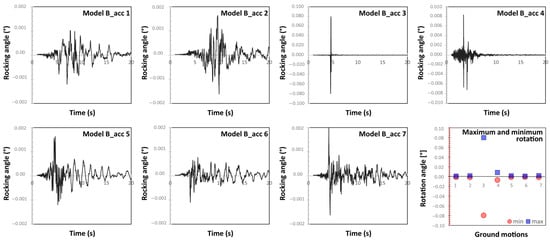
Figure 15.
Rocking angle of the artwork to the ground acceleration histories (Model B).
Figure 16 shows the diagrams of the dynamic responses of Model B provided by the floor accelerations. In this case, the response of the system to each ground motion presents a larger variability than the response found for Model A; indeed, some of the ground motions (acc_5, acc_6) provide maximum displacements below 3 mm. Such large sensitivity to the seismic input can be read even from the SI shown in Table 8.
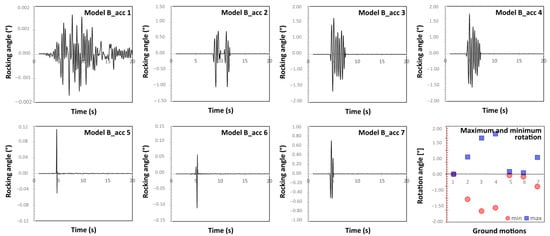
Figure 16.
Rocking angle of the artwork to the floor acceleration histories (Model B).
Table 8.
Safety Index found for Model B.
Model C: rocking of the system statue-base-pedestal. Figure 17 and Figure 18 show the rocking angle of Model C subjected to the seven ground motions at the ground and at the floor, respectively, while Table 9 collects the SI values found for Model C. As can be noted, the SI of Model C is much larger than the other two models. This result is not surprising, since Model C is the one with the lowest center of mass.
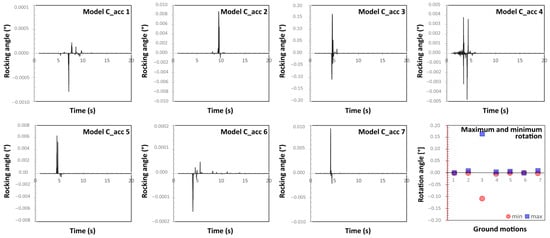
Figure 17.
Rocking angle of the artwork to the ground acceleration histories (Model C).
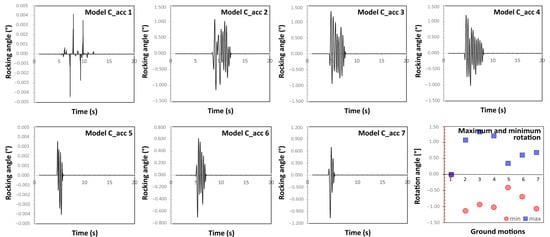
Figure 18.
Rocking angle of the artwork to the floor acceleration histories (Model C).
Table 9.
Safety Index found for Model C.
4.2. Discussion of the Results Found with the 1d Seismic Input
Amplification effects induced by the building. The results presented in Section 4 have shown that the amplification effect caused by the building transfer of the seismic input plays a fundamental role in the assessment of the dynamic response of the case study. Indeed, when the seismic input at the floor is considered, the system presents a dynamic response much larger than the one due to the same ground motion acting at the ground. This effect has been measured in terms of the Input Amplification Ratio (IAR), defined as:
Figure 19 shows the value of IAR found for the three models. This ratio varies between unity (for acc_1) and over 1200 (Model A, acc_6). The results of the analysis show that the role of the filtering induced by the building plays an essential role in the dynamic response of art collections exhibited on upper floors. Depending on the frequency content of the ground motion and the considered artwork, indeed, such an effect can completely change its seismic performance.
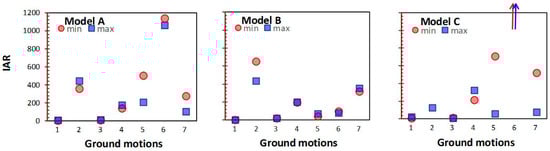
Figure 19.
Ratio between the maximum displacement induced by each ground motion at the floor and at the ground.
Effects Induced by the Use of Different Ground Motion. In this section, the effect of the choice of each single ground motion has been checked. The considered ground motions have been selected to be spectrum compatible with the elastic spectrum provided by NTC 2018 [22] for the soil type of the museum. Even if the match has been made between their mean spectrum and that of the Code’s, each of them constitutes a reliable selection for representing the seismic input at the ground level. The comparison among the results provided by each ground motion, therefore, can provide interesting elements of discussion. The effect of the assumed ground motion has been measured as Ground Motion Ratio (GMR), defined as:
Figure 20 shows the GMR value found with the three models. It can be seen that the variability in the maximum rocking rotation due to the ground motion selection is similar for the three models. GMR results are more sensitive to the floor seismic excitation than to the ground one.
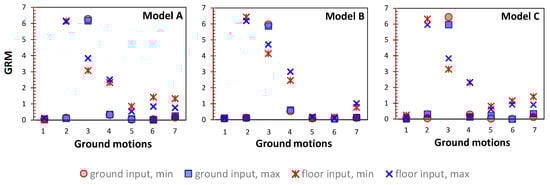
Figure 20.
Ratio between the maximum rocking rotation induced by each ground motion at the corresponding mean value.
Effect of different modeling assumptions. The diagram shown in Figure 21 evidences the variability induced in the dynamic response of the case study by the considered model, by showing—for the floor excitation only—the values obtained for the Safety Index, as defined in Section 4.1. Please note that the SI values found for ground motion 1 are not represented in the graph, since they would require a larger scale of representation. Despite all analyses providing displacements well below the threshold limit for overturning (SI much larger than unity), the results obtained through Model A are less conservative than the others.
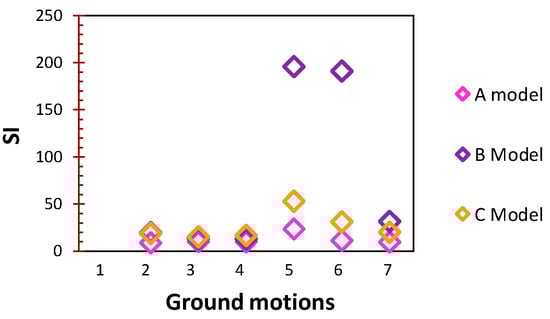
Figure 21.
SI found through the three models.
The maximum and minimum rotations found through the three models have been used to investigate the effect of the assumed model on the obtained results, by introducing the Model Ratio (MR), defined as:
It must be underlined that the maximum rotations compared in Equation (3) refer to different geometrical schemes, and they cannot be considered as equivalent. However, their comparison provides interesting information about the role of models’ assumptions in the dynamic response of the case study. Figure 22 shows the value of MR found for the two ensembles of ground motions. As shown, the variability induced by the model choice is lower than that related to the ground motions.
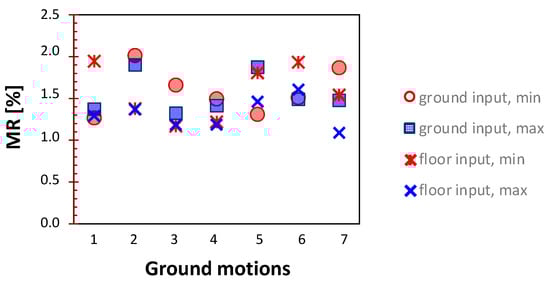
Figure 22.
Model Percentage Difference.
5. Dynamic Response of Model A to Two-Directional Seismic Input at the Floor
5.1. Dynamic Response of Model A in Terms of Rocking and Sliding
The results provided by the time-history analysis presented in Section 4 have shown that Model A presents a larger dynamic response—both in terms of rocking rotation and sliding—than the other two models. For this reason, Model A has been used to perform a further investigation, where the seismic excitation at the exhibition floor is represented through two sets of ground motions, respectively acting along the two horizontal (X and Y) directions.
Figure 23 shows the time histories of the rocking rotation and of the foot sliding of the statue. Even in this case, due to the large difference in the results provided by each ground motion, different scales of representation have been adopted for showing the results. As shown, the 2d seismic input has not significantly increased the obtained rotation.
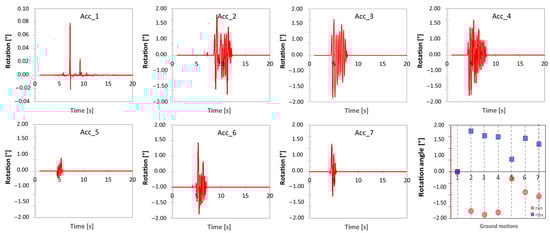
Figure 23.
Rocking rotation of Model A provided by the 2D analysis.
Figure 24 shows the sliding between the lion’s footprint and its base, which is much larger than the one provided by assuming the seismic input along the X-direction only. For some ground motions, such as the #2, #3, #4 and #6, the lateral displacement is large enough to affect the overturning capacity. In Figure 25, the dynamic response of Model A has been represented in the plane “sliding-rocking angle” to check the seismic performance of the artifact, accounting for both the response quantities. It should be noted that the capacity domain of the response quantities has been represented by plotting the absolute values of rotation and translation.
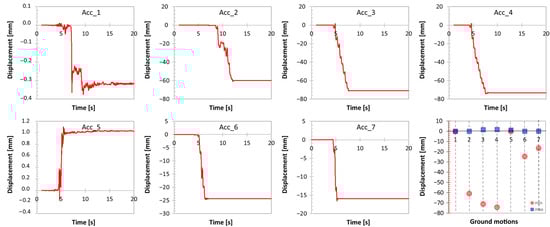
Figure 24.
Sliding displacement of Model A provided by the 2D analysis.
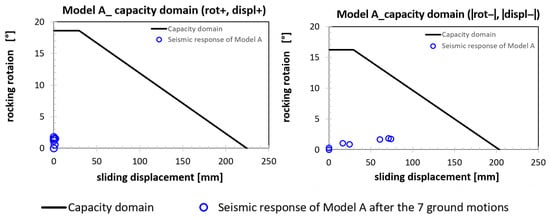
Figure 25.
The capacity domain and dynamic response of Model A provided by the 2D seismic input.
The safety index of the statue with regard to the joint occurrence of rocking and sliding can be checked both (i) in terms of rocking angle, by considering the reduction of capacity due to sliding, and (ii) in terms of sliding, by considering the reduction of capacity due to rocking. With regard to the capacity domain to positive rotations, the maximum sliding is below 2 mm for all seven ground motions; therefore, the SI expressed in terms of rocking is not affected by the sliding amount.
Table 10 collects, for positive and negative responses, the value of SI found in terms of rocking and sliding; the effective SI has been assumed as the minimum of the four values.
Table 10.
SI of Model A.
5.2. Comparison Between the Results Provided by Considering 1d and 2d Seismic Input
The maximum dynamic responses of Model A provided by the two performed analyses have been compared. Figure 26 shows the maximum and minimum rotations provided by the 1d seismic input (in blue) and the one provided by the 2d seismic input (in red).
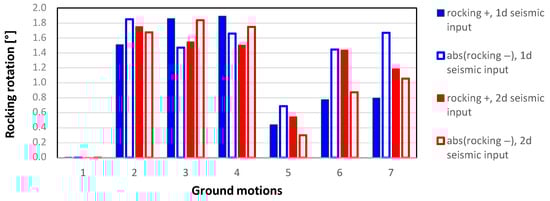
Figure 26.
Maximum (+ and −) rotations provided by the two analyses.
In the figure, the minimum (negative) rotations have been shown through their absolute values, in order to better compare their amount with the maximum (positive) rotations. As noted, the amount of rocking rotation does not increase by going from the 1d seismic input to that of 2d. Instead, for some ground motions (see #6), the maximum rocking response has different signs (going from negative to positive and vice versa) in the two analyses.
Even if the maximum rocking is not very much affected by the two-directionality of the seismic input, the SI largely reduces—for almost all considered ground motions—when the 2d input is considered. Figure 27 shows the SI values provided by the two analyses (please note that some of the values, i.e., #1 and #5, exceed the limit of the plot).
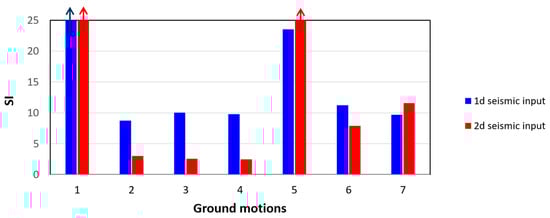
Figure 27.
Safety Index of Model A provided by the two analyses.
Therefore, the performed analyses have shown that the two-directionality of the seismic input largely affects the dynamic response of the case study, consistently reducing its SI.
6. Conclusions
In this work, the dynamic response of the statue “Marzocco” by Donatello to seismic excitation has been checked. The possible collapse mechanism of the artwork, consisting of the statue, its base and its pedestal, has been investigated through three different models, which assume, respectively, the overturning of the statue only, of the statue with its base, and of the entire complex.
The seismic response of the three models has been found with reference to an ensemble of seven ground motions, spectrum compatible with the elastic response spectrum provided by the current Italian Technical Code for the Life Safety limit state (return period equal to 712 years) and a soil type B, whose PGA is equal to 0.1764 g.
The ensemble of ground motions represents the seismic input at the ground. Since the room where Marzocco is exhibited is located on the first level, the seven ground motions have been filtered through a simplified SDOF system having the same frequency as the first level of the building. The seismic response of the artwork has been found both using the original ensemble, representing the seismic ground excitation, and the arranged one, representing the floor excitation.
The performed analyses provided the following evidence:
- -
- The seismic performance of the case study fully complies with the limit conditions both for rocking and sliding.
- -
- The floor excitation provides a dynamic response much larger (over 1000 times) than the ground excitation. Such amplification is largely affected by the frequency content of each ground motion. Anyway, the effect of the input propagation played by the building cannot be neglected.
- -
- The response of the case study is largely affected by the considered ground motion (both the ground and the floor ones): some of the ground motions induce a maximum displacement 6 times larger than the mean displacement of the ensemble.
- -
- The three models provide different predictions of the dynamic response of the artwork. Namely, the most significant, i.e., “dangerous”. The collapse mechanism is the overturning of the statue only (Model A).
With reference to Model A, a further investigation has been carried out, consisting of a two-dimensional analysis. The rocking obtained in this latter analysis was similar to that found in the previous analysis; the sliding, instead, was much larger than that provided by the 1d input. As a consequence, the Safety Index, found as the ratio between the capacity of the system and its dynamic response, changes very much, going from 1d to 2d seismic input.
The work offered an exhaustive investigation of “Marzocco”, facing its possible collapse mechanisms, overturning and sliding. It explains the importance of a careful assumption of the seismic input, which must take into account the exact position of the artwork within the exhibition building. Furthermore, the work shows a consistent parametric analysis of the main choices affecting the analysis, and it provides a comprehensive assessment of the seismic safety of “Marzocco”.
Author Contributions
Conceptualization. M.T. and S.V.; methodology. M.T., S.V. and R.M.A.; software. M.T. and F.T.; validation. F.T. and M.T.; formal analysis. M.T. and R.M.A.; investigation. R.M.A., M.T., F.T. and S.V.; data curation. R.M.A. and F.T.; writing—original draft preparation. S.V.; writing—review and editing. S.V.; visualization. M.T. and S.V.; supervision. M.T. All authors have read and agreed to the published version of the manuscript.
Funding
This research received no external funding.
Data Availability Statement
The experimental data used for analysis will be provided on request.
Acknowledgments
We are grateful to the National Museum of Bargello for the surveys conducted on the building and on the artwork.
Conflicts of Interest
The authors declare no conflicts of interest.
Abbreviations
The following abbreviations are used in this manuscript:
| PGA | Peak Ground Acceleration |
| SDOF | Single Degree of Freedom |
| SI | Safety Index |
| IAR | Input Amplification Ratio |
| GMR | Ground Motion Ratio |
| MR | Model Ratio |
References
- Podany, J.; Metro, B. Survey of Artifacts Damage in the Bay area Museums. Earthquake spectra. J. Earthq. Eng. Res. Inst. 1990, 6, 339–377. [Google Scholar]
- Andreatta, M.; Coppola, F.; Modelli, A.; Santopuoli, N.; Seccia, L. Proposal for a new environmental risk assessment methodology in cultural heritage protection. J. Cult. Herit. 2017, 23, 22–32. [Google Scholar] [CrossRef]
- Ciampoli, M.; Augusti, G. Vulnerabilità sismica degli oggetti esibiti nei musei: Interventi per la sua riduzione. In Vulnerabilità dei Beni Archeologici e Degli Oggetti Esibiti nei Musei; Liberatore, D., Ed.; CNR-GNDT: Rome, Italy, 2000. (In Italian) [Google Scholar]
- Parisi, F.; Augenti, N. Earthquake damages to cultural heritage constructions and simplified assessment of artworks. Eng. Fail. Anal. 2013, 34, 735–760. [Google Scholar] [CrossRef]
- Lo Russo, S.; Natali, A.; Matteucci, C.; Palla, F.; Apicella, S.A.; Pianese, C.; Bertolami, C.; Barresi, G.; Di Carlo, E. La Gestione del Rischio nel Settore dei Beni Culturali: Musei, Biblioteche e Archivi; Mimesis Edizioni: Milano, Italy, 2015. [Google Scholar]
- Costain, C. Framework for Preservation of Museum Collections; CCI: Ottawa, ON, Canada, 1994; pp. 1–4. [Google Scholar]
- Domaneschi, M.; Tanganelli, M.; Viti, S.; Cimellaro, G.P. Vulnerability of art works to blast hazard: The Fountain of Neptune in Florence. In Proceedings of the COMPDYN 2021, Athens, Greece, 27–30 June 2021; pp. 1–10. [Google Scholar]
- Domaneschi, M.; Cimellaro, G.P.; Viti, S.; Tanganelli, M. Protection of art works to blast hazards: The Fountain of Neptune in Florence. Int. J. Mason. Res. Innov. 2023, 1, 1. [Google Scholar] [CrossRef]
- Saeed, E.S.; Giresini, L.; Niglio, O.; Graziotti, F. Human-induced vibrations on Museum artefacts: Literature review and calculation example. In Proceedings of the 9th ECCOMAS Thematic Conference on Computational Methods in Structural Dynamics and Earthquake Engineering, Athens, Greece, 12–14 June 2023; Papadrakakis, M., Fragiadakis, M., Eds.; COMPDYN: Athens, Greece, 2023. [Google Scholar]
- Valach, J.; Wolf, B.; Urushadze, S.; Paulova, E.; Stefcova, P. Quantification of mechanical loads induced by traffic and visitors on museum collections placed in a cultural heritage building. In Proceedings of the Sustainable Development and Planning, Seville, Spain, 23–25 September 2024. [Google Scholar]
- Viti, S.; Reinhorn, A.M. Monumental buildings used as museums: Protection or danger for the artifacts? Procedia Struct. Integr. 2020, 29, 40–47. [Google Scholar] [CrossRef]
- Azzara, R.M.; D’Ambrisi, A.; Tanganelli, M.; Trovatelli, F.; Vettori, N.; Viti, S. Vulnerability Assessment of Art Collections: The National Archaeological Museum “Gaio Cilnio Mecenate” in Arezzo (Italy). Buildings 2023, 13, 2701. [Google Scholar] [CrossRef]
- Podany, J. An overview of Seismic Damage Mitigation for Museums. In Proceedings of the International Symposium on Advances of Protection Devices for Museums Exibits, Beijing, China; Shanghai, China, 13–17 April 2015. [Google Scholar]
- Podany, J. When Galleries Shake: Earthquake Damage Mitigation for Museum Collections; Getty Publications: Los Angeles, CA, USA, 2017; p. 248. ISBN 978-1-60606-522-8. [Google Scholar]
- Lelli, S.; Gatto, M.; Tanganelli, M.; Viti, S. Seismic vulnerability of museums’ collections: A case-study. In Proceedings of the 9th ECCOMAS Thematic Conference on Computational Methods in: Structural Dynamics and Earthquake Engineering, Athens, Greece, 12–14 June 2023; Papadrakakis, M., Fragiadakis, M., Eds.; COMPDYN: Athens, Greece, 2023. [Google Scholar]
- Viti, S.; Tanganelli, M. Resimus: A research project on the seismic vulnerability of museums’ collections. In Proceedings of the 7th International Conference on Computational Methods in Structural Dynamics and Earthquake Engineering (COMPDYN 2019), Crete, Greece, 24–26 June 2019; National Technical University of Athens: Athens, Greece, 2019; Volume 2, pp. 2819–2829, ISBN 978-618-82844-7-0. [Google Scholar]
- Tanganelli, M.; Viti, S.; Azzara, R.M.; Trovatelli, F.; D’Ambrisi, A.; Vettori, N. Dynamic monitoring as premise for seismic safety of art collections. In Proceedings of the ICONREM 2024, Turin-Ispra, Italy, 24–27 June 2025. [Google Scholar]
- Tarmigh, A.; Dabanlı, Ö.; Pakdamar, F. State of the art in seismic vulnerability and protection strategies for museum artifacts: Innovations and insights. Stud. Conserv. 2025, 70, 1–18. [Google Scholar] [CrossRef]
- Zhou, Q.; Yang, K. Collision between a falling-down Museum artwork and floor by simulation. In Proceedings of the 3rd International Conference on Information and Computing, Wuxi, China, 4–6 June 2010. [Google Scholar]
- Ishiyama, Y. Motion of rigid bodies and criteria for overturning by earthquake excitations. Earthq. Eng. Struct. Dyn. 1982, 10, 635–650. [Google Scholar] [CrossRef]
- Azzara, R.M.; Pellegrini, D.; Cardinali, V.; Viti, S.; Tanganelli, M. Assessment of the Acceleration Floor Spectra Through Dynamic Identification: The Museum of Bargello in Florence. In Proceedings of the 17th World Conference on Seismic Isolation (WCSI 2022), Turin, Italy, 11–15 September 2022; Springer Science and Business Media Deutschland GmbH: Heidelberg, Germany, 2023; Volume 309, pp. 1010–1021, ISBN 978-3-031-21186-7. [Google Scholar]
- NTC. Decreto del Ministro delle Infrastrutture del 17 gennaio 2018. In Nuove Norme Tecniche per le Costruzioni; NTC: Milano, Italy, 2018. (In Italian) [Google Scholar]
- Viti, S.; Pintucchi, B.; Rotunno, T.; Tanganelli, M. The seismic analysis of Cerere at the Museum of Bargello. Bull. Earthq. Eng. 2020, 18, 2635–2656. [Google Scholar] [CrossRef]
- Tanganelli, M.; Cimellaro, G.P.; Viti, S.; Marasco, S.; Cardoni, A.; Noori, A.Z.; Coli, M. Dynamic analysis of artifacts: Experimental tests for the validation of numerical models. In Proceedings of the COMPDYN 2019, Crete, Greece, 24–26 June 2019. [Google Scholar]
- Paolozzi Strozzi, B. La Storia del Bargello. 100 Capolavori da Scoprire; Silvana Editoriale, S.p.a.: Milano, Italy, 2008; ISBN 9788882158477. (In Italian) [Google Scholar]
- Lumachi, F. Firenze. Nuova Guida Illustrata. Storica. Artistica. Aneddotica Della Città e Dintorni; Società Editrice Fiorentina: Firenze, Italy, 1929. (In Italian) [Google Scholar]
- Manescalchi, R. Il Marzocco/The Lion of Florence; Carchio, M., del Meglio, A., Crescioli, G., Eds.; Grafica European Center of Fine Arts: Brussels, Belgium, 2005; ISBN 978-88-95450-23-0. [Google Scholar]
- Tanganelli, M.; Stefano Galassi, S.; Viti, S. Simplified analyses for the model setting of sculptures: The “Oceano” by giambologna. In Proceedings of the Compdyn 2021, Atene, Greece, 27–30 June 2021; pp. 1–10. [Google Scholar]
- Borri, A.; Grazini, A. Diagnostic Analysis of the Lesions and Stability of Michelangelo’s David. J. Cult. Herit. 2006, 7, 273–285. [Google Scholar] [CrossRef]
- Kwon, H.H.; Shin, J.A.; Cho, N.C. Application of Finite Element Analysis for Structural Stability Evaluation of Modern and Contemporary Sculptures: ‘Eve 58-1’ by Man Lin Choi. J. Conserv. Sci. 2022, 38, 277–288. [Google Scholar] [CrossRef]
- Spyrakos, C.C.; Maniatakis, C.A.; Taflampas, I.M. Application of Predictive Models to Assess Failure of Museum Artifacts Under Seismic Loads. J. Cult. Herit. 2017, 23, 11–21. [Google Scholar] [CrossRef]
- Avellino, G.C.; Cannizzaro, F.; Di Martino, A.; Valenti, R.; Paternò, E.; Caliò, I.; Impollonia, N. Numerical and Experimental Response of Free-Standing Art Objects Subjected to Ground Motion. Int. J. Archit. Herit. 2021, 16, 1–16. [Google Scholar]
- Coli, M.; Tanini, C.; Haines, M.; Pandeli, E.; Pini, G.; Bencini, F. The ‘Pietra Serena’ stones of Brunelleschi’s Cupola. J. Cult. Herit. 2008, 9, 214–221. [Google Scholar] [CrossRef]
- Hibbit, H.D.; Karlsson, B.I.; Sorensen, E.P. ABAQUS User Manual; Abaqus Version 2025; Dassault Systèmes Simulia Corp.: Providence, RI, USA, 2025. [Google Scholar]
- Coli, M.; Rubellini, P. Geological anamnesis of the Florence area, Italy. Z. Dt. Ges. Geowiss. (Ger. J. Geosci.) 2013, 164, 581–589. [Google Scholar] [CrossRef] [PubMed]
- Coli, M.; Ripepe, M.; Lacanna, G. Geological setting and seismic hazard for Florence (Italy). A UNESCO Cultural Heritage site. In Proceedings of the 15th Asian Regional Conference on Soil Mechanics and Geotechnical Engineering (as an issue of Japanese Geo-technical Society Special Publication), Kathmandu, Nepal, 28–29 October 2016. [Google Scholar]
- Sapia, V.; Materni, V.; Giannattasio, F.; Marchetti, M. Esplorazione geofisica del sottosuolo: Primi risultati nel centro storico di Firenze. In RESIMUS: Un Progetto Rivolto Alla Vulnerabilità Sismica Delle Opere Museale; DIDAPRESS: Florence, Italy, 2018. (In Italian) [Google Scholar]
- Iervolino, I.; Galasso, C.; Cosenza, E. REXEL: Computer aided record selection for code-based seismic structural analysis. Bull. Earthq. Eng. 2009, 8, 339–362. [Google Scholar] [CrossRef]


Disclaimer/Publisher’s Note: The statements, opinions and data contained in all publications are solely those of the individual author(s) and contributor(s) and not of MDPI and/or the editor(s). MDPI and/or the editor(s) disclaim responsibility for any injury to people or property resulting from any ideas, methods, instructions or products referred to in the content. |
© 2025 by the authors. Licensee MDPI, Basel, Switzerland. This article is an open access article distributed under the terms and conditions of the Creative Commons Attribution (CC BY) license (https://creativecommons.org/licenses/by/4.0/).