Abstract
This study investigates the biodeterioration of mosaic surfaces in a semi-confined archaeological environment along the Phlegraean coast (Baiae, Italy), focusing on the interaction between salt efflorescence and phototrophic biofilms. A multi-analytical approach was employed, integrating in situ observations with ex situ analyses, including SEM/EDS, FTIR spectroscopy, and metabarcoding (16S and 18S rRNA), to characterize both abiotic and biotic alteration patterns. Results highlight subtle traces of spatial differentiation: samples from the more exposed sector showed a more consistent colonization by halotolerant and halophilic taxa, particularly among Halobacteria and Rubrobacter, along with abundant sodium, chloride, and sulfate signals suggestive of active salt crystallization. Protected areas exhibit a comparable presence of salts with less diverse halophilic communities that vary along a vertical gradient of light exposure. The integration of chemical and biological data supports a model in which salt stress and biofilm development are co-dependent and synergistic in driving surface degradation. These findings emphasize the need for context-specific conservation strategies that account for the combined action of environmental salinity and microbial communities on historical materials.
1. Introduction
Among the many environmental hazards that a stone artifact is subjected to over time, biodeterioration stands apart due to its unpredictability and complexity [1]. The colonization of historical structures by microorganisms poses a significant threat to the structural integrity and visual identity of outdoor archaeological sites [2,3]. Among the organisms most involved in stone biodeterioration phenomena, photoautotrophs such as algae and cyanobacteria constitute typical pioneer populations, usually spread by wind and deposited on stone surfaces where they can thrive, under adequate conditions, by forming biofilms [4,5,6]. Resilient algal and cyanobacterial biofilms, rich in EPS, adhere tightly to stone, plasters, brick, tuff, and other porous substrates, altering their appearance [7,8]; they fill superficial holes and cracks, retaining moisture and accelerating both physical and chemical degradation processes, respectively, through freeze/thaw cycles and excretion of organic acids, followed by the acidolysis of minerals [9,10,11]. Microbial metabolism may not only trigger biocorrosion through the release of acids but also favor salt crystallization cycles, eventually leading to substrate disintegration [12,13,14].
Aeroterrestrial green algae and cyanobacteria—such as Chlorella, Stichococcus, Chroococcus and Nostoc—are among the most persistent colonizers of architectural surfaces [15,16]. Their remarkable ability to survive desiccation, irradiance, and oligotrophic conditions explains their dominance on outdoor substrates [17]. Furthermore, both green algae and cyanobacteria act as a primary source of organic matter, thus actively promoting the growth of heterotrophs like bacteria and fungi and, as a consequence, indirectly participating in other deterioration phenomena [18]. Additionally, phototrophic organisms’ pigments like chlorophylls and carotenoids produce vivid green, orange, or black discolorations which compromise the chromatic appearance of masonry materials, altering the aesthetic features of cultural heritage artifacts [8,19,20].
Microclimatic factors, such as direct exposure to sunlight, moisture, brackish water infiltrations and sea sprays carried by coastal breeze, play a crucial role in the biodeterioration of outdoor stone monuments, as they heavily contribute to the growth and diversity of biofilms [2,21,22]. Additionally, microclimate-dependent stresses directly influence the weathering of stone heritage: high relative humidity (>80%), particularly common in hypogeal and semi-confined environments, often results in severe deformation, exfoliation and detachment of plasters and mosaics [23,24]. Marine aerosols triggering the formation of salt deposits and encrustations, in addition to salt crystallization cycles, alter the substrate’s macroscopical and chemical features. These formations also positively select for halotolerant microorganisms, deeply influencing their abundances in the biological patinas [25,26].
Given the cultural, architectural, and aesthetic value of the affected structures and of historically significant landscapes—like ancient Roman archaeological sites—ensuring their preservation is a pressing conservation objective [27,28]. Nonetheless, all conservation approaches cannot be carried out without a thorough preliminary study, drawing on the array of petrographic, physio-chemical and biological diagnostic techniques to characterize the stone substrata, highlight microbial communities’ diversity and, most importantly, to predict and quantify the effects selected cleaning and consolidation procedures could have on both biofilms and the artifact’s appearance [29]. Microscopic methods—including optical microscopy and scanning electron microscopy (SEM)—are used to visualize biofilm morphology and adhesion [30,31]. Elemental and molecular analyses through energy-dispersive spectroscopy (EDS), Raman spectroscopy and Fourier-transform infrared (FTIR) spectroscopy reveal substrate alterations produced by previous restoration or caused by environmental disturbances [32,33]. X-Ray Fluorescence (XRF) spectrometry and X-ray Diffraction (XRD) highlight the chemical composition and origin of stone, metals and pigments used for painting and frescoes [34]. Finally, non-destructive colorimetric assays and Active Thermography (AT) highlight chromatic and water retention patterns (associated with fractures and biofilms), providing quantitative insights on the effects of consolidation and cleaning procedures [35,36].
In the last 20 years, biomolecular diagnostics have been revolutionized by the advent of -omics techniques, further deepening our understanding of microbial fouling. Metagenomic and transcriptomic analyses allow for detailed taxonomic and functional profiling of biofilm communities [37,38,39]. At present, high throughput amplicon sequencing (Illumina) has become much more practical and less expensive: such an approach, known as metabarcoding, allows for the taxonomic annotation of prokaryotic and eukaryotic biofilm-forming microorganisms, indicating their relative frequency and highlighting their distribution patterns on artifacts of historical interest [40].
This study contributes to this growing body of research by evaluating the effects of microbial biodeterioration on historical artifacts with both in situ and ex situ techniques. By combining morphological, petrographic, optical and biological methodologies, our research aims to reinforce the conceptual and operational foundations for diagnostics and monitoring of outdoor archaeological sites and the degradation phenomena.
The case study presented here focuses on the general degradation and biodeterioration phenomena concerning two semi-confined rooms, both featuring heavily exfoliated mosaics, part of the Mercury Sector of the Archaeological Park of Baia’s Thermal Baths.
2. Materials and Methods
2.1. Site Description
2.1.1. Sampling Points and Macroscopic Observations
The sites investigated are two semi-confined rooms located in the southern portion of the Mercury Sector of the Archaeological Park of Baia’s Thermal Baths (Figure 1). Room F is fully exposed to sunlight and winds on the eastern side, while room E is only exposed through an arc opening, located four meters above the ground level, in the upper eastern side of the room. Both rooms present heavily exfoliated white mosaics and plasters and are about one to one-and-a-half meters above the brackish groundwater.
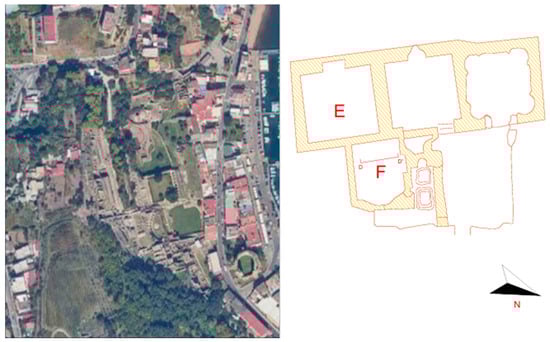
Figure 1.
Satellite picture (left) and planimetry of rooms F and E (right) in the Mercury Sector of the Archaeological Park of Baia’s Thermal Baths. The red circle shows were the investigated sites are collocated.
The peculiar microclimatic, geological and chemical features of the rooms, such as high humidity, bradyseism and salt depositions, help build a complex frame of decay and further intensify the development of biofilms on the surfaces. All the methodologies employed were used to highlight the specific pattern of biological diversity shown by these heavily compromised environments, and the physio-chemical and biological variations between the two investigated rooms (namely F and E) as well as the two main stone substrata colonized by microorganisms, i.e., plasters and mosaics.
Sampling was executed by focusing on sections of the mosaics and plasters most affected by biodeterioration, and by taking into account the color diversity of the patinas and the diverse colonized substrata. Sampling points for Rooms F and E are shown in Figure 2 and Figure 3, respectively. For each sampling point, an area of 4 cm2 was taken into consideration; biofilms were scraped from the surface using a sterile scalpel, in order to obtain 200 mg of biological material to be subjected to the metabarcoding analyses. Some of the sampling points were duplicated at a short distance to better account for alleged biological diversity presumed by macroscopic observations; for such cases (FT8 and ET4), biomolecular analyses were performed for each of the duplicates.
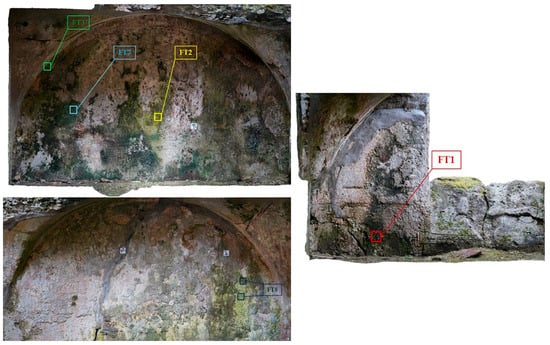
Figure 2.
Sampling points for Room F. On the (right), the northern side is shown (FT1); on the (upper left) (FT2, FT3 and FT7) and on the (bottom left), the western and southern sides are shown, respectively (FT8).
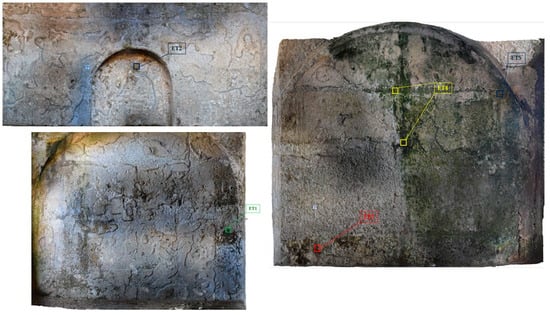
Figure 3.
Sampling points for Room E. On the (right), the northern side is shown (ET3, ET4 and ET5); on the (upper left) (ET2) and on the (bottom left) (ET1), the western and southern sides are shown, respectively.
The choice of samples representative of the different substrata (Table 1) was also carried out through a thorough in situ observation of superficial macroscopic features, salt deposits and biofilms, using a Dino-Lite AM2111 at 5× magnification (Figure 4). This preliminary observation was instrumental to a careful selection of the samples to be subjected to subsequent analyses.

Table 1.
IDs of samples from both rooms and each substrate. IDs with * indicate the points in which two different biological patinas were sampled.
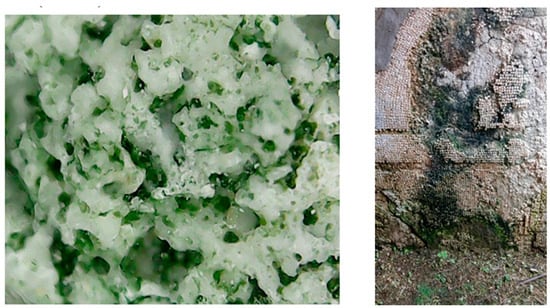
Figure 4.
FT1 mosaic fragment: 5x magnification (left) and site of sampling (right).
2.1.2. Measurement of Microclimatic Variables
Microclimate variables, i.e., fluctuations in temperature and relative humidity, were measured from December 2024 to October 2025, thanks to the cooperation of ES srl (https://www.es-it.com/ access on 7 November 2025). EE07 thermo-hygrometric sensors were installed in each room and data was recorded using a WSD12-THEE datalogger (Capetti Elettronica, Castiglione Torinese, Italy); temperature and humidity measurements were sampled every ten minutes for the whole duration of the monitoring. The data obtained (Figure 5) show very stable seasonal trends in temperature (Room F median temperature: 18 °C; Room E median temperature: 17.65 °C) and a markedly high relative humidity, frequently over 80% (Room F median RH: 81.87%; Room E median RH: 84.73%).
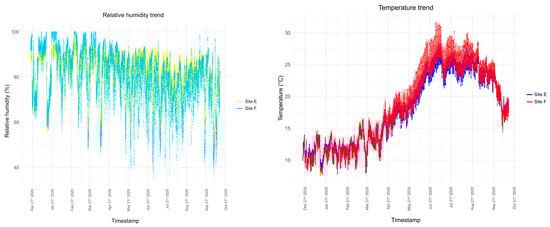
Figure 5.
Humidity and temperature trends in rooms E and F from December 2024 to October 2025.
2.2. Preliminary Diagnostic Analyses
2.2.1. X-Ray Diffraction Spectroscopy
X-ray diffraction (XRD) was used to obtain semi-quantitative information about the mineralogical components of the mosaic tesserae and surface crusts sampled from Environment F. Samples were collected from areas representative of the main chromatic and morphological patterns observed macroscopically, with special attention to zones exhibiting white efflorescences, gray crusts, or visible biodeterioration (Figure 2 and Figure 3).
The analyses were carried out using a Miniflex X-ray diffractometer (Rigaku, Wilmington, MA, USA) equipped with a cobalt tube (λ = 1.7902 Å), operating at 30 kV and 15 mA and counting time set as 3600 s. The resulting diffractograms were processed using dedicated software and interpreted by comparison with reference patterns from the ICDD PDF-2 database. The main crystalline phases were identified and classified as primary components (e.g., calcite, quartz) or alteration products (e.g., gypsum, halite, other salts).
2.2.2. FT-IR Spectroscopy
Fourier Transform Infrared Spectroscopy (FT-IR) was employed to analyze the chemical structure, functional groups, and bonding environments of the compounds detected on the surfaces of both environments. The technique was selected and employed for its sensitivity to both inorganic and organic components, including secondary crusts, salts, and biogenic materials. The analysis was carried out using a Nicolet iS10 FTIR spectrometer (Thermo Fisher Scientific, Waltham, MA, USA) equipped with a dried and sealed optical system, and a bench fitted with KBr windows protected by a CaF2 coating. Five sampling spots, two for mosaics and three for plasters, were selected for each environment (Figure 2 and Figure 3), according to the visual differences in color and texture of the patinas (e.g., greenish, whitish, or darkened areas). Prior to each measurement, the instrument was autocalibrated using the built-in background procedure by keeping the pellet press lowered, to ensure baseline cleanliness and spectral stability. Micro-samples (1–2 mg) were taken from each spot using a scalpel, then homogenized with spectroscopic-grade KBr and pressed into transparent pellets using a manual hydraulic press.
Spectra were collected in the 4000–400 cm−1 range, with a resolution of 4 cm−1 and 32 scans per sample. Functional group assignments were made by comparison with published IR spectral libraries, with special attention to vibrational bands typical of carbonates (e.g., 1420, 875 cm−1), sulfates (~1130 cm−1), silicates (1000–1040 cm−1), and organic biomolecules (e.g., OH, NH, CH, amide I and II). The spectral data were interpreted in conjunction with the morphological and compositional results from SEM/EDS and XRD.
2.2.3. SEM/EDS Analyses
Samples were analyzed using a VEGA3 XMU scanning electron microscope (Tescan, Brno, Czech Republic), equipped with a LaB6 electron source and coupled with an EDS detector (Oxford Instruments, Abingdon, Oxfordshire, UK) using an AZtecEnergy software platform (https://nano.oxinst.com/products/aztec/aztecsynergy, access on 7 November 2025). The instrument was also equipped witha panchromatic CL detector with 185–850 nm wavelength range, a low-vacuum SE detector, backscattered electron detector and IR TV camera for chamber viewing. Elemental maps and point analyses were used in combination to identify inorganic phases and potential biological residues. For each selected sample, at least two point analyses were conducted via SEM/EDS at magnification levels mostly comprised between 1500 and 2000×, in order to account for the chemical heterogeneity observed at the microscale.
2.3. Biomolecular Analyses of Environmental Samples
Genomic DNA was extracted using the DNeasy PowerSoil Pro Kit (QIAGEN, Milan, Italy), with minor adjustments to the manufacturer’s standard protocol. All samples, previously stored at −20 °C, were resuspended in 250 μL of sterile, nuclease-free water and subjected to mechanical lysis for 10 min using a vibro-mill operating at 25 Hz. The lysate was then incubated at 60 °C for 20 min to facilitate further disruption and release of nucleic acids. The resulting material was processed according to the standard steps of the kit protocol. Genomic DNA yield was assessed by electrophoretic separation on a 0.8× agarose gel. DNA was amplified via PCR using primers modified with Illumina adapter overhangs to enable high-throughput sequencing of the resulting amplicons. The objective of the amplification was to obtain sufficient quantities of target DNA corresponding to two taxonomically informative loci: a hypervariable region of the 16S rRNA gene for prokaryotes and a homologous region within the 18S rRNA gene for eukaryotes. Both loci are known for their high polymorphism and taxonomic resolution, making them suitable for metabarcoding studies aimed at characterizing complex microbial communities. For the 16S locus, amplification was performed using the Pro341F primer (5′-CCTACGGGNBGCASCAG-3′) and the Pro805R primer (5′-GACTACNVGGGTATCTAATCC-3′), as described by Takahashi et al. [41]. For the 18S locus, the primer pair 515FY (5′-GTGYCAGCMGCCGCGGTA-3′) and NSR951 (5′-TTGGYRAATGCTTTCGC-3′) was adopted, following Lambert et al. [42]. Amplicons generated from the PCR reactions were visualized and quantified via electrophoresis on a 1.5× agarose gel and subsequently submitted to BMR Genomics (Padua, Italy) for Illumina next-generation sequencing using the MiSeq platform and 300 bp paired-end chemistry. The sequencing output consisted of quality-annotated reads in FASTQ format, representing the DNA signatures of the microorganisms present in the environmental extract. These data formed the basis for a downstream in silico taxonomic analysis.
Raw sequences were processed using a standardized pipeline within the Qiime2 environment (https://doi.org/10.1038/s41587-019-0209-9) [43]; sequences were inferred as ASVs (amplicon sequence variants). Raw reads were first imported and trimmed to remove primer sequences, and forward and reverse reads were merged. The resulting paired-end reads were subjected to a denoising algorithm to eliminate low-quality reads and chimeric sequences. Taxonomic assignment of high-quality reads [44] was carried out by comparison with the SILVA database version 138.1 (https://doi.org/10.1093/nar/gks1219) for 16S and 18S sequences [45], with the addition of a further annotation against a PR2 database (https://doi.org/10.1093/nar/gks1160) for 18S sequences [46]. Microbial community data were processed and visualized using RStudio (version 2023.09.1+494, running R version 4.3.1, https://www.r-project.org/). Phyloseq objects were constructed from ASV tables, taxonomic assignments, and metadata using the phyloseq package. Alpha and beta diversity indices were computed via vegan, while graphical outputs were generated through a combination of ggplot2, microbiome, and phyloseq functions. Abundance bar plots were created at phylum and genus level after normalization to relative abundance and filtering of low-prevalence taxa. Heatmaps were produced using pheatmap, with clustering based on Bray–Curtis dissimilarity matrices. Principal Coordinates Analysis (PCoA) was performed using ordinate from phyloseq with Bray–Curtis distance and plotted with ggplot2. Low-abundance taxa (<3%) and unassigned groups were merged into an ‘Other’ category to improve interpretability. All analyses were conducted in a reproducible RMarkdown environment, and scripts are available upon request for reproducibility and methodological transparency.
2.4. Assessment of Results of the Restoration of Room F
2.4.1. Colorimetric Assays
Colorimetric analyses were performed through diffuse reflectance spectroscopy to assess chromatic variations on mosaic areas affected by biological growth and subsequent cleaning treatments. Measurements were acquired with a MAYA 2000 Pro spectrophotometer (Ocean Insight, Oxford, UK) in Pump–Probe configuration, coupled to a halogen lamp simulating the CIE standard illuminant D65. The setup covered the visible to near-infrared range (400–1000 nm), allowing the detection of even subtle color changes. Before each acquisition, the system was calibrated using a white ceramic standard and a black trap to ensure reliable reflectance baselines. Spectral data and related colorimetric parameters were collected with OceanView 2.0 software (Ocean Optics, Orlando, FL, USA), which also enabled real-time monitoring and preliminary processing.
The chromatic coordinates were determined in the CIE 1976 Lab* space, where L* corresponds to lightness (0 = black, 100 = white), a* to the green–red axis (negative = green, positive = red), and b* to the blue–yellow axis (negative = blue, positive = yellow). Based on visual inspection of the mosaic surfaces and patinas, three representative color zones were identified (light green, dark green, and white). For each zone, five random measurements were collected, and mean values were calculated for each experimental condition. Variations in ΔL*, Δa*, Δb* and the overall color difference were then computed to quantify chromatic shifts associated with cleaning and biofilm removal.
2.4.2. Active Thermography
Thermal imaging was employed to evaluate surface heterogeneity and identify possible anomalies associated with material degradation, moisture accumulation, or detachment processes. The wall hosting the mosaic decorations was subdivided into six sections, each subjected to active thermographic inspection through controlled heating cycles. For each area, a 60 s thermal pulse was applied using a 1000 W halogen lamp with adjustable power output, set to approximately 250 W. The heating procedure was designed to produce a temperature rise as homogeneous as possible across the surface, reaching a maximum ΔT of about 6 °C.
Thermographic data were recorded with a FLIR X6580 sc camera (FLIR Systems Inc., Wilsonville, OR, USA) (cooled InSb detector, MWIR spectral range 3.5–5 µm, IFOV 0.3 mrad, NETD ~20 mK at 25 °C, FPA 640 × 512 pixels), equipped with a 50 mm focal lens. Image acquisition was carried out both before and after heating at a rate of 5 Hz, over a total duration of 150 s. The commercial software ResearchIR (https://www.flir.com/support-center/instruments2/researchir/, access on 7 November 2025), supplied with the camera, was employed for real-time temperature monitoring and parameter control.
The acquired sequences were processed to derive Maximum Thermal Gradient (MTG) and Thermal Recovery (TR) maps for the investigated regions. MTG maps were generated by evaluating the induced thermal variation ΔT for each pixel, according to:
where T0 is the pixel temperature at coordinates (i,j) in the frame acquired immediately before heating, and Tmax is the temperature in the frame collected immediately after heating.
ΔT(i,j) = Tmax(i,j) − T0(i,j)
TR maps were obtained following the methodology reported in earlier studies [47]. First, the MTG was computed for each pixel using Equation (1). Then, the temporal evolution of each pixel was analyzed to determine the time needed to recover 50% of the induced temperature increase. This 50% threshold was selected as it provided the widest differentiation of recovery times across the analyzed areas. Nonetheless, variations in the threshold within the 45–55% range did not significantly alter the overall results. All image sequences were processed using custom Matlab codes (R2019a, MathWorks). Data analysis was carried out on a workstation equipped with an Intel i7-4770 CPU@3.40 GHz (8 cores) and 32 GB of RAM.
3. Results
3.1. Preliminary Diagnostic Analyses
3.1.1. X-Ray Diffraction Spectroscopy
X-ray diffraction (XRD) analysis provided insight into the crystalline mineral phases present on the surface of the analyzed samples. In all cases, the dominant phase detected was calcite (CaCO3). This highlights the prevalence of a carbonate matrix in both substrata, regardless of environmental context. In samples from room F, especially FT1 and FT3, secondary peaks attributed to gypsum (CaSO4·2H2O) indicate surface sulfation. These features were particularly pronounced in FT3, suggesting an advanced state of transformation due to exposure to sulfur-rich conditions—possibly related to marine aerosol infiltration or anthropogenic pollutants. Traces of quartz (SiO2) were also present in FT2 and FT7, indicating either a component of the original plaster or external contamination from airborne dust. Notably, gypsum was not homogeneously distributed across all samples, suggesting a microclimatic control over salt crystallization. The presence and relative abundance of secondary minerals were correlated with morphological observations and FTIR results, especially in relation to sulfate formation and biological colonization.
Samples from Environment E displayed similar calcite signatures, but a more extensive and consistent presence of gypsum was observed, particularly in ET1–ET3. These samples presented well-defined diffraction peaks for both calcite and gypsum, with the latter often of greater intensity than in Environment F. This suggests prolonged or more stable conditions for sulfation and recrystallization in these more sheltered and less-illuminated settings. ET2 and ET3, both sampled from plaster substrates, showed a lack of quartz or other silicate phases, supporting the interpretation of homogeneous carbonate as subjected to prolonged chemical weathering. In contrast, ET5—taken from mosaic—showed minor quartz peaks, aligning with the SEM/EDS observation of increased silicon content and potential biogenic input.
3.1.2. FTIR Spectroscopy
The FTIR spectra collected from the mosaics and wall surfaces in room F show a complex matrix of mineral and organic components, with recurrent signatures of carbonate phases, silicates, and compounds originating from biological sources. A general trend of spectral heterogeneity is evident across the analyzed samples (FT1, FT2, FT3, FT7, FT8), reflecting the combined influence of lithological variability, biodeterioration processes, and secondary deposition phenomena.
All five samples exhibit strong absorption bands at ~1420–1440 cm−1 and ~875 cm−1, assigned to asymmetric and out-of-plane bending vibrations of carbonate ions, respectively, consistent with the presence of calcite. This component is likely linked both to the original mosaic tesserae and to carbonatic patinas. In FT1 and FT2, the first of which was collected from a visibly biodeteriorated mosaic fragment, the band at ~1100 cm−1 (Si–O stretching) and broad features between 1000 and 1040 cm−1 reveal a silicate-rich matrix, plausibly enhanced by the accumulation of airborne particulates and biogenic silica, as inferred from SEM data and optical observations of diatoms. Moreover, in FT2, a shoulder at ~1230 cm−1 may indicate the presence of sulfate species, possibly gypsum, supporting microanalytical evidence of calcium sulfates. In contrast, FT3, which shows a more uniform surface and lower biological coverage, is characterized by sharp calcite bands and minimal organic absorption. Nonetheless, a weak signal around 1650 cm−1 (amide I region) could suggest traces of proteinaceous substances, potentially related to past or present biological colonization or conservation treatments. FT7, sampled from a fragment with superficial green patina, shows broad bands at 3300–3400 cm−1 and 1630 cm−1, characteristic of hydroxyl and amide groups, respectively. These bands suggest the presence of biomolecules such as polysaccharides or proteins, consistent with the proliferation of green phototrophs observed microscopically. The most complex spectrum was recorded in FT8 (Figure 6), which combines signals of carbonate (1425, 875 cm−1), silicates (~1020 cm−1), sulfates (around 1130 cm−1), and multiple organic markers. Notably, FT8 exhibits a broad absorption between 1540 and 1650 cm−1, overlapping the amide II and I regions, and a pronounced OH stretch at ~3400 cm−1. These features confirm a substantial biofilm development, likely dominated by algal and bacterial exopolymers, in agreement with SEM/EDS evidence of extracellular matrices. A further signal at ~1730 cm−1 in FT8 could reflect the presence of esterified compounds or lipid oxidation products, pointing to either microbial activity or atmospheric deposition of organic pollutants.
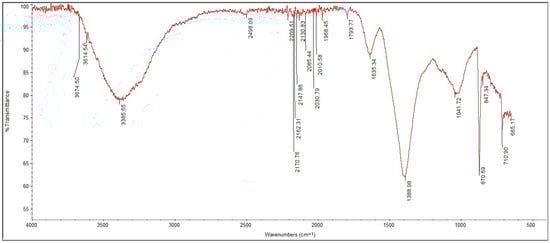
Figure 6.
FTIR spectrum of sample FT8, showing clear signals correlated to the presence of EPS, substantial to biofilm formation.
3.1.3. SEM/EDS Analysis
For the SEM/EDS analysis, measurement sites were selected based on the contrasts observed in both secondary and backscattered electron images. Secondary electron (SE) imaging was used to document fine surface morphology and microtextural features, while backscattered electron (BSE) imaging provided compositional contrast related to atomic number differences, helping to distinguish mineral phases and areas affected by chemical alteration. This combined approach allowed a more representative characterization of both morphological and compositional variability within each sample. EDS spectra were acquired as spot analyses (single-point measurements, ca. 1–2 µm beam diameter) on morphologically distinct micro-areas identified in the SEM images. The compositional data discussed in the text therefore refer to localized analyses and are representative of the specific features visible in the images.
The results revealed marked compositional and morphological contrasts across samples FT1, FT2, FT3, and FT7, each shaped by distinct degradation dynamics and micro-environmental influences (see Supplementary Materials). In FT1 (Figure 7), a mosaic fragment, the surface displayed a silicate-rich matrix with notable amounts of aluminum and calcium, along with sodium and potassium, likely derived from feldspathic components or salt intrusion. Morphologically, frustule-like structures suggested diatom colonization, pointing to a biological contribution in the alteration process. In contrast, other areas of the same sample revealed signs of chemical transformation, such as sulfur and iron, indicating early sulfation and possible contamination by airborne particulates.
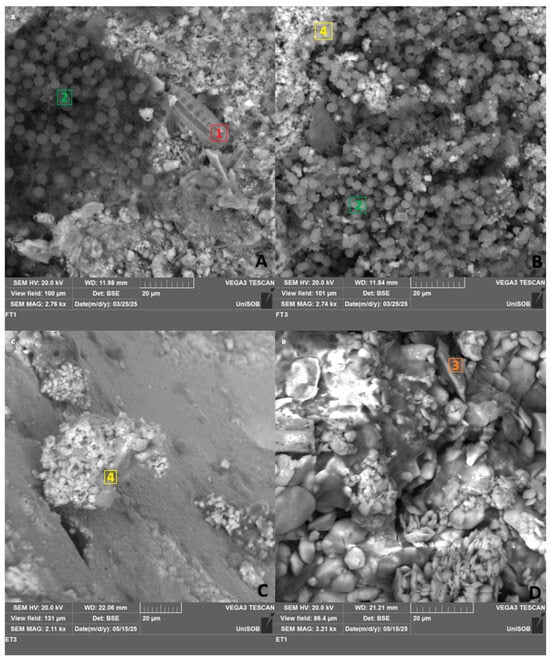
Figure 7.
SEM images showing the diverse degradation phenomena between room F ((A) FT1; (B) FT3) and room E ((C) ET3; (D) ET1). In 1 a diatom siliceous frustule is visible. In 2, biofilm-forming coccoid algal communities are shown, and 3 indicates gypsum concretions, with the highest relative concentrations in both Calcium and Sulfur. Finally, 4 indicates a calcium carbonate formation, extremely common in all samples.
FT2, sampled from plaster, retained a strong silicate imprint. In some areas, abundant silicon and iron were accompanied by traces of chlorine, consistent with salt-related stress and a favorable environment for halophilic microorganisms. Clear evidence of inorganic degradation was shown in FT3 (Figure 7). Salt accumulation and sulfation were apparent, with exceptionally high sodium and sulfur levels, coupled with elevated calcium. The low silicon and absence of biological morphologies suggested a dominantly chemical weathering process, likely influenced by moisture and evaporation. FT7 proved the most morphologically and chemically heterogeneous. Portions of the sample displayed high silicon and diatom-related structures, indicating active biological colonization on a siliceous substrate. Other areas were increasingly dominated by calcium and sulfur, with patterns pointing to progressive gypsum formation. In the most altered zones, sulfur content peaked and the substrate appeared overwhelmed by chemical crystallization processes, particularly on carbonatic phases. Taken together, FT1 and FT7 retained clear traces of biological activity—especially in zones rich in silicon and with preserved frustule morphologies—while FT2’s and FT3’s decay was more the product of salt crystallization and sulfates.
In contrast, samples from Environment E followed different trends, reflecting their carbonate-rich nature, distinctive exposure conditions and slightly different biological communities. ET1, a mosaic sample, showed a largely calcitic substrate with variable salt and sulfate deposition (Figure 7). While some zones retained minimal contaminants, others revealed more advanced sulfation, likely linked to marine aerosol input or persistent humidity. Sodium and chlorine were frequently detected, suggesting widespread salt crystallization processes. ET2, derived from plaster, exhibited more severe chemical degradation. The matrix was heavily infiltrated by salts and sulfates, and certain areas showed anomalously high fluorine content, hinting at contamination from restoration materials or industrial pollutants. A more homogeneous profile was shown by ET3, dominated by calcium carbonate (Figure 7). The sample appeared chemically stable, although minor sulfur and fluorine were detected in one case, possibly resulting from light environmental exposure or superficial treatments. ET4, also a plaster sample, revealed a slight increase in silicate content across multiple areas, potentially linked to clay inclusions or incipient biological colonization. The mineral composition suggested the possibility of early-stage biogenic input or weathering-related silica accumulation. Another mosaic fragment, ET5 appeared particularly heterogeneous. Some areas displayed a mixed matrix of carbonates, silicates, and salts, with surface morphologies consistent with the presence of diatomaceous biofilms. In contrast, other parts of the same sample were dominated by extensive sulfation, with gypsum crusts obscuring any potential biological features. This divergence within the samples likely reflects differential exposure to light, moisture, or salt accumulation. The noticeable difference in silicon between samples ET1, ET2,ET3 and ET4, ET5 along the vertical and light gradient seems noteworthy, as it might not only be caused by the diverse microclimate-dependent weathering conditions, but also by a much consistent presence of diatoms. Room E—and especially the samples from ET1 through ET3—were characterized by a more uniform carbonate substrate and a predominance of chemically driven degradation, while ET4 and ET5 showed signs of increased silicate input and biological potential, as corroborated by macroscopic observations. This vertical gradient, from chemically weathered lower samples to biologically active upper layers, highlights the intricate interplay between material composition, environmental exposure, and microclimatic conditions in the evolution of surface deterioration processes.
3.2. Taxonomic Annotation of Strains
3.2.1. Prokaryotic Communities
The analysis of the 16S rRNA gene sequencing data (which can be found in the BioProject: PRJNA1298528) revealed a diverse and spatially structured prokaryotic community across the sampled surfaces. The abundance plot of prokaryotic phyla (Figure 8) highlights distinct compositional differences between samples, particularly when grouped by room (F vs. E). Samples from room F, generally characterized by greater light exposure and consistent surface salinity, exhibited a slightly higher relative abundance of halophilic and halotolerant genera, including Halococcus, Halomarina, Halobacterium, and Halobaculum, most of which belong to the family Halobacteriaceae (order Halobacteriales, class Halobacteria). Some of these taxa were only marginally represented in room E, suggesting an environmental filtering effect related to differential communities and, possibly, irradiance and exposure to microclimate. In addition, the genus Rubrobacter was consistently detected in both environments but showed higher normalized abundance in room F, aligning with its known tolerance to desiccation, radiation, and high salt concentrations. Marinococcus and Salinibacter were also found almost exclusively in room F samples, strengthening the association with other halophile communities of similar microhabitats. Conversely, room E displayed a less diverse prokaryotic community, with greater representation of genera such as Sphingomonas, Methylobacterium, and Pseudomonas, which are typically associated with less extreme environmental conditions and may benefit from residual organic matter or moderate humidity. Some room E samples also hosted Acidiphilium and Paracoccus, suggestive of occasional metabolic versatility and potential interactions with sulfur or nitrogen compounds.
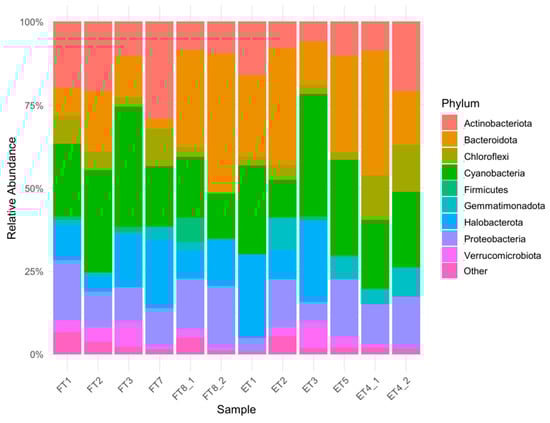
Figure 8.
Abundance plot of prokaryotic phyla (abundance > 3%). Groups under 3% abundance were classified as “Other”.
Archaea are almost exclusively found in samples from room F, where the phyla Euryarchaeota dominates, mostly comprising Halobacteria. In contrast, bacterial phyla such as Proteobacteria and Actinobacteriota are more uniformly distributed, though their genus-level composition varies by sample. Notably, Bacteroidota and Firmicutes also showed an increase in room F, often represented by halophilic members such as Salinibacter and Bacillus halophilus-like organisms. Cyanobacteria were also highly represented in both rooms, with genera of filamentous phototrophs such as Nodularia and Nodosilinea showing high abundance even at lower irradiance. The Principal Coordinates Analysis (PCoA) based on beta diversity metrics (Figure 9) reinforces the separation between the two environments. Samples cluster according to room designation along the first coordinate, suggesting that light exposure, salinity, and microclimatic differences are primary drivers of community differentiation among prokaryotes. Substrate type (plaster, mosaic) does not appear to play a dominant role in this separation, as samples from different materials but the same room tend to cluster together. Nonetheless, some intra-room variability was observed, potentially reflecting microhabitat differences such as moisture retention or porosity.
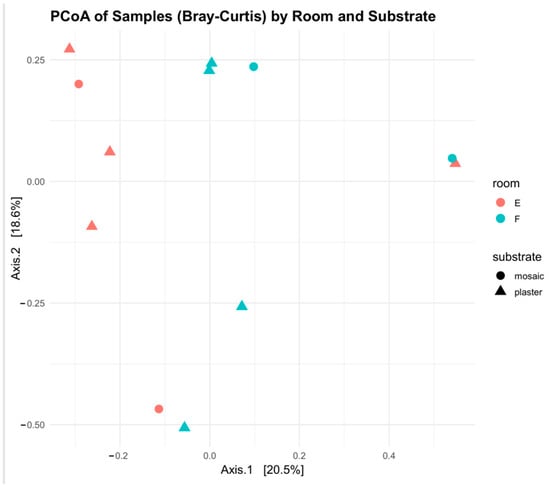
Figure 9.
Principal Coordinate Analysis for prokaryotic diversity in samples, plotted with room and substrate coordinates.
Overall, the data indicate that room F supports a distinctly halophilic prokaryotic community, heavily enriched in salt-adapted Archaea, while room E harbors a more mesophilic bacterial assemblage, with a wider ecological tolerance and potential for metabolic plasticity. The dominance of Halobacteriaceae in room F samples may also suggest their involvement in salt efflorescence processes or in the development of colored biofilms, potentially contributing to aesthetic or physical alterations of the substrate.
3.2.2. Eukaryotic Communities
The eukaryotic community composition inferred from 18S rRNA gene sequencing (which can also be found in the BioProject: PRJNA1298528) showed a marked dominance of phototrophic taxa and microfungi, with clear differences between the two environments (Room F and Room E) and more subtle variations between substrates. At genus level, the prevalence of green algae such as Chlorella, the chlorella-like Jenufa, Myrmecia, and Trebouxia in multiple samples, with high relative abundance particularly in Room F, suggests a preference for more exposed conditions. In contrast, samples from Room E, especially those from shaded or internal surfaces, showed increased presence of non-photosynthetic groups, including cercozoans (e.g., Paracercomonas) and ciliates such as Tetrahymena. Fungal taxa were also prominent, notably representatives of Ascomycota (e.g., Cladosporium, Alternaria) and Basidiomycota, which were generally more abundant in Room E, possibly reflecting greater humidity and lower light exposure. Some genera, such as Cladosporium, were consistently detected across most samples, suggesting a broad ecological tolerance and potential involvement in biodeterioration processes. Notably, Trebouxia, a common lichen photobiont, appeared in several samples, hinting at lichenization phenomena in situ, also supported by macroscopic observations. At higher taxonomic levels (Figure 10), the abundance barplot confirmed the predominance of Chlorophyta among photosynthetic eukaryotes, with Ascomycota and Cercozoa as the leading heterotrophic phyla. Among the Chlorophyta present, the halophile genus Picocystis salinarum was also one of the most predominant, highly abundant in samples ET4 and ET5 from Room E and in samples FT2-FT3 and FT7 from Room F, confirming for both rooms the biological community’s adaptation to saline environments. The presence of Ciliophora was particularly evident in certain Room E samples, which may indicate water retention and high organic load in micro-niches. Samples from plaster substrates generally exhibited greater taxonomic richness than those from mosaic, although the substrate effect appeared secondary compared to the environmental (room) effect.
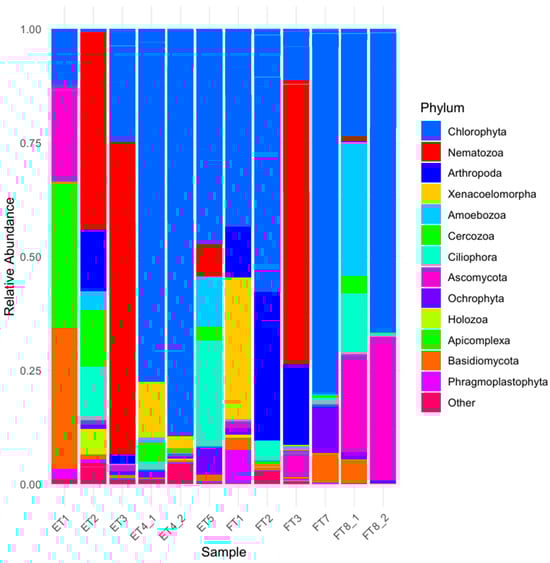
Figure 10.
Abundance plot of eukaryotic phyla (abundance > 3%). Groups under 3% abundance were classified as “Other”.
Principal Coordinates Analysis (PCoA) based on Bray–Curtis dissimilarities (Figure 11) did not support the separation of communities by room, with most Room E samples clustering together with the ones from Room F. Substrate-based separation was also not especially pronounced, even though it highlights a clearer pattern of distinction for some of the samples. Although not transpiring clearly from the plot, distances of Room E samples were likely driven by the consistent presence of fungi and protists over phototrophs, while Room F samples were characterized by dominant green algae. This pattern aligns with the microclimatic differences between the two areas, including variations in light availability, ventilation, and possibly salinity. Overall, the 18S dataset reveals a dual ecological structure: phototrophic eukaryotes dominate in the brighter, more external Room F, while fungi and heterotrophic protists are more prevalent in the darker, enclosed Room E. This trend complements the observations from prokaryotic communities (16S) and provides further evidence of niche differentiation among biodeteriogenic taxa on cultural heritage substrates.
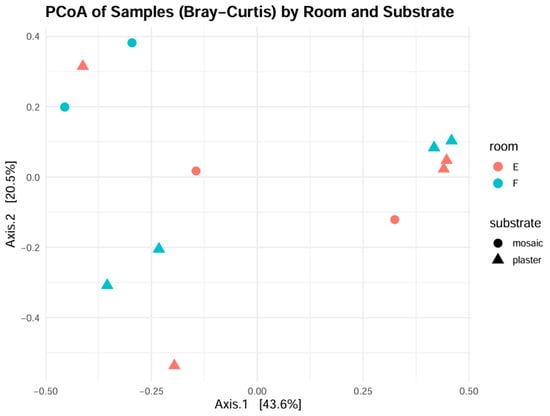
Figure 11.
Principal Coordinate Analysis for eukaryotic diversity in samples, plotted with room and substrate coordinates.
3.3. Assessment of Results of the Restoration of Room F
3.3.1. Colorimetric Assays
Colorimetric analysis was performed to quantitatively assess the chromatic variations induced by the treatments applied to the mosaics. The table below (Table 2) reports the data collected from three distinct color areas of the same mosaic, measured before and after the intervention. Based on visual observation in the pre-restoration phase, the selected areas corresponded to white, light green, and dark green portions. The green coloration is mainly attributable to the presence of biological patinas, while the white area was chosen as a reference. The table summarizes the values of the ΔL*, Δa*, Δb*, and ΔE calculated from the two measurement sets.
Table 2.
Values of ΔL, Δa, Δb*, and ΔE calculated from measurements performed before and after restoration on three selected mosaic areas.
The results indicate that the greatest color changes occurred in the areas initially affected by biological patinas. Specifically, the dark green area exhibited the largest variations in ΔL*, Δa*, and Δb*, with a total color difference of ΔE = 39.99, reflecting a substantial increase in lightness and a reduction in green intensity after restoration. The light green area also showed significant changes, primarily due to a shift toward higher brightness and reduced green chroma, accompanied by a notable increase in the yellow–blue component. In contrast, the white reference area displayed only minor variations, indicating that the restoration had a limited impact on areas initially free of patinas.
By adopting a threshold value of ΔE* = 3.5, above which a clear color difference can be perceived [48], it can be observed that all three analyzed areas exceed this limit. Specifically, the difference is only slightly above the threshold for the white reference area, whereas it is markedly higher for the two regions that were initially more affected by biological patinas. Overall, these results quantitatively confirm the effectiveness of the cleaning treatment in reducing the visual impact of biological patinas, particularly in the green-colored regions, while preserving the original appearance of areas that were initially unaltered.
3.3.2. Active Thermography
Active thermography was performed to investigate the surface heterogeneity of the mosaics and detect possible material degradation, moisture accumulation, or detachment areas. The analysis was useful for comparing their state before and after restoration.
As an example, the following reports the analysis carried out on one of the investigated mosaic surfaces. The area was divided into six sections, and the thermographic measurement protocol described in 2.4.2 was applied to each of them. Figure 12 shows the visible images together with the corresponding MTG and TR maps obtained before (PRE) and after (POST) restoration, covering the six analyzed mosaic areas.
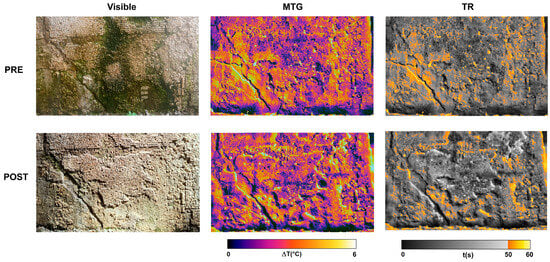
Figure 12.
Thermographic analysis carried out on one of the investigated mosaic surfaces Pre- and Post-restoration: Visible images (first column), MTG maps (second column), and TR maps (third column).
Both MTG maps highlight thermal alterations that reveal the pronounced heterogeneity of the investigated mosaic wall. In the pre-restoration map, several cracks affecting the mosaic are clearly visible, partially reduced in number in the post-restoration map as a result of the intervention. In both maps, widespread moisture (violet areas) can be observed affecting the measured thermal distribution, also influenced by the presence of biological patinas on the wall, which were subsequently almost completely removed. Nevertheless, both maps clearly show that the lower part of the wall, in contact with the ground, is strongly affected by rising damp phenomena. This moisture is likely the primary cause of tesserae detachment, as it progressively weakens their adhesion, leading over time to the loss of some mosaic sections and compromising the stability of many of the remaining tesserae.
The TR maps highlight in orange–yellow the mosaic areas with recovery times exceeding 50 s. These zones can be interpreted as regions where the tesserae are partially detached or where their adhesion is at least locally compromised. Such areas, associated with longer recovery times, can therefore be considered “suspicious” in terms of detachment risk. This behavior is explained by the presence of air gaps within the detachment, which act as thermal insulators, slowing heat dissipation and consequently increasing the recovery times. A comparison between the two maps clearly shows that, after restoration, these critical zones were markedly reduced, particularly in the regions containing tesserae, as a direct result of the consolidation treatment.
Thermographic investigations thus enabled the assessment of the structural condition of the mosaic prior to restoration, providing restorers with both an overall picture of its state of conservation and detailed insights into the most critical areas. Moreover, they allowed verification of the mosaic’s condition after restoration, highlighting the areas where the intervention was fully effective as well as those where adhesion was only partially restored.
4. Discussion
The combined application of SEM/EDS, FTIR spectroscopy, and high-throughput metabarcoding (16S and 18S rRNA genes) has enabled a multifaceted characterization of the biodeterioration and inorganic degradation processes affecting mineral-based substrates in rooms F and E. The two investigated rooms’ surfaces, featuring plasters and mosaic pieces, are similarly afflicted by saline crystallization phenomena and, as a consequence, they show evident signs of colonization by both prokaryotic and eukaryotic halophile and halotolerant microorganisms, which result among the largest contributors to the biological diversity on the substrates [49]. SEM observations and EDS analyses have highlighted a homogenous trend in the presence of saline efflorescences and concretions in both rooms: EDS spectra show significant enrichment in Na, Mg, Cl, and S in many of the samples, particularly in the case of ET2 and FT3, showing the largest normalized percentage masses for these elements. In Room F samples (particularly FT1 and FT3), gypsum was also detected, especially in FT3, suggesting advanced sulfation likely due to sulfur-rich exposure such as marine aerosol or anthropogenic pollutants. Quartz (SiO2) traces appeared in FT2 and FT7, implying either original plaster components or external dust contamination. Meanwhile, Environment E samples showed a consistently strong presence of gypsum—often more intense than in Room F—suggesting prolonged sulfation processes, particularly in shaded, less illuminated areas (ET1–ET3). Plaster samples ET2 and ET3 lacked silicates, supporting their chemically weathered carbonate nature, whereas ET5 (mosaic) contained minor quartz, indicating potential biogenic inputs (e.g., diatoms).
These elements are spatially colocated with microtextural features on SEM images, consistent with salt efflorescence, deliquescence, and recrystallization phenomena. The presence of high sulfate concentrations in particular suggests partial transformation of calcium carbonate substrates into gypsum, a process supported by FTIR signals around 1100 and 1620 cm−1 in FT1 and FT8.2 [50]. Prior research robustly supports the observation that carbonate dissolution and sulfate crystallization occur under saline or polluted environments, particularly in maritime and urban contexts. For instance, Camuffo et al. [51] document the transformation of calcium carbonate substrates into gypsum resulting from interaction with atmospheric sulfur dioxide and aerosol particulates, leading to black crust formation on calcareous stone in polluted urban settings [52]. FT8 displayed the most complex spectra, combining carbonate, silicate, sulfate, extensive organic markers (amide I and II), and possible lipid oxidation products—consistent with biofilm and EPS development. The lipid-like spectral features observed in FT8 could well reflect such deposition of organic pollutants interacting with surface minerals [53]. Lastly, the presence of lipid-like or organic pollutants captured in FTIR spectra echoes deterioration processes linked to atmospheric contamination. Reviews on atmospheric decay of calcareous stone explain how pollutants (especially acidic gases and carbonaceous aerosols) contribute to gypsum crust formation enriched with organic and carbonaceous materials.
The analysis confirmed also strong carbonate absorption bands (1420–1440 cm−1 and 875 cm−1), with silicate and organic signatures in biodeteriorated samples like FT1 and FT2. FT3 showed sharp calcite bands with minimal organics, though traces of amide I suggest possible protein residues. FT7 exhibited hydroxyl and amide bands indicative of biomolecules (e.g., polysaccharides, proteins).
However, in spite of the similar trends highlighted by both EDS and metabarcoding, a slight environmental gradient between the two environments is present, which in turn shifts microbial communities’ composition, especially in the case of prokaryotic microflora (Figure 10).
The vertical gradient of biological inputs in Environment E implies that microclimatic factors (e.g., light, moisture, airflow) mediate the balance between chemical degradation and bio-colonization. Biofilm formation, evidenced in FT7 and FT8, suggests that microbial communities (phototrophs and heterotrophs) are not only responding to surface chemistry but may also accelerate weathering through EPS-mediated salt retention, localized pH changes, or biochemical interactions [54]. For example, studies on thin-coat mineral plasters show that microbial biofilms not only alter porosity but can also trap moisture and dissolved ions, contributing to structural degradation. The localization of halophilic communities in Room F—observed via 16S and 18S sequencing—could be driving or responding to these mineral transformations, particularly in salt-laden micro-niches.
SEM/EDS revealed marked heterogeneity. FT1 showed silicate-rich matrices and diatom-like structures alongside evidence of early sulfation. FT2 featured silicate and chlorine consistent with salt stress. In FT3, chemical weathering dominated, with high sodium and sulfur, low silicon, and absence of bio-morphologies. FT7 combined zones of biological colonization and significant gypsum formation. Environment E samples (ET1–ET5) displayed variable salt and sulfate deposition, fluorine contamination (ET2), stability in ET3, silicate/clay traces in ET4, and heterogeneous mix including biofilm indicators in ET5, suggesting a vertical gradient influenced by microclimate.
Our results suggest that sheltered, less-illuminated conditions like those in Environment E promote the presence of stable gypsum. This formation is consistent with observations that poor air circulation and limited light exposure facilitate prolonged moisture retention, encouraging continued sulfate crystallization—factors implicitly recognized in broader studies of stone deterioration in historically enclosed environments.
The presence of microbial communities adapted to high osmotic stress is strongly supported by metabarcoding data. Several samples from room F, especially FT1, FT7, and FT8.2, showed high relative abundances of halophilic and halotolerant archaeal and bacterial taxa, including members of Halobacteria, Salinibacter, Rubrobacter, and Chloroflexota. These microorganisms are known for their resilience under hypersaline and UV-exposed environments [55,56], and their prevalence corresponds well with the chemical signatures of salts and polysaccharidic matrices detected by FTIR. Samples from room E seem to mostly show a similar trend with regard to the levels of soluble salts in the EDS profiles. These samples, although featuring a slightly lower variation in some of the halotolerant taxa, are associated with a similarly heterogeneous microbial diversity, with communities showing a tendency to switch from heterotrophy (ET1-2-3) to dominant autotrophy (ET4-5) along the vertical gradient. The abundant presence of the green algal genus Picocystis seems to also highlight the selective pressure of salt depositions on the samples’ biodiversity; these populations are consistently present in both of the investigated rooms, clearly colonizing the wall sections better exposed to sunlight: this is the case for the samples collected on the western wall of Room F (FT2-3-7) and of samples ET4-5 in room E, which are both positioned on the northern wall and high enough to be consistently exposed to sunlight [57].
In Environment F, restoration was carried out to remove biological patinas and consolidate weakened plaster. Colonized surfaces were treated with 5% Biotin T under occlusion, followed by rinsing with deionized water. In friable areas (FT2 and FT7), nanolime in isopropanol suspension was applied, with consolidation effectiveness assessed through qualitative tests. The effectiveness of these interventions was assessed, as previously described, through non-invasive colorimetric analyses and active thermography. Colorimetry results quantitatively confirm the effectiveness of the cleaning treatment in reducing the visual impact of biological patinas, particularly in the green-colored regions, while preserving the original appearance of areas that were initially unaltered. Active thermography served as a valuable tool for assessing both the pre- and post-restoration condition of the mosaic. It offered a global overview of structural integrity while pinpointing areas of detachment or incomplete adhesion, thereby allowing an objective evaluation of the intervention’s effectiveness.
The comparative analysis also highlights the complementarity of the different analytical methods. EDS allows quantification of key ionic species that drive deterioration, but only when cross-referenced with FTIR (for organic markers) and DNA-based profiling (for community structure) can we fully interpret the implications. For instance, the co-localization of sulfates (EDS) with FTIR bands for EPS and the detection of Halobacteria reinforce the view that biological and abiotic processes are synergistically involved in the degradation cycle. From a conservation perspective, these data suggest that interventions should target both physical and biological deterioration pathways. In areas like FT1 and FT8.2, desalinization alone would not have sufficed without the disruption of microbial biofilms. Conversely, in room E, monitoring algal recolonization and limiting moisture retention could be more effective. The high specificity of metabarcoding further allows for tracking resistant or recurrent taxa, informing long-term preservation strategies and future biocontrol experiments. The integrated interpretation of SEM/EDS, FTIR, and metabarcoding results confirms that biodeterioration processes are not merely additive but synergistic. Salt accumulation fosters halophilic microbial growth, which in turn secretes biofilm matrices that enhance salt retention and substrate alteration [58].
5. Conclusions
In summary, our multimodal analysis, enabling coherent cross-validation across XRD, FTIR, and SEM/EDS data and supporting both mineralogical and biological interpretations, demonstrates how carbonate substrates undergo both chemical and biological transformations that are tightly controlled by micro-environmental conditions. Understanding these mechanisms is essential for devising targeted conservation strategies that account for both mineral stability and microbial colonization dynamics. This positive feedback loop is modulated by environmental parameters such as light and humidity, which shape the nature and intensity of microbial colonization. Such cross-validated insights strengthen the case for multidisciplinary diagnostic protocols in cultural heritage conservation.
Further exploration of the interaction between biofilms and inorganic weathering, especially in transition zones between chemical and biological dominance, would enrich conservation strategies. Finally, longer-term monitoring of treated and untreated surfaces could help evaluate the efficacy of conservation treatments in preventing gypsum formation and biofilm development.
Supplementary Materials
The following supporting information can be downloaded at: https://www.mdpi.com/article/10.3390/heritage8110470/s1, SM1 reports all normalized mass percentages from EDS analyses.
Author Contributions
Conceptualization, P.C. (Paola Cennamo) and A.D.R.; methodology, G.T., M.R., A.D.M. and A.D.R.; software, A.D.R.,M.R. and A.D.M.; investigation, A.D.R.; writing—original draft preparation, A.D.R.; supervision, P.R., P.C. (Paolo Caputo) and M.B.; project administration, P.R.; funding acquisition, P.R. and P.C. (Paola Cennamo). All authors have read and agreed to the published version of the manuscript.
Funding
This research was funded by (ITA) Project PE 0000020 CHANGES—CUP B53C22003780006 NRP Mission 4 Component 2 Investment 1.3, Funded by the European Union—NextGenerationEU.
Data Availability Statement
Raw sequencing data for 16S and 18S markers’ analyses have been deposited in the NCBI Sequence Read Archive (SRA) under BioProject accession number PRJNA1298528.
Acknowledgments
The authors acknowledge Enrico Gallocchio, archaeological officer of the Archaeological Park of Baia, for the permissions to access the area to conduct the activities of this research. The authors would also like to acknowledge Federica Esposito and Maria Rosaria Vigorito for the support, the planning and execution of the restoration interventions inside Room F.
Conflicts of Interest
The authors declare no conflict of interest.
References
- Yadav, S.; Purchase, D. Biodeterioration of cultural heritage monuments: A review of their deterioration mechanisms and conservation. Int. Biodeterior. Biodegrad. 2025, 201, 106066. [Google Scholar] [CrossRef]
- Warscheid, T.; Braams, J. Biodeterioration of stone: A review. Int. Biodeterior. Biodegrad. 2000, 46, 343–368. [Google Scholar] [CrossRef]
- Gaylarde, C.C.; Baptista-Neto, J.A. Microbiologically Induced Aesthetic and Structural Changes to Dimension Stone. Npj Mater. Degrad. 2021, 5, 33. [Google Scholar] [CrossRef]
- May, E. Stone biodeterioration. In Cultural Heritage Microbiology: Fundamental Studies in Conservation Science; Mitchell, R., McNamara, C.J., Eds.; ASM Press: Washington, DC, USA, 2021; pp. 221–230. [Google Scholar]
- Gustavs, L.; Gors, M.; Karsten, U. Polyol patterns in biofilm-forming aeroterrestrial green algae (Trebouxiophyceae, Chlorophyta). J. Phycol. 2011, 47, 533–537. [Google Scholar] [CrossRef] [PubMed]
- Nowicka-Krawczyk, P.; Komar, M.; Gutarowska, B. Towards understanding the link between the deterioration of building materials and the nature of aerophytic green algae. Sci. Total Environ. 2022, 802, 149856. [Google Scholar] [CrossRef]
- Zhang, G.; Gong, C.; Gu, J.; Katayama, Y.; Someya, T.; Gu, J.D. Biochemical reactions and mechanisms involved in the biodeterioration of stone world cultural heritage under the tropical climate conditions. Int. Biodeterior. Biodegrad. 2019, 143, 104723. [Google Scholar] [CrossRef]
- Komar, M.; Nowicka-Krawczyk, P.; Ruman, T.; Nizioł, J.; Dudek, M.; Gutarowska, B. Biodeterioration potential of algae on building materials-Model study. Int. Biodeterior. Biodegrad. 2023, 180, 105593. [Google Scholar] [CrossRef]
- Sand, W.; Bock, E. Biodeterioration of mineral materials by microorganisms—Biogenic sulfuric and nitric acid corrosion of concrete and natural stone. Geomicrobiol J. 1991, 9, 129–138. [Google Scholar] [CrossRef]
- Gaylarde, C.; Ribas Silva, M.; Warscheid, T. Microbial impact on building materials: An overview. Mater. Struct. 2003, 36, 342–352. [Google Scholar] [CrossRef]
- Macedo, M.F.; Miller, A.Z.; Dionísio, A.; Saiz-Jimenez, C. Biodiversity of cyanobacteria and green algae on monuments in the Mediterranean Basin: An overview. Microbiology 2009, 155, 3476–3490. [Google Scholar] [CrossRef]
- Cutler, N.; Viles, H. Eukaryotic microorganisms and stone biodeterioration. Geomicrobiol. J. 2010, 27, 630–646. [Google Scholar] [CrossRef]
- Tiano, P. Biodeterioration of stone monuments: A worldwide issue. Open Conf. Proceed. J. 2016, 7, 29–38. [Google Scholar] [CrossRef]
- Wang, F.; Huang, J.; Zhou, Q. Water-salt transport modeling and sulfate erosion mechanisms in cultural heritage under microclimate. J. Build. Eng. 2024, 98, 111393. [Google Scholar] [CrossRef]
- Albertano, P. Cyanobacterial biofilms in monuments and caves. In Ecology of Cyanobacteria II: Their Diversity in Space and Time; Springer: Dordrecht, The Netherlands, 2012; pp. 317–343. [Google Scholar]
- Rindi, F. Diversity, ecology and distribution of green algae and Cyanobacteria in urban habitats. In Algae and Cyanobacteria in Extreme Environments; Springer: Dordrecht, The Netherlands, 2007; pp. 583–597. [Google Scholar]
- Barberousse, H.; Lombardo, R.J.; Tell, G.; Couté, A. Factors involved in the colonization of building facades by algae and cyanobacteria in France. Biofouling 2006, 22, 69–77. [Google Scholar] [CrossRef] [PubMed]
- Ortega-Calvo, J.J.; Arino, X.; Hernandez-Marine, M.; Saiz Jimenez, C. Factors affecting the weathering and colonization of monuments by phototrophic microorganisms. Sci. Total Environ. 1995, 167, 329–341. [Google Scholar] [CrossRef]
- Crispim, C.A.; Gaylarde, C.C. Cyanobacteria and biodeterioration of cultural heritage: A review. Microb. Ecol. 2024, 49, 1–9. [Google Scholar] [CrossRef]
- Caneva, G.; Nugari, M.P.; Salvadori, O. Plant Biology for Cultural Heritage: Biodeterioration and Conservation; Getty Publications: Los Angeles, CA, USA, 2008. [Google Scholar]
- Cennamo, P.; De Rosa, A.; Scielzo, R.; Rippa, M.; Trojsi, G.; Chianese, E. Diagnostic investigation of the wall paints conservative state in a hypogeal room of the archaeological park of Baia (Italy). Acta IMEKO 2024, 13, 1–8. [Google Scholar] [CrossRef]
- De Rosa, A.; Cennamo, P.; Saltarelli, C.; Trojsi, G.; Rimauro, J.; Vigorito, M.R.; Chianese, E. The Effects of Urban Pollution on the “Gesù Nuovo” Façade (Naples, Italy): A Diagnostic Overview. Atmosphere 2025, 16, 68. [Google Scholar] [CrossRef]
- Camuffo, D. Microclimate for Cultural Heritage: Measurement, Risk Assessment, Conservation, Restoration, and Maintenance of Indoor and Outdoor Monuments; Elsevier: Amsterdam, The Netherlands, 2019. [Google Scholar]
- Paoloni, S.; Orazi, N.; Zammit, U.; Bison, P.; Mercuri, F. A note on the early thermographic approaches for the investigation of the Cultural Heritage. Quant. InfraRed Thermogr. J. 2024, 21, 408–420. [Google Scholar] [CrossRef]
- Squarciafico, C.; Salatino, G.; La Russa, M.F.; Peluso, T.; Basile, L.; Barbagallo, F.S.; Coppola, M.; Macchia, A. New chemical systems for the removal of calcareous encrustations on monumental fountains: A case study of the Nymphaeum of Cerriglio. Heritage 2023, 6, 6358–6376. [Google Scholar] [CrossRef]
- Silva, I.; Dias, L.; Salvador, C.; Miller, A.Z.; Candeias, A.; Caldeira, A.T. Microbial induced stone discoloration in alcobaça monastery: A comprehensive study. J. Cult. Herit. 2024, 67, 248–257. [Google Scholar] [CrossRef]
- Ferrari, C.; Santunione, G.; Libbra, A.; Muscio, A.; Sgarbi, E.; Siligardi, C.; Barozzi, G.S. Review on the influence of biological deterioration on the surface properties of building materials: Organisms, materials, and methods. Int. J. Des. Nat. Ecodyn. 2025, 10, 21–39. [Google Scholar] [CrossRef]
- Xiong, S.; Xu, Y.; Zhou, J. Deterioration of Masonry Cultural Relics by Microbes: Current Remediation Strategies and Prospects. Environ. Microbiol. 2025, 27, e70142. [Google Scholar] [CrossRef] [PubMed]
- Cennamo, P.; Scielzo, R.; Rippa, M.; Trojsi, G.; Carfagna, S.; Chianese, E. UV-C Irradiation and Essential-Oils-Based Product as Tools to Reduce Biodeteriorates on the Wall Paints of the Archeological Site of Baia (Italy). Coatings 2023, 13, 1034. [Google Scholar] [CrossRef]
- Nowicka-Krawczyk, P.; Zelazna-Wieczorek, J.; Kozlecki, T. Silver nanoparticles as a control agent against facades coated by aerial algae: A model study of Apatococcus lobatus (green algae). PLoS ONE 2017, 12, e0183276. [Google Scholar] [CrossRef]
- Liu, X.; Qian, Y.; Wang, Y.; Wu, F.; Wang, W.; Gu, J.D. Innovative approaches for the processes involved in microbial biodeterioration of cultural heritage materials. Curr. Opin. Biotechnol. 2022, 75, 102716. [Google Scholar] [CrossRef]
- Astolfi, M.L. Advances in analytical strategies to study cultural heritage samples. Molecules 2023, 28, 6423. [Google Scholar] [CrossRef]
- Costantini, I.; Aramendia, J.; Etxebarria, I.; de la Fuente, I.V.; Castro, K.; Sanchez-Pinto, I.; Pérez, L.; Yécora, B.; Sanz, M.; Prieto-Taboada, N.; et al. Raman spectroscopy assisted by other analytical techniques to identify the most deteriorated carbonate-stones to be consolidated in two monuments of Vitoria-Gasteiz (Spain). J. Raman Spectrosc. 2024, 55, 1309–1321. [Google Scholar] [CrossRef]
- Magdy, M. X-ray techniques dedicated to materials characterization in cultural heritage. Chem. Sel. 2023, 8, e202301306. [Google Scholar] [CrossRef]
- Rippa, M.; Pagliarulo, V.; Lanzillo, A.; Grilli, M.; Fatigati, G.; Rossi, P.; Cennamo, P.; Trojsi, G.; Ferraro, P.; Mormile, P. Active thermography for non-invasive inspection of an artwork on poplar panel: Novel approach using principal component thermography and absolute thermal contrast. J. Nondestruct. Eval. 2021, 40, 21. [Google Scholar] [CrossRef]
- Saltarelli, C.; Rippa, M.; Pagliarulo, V.; Vigorito, M.R.; Paturzo, M. The Heritage Building Information Modelling System for non-destructive optical techniques: The case study of the restoration of a Marble sculpture on the façade of the Gesù Nuovo Church in Naples. Acta IMEKO 2025, 14, 1–8. [Google Scholar] [CrossRef]
- López-Miras, M.D.M.; Pinar, G.; Romero-Noguera, J.; Bolívar-Galiano, F.; Ettenauer, J.D.; Sterflinger, K.; Martín-Sánchez, I. Microbial communities adhering to the obverse and reverse sides of an oil painting on canvas: Identification and evaluation of their biodegradative potential. Aerobiology 2023, 29, 301–314. [Google Scholar] [CrossRef]
- Gutarowska, B. The use of-omics tools for assessing biodeterioration of cultural heritage: A review. J. Cult. Herit. 2020, 45, 351–361. [Google Scholar]
- Pyzik, A.; Ciuchcinski, K.; Dziurzynski, M.; Dziewit, L. The bad and the good—Microorganisms in cultural heritage environments—An update on biodeterioration and biotreatment approaches. Materials 2021, 14, 177. [Google Scholar] [CrossRef] [PubMed]
- De Luca, D.; Piredda, R.; Trojsi, G.; Cennamo, P. Close but different: Metabarcoding analyses reveal different microbial communities in ancient Roman nymphaea. Int. Biodeterior. Biodegrad. 2023, 181, 105619. [Google Scholar] [CrossRef]
- Takahashi, S.; Tomita, J.; Nishioka, K.; Hisada, T.; Nishijima, M. Development of a prokaryotic universal primer for simultaneous analysis of Bacteria and Archaea using next-generation sequencing. PLoS ONE 2014, 9, e105592. [Google Scholar] [CrossRef]
- Lambert, S.; Tragin, M.; Lozano, J.C.; Ghiglione, J.F.; Vaulot, D.; Bouget, F.Y.; Galand, P.E. Rhythmicity of coastal marine picoeukaryotes, bacteria and archaea despite irregular environmental perturbations. ISME J. 2019, 13, 388–401. [Google Scholar] [CrossRef]
- Estaki, M.; Jiang, L.; Bokulich, N.A.; McDonald, D.; González, A.; Kosciolek, T.; Martino, C.; Zhu, Q.; Birmingham, A.; Vázquez-Baeza, Y.; et al. QIIME 2 enables comprehensive end-to-end analysis of diverse microbiome data and comparative studies with publicly available data. Curr. Protoc. Bioinform. 2020, 70, e100. [Google Scholar] [CrossRef]
- Wang, Q.; Garrity, G.M.; Tiedje, J.M.; Cole, J.R. Naive Bayesian classifier for rapid assignment of rRNA sequences into the new bacterial taxonomy. Appl. Environ. Microbiol. 2007, 73, 5261–5267. [Google Scholar] [CrossRef]
- Quast, C.; Pruesse, E.; Yilmaz, P.; Gerken, J.; Schweer, T.; Yarza, P.; Peplies, J.; Glöckner, F.O. The SILVA ribosomal RNA gene database project: Improved data processing and web-based tools. Nucleic Acids Res. 2012, 41, D590–D596. [Google Scholar] [CrossRef]
- Guillou, L.; Bachar, D.; Audic, S.; Bass, D.; Berney, C.; Bittner, L.; Boutte, C.; Burgaud, G.; de Vargas, C.; Decelle, J.; et al. The Protist Ribosomal Reference database (PR2): A catalog of unicellular eukaryote small sub-unit rRNA sequences with curated taxonomy. Nucleic Acids Res. 2012, 41, D597–D604. [Google Scholar] [CrossRef] [PubMed]
- Rippa, M.; Vigorito, M.R.; Russo, M.R.; Mormile, P.; Trojsi, G. Active thermography for non-invasive inspection of wall painting: Novel approach based on thermal recovery maps. J. Nondestruct. Eval. 2023, 42, 63. [Google Scholar] [CrossRef]
- Mokrzycki, W.S.; Tatol, M. Colour Difference ΔE—A Survey. Mach. Graph. Vis. 2011, 20, 383–412. [Google Scholar]
- Saiz-Jimenez, C. Biodeterioration: An overview of the state-of-the-art and assessment of future directions. Biodegrad. Cult. Herit. 2001, 520, 10–16. [Google Scholar]
- Charola, A.E.; Pühringer, J.; Steiger, M. Gypsum: A review of its role in the deterioration of building materials. Environ. Geol. 2007, 52, 339–352. [Google Scholar] [CrossRef]
- Camuffo, D.; Del Monte, M.; Sabbioni, C.; Vittori, O. Wetting, deterioration and visual features of stone surfaces in an urban area. Atmos. Environ. 1982, 16, 2253–2259. [Google Scholar] [CrossRef]
- Yan, Y.; Wang, Y. A Review of Atmospheric Deterioration and Sustainable Conservation of Calcareous Stone in Historical Buildings and Monuments. Sustainability 2024, 16, 10751. [Google Scholar] [CrossRef]
- Troiano, F. The Two Sides of Microorganisms in Cultural Heritage Conservation. 2014. Available online: https://hdl.handle.net/2434/229908 (accessed on 23 May 2025).
- Dybowska-Józefiak, M.; Wesołowska, M. The Influence of Biofilm on Selected Properties of Thin-Coat Mineral-Based Plasters on EPS Substrate. Materials 2022, 15, 5963. [Google Scholar] [CrossRef]
- Ma, B.; Gong, J. A meta-analysis of the publicly available bacterial and archaeal sequence diversity in saline soils. World J. Microbiol. Biotechnol. 2013, 29, 2325–2334. [Google Scholar] [CrossRef]
- Masjoudi, M.; Mohseni, M.; Bolton, J.R. Sensitivity of bacteria, protozoa, viruses, and other microorganisms to ultraviolet radiation. J. Res. Natl. Inst. Stand. Technol. 2021, 126, 126021. [Google Scholar] [CrossRef]
- Roesler, C.S.; Culbertson, C.W.; Etheridge, S.M.; Goericke, R.; Kiene, R.P.; Miller, L.G.; Oremland, R.S. Distribution, production, and ecophysiology of Picocystis strain ML in Mono Lake, California. Limnol. Oceanogr. 2002, 47, 440–452. [Google Scholar] [CrossRef]
- Adamiak, J.; Otlewska, A.; Gutarowska, B. Halophilic microbial communities in deteriorated buildings. World J. Microbiol. Biotechnol. 2015, 31, 1489–1499. [Google Scholar] [CrossRef]
Disclaimer/Publisher’s Note: The statements, opinions and data contained in all publications are solely those of the individual author(s) and contributor(s) and not of MDPI and/or the editor(s). MDPI and/or the editor(s) disclaim responsibility for any injury to people or property resulting from any ideas, methods, instructions or products referred to in the content. |
© 2025 by the authors. Licensee MDPI, Basel, Switzerland. This article is an open access article distributed under the terms and conditions of the Creative Commons Attribution (CC BY) license (https://creativecommons.org/licenses/by/4.0/).