Abstract
Ancient Ardaxšīr Khwarrah, today known as Shahr-e Gur, situated near the modern town of Firuzabad in Fars, Iran, holds historical significance as the inaugural capital city of the Sasanian Empire. During archaeological excavations conducted in 2005 by an Iranian–German team directed by Mas‘oud Azarnoush and Dietrich Huff, a mud-brick complex was uncovered, revealing a remarkably well-preserved stretch of wall painting and a polychrome painted floor. The discovery prompted the hypothesis of a potential funerary context dating back to the Sasanian period. Both the wall painting and painted floor have suffered extensive deterioration attributed to the environmental conditions of the archaeological site, which was inscribed on the UNESCO World Heritage List in 2020. To address the urgent need for preservation and further understanding of the site’s artistic and structural elements, an emergency diagnostic project was initiated. Non-invasive investigations were carried out on the wall and floor by optical digital microscopy and portable energy-dispersive X-ray fluorescence. Additionally, representative minute samples underwent analysis through various techniques, including micro-X-ray fluorescence, polarised light microscopy, scanning electron microscopy with energy-dispersive X-ray spectroscopy, micro-Raman spectroscopy, micro-Fourier Transform Infrared Spectroscopy, gas chromatography-mass spectrometry and pyrolysis coupled with gas chromatography-mass spectrometry. The palette of the floor and mural paintings were identified to contain red and yellow ochres, lead-based pigments, carbon black and bone white. The unexpected presence of Egyptian blue mixed with green earth was recognised in the green hues of the wall painting. The detection of protein material in both the wall painting and polychrome floor indicates the use of “a secco” technique, thereby shedding light on the artistic practices employed in Ardaxšīr Khwarrah.
1. Introduction
The structures housing the Firuzabad paintings were discovered within the archaeological site of the Sasanian city of Ardaxšīr Khwarrah [1], established in the first half of the 3rd century CE and later recognised as “Shahr-e Gur” and “Firuzabad” [2,3], near the present-day town of Firuzabad in Iran. Since 2020, the archaeological site has been inscribed on the UNESCO World Heritage List. Firuzabad is now part of the regional district with the same name, situated in the Fars Province of Iran, approximately 110 km south of Shiraz, the main city of the province. The area is positioned on a plateau at an average elevation of 1300 m above sea level. The plain has three natural access points: one to the north from where the Tang-e Ab River flows into the plain, another to the southeast where the same stream exits and the remaining access route in the westernmost corner. The earliest human evidence in the region dates to the Chalcolithic age [4], with a noticeable gap in occupation until the emergence of the Sasanian Empire in the early 3rd century CE [5]. During the early years of this century, likely preceding Ardaxšīr I’s ascent to the throne of Ctesiphon, this local aristocrat established a new city in the northern part of the plain, including its main monuments. This act may have been a deliberate challenge to the Arsacid Shahanshah, leading to the Battle of Hormizdagan (224 CE) and the inception of the Sasanian Empire [6]. The city remained a stronghold against Arab conquest until the mid-7th century and flourished into the Islamic period, enduring until at least the 14th century, after which surface pottery suggests abandonment. The city’s outer walls (Figure S1a) form a visible continuous series of mud elevations in a circular pattern with a diameter of 1950 m. Aerial photographs reveal ancient divisions in radial and circular sectors within this enclosed area, extending from the urban plan to the surrounding plain [7]. Today, most of the internal city plan is covered by crops, offering clear visibility of the bare ground mainly in the central area, roughly 420 m in diameter, with some extensions at its south-eastern borders. At the precise centre of the circular plan, the remains of a tower-like structure called “Menar” still stand (Figure S1a), while 100 m to the northeast are the ruins of another building known as “Takht-e Neshin”.
The 2005 archaeological excavations partially revealed a building on the central area’s border, located 160 m northwest of the Menar. Internally delimited by mudbrick and rammed earth walls, with elevation preserved to less than 1 m and covered by plaster, the complex boasts a rectangular shape measuring approximately 3.10 × 2.60 m. Larger than other delimited areas, it features openings on its eastern corner and southwest side through a doorstep (Figure S1b). In the southern part of this space, in situ remains include a polychrome painted floor, partially preserved with a geometrical pattern of alternating plain and quadripartite squares filled with differently coloured triangles, extending for less than 1.40 × 1.60 m (Figure 1a and Figure S1b,c). This larger rectangular space shares its delimiting walls on two opposite sides, southeast and northwest, with two plastered bath-tube-shaped structures, still presenting faint red pigmentation [1,7]. On the south-eastern section of the excavation trench limit is the remaining stretch of a wall painting preserved for a maximum of 0.90 m in length and around 0.60 m in height (Figure 1b and Figure S1b,d). The wall painting depicts four human figures dressed in tunics, placed on two different coloured backgrounds with an outlining frame. In both wall paintings and painted floor, five different hues, including white, black, green, red and yellow, are still visible. The chronological and functional interpretation of the structures is debated, with cautious suggestions of a funerary context from the Sasanian period. Scholars unanimously agree that more research is required [1,7,8,9,10,11]. Similarly, the stylistic attribution of the paintings remains tentative. Few instances are available for painted floor comparisons, while more have been proposed for other painted evidence. Some scholars [12] claim this floor to be the Sasanian archetype for later Islamic floor decorations, but no evidence is presented. A similar claim is argued for the attribution to Manichaean or Mithraic pictorial traditions based on the extensive use of red pigments proposed by Ja‘fari-Zand [1]. Furthermore, evidence of Sasanian floor decorations mostly consists of mosaics, while similar patterns have not yet been identified in Iran. Instead, they align with Roman floor evidence of Augustan and later periods, though influences are challenging to demonstrate due to the simple geometry of the decoration itself [13].
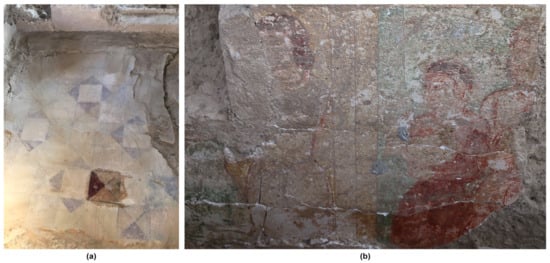
Figure 1.
Shahr-e Gur archaeological site (Iran) (a) geometrical polychrome painted floor and (b) wall painting.
The wall painting from Shahr-e Gur is believed to depict nobles or even the Sasanian imperial family [14]. However, in terms of stylistic and iconographic features, potential comparisons span from the previous Arsacid dynasty to the early Islamic period, extending beyond modern Iran’s borders. Numerous scholars have highlighted comparable evidence in locations such as Hajiabad [1,8,15], Bandiyan [1,10,16], Merv [8,10,17], Susa [1,8], Hatra [8], Dura Europos [8], Mele Hairam [10,16], Tepe Hissar [8,10], Kuh-e Khwaja [14,18], Ghulbiyan [19], Paykand [8,20], Turfan [1] and Samarra [13,21]. Despite this, most wall painting remains are poorly documented, with some irretrievably lost [14], and scientific compositional investigations are rare [22].
This study is particularly relevant in the panorama of the limited findings and research on pictorial evidence related to the hypothesised Sasanian period and provides new data for a more secure time anchorage. The aim of the diagnostic research was, therefore, to bridge the existing gap in the knowledge of these rare painted floor and wall paintings. Moreover, due to their serious decay, the information on constitutive materials and techniques could help to identify the most suitable restoration intervention.
2. Materials and Methods
Non-invasive and micro-invasive investigations were carried out to characterise the paintings, their materials and their state of conservation.
2.1. Non-Invasive Investigations
2.1.1. Handheld USB Digital Microscope (DM)
Preliminary observations were carried out on the painted surfaces using digital handheld optical microscopy, Dino-lite AM7013MZT4 (Dino-Lite Europe, Almere, The Netherlands), interface USB 2.0, sensor CMOS 5 Megapixel, equipped with an anti-reflection polariser and IR cut-filter >650 nm), directly connected to a PC. Images were acquired with 50× and 230× magnifications.
2.1.2. Energy Dispersive X-ray Fluorescence (ED-XRF, µ-XRF)
Two XRF devices were used to obtain qualitative analytical data from the painted surfaces at Firuzabad. The onsite XRF measurements were performed using an Oxford X-Met 8000 energy dispersive handheld spectrometer (Oxford Instruments, Abingdon, UK) with an X-Flash SDD detector and 6 mm diameter spot equipped with an Rh target X-ray tube operating at 8 kV and 50 µA (for low atomic weight elements) and at 40 kV and 8 µA (for high atomic weight elements). A Unisantis XMF-104 micro-XRF device, Geneva, Switzerland, was also used to provide qualitative compositional data from micron-size pigments at 35 kV and 0.5 mA in air. The spectra were recorded on an XR-100CR Peltier-cooled Si-PIN detector from AMPTEK (Aurora, MN, USA, (energy resolution at 5.9 keV was 186 eV for 55Fe) for 300 s. The XRF spectra were processed with the Python multichannel analyser (PyMCA) package. Principal component analysis (PCA) elaborations were carried out using OriginPro 2022.
2.2. Micro Invasive Investigations
2.2.1. Polarised Light Microscopy (PLM)
The observations on polished cross-sections and thin sections were performed using an OLYMPUS BX51 polarised light microscope (Olympus Italia, Segrate, Italy) equipped with fixed oculars of 10× and objectives with different magnifications (5, 10, 20, 50 and 100×), directly connected to an Olympus SC50 camera and Stream Basic software Version 2.3 for images acquisition. The samples were embedded in an epoxy resin and carefully polished after curing the resin with progressively finer paper to be made into cross-sections. Plaster samples were carefully ground to the final thickness (usually 30 μm) to be made into thin sections.
2.2.2. Scanning Electron Microscopy–Energy Dispersive X-ray Spectrometry (SEM/EDS)
Scanning electron microscope Hitachi Tabletop TMT3030 (Hitachi, Tokyo, Japan) equipped with an energy-dispersive X-ray spectrometer, was used on samples and cross-sections without any conductive coating. The measurements were performed using 20 kV acceleration voltage with a variable working distance (from 7.3 to 11.4 mm). Operative conditions were 30 keV with an average lifetime of 40 s. Samples and cross-sections were analysed using backscattered electron (BSE) mode.
2.2.3. Micro-Raman Spectroscopy (µ-Raman)
Micro-Raman analysis was performed with a LabRam confocal microscopy (Jobin Yvon-Horiba, France), equipped with a red 633 nm laser, a Peltier-cooled (−70 °C) CCD detector with 1024 × 256 pixels with a spectral resolution of 1 cm−1 and a spatial resolution of about 1 μm. The scanning time varied from 5 to 20 s with a laser power of 5 mW. Olympus long working distance objectives with 50× and 100× were used.
2.2.4. Fourier Transform Infrared Spectroscopy (micro-FTIR)
Micro-FTIR analysis was carried out on cross-sections of sample 289; spectra were taken from each layer in attenuated total reflectance mode (ATR) and in transmission mode employing a Thermo Nicolet “Continuum” Nexus line microspectrophotometer (Thermo Fisher Scientific Inc., Waltham, MA, USA) equipped with an MCT detector. In the ATR mode, a micro-slide-on ATR silicon crystal directly connected to the objective was used. The contact area of the ATR silicon crystal is circular and approximately 100 µm in diameter. However, the area of the layer actually measured is given by the contact area divided by the refractive index of the crystal (the refractive index of silicon crystal is 3.4) and, hence, is about 30 µm. Infrared spectra were recorded in the 4000–650 cm−1 ranges with a resolution of 4 cm−1 and 64 scans. All spectra collected on the micro-samples are given in transmittance units after baseline correction.
2.2.5. Gas Chromatography-Mass Spectrometry (GC-MS)
The instrument used is a 6890N GC System Gas Chromatograph (Agilent Technologies, Palo Alto, CA, USA) coupled with a 5975 Mass Selective Detector (Agilent Technologies, Palo Alto, CA, USA) single golden quadrupole mass spectrometer equipped with a PTV injector. The mass spectrometer operates in an EI-positive mode (70 eV). The MS transfer line temperature was 280 °C; the MS ion source temperature was kept at 230 °C, and the MS quadrupole temperature at 150 °C. Gas chromatographic separation used the following columns: an HP-5MS fused silica capillary analytical column (5%diphenyl-95%dimethyl-polysiloxane, 30 m × 0.25 mm i.d., 0.25 µm film thickness, J&W Scientific, Agilent Technologies, Palo Alto, CA, USA) and a deactivated silica pre-column (2 m × 0.32 mm i.d., J&W Scientific Agilent Technologies, Palo Alto, CA, USA). A full description of the analytical procedure for the GC-MS determination of glycerolipids, resins, waxes and proteinaceous materials can be found in Andreotti et al. [23].
2.2.6. Pyrolisis-Gas Chromatography-Mass Spectrometry (Py-GC-MS)
The chromatographic analyses were performed with a Micro-furnace Multi-Shot Pyrolyzer EGA/Py-3030D (Frontier Lab, Tokjo, Japan) coupled to a gas chromatograph 6890 Agilent Technologies (USA) equipped with an HP-5MS fused silica capillary column (stationary phase 5% diphenyl–95% dimethyl-polysiloxane, 30 m × 0.25 mm i.d., Hewlett Packard, Paolo Alto, CA, USA) and with a deactivated silica pre-column (2 m × 0.32 mm i.d., Agilent J&W, USA). The GC was coupled with an Agilent 5973 Mass Selective Detector operating in electron impact mode (EI) at 70 eV. The instrumental parameters are reported elsewhere [24].
2.3. Sampling
Representative areas both in the floor and wall painting were selected, 11 micro-samples were collected from the geometrical pattern and 7 micro-samples from the different hues of the paints (Table 1, Figure S2).

Table 1.
List and description of the collected micro-samples.
3. Results and Discussion
The primary focus of the Shahr-e Gur diagnostic research was to define the composition of the finishing plaster and, consequently, the executive technique used to apply various pigments in both the floor and wall paintings. The second step aimed to investigate their state of conservation, providing valuable support information for future interventions.
All the data acquired through a multi-analytical approach, which includes microscopic and spectroscopic analyses, are discussed below. We started by examining the finishing layers, progressing to the different pigments and binders with related images. Additional details can be found in the Supplementary Materials.
3.1. Wall Painting Finishing Plasters
ED-XRF analysis carried out on the wall painting surface revealed a high amount of Ca that could be related to Ca-based compounds such as calcite or Ca-based silicates. Sulphur was also found and correlated with Ca, which could be attributed to Ca–sulphate compounds and Sr may be attributed to the presence of celestine. The occurrence of gypsum was attested with the Raman bands at 416, 1008 and 1134 cm−1 (Figure 2a).
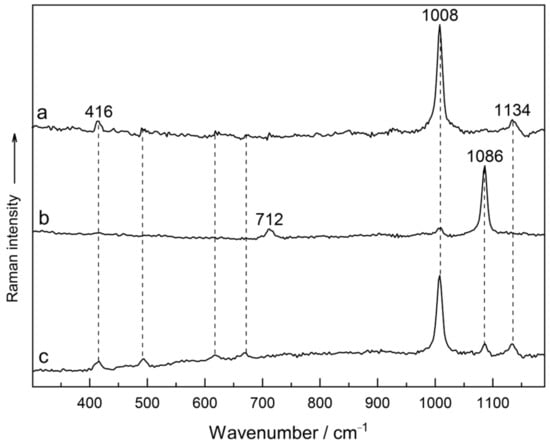
Figure 2.
Raman spectra of floor finishing samples: (a) gypsum in sample FP6, (b) mixture of calcite and gypsum in sample FP4 and (c) gypsum and calcite in the back side of sample FP4.
PLM and SEM/EDS investigations performed on both cross and thin sections (Figure S3a–d) revealed a mainly carbonate matrix with a micritic texture. Spatic calcite clasts and acicular microcrystalline gypsum particles, with a maximum grain size of 500 μm, were detected (Figure S3b). Opaque matter and rare clay minerals (likely chlorite) were also detected.
ATR-FTIR confirmed the presence of calcite due to the peak at 712 and 871 cm −1 and gypsum for the band at 669 cm, 1120–1140 cm −1.
3.2. Floor Finishing Plasters
According to ED-XRF analysis, the finishing plaster of the floor is composed of Ca and Si, which are related to a calcium carbonate matrix and silicate aggregate. The presence of S in the floor painting is primarily related to the gypsum aggregate and to the secondary gypsum due to alteration phenomena.
PLM and SEM/EDS analyses conducted on the floor samples revealed two thin plaster layers (Figure S4a–d). The inner thick layer (2 mm) is characterised by a carbonate matrix that includes fragments of grog (chamotte), aggregates of microcrystalline gypsum, calcite clasts, feldspars, quartz, biotite and opaque minerals (Figure S4b). Grog exhibits variable grain sizes, reaching a few millimetres, and the optical features range from semi-isotropic to isotropic. The overlapped finishing layer is approximately 1500 µm thick, and the particle grain size is smaller than the inner layer. Micro-Raman spectroscopy showed bands at 712 and 1086 cm−1, which are attributed to calcite [25] and at 416, 1008 and 1134 cm−1, related to gypsum [26] (samples FP4 and FP6) (Figure 2a–c) whose use is well documented in mortars and plasters of Firuzabad area [27,28].
3.3. The Palette
In both wall painting and painted floor (Figures S5 and S6), ED-XRF analysis on yellow and red hues revealed the presence of Ca, Si, Fe, K, Mn and Ti related to ochres/earth pigments. The yellow and white pigments from the floor are associated with minor to trace amounts of Pb, Cl, P and V together with a major quantity of Fe, while the green pigment was mainly associated with Si, K and Fe (Figure 3). No significant amounts of elements heavier than Ca were observed in the black pigment. The pigments on the painted floor are highly linked with Ca; the pigments on the wall painting are richer in Ca and S.
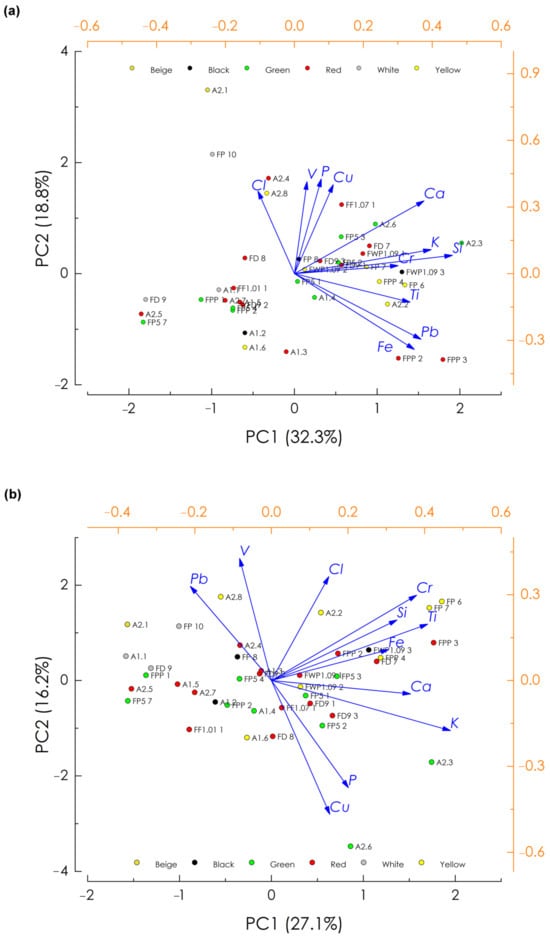
Figure 3.
PCA biplots on the XRF spectra acquired at 40 kV from the wall painting and the painted floor (the actual colours of the painting areas are represented).
3.3.1. Yellow and White Pigments
ED-XRF analysis of the yellow hues in the wall painting (Figure S5a) and painted floor (Figure S6a) indicated the presence of Fe (Figure 3), suggesting yellow ochre as a possible candidate. The micro-XRF spectrum of the yellow area confirmed the presence of Fe-based compounds (sample 290, Table 1, Figure 4a). Moreover, as the PCA biplot of the ED-XRF data demonstrated, the yellow pigment incorporated minor to trace amounts of Pb, P, V and Cl both in wall painting and painted floor (Figure 3).
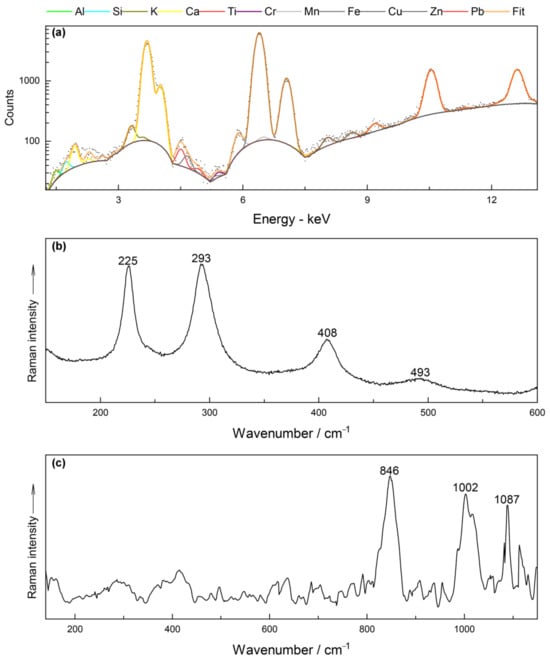
Figure 4.
Yellow paint of the wall painting: (a) micro-XRF spectrum from the yellow area (sample 290); Raman spectra of yellow paints: (b) haematite (sample 288) and (c) crocoite mixed with celestine and calcite (sample 290) (baseline removed).
Micro-Raman analysis carried out in the yellow hue of the wall painting detected red haematite, indicated by bands at 225, 293, 408 and 493 cm−1 [29] (sample 288, Table 1, Figure 4b). It should be mentioned that several Raman measurements did not show goethite or lepidocrocite within the yellow colour. Due to a weak Raman band at 840 cm−1, crocoite was detected in sample 290 mixed with celestine and calcite (Table 1, Figure 4c) [30].
According to PLM and SEM/EDS investigations, the yellow paint layer is very thin, including small, red Fe-based particles (25 µm) (sample 290, Figure S7a; sample 288, Figure S7b; sample FP2, Figure S8a, Table 1); a red sinopia (10 µm) visible under the yellow paint layer will be discussed in the paragraph of red hues (Figure S7b). SEM-EDS revealed rare tiny crystals of Pb, P and Cl included in the Fe-based yellow pigments of the wall paintings (samples 290 and FP4), while the association Pb, P, Cl and V were sometimes detected in the painted floor (samples FP2 and FP3; Figure S9a,b; Table 1). These elements can be linked with minerals from the apatite group, such as pyromorphite (Pb5(PO4)3Cl) and vanadinite (Pb5(VO4)3Cl), which are found in nature associated with crocoite (PbCrO4) and are yellow in colour.
It is, however, evident that the yellow colour is mainly related to the iron oxides but also to the yellow members of the apatite group [31]. These secondary minerals occur in the oxidised zones of lead-bearing deposits associated with Cr-rich rocks, and their intentional use as yellow pigments has not yet been proved [31].
The ED-XRF analysis carried out in the white hues of the floor (Figure S6b) showed the presence of P in association with Ca (Figure 3); iron lower amounts in association with silicon and potassium are linked to earth pigments. According to PLM and SEM/EDS investigations, the white layer has a maximum thickness of 70 μm (Figure S10a) and is composed of Ca-based binder, bone white particles and red Fe-based aggregate (probably haematite) (Figure S10b–e) showing Pb impurity (Figure S11a,b). The presence of Pb-P-Cl-V compounds (Figure S11c,d) could be related to an original yellow hue.
Natural sources of yellow and red ochre are available worldwide, and thus, it is not surprising to see them employed as artists’ pigments at Firuzabad. While the occurrence of the yellow ochre in the palette of painters in the history of Persian painting is well documented [32], it is interesting to mention that the yellow minerals of the apatite group have been previously reported in the late Sasanian [22] and early Islamic wall paintings in Iran [33], the historical period that is well-matched with the paintings of Firuzabad. Crocoite was found in Egyptian funerary artefacts mixed with limonite and calcite [34] and in a Chinese mural painting belonging to the Tang dynasty [35].
3.3.2. Green Pigments
According to ED-XRF results (Figure 3 and Figure 5a), Cu was detected by ED-XRF in the green hue of the wall paintings (Figure 3). In the green sample collected from the wall painting, PLM and SEM/EDS investigations revealed a first layer composed of green particles, yellow ochre and spare Egyptian blue particles (sample 289, Table 1, Figure 5b, Figures S5b and S12a,b).
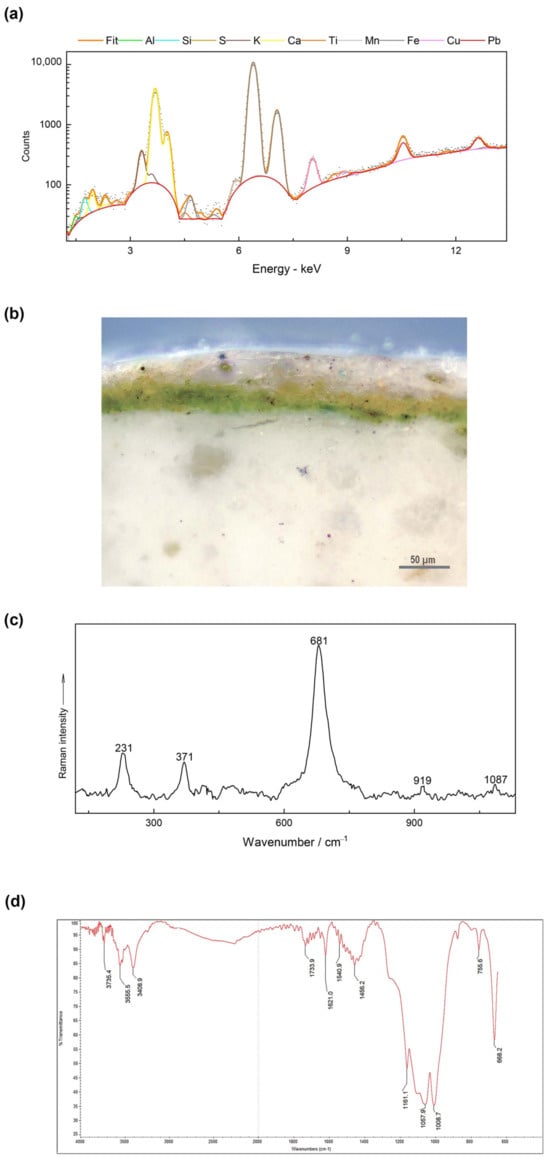
Figure 5.
Green wall painting, sample 289: (a) micro-XRF; (b) reflected light microphotograph; (c) Raman spectrum; (d) micro-FTIR spectrum of the green pictorial layer.
A layer of yellow ochre overlapped the green layer (Figure S7c), probably it is probably related to lighting. It is noteworthy that micro-Raman analysis carried out on the green layer (sample 289) revealed bands at 231, 371, 681 and 919 cm−1 (Figure 5c) that can be associated with lattice vibration, Mg or Fe–OH, Si–O–Si and O–Si–O modes of minerals from the amphibole group [36], particularly richterite [37]. Amphibole is associated with Fe mineralisation in brecciated zones, suggesting a hydrothermal origin for the ores [38,39]. Amphibole group of minerals are green to brown in colour and have been rarely reported as green artists’ pigment [40]. Several scholars [41,42,43,44] report glaucophane as a bluish amphibole in the Bronze Age fresco paintings at Knossos and Santorini in Greece. Also, riebeckite, as a blue amphibole, has been reported as a green pigment in the Pharaonic town of Amarna West from 1300–1050 BCE, and its origin could be associated with the deposits formed by the erosion of igneous rocks [45]. Far from ancient Greece and Egypt, amphiboles have also been reported in painted ceramic figurines in coastal Ecuador and Colombia dated from the mid-first millennium BC to the mid-first millennium CE [46].
Micro-FTIR analysis (Figure 5d) confirmed the presence of the Egyptian blue due to its characteristic triplet at 1161, 1057 and 1008 cm−1, attributed to antisymmetrical Si–O–Si stretching vibrations [47,48,49] and for the bands at 755 and 668 cm−1 due to the symmetrical Si–O–Si stretching [47].
The mixture of green and blue pigments to obtain bluish-green or greenish-blue paint is attested in Egypt and Levantine area [50]. The use of the blue synthetic pigment is confirmed in Achaemenid Iran both on sculpture and palace facades [51,52]. Egyptian blue pellets were found in the Persepolis West craft zone, attesting to an Achaemenid local production [39]. Synthetic blue is also confirmed in Parthian stuccoes [53].
In contrast, according to ED-XRF analysis (Figure 3 and Figure S6c), the green pigments used in the painted floor are highly enriched with Si, K, Ca and Fe, suggesting the presence of earth-based pigments. According to PLM and SEM/EDS investigations, the green painting layer is very thin (15 µm) and composed of green earth (sample FP5; Table 1, Figures S8b and S13a,b).
3.3.3. Red Pigments
The red pigment on the floor is highly associated with Fe (Figure 3) and it is almost certainly red ochre, given the high contribution of Fe in the composition of this pigment. The presence of haematite was confirmed by micro-Raman spectroscopy, with bands at 227, 247, 293, 411, 498, 614, 662 and 1315 cm−1 [29] (Figure 6).
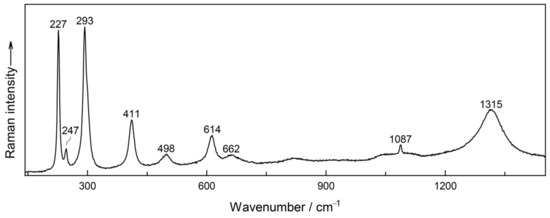
Figure 6.
The Raman spectrum of the red pigment on the painted floor (sample FP1) (the band at 1087 cm−1 is from calcite).
According to PLM and SEM/EDS investigations carried out on the red layer of the wall painting (sample FD9, Figure S5c; red sinopia of sample 288, Figure S7c) and in the red hue of the painted floor (sample FP1, Figures S6d and S8c), Fe-based pigments were used (70 μm maximum layer thickness). Small amounts of Pb were detected (sample FP1, Figure S14a,b), which can be considered a naturally occurring impurity in the ochres [54].
3.3.4. Black Pigment
The black pigment was only observed on the floor outline (Figure S6e). It contained no heavy elements (Figure 3), suggesting carbon black as a pigment. The absence of phosphorus excluded the use of bone black. Very low amounts of nickel and vanadium excluded the use of bituminous materials. The Raman spectrum of the black pigment showed two broad Raman bands at 1354 and 1599 cm−1, attributed to the D and G bands of carbon in lampblack, respectively [55] (Figure 7). In accordance with this observation, the ratio between the intensity of these two bands (i.e., ID/IG), after removing the baseline based on a Lorentzian fitting, was calculated as 0.92, which is associated with lampblack [56].
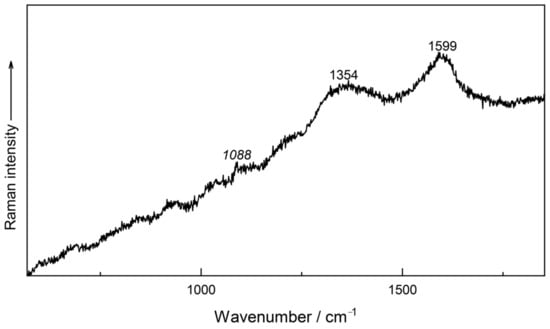
Figure 7.
The Raman spectrum of the black pigment in sample FP3 (the italic band is from calcite).
According to PLM and SEM/EDS investigations, the black layer on the painted floor, related to the drawing lines, is composed of dark particles, confirming the presence of carbon black.
3.4. Analysis of the Organic Component
3.4.1. GC-MS Analysis
The content of proteinaceous material was under the limit of detection (LOD) for samples FP2, FP3 and FP5. For sample FP1, the amino acidic signals were above the LOD but under the limit of quantification (LOQ), so identification of the proteinaceous source was compared with those of reference materials using principal component analysis and revealed PCA scores close to that of animal glue cluster. This assignment was further supported by the presence of hydroxyproline, a unique marker of animal glue. The Single Ion Monitoring (SIM) chromatogram of the proteinaceous fraction of sample FD9 is reported in Figure 8, and the other samples collected from the floor are available in the Supplementary Materials (Figure S15). Moreover, traces of sulphate, oxalates and phosphates have been detected despite the purification step of the analytical procedure, pointing to a high content of these compounds in sample FD9. Probably, the strong degradation of the protein material favoured the mineralisation of the binder and consequent formation of calcium oxalates [57]. The origin of calcium oxalates is unresolved and still under debate, as they can be produced by microorganisms as well as by the decay of natural organic compounds [39].
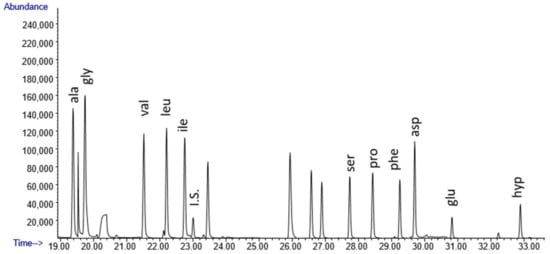
Figure 8.
The SIM chromatograms of the amino acid fraction of sample FD9 from the wall painting *. *I.S. internal standard of derivatisation (Norleucine). Ala = alanine; Gly = glycine; Val = valine; Leu = leucine; Ile = isoleucine; Pro = proline; Ser = serine; Phe = phenilalanine; Asp = aspartic acid; Glu = glutammic acid; Hyp = Hydroxyproline.
The analysis of the lipid-resinous-wax fraction highlighted the absence of a lipid material; the fatty acid content was under the detection limit of the analytical procedure (LOD and LOQ 0.8 and 1.5 μg, respectively). Furthermore, no molecular markers of natural resin or waxes were detected.
3.4.2. Py-GC-MS Analysis
The analysis was conducted to identify markers of synthetic materials used during restoration and traces of natural materials for which detection was not achieved by GC-MS analysis. The Py-GC-MS technique confirmed the very low percentage content of organic materials. The only trace of pyrrole, a pyrolysis marker of animal glue, was found in samples FP1, FP3 and FD9.
Interestingly, the pyrogram of sample FP1 (Figure 9) shows the presence of the monomers of synthetic resins: methyl acrylate (MA), ethylacrylate (EA), methylmethacrylate (MMA) and ethyl methacrylate (EMA). These, together with the occurrence of dimers, trimers and cyclic rearrangement pyrolysis compounds in the range of 20–30 min, allow us to identify the resin as Paraloid B72, a copolymer of ethylmethacrylate and methylacrylate characterised by an EMA/MA composition of 70/30. MMA is a secondary product originating from MA units, and similarly, EA comes from EMA units [58].
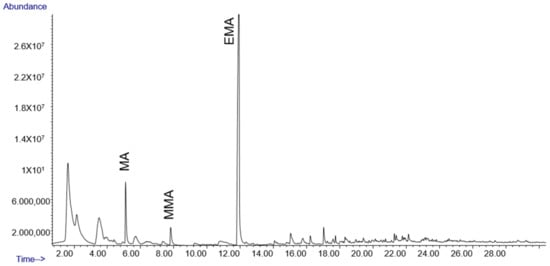
Figure 9.
Pyrogram of sample FP1: MA: methacrylate; MMA: methyl methacrylate; EMA: ethyl methacrylate.
4. State of Conservation
The wall painting is in a bad state of preservation with extensive phenomena of detachment, disaggregation and cracking of the support. The painting surface shows several lacunae and fractures, especially on the lower part, due to the inclination of the mural structure. Soil residues and encrustations are visible on the painting surface (Figure S16a); a red sinopia is observable due to the detachment of the paint layers (Figure S16b).
The polychrome floor is also in a poor state of preservation with severe phenomena of detachment, cracking and decohesion of the support. Dust deposition, abrasions and lacunas of the painted surface are widespread (Figure S16c). The pictorial film shows different decay depending on the hue: red areas appeared better preserved than the green and yellow areas, probably because the red paint layer thickness is higher than the other hues (almost 70 µm) (Figure S8c).
According to PLM and SEM/EDS analyses of painted floor and wall painting, calcium carbonate concretion and gypsum crystals sometimes cover the painting surfaces (samples A1a, A2, Table 1, Figure S17a,b); they are related to decay processes and the sulphation phenomenon could be caused by previous restoration interventions with gypsum mortar and cement [1].
Micro-FTIR analysis of the wall painting showed the presence of an acrylic resin (Acryloid B72) due to the C−H stretching at 2983 and 2952 cm−1, the C=O stretching peak at 1730 cm−1, and the asymmetric CH3 bending at 1447 cm−1 (Figure S18) [59]. The floor was also submitted to some restoration treatments [1], as indicated in Py-GC-MS analysis. Unfortunately, we are therefore not able to establish whether the occasional presence of the synthetic resin is due to a consolidation treatment, which is also degraded like the organic material and therefore difficult to trace, or whether it is a local treatment on the fissured zone.
5. Conclusions
The comparisons in stylistic features may associate the wall paintings and the polychrome floor of Shahr-e Gur with the Sasanian period, and the lack of scientific investigations on this issue makes the current article a crucial publication to enrich the study of pictorial traditions in Iran.
The wall painting finishing plaster is composed of a lime-based binder with spatic calcite clasts and acicular microcrystalline gypsum particles as aggregate.
In the polychrome floor, the sequence is more complex: two thick plaster layers composed of lime-based binder with grog (chamotte), agglomerates of microcrystalline gypsum, calcite clasts and silicates as aggregate. In the overlapped finishing layer, the particle grain size is smaller than the underlying one.
The multi-analytical approach based on microscopic and spectroscopic analyses showed an essential palette based on yellow and red ochres, green earth, carbon black and bone white. The unexpected presence of Egyptian blue mixed with green earth is very interesting, and its presence should be investigated as it has never previously been mentioned in Sassanian paintings. The occurrence of some minerals belonging to the apatite group, such as pyromorphite (Pb5(PO4)3Cl) and vanadinite (Pb5(VO4)3Cl), which are found in nature associated with crocoite (PbCrO4) and are yellow in colour, is to be considered as a trace amount and incorporated in the source of the ochre used in the yellow and red hues.
Summarising, the results of the chromatographic analyses showed that the organic material is present only in traces. A high quantity of sulphates and oxalates were highlighted. Although the protein material is almost always present below or at the limit of quantification of the GCMS procedure (with the exception of samples FD9 and FP1), the presence of animal glue can nevertheless be inferred. This was also confirmed by the presence of pyrolysis markers in some samples.
One of the most probable hypotheses is that the protein material found in traces binding the paint is strongly altered and, therefore, difficult to detect. In fact, the use of “a fresco” technique is rarely documented in Iran due to the adverse hot and dry features of the local climate, which makes such painting techniques difficult to employ.
The wall painting and the painted floor suffer serious decay due to sulphation processes because they are not adequately preserved, and they require an emergency restoration intervention and better protection.
Supplementary Materials
The following supporting information can be downloaded at https://www.mdpi.com/article/10.3390/heritage7030058/s1, Figure S1: (a) Aerial photograph of the Ardaxšīr-Xwarrah site, in the red square the location of the excavation area (photo by G. Gerster) [13]; (b) 3D model (laser scanner survey by Roberto Gabrielli of ITABC CNR for SALF) [13], in the green squares the location of the wall painting and painted floor; (c) reconstructive hypothesis of the painted floor inside the complex [13], p. 94; (d) graphic elaboration of the features recognised on the wall paintings with a reconstructive hypothesis of the frames [13], p. 96. Figure S2. Samples excavated in the Firuzabad archaeological area analysed in the present paper. Figure S3. Sample 290: (a) PLM micrograph of the cross-section; (b) PLM micrograph of a thin section of plaster with microcrystalline gypsum particles; (c) SEM micrograph and (d) EDS microanalysis of the substrate. Figure S4. Sample FP5: (a) PLM micrograph of the cross-section; (b) PLM micrograph of a thin section of plaster with microcrystalline gypsum particles; (c) SEM micrograph and (d) EDS microanalysis of the plaster. Figure S5. Digital micrographs of wall painting: (a) yellow hue, sample 288; (b) green hue, sample 289; (c) red hue, sample FD9. Figure S6. Digital micrographs of painted floor: (a) yellow hue, sample FP2; (b) white hue, sample FP4a; (c) green hue, sample FP5; (d) red hue, sample FP1;(e) black hue, sample FP3. Figure S7. Cross-section of wall painting, PLM micrographs: (a) sample 290, yellow; (b) sample 288, yellow paint layer on red sinopia; (c) sample 289, green. Figure S8. Cross-section of a painted floor, PLM micrographs: (a) sample FP2, yellow; (b) sample FP5, green; (c) sample FP1, red. Figure S9. Sample FP3, cross-section: (a) SEM micrograph and (b) EDS microanalysis of the Pb-P-V-Cl rich crystals in yellow paint. Figure S10. Sample FP4, cross-section: (a) PLM micrograph; (b) SEM micrograph; (c) EDS microanalysis of the white area; element distribution map of (d) phosphorous and (e) calcium. Figure S11. Sample FP4, cross-section: (a) SEM micrograph; (b) EDS microanalysis of the Fe-rich aggregate in the white paint; (c) SEM micrograph; (d) EDS microanalysis of the Pb-P-V-Cl rich crystals in the white paint. Figure S12: Sample 289, cross-section: (a) SEM micrograph and (b) EDS microanalysis of Egyptian blue particle in the green paint. Figure S13. Sample FP5, cross-section: (a) SEM micrograph and (b) EDS microanalysis of the green paint. Figure S14. Sample FP1, cross-section: (a) SEM micrograph and (b) EDS microanalysis of Fe-based particle in the red paint. Figure S15: SIM chromatograms of the amino acid fraction of samples from the wall painting *. *I.S. internal standard of derivatisation (Norleucine). ala = alanine; gly = glycine; val = valine; leu = leucine; ile = isoleucine; pro = proline; ser = serine; phe = phenilalanine; asp = aspartic acid; glu = glutammic acid. Figure S16. (a) Fractures, soil residues and encrustations are visible on the wall painting surface; (b) red sinopia; (c) Abrasions, fractures and paint detachments on the painted floor, detail. Figure S17. PLM micrographs of the thin section of calcium carbonate and gypsum encrustation: (a) sample A1a (b) sample A2. Figure S18. Micro-FTIR spectrum: acrylic resin in the wall painting.
Author Contributions
Conceptualisation, M.L.A.; methodology, M.L.A., P.H. and A.A.; validation, M.L.A., P.H. and A.A.; formal analysis, P.H, V.M., N.E. and A.A.; investigation, M.L.A., P.H, V.M., N.E. and A.A.; data curation, M.L.A., V.M. and P.H.; writing—original draft preparation, M.L.A. and P.H., for “Introduction”: P.C., A.A.C. and M.B.; writing—review and editing, M.L.A., M.B. and P.H.; visualization, P.C. and A.A.C.; supervision, M.L.A. and P.H.; project administration, M.L.A. All authors have read and agreed to the published version of the manuscript.
Funding
This research received no external funding.
Data Availability Statement
The data is unavailable due to Iranian government restrictions.
Acknowledgments
This research was carried out according to the agreement between the World Heritage of Sasanid Archaeological Landscape of Fars region, Shiraz University, University of Urbino and University of Bologna while the archaeological excavation was carried out by M. Azarnoush and D. Huff as a joint project by Iran–Germany. Thanks are due to Benelli Arte for the instrumental contribution, to Roberto Gabrielli for the laser scanner survey and to Elena Monni for micro-FTIR analysis.
Conflicts of Interest
The authors declare no conflicts of interest. There are no funders involved in this research and manuscript.
References
- Ja’fari-Zand, A. The discovery of the funerary building with paintings in Shahr-e Gur (Ardaxšīr-Xwarrah) Firuzabad. In Firuzabad History and Culture; Karachi, R., Ed.; Institute for Humanities and Cultural Studies: Tehran, Iran, 2017; pp. 253–311. (In Persian) [Google Scholar]
- Bosworth, C.E. Ardašīr- Ḵorra. Iran. Antiq. 1986, II, 384–385. [Google Scholar]
- Bosworth, C.E. The Sasanids, the Byzantines, the Lakhmids, and Yemen (translated and annotated by C. E. Bosworth). In The History of al-Tabari (Ta’rikh al-Rusul wa’l-Mulnk); Ariomand, S.A., Ed.; State University of New York Press: Albany, NY, USA, 1999; Volume V. [Google Scholar]
- Stein, A. An Archaeological Tour in the Ancient Persis. Geogr. J. 1935, 86, 489–497. [Google Scholar] [CrossRef]
- Huff, D. Fīrūzābād. Iran. Antiq. 1999, IX, 633–636. [Google Scholar]
- Wiesehöfer, J. Das Frühe Persien. Geschichte Eines Antiken Weltreichs; Oscar Beck: München, Germany, 1999; Volume 94. [Google Scholar]
- Huff, D. Formation and Ideology of the Sasanian State in the Context of Archaeological Evidence. In The Sasanian Era. The Idea of Iran; Curtis, V.S., Stewart, S., Eds.; I. B. Tauris: London, UK, 2008; Volume III, pp. 31–59. [Google Scholar]
- Compareti, M. The State of Research on Sasanian Painting. e-Sasanika 2011, 13, 1–50. Available online: https://www.academia.edu/1809995/The_State_of_Research_on_Sasanian_Painting (accessed on 30 November 2023).
- Mousavi, A.; Daryaee, T. The Sasanian Empire: An Archaeological Survey, c. AD 220–640. In A Companion to the Archaeology of the Ancient Near East; Potts, D.T., Ed.; Blackwell Publishing: Oxford, UK, 2012; pp. 1076–1094. [Google Scholar]
- Callieri, P. Architecture et Représentations Dans l’Iran Sassanide (Studia Iranica. Cahiers, 50); Peeters: Louvain, Belgium, 2014. [Google Scholar]
- Huff, H. Das Plansystem von Ardašīr-xwarrah: Agrarkolonisatorisches Groβprojekt und gebautes Staatsmodell eines von Gott gegebenen Königtums. In Raumkonzeptionen in Antiken Religionen: Beiträge. Des Internationalen Symposiums in Göttingen, 28–29 Juni 2012; Phlippica, K.R., Ed.; Harrassowitz Pubblishing: Gottingen, Germany, 2014; pp. 153–210. [Google Scholar]
- Suren-Pahlav, S. Sasanian Art, the Main Source of Early Islamic Floor-Frescos. CAIS (The Circle of Ancient Iran Studies), 19 February 2006; School of Oriental and African Studies (SOAS): London, UK, 2006; Available online: https://www.cais-soas.com/News/2006/February2006/19-02.htm (accessed on 30 November 2023).
- Bartolucci, M. Il Complesso con Pitture al Centro della città di Shahr-e Gur (Firuzabad, Fars, Iran): Uno Studio Archeologico e Storico-Artistico. Ph.D. Thesis, Alma Mater Studiorum University of Bologna, Bologna, Italy, 2020. Available online: https://amsacta.unibo.it/id/eprint/7063/1/BartolucciMatteo2022_PittureShahr-eGur_ThTriennale2020_OAv3.pdf (accessed on 27 November 2023).
- De Waele, A. Sasanian Wall Paintings. Encyclopædia Iranica, 2009. Iranica Online. Available online: https://iranicaonline.org/articles/sasanian-wall-painting (accessed on 30 November 2023).
- Azarnoush, M. The Sasanian Manor House at Hājīābād, Iran; Le Lettere: Firenze, Italy, 1994. [Google Scholar]
- Matteo, C. Dinastie di Persia e Arte Figurativa: Bibliografia Ragionata per un Millennio e Mezzo di Iconografie Iraniche, Studia Persica, 2nd ed.; Paolo Emilio Persiani: Bologna, Italy, 2019. [Google Scholar]
- Loukonine, V.; Ivanov, A. L’Art Persan; Parkstone/Aurora: Bournemouth, UK, 1995. [Google Scholar]
- Kawami, T.S.; Becker, L.; Koestler, R. Kuh-e Khwaja, Iran, and Its Wall Paintings: The Records of Ernst Herzfeld. Metrop. Mus. J. 1987, 22, 13–52. [Google Scholar] [CrossRef][Green Version]
- Grenet, F. La peinture sassanide de Ghulbiyan (Afghanistan). Doss. D’archeologie 1999, 243, 66–67. [Google Scholar]
- Matteo, C. Iconographical notes on some recent studies on Sasanian religious art. Ann. Ca’ Foscari 2006, XLV, 163–200. [Google Scholar]
- Brend, B. Islamic Art; Harvard University Press: Cambridge, MA, USA, 1991. [Google Scholar]
- Holakooei, P.; Karimy, A.H.; Hassanpour, A.; Oudbashi, O. Micro-Raman spectroscopy in the identification of wulfenite and vanadinite in a Sasanian painted stucco fragment of the Ghaleh Guri in Ramavand, western Iran. Spectrochim. Acta A Mol. Biomol. Spectrosc. 2016, 169, 169–174. [Google Scholar] [CrossRef]
- Andreotti, A.; Bonaduce, I.; Colombini, M.P.; Gautier, G.; Modugno, F.; Ribechini, E. A combined GC-MS analytical procedure for the characterisation of drying oils, waxes, natural terpenoid resins, pitch, tars and proteinaceous materials in the same paint microsample. Anal. Chem. 2006, 78, 4490–4500. [Google Scholar] [CrossRef]
- Orsini, S.; Parlanti, F.; Bonaduce, I. Analytical pyrolysis of proteins in samples from artistic and archaeological objects. J. Anal. Appl. Pyrolysis 2017, 124, 643–657. [Google Scholar] [CrossRef]
- Krishnamurti, D. The Raman Spectrum of Calcite and its Interpretation. Proc. Indian Acad. Sci. 1957, 46, 183–202. [Google Scholar] [CrossRef]
- Berenblut, B.J.; Dawson, P.; Wilkinson, G.R. The Raman Spectrum of Gypsum. Spectrochim. Acta A Mol. Biomol. Spectrosc. 1971, 27, 1849–1863. [Google Scholar] [CrossRef]
- Huff, D. Qal’a-ye Dokhtar bei Firuzabad, Archäologische Mitteilungen aus Iran; Verlag: Berlin, Germany, 1971; Volume 4, pp. 173–175. [Google Scholar]
- Mousavi, A. Persia (Achaemenid to Sasanid Empires), c. 550 BCE–651 CE. In Sir Banister Fletcher’s Global History of Architecture; Fraser, M., Ed.; The Royal Institute of British Architects (RIBA) and the University of London: London, UK, 2019. [Google Scholar] [CrossRef]
- Hanesch, M. Raman spectroscopy of iron oxides and (oxy)hydroxides at low laser power and possible applications in environmental magnetic studies. Geophys. J. Int. 2009, 177, 941–948. [Google Scholar] [CrossRef]
- Frost, R.L. Raman microscopy of selected chromate minerals. J. Raman Spectrosc. 2004, 35, 153–158. [Google Scholar] [CrossRef]
- Gliozzo, E.; Ionescu, C. Pigments-Lead-based whites, reds, yellows and oranges and their alteration phases. Archaeol. Anthrop. Sci. 2022, 14, 17. [Google Scholar] [CrossRef]
- Stodulski, L.; Farrell, E.; Newman, R. Identification of Ancient Persian Pigments from Persepolis and Pasargadae. Stud. Conserv. 1984, 29, 143–154. [Google Scholar] [CrossRef]
- Holakooei, P.; de Lapérouse, J.-F.; Rugiadi, M.; Carò, F. Early Islamic pigments at Nishapur, north-eastern Iran: Studies on the painted fragments preserved at The Metropolitan Museum of Art. Archaeol. Anthropol. Sci. 2018, 10, 175–195. [Google Scholar] [CrossRef]
- Edwards, H.G.M.; Villar, S.E.J.; Eremin, K.A. Raman spectroscopic analysis of pigments from dynastic Egyptian funerary artefacts. J. Raman Spectrosc. 2004, 35, 786–795. [Google Scholar] [CrossRef]
- Liu, Z.; Xu, W.; Zhang, Y.; Wang, Y.; Li, J. Identification of the Pigments on the Mural Paintings from an Ancient Chinese Tomb of Tang Dynasty Using Micro-Raman and Scanning Electron Microscopy/Energy Dispersive X-ray Spectroscopy Analysis. Minerals 2023, 13, 1224. [Google Scholar] [CrossRef]
- Apopei, A.I.; Buzgar, N. The Raman study of amphiboles. Analele Stiintifice ale Universitatii “Al. I. Cuza’’ din Iasi Seria. Geologie 2010, 56, 57–83. [Google Scholar]
- Waeselmann, N.; Schlüter, J.; Malcherek, T.; Della Ventura, G.; Oberti, R.; Mihailova, B. Nondestructive determination of the amphibole crystal-chemical formulae by Raman spectroscopy: One step closer. J. Raman Spectrosc. 2020, 51, 1530–1548. [Google Scholar] [CrossRef]
- Rajabzadeh, M.A.; Rasti, S. Investigation on mineralogy, geochemistry and fluid inclusions of the Goushti hydrothermal magnetite deposit, Fars Province, SW Iran: A comparison with IOCGs. Ore Geol. Rev. 2017, 82, 93–107. [Google Scholar] [CrossRef]
- Amadori, M.L.; Vagnini, M.; Vivani, R.; Anselmi, C.; Askari Chaverdi, A.; Callieri, P.; Matin, E.; Mengacci, V. Advances in characterization of colourful residues unearthed in Persepolis West craft zone using microscopic and spectroscopic techniques. Microchem. J. 2021, 167, 106304. [Google Scholar] [CrossRef]
- Eastaugh, N.; Walsh, V.; Chaplin, T.; Siddall, R. The Pigment Compendium: A Dictionary of Historical Pigments, 1st ed.; Elsevier and Butterworth-Heinemann: Amsterdam, The Netherlands; Boston, MA, USA, 2004. [Google Scholar]
- Filippakis, S.E.; Perdikatsis, B.; Paradellis, T. An Analysis of Blue Pigments from the Greek Bronze Age. Stud. Conserv. 1976, 21, 143–153. [Google Scholar] [CrossRef]
- Profi, S.; Weier, L.; Filippakis, S.E. X-ray Analysis of Greek Bronze Age Pigments from Knossos. Stud. Conserv. 1976, 21, 34–39. [Google Scholar] [CrossRef]
- Profi, S.; Perdikatsis, B.; Filippakis, S.E. X-ray Analysis of Greek Bronze Age Pigments from Thera (Santorini). Stud. Conserv. 1977, 22, 107–115. [Google Scholar] [CrossRef]
- Cameron, M.A.S.; Jones, R.E.; Philippakis, S.E. Scientific Analyses of Minoan Fresco Samples from Knossos. Annu. Br. Sch. Athens 1977, 72, 121–184. [Google Scholar] [CrossRef]
- Fulcher, K.; Siddall, R.; Emmett, T.F.; Spencer, N. Multi-scale characterization of unusual green and blue pigments from the Pharaonic town of Amara West, Nubia. Heritage 2021, 4, 2563–2579. [Google Scholar] [CrossRef]
- Reiss, B.F.; Splide, M.; Peterson, E. Compositional analysis and cross-cultural examination of blue and blue-green post-fire colorants on Tolita-Tumaco ceramics. Boletín Arqueol. Pucp 2019, 27, 117–132. [Google Scholar] [CrossRef]
- El-Gaoudy, H.; Kourkoumelis, N.; Varella, E.; Kovala-Demertzi, D. The effect of thermal aging and color pigments on the Egyptian linen properties evaluated by physicochemical methods. Appl. Phys. A 2011, 105, 497–507. [Google Scholar] [CrossRef]
- Mahmoud, M.H.; Papadopoulou, L. Archaeometric analysis of pigments from the Tomb of Nakht-Djehuty (TT189), El-Qurna Necropolis, Upper Egypt. ArcheoSciences 2013, 37, 19–33. [Google Scholar] [CrossRef]
- Mahmoud, M.H. Investigations by Raman microscopy, ESEM and FTIR-ATR of wall paintings from Qasr el-Ghuieta temple, Kharga Oasis, Egypt. Herit. Sci. 2014, 2, 18–29. [Google Scholar] [CrossRef]
- Kakoulli, I. Late Classical and Hellenistic painting techniques and materials: A review of the technical literature. Stud. Conserv. 2002, 47 (Suppl. S1), 56–67. [Google Scholar] [CrossRef]
- Simpson, S.t.J.; Ambers, J.; Verri, G.; Devièse, T.; Kirby, J. Painted Parthian Stuccoes from Southern Iraq. In Proceedings of the 7th International Congress on the Archaeology of the Ancient Near East, London, UK, 12–16 April 2010; Matthews, R., Curtis, J., Eds.; Harrassowitz Verlag: Wiesbaden, Germany, 2012; Volume 2, pp. 209–220. [Google Scholar]
- Nagel, A.; Rahsaz, H. Colouring the Dead: New Investigations on the History and the Polychrome Appearance of the Tomb of Darius I at Naqsh-e Rostam, Fars. In Death and Burial in Arabia and Beyond: Multidisciplinary Perspectives; Weekes, L., Ed.; Archaeopress: Oxford, UK, 2010; pp. 289–298. [Google Scholar]
- Khanmoradi, M.; Niknami, K. An Analytical Approach to Investigate the Parthians Painted Stuccoes from Qal’eh-i Yazdigird, Western Iran. Hist. Świat 2017, 6, 21–32. [Google Scholar] [CrossRef]
- Secco, M.; Rainer, L.; Graves, K.; Heginbotham, A.; Artioli, G.; Piqué, F.; Angelini, I. Ochre-Based Pigments in the Tablinum of the House of the Bicentenary (Herculaneum, Italy) between Decorative Technology and Natural Disasters. Minerals 2021, 11, 67. [Google Scholar] [CrossRef]
- Coccato, A.; Jehlicka, J.; Moens, L.; Vandenabeele, P. Raman spectroscopy for the investigation of carbon-based black pigments. J. Raman Spectrosc. 2015, 46, 1003–1015. [Google Scholar] [CrossRef]
- Tomasini, E.P.; Halac, E.B.; Reinoso, M.; Di Liscia, E.J.; Maier, M.S. Micro-Raman spectroscopy of carbon-based black pigments. J. Raman Spectrosc. 2012, 43, 1671–1675. [Google Scholar] [CrossRef]
- Amadori, M.L.; Barcelli, S.; Poldi, G.; Ferrucci, F.; Andreotti, A.; Baraldi, P.; Colombini, M.P. Invasive and non-invasive analyses for knowledge and conservation of Roman wall paintings of the Villa of the Papyri in Herculaneum. Microchem. J. 2015, 118, 183–192. [Google Scholar] [CrossRef]
- Chiantore, O.; Lazzari, M. Characterization of Acrylic Resins. Int. J. Polym. Anal. 1996, 2, 395–408. [Google Scholar] [CrossRef]
- Carretti, E.; Chelazzi, D.; Baglioni, P.; Poggi, G.; Dei, L. Interactions between Nanostructured Calcium Hydroxide and Acrylate Copolymers: Implications in Cultural Heritage Conservation. Langmuir 2013, 29, 9881–9890. [Google Scholar] [CrossRef]
Disclaimer/Publisher’s Note: The statements, opinions and data contained in all publications are solely those of the individual author(s) and contributor(s) and not of MDPI and/or the editor(s). MDPI and/or the editor(s) disclaim responsibility for any injury to people or property resulting from any ideas, methods, instructions or products referred to in the content. |
© 2024 by the authors. Licensee MDPI, Basel, Switzerland. This article is an open access article distributed under the terms and conditions of the Creative Commons Attribution (CC BY) license (https://creativecommons.org/licenses/by/4.0/).