Article

The Non-Invasive Characterization of Iron Age Glass Finds from the “Gaetano Chierici” Collection in Reggio Emilia (Italy)

1
Department of Chemistry, University of Turin, Via Giuria 7, 10125 Torino, Italy
2
Arvedi Laboratory of Non-Invasive Diagnostics, CISRiC, University of Pavia, Via Bell’Aspa 3, 26100 Cremona, Italy
3
Department of Musicology and Cultural Heritage, University of Pavia, Corso Garibaldi 178, 26100 Cremona, Italy
4
Department of Physics, University of Turin and INFN Branch in Turin, Via Pietro Giuria 1, 10125 Torino, Italy
5
Department of Historical Studies, University of Turin, Via Sant’Ottavio 20, 10124 Torino, Italy
*
Authors to whom correspondence should be addressed.
Heritage 2023, 6(7), 5583-5606; https://doi.org/10.3390/heritage6070294
Submission received: 29 May 2023 / Revised: 6 July 2023 / Accepted: 12 July 2023 / Published: 24 July 2023

Abstract

:
This work reports the results of the analyses performed on a set of glass finds from the “Gaetano Chierici” collection in the Civic Museums of Reggio Emilia. Forty-eight typologically heterogeneous glass finds were included in the list of the analyzed objects, dating from the fifth century BCE to the first century CE. The objects primarily consisted of glass beads; however, bangles, pinheads, and one vessel fragment were also included in the set. The items were analyzed using non-invasive spectroscopic methods that were implemented with portable equipment on the museum’s premises. Fiber optic reflectance spectroscopy was used to identify the coloring species in the glass matrix, while X-ray fluorescence spectrometry provided compositional information. Both techniques allowed for a discussion of the mechanisms of coloring and opacification, as well as the raw materials used for this purpose. The results provided a complex picture of the various colorants used to manipulate the appearance of the glass, which was a crucial aspect in the creation of the personal adornments represented by these glass items. The data revealed evidence of different sources of raw glass and colorants. Most of the samples were colored with cobalt, but iron and copper also influenced the color of many of them. Both white and yellow were utilized for the glass decorations, and these colors were achieved with the addition of either antimony-containing crystals or tin-containing ones. This finding suggests that the transition from antimonate to stannate started as early as the second century BCE. The “Gaetano Chierici” collection contains representative objects distributed throughout the investigated period. The results obtained here are a starting point for future studies of glass technology and provenance in the area.

1. Introduction

One of the primary uses of glass in ancient times was for the creation of various types of personal adornments. Glass was an ideal material for this purpose due to its plasticity at high temperatures and its potential for a limitless manipulation of color and opacity. Glass opened the way for crafting adornments on a larger scale, overcoming the limits of precious stones and metals. Despite being largely overlooked, glass ornaments provide an important source of evidence for commercial and cultural exchange. As they became accessible to a broader population, they gained increasing significance in people’s lives. The chemical composition of these ornaments preserves traces of their level of complexity, possibly indicating social differences within (and between) communities [1].
During the second half of the first millennium BCE, craftspeople experimented with a wide range of coloring, decoloring, and opacifying materials, leading to innovations in glassworking [2,3,4,5]. Meanwhile, glass production was moving towards standardization, resulting in more precise batch formulas and object designs [6,7,8].
During the period under study, the Italian Peninsula was marked by the growth of the Roman state and the decline of city-states and tribal unions. The area around modern Reggio Emilia, where most of the objects in this study were unearthed, was inhabited by groups with uncertain ethnic affiliations, possibly including Ligurians and Etruscans. In the middle of the first millennium BCE, particularly in the sixth to fifth centuries, the area was influenced by Etruscan urban civilization [9,10]. The fourth century BCE saw Celtic incursions, but the presence of settlements in the area was preserved until Roman times [11,12]. Mixed grave sets containing goods inherent to different cultures were common, making it difficult to distinguish specific cultural groups [13,14,15]. This may be attributed to the development of the Mediterranean–Trans-Alpine trade and exchanges, which are well documented [13,16,17]. The diversity of the material culture is reflected in the diversity of the glass finds. The objects considered in this study appear to originate from different glassworking traditions associated with several material culture entities, confirming the complex nature of cultural exchange in the area during the Iron Age and the beginning of Roman times.
Unfortunately, the objects in this collection originated from old (and probably unsystematic) excavations, which means that the precise archaeological context of these glass items is unknown. They were dated by considering the materials found in their immediate vicinity or based on their typological features. This explains the broad range of dating, which is indicated in Table 1, together with the museum codes for identifying the finds and the related literature. These materials were found in six different places, most of which are situated near present-day Reggio Emilia (Emilia–Romagna region, Italy). Therefore, this study could be the first step toward understanding chemical features of the glass found in this area.
The objects involved in this research are part of the museum’s permanent collection. Therefore, it was necessary to analyze them using portable equipment with minimal handling. Such a non-invasive approach provided fast insight without damaging the objects that could remain on display.
The main aim of this work is to provide new knowledge on the selected group of objects through a compositional approach. Given the lack of precise archaeological context, this seems to be a way of improving the archaeological attribution of the objects. A partial understanding of the composition of the glass, with an emphasis on the coloring/opacifying agents, is provided by the data collected and presented in this work. The (somewhat limited) archaeological information available for these objects in the “Gaetano Chierici” collection at the Civic Museums of Reggio Emilia can then be supplemented with archaeometric data to support their interpretation.
The results and discussion sections highlight chemical similarities and differences within and between types, despite some limitations resulting from the use of a non-invasive approach with portable instruments. In addition, the information on the composition of the glass and the identification of the chemical species employed for coloring can support the discussion on the glass circulating in the area during a wide period in the second half of the first millennium BCE.

2. Materials and Methods
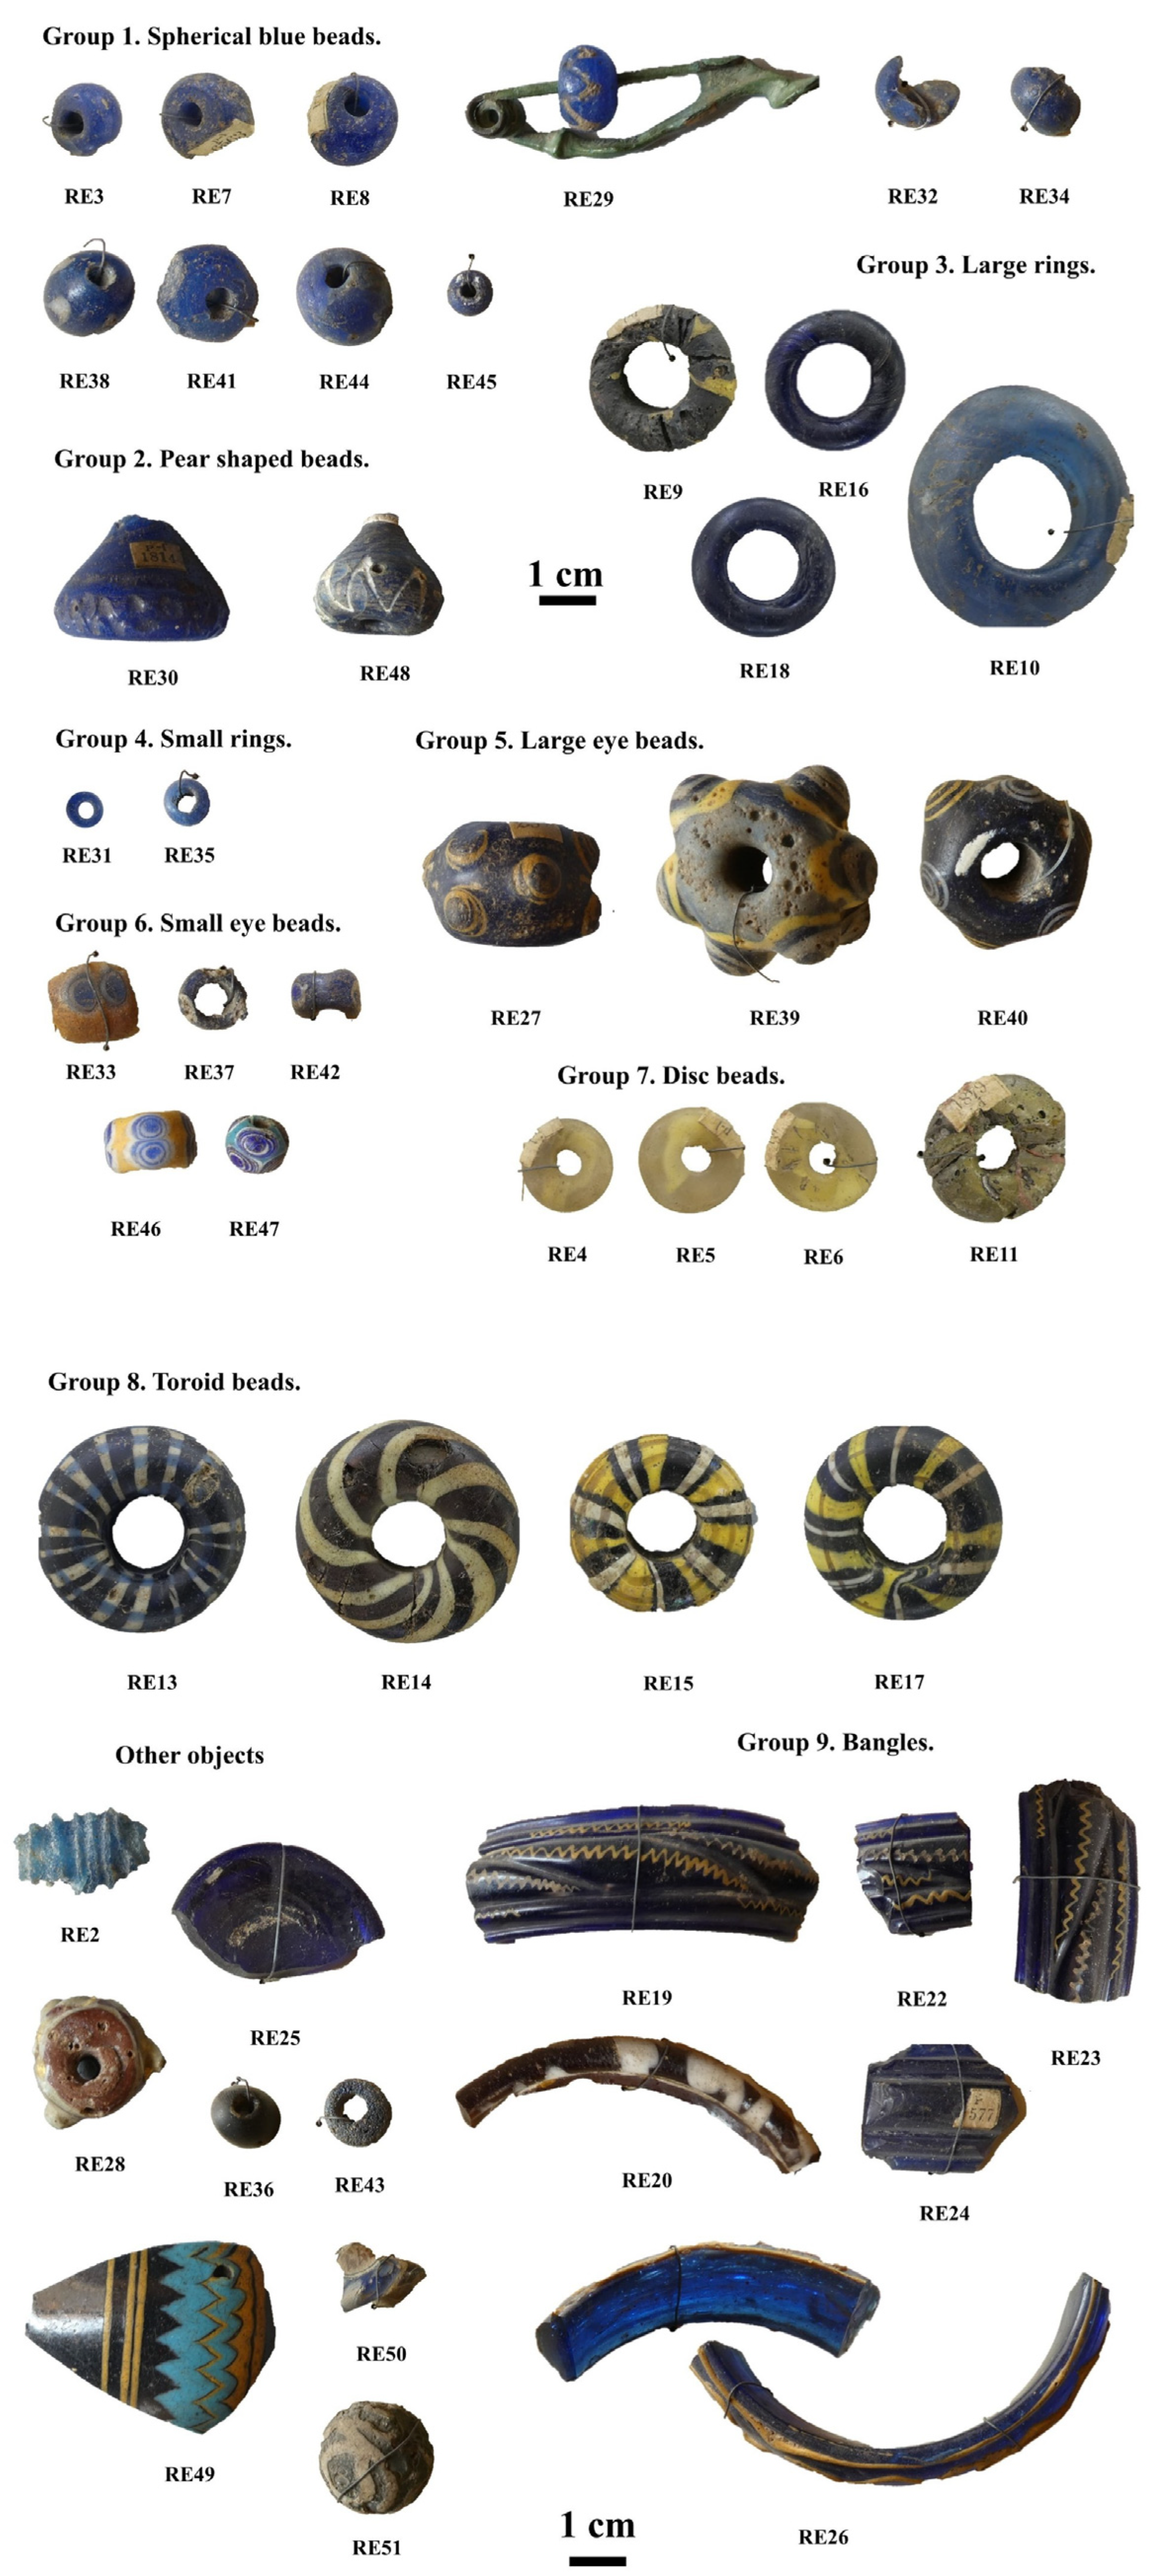
2.1. Materials

Forty-eight glass objects were examined and analyzed. Most of them are glass beads of various types, with a minority of pinheads and (fragmentary) glass bangles. In addition to these objects, one fragment of glassware was considered. The objects shown in Figure 1 are divided into groups, each of which includes items that can be attributed to the same (or similar) type according to macroscopic characteristics (mainly dimensions, shape, and purpose). Some details on the dimensions and appearance of each object are given as supplementary information (Supplementary Materials, Table S1), while the ways of forming such objects are discussed elsewhere [7,20,23,24,25]. These objects represent several glassworking traditions: small beads (both monochrome and decorated) and a vessel fragment can be associated with Iron Age–Hellenistic glassworking traditions. In contrast, larger beads and bangles can be associated with the Late Iron Age Celtic glassworking tradition. Nevertheless, many objects cannot be easily assigned to one or the other.
Among the beads included in the glass collection, the most numerous are spherical blue beads of semi-translucent glass (Figure 1, Group 1). Within this group, RE29 and RE38 have a white wavy decoration. Their size is variable. Their widest diameter is in the range of 8 to 16 mm. They tend to be somewhat flattened perpendicular to the aperture so that the distance between the apexes does not exceed 13 mm in the largest specimens and decreases as the size decreases. The diameter of the opening is consistently around 3–4 mm. They were found at different sites, and some of them have not yet been published in the archaeological literature (Table 1).
Another type encompasses pear-shaped beads (Figure 1, Group 2), represented in the collection by two objects, namely RE30 and 48. They are made of blue glass, have a diameter of more than 20 mm, and are decorated with grooves and waves. Although they were included in the same group, these two objects were found at different locations and attributed to different periods (Table 1).
Large-ring beads of blue translucent glass (Figure 1, Group 3) are represented by four samples (RE9, 10, 16, and 18). They were formed as rounded glass coils, except for RE9, which is slightly flattened. The diameter of the rings is between 25 and 40 mm, and the apertures are also relatively large: 10–13 mm. Due to these characteristics, they can be attributed to the ring-bead type. They were all found in the same area and dated to the same period (Table 1).
Another group of much smaller rings (Figure 1, Group 4) includes two samples: RE31 and RE35. Apart from the common type, they were found in different localities and may not be coeval. RE31 has no reference in the archaeological literature (Table 1).
The glass finds in the Gaetano Chierici collection in Reggio Emilia include several beads with eye decorations. Here, they are divided into two groups according to the diameter of the bead: the large ones (Figure 1, Group 5) and the small ones (Figure 1, Group 6). The eyes were made in different ways: by applying a piece of soft glass to the base of the bead to create a protrusion and then spiraling a different colored glass on its surface (in the case of larger beads); by making simple ring eyes with a thin coil that “sinks” into the hot body of the bead (such as for sample RE37); or by alternating layers of different colored glass (white and blue) by simply dropping them on the hot surface. The bases of these beads are differently colored and appear to be blue, yellow, or green glass. The eyes feature white, yellow, and blue glass. The small-eye beads in Group 6 have a common place of discovery and the same date, while the group of large beads has a more heterogeneous origin (Table 1).
Another group of beads consists of flat, disc-shaped beads of translucent yellow glass (Figure 1, Group 7). They were all found in the same area and dated to the same period (Table 1).
Toroid beads (Figure 1, Group 8) are made of thick and round in-section glass coils, covered by a layer of dark glass. They are decorated with stripes of white or yellow glass. These beads are among the largest pieces in the assemblage—up to 40 mm in diameter and up to 17 mm in height, with openings up to 13 mm. Spirals of colorless or blue glass are observed on the sides of some of the samples parallel to the apexes. They are all attributed to the same period and come from the same site (Table 1).
The non-bead objects mainly consist of fragments of glass bangles (Figure 1, Group 9) of various colors and decorations. The base glasses are predominantly blue and semi-translucent, and some feature yellow wave decorations. RE20 is made of yellow-brown glass and has decorative patches of opaque white glass. Despite their differences in color and decoration, they were all found in the same area and dated to the same period (Table 1).
The last group, called “other objects” (Figure 1), includes all the samples that could not be included in the above-mentioned typological framework. Consequently, this is a heterogeneous assortment of eight objects from different sites, most of them without a clear archaeological interpretation (Table 1).

2.2. Methods

2.2.1. Photography

The photographs were taken with a Panasonic DMC-TZ80 digital camera under natural light illumination. They were color-corrected using X-Rite ColorChecker (Grand Rapids, MI, USA) references for the white balance and color correction [26]. Small areas distant from glares and shadows in the color-corrected photographs were processed with the ImageJ software (v.1.53c) [27] to obtain the RGB coordinates. RGB values were used to compare the colors of the studied objects and to highlight homogeneity/heterogeneity in relation to the common/different coloring species.

2.2.2. Fiber Optic Reflectance Spectroscopy (FORS)

FORS allows for the rapid and straightforward characterization of colorants in glass. The instrumental setup used in this work consisted of an Ocean Insight (Orlando, FL, USA) HL-2000-HP-FHSA 20 W tungsten halogen light source. The light was transmitted through a 2 m long Y-shaped reflection/backscatter fiber optic probe with a 400 µm core size and 6.35 mm ferrule diameter. A holder held the probe in place, and the samples were exposed to the probe at an angle of approximately 45°. The actual value of this angle was arranged to optimize the quality of the captured spectra. With this arrangement, the analyzed area was an oval of about 1–2 mm2 in diameter. The spectra were recorded in a darkened room. The diffuse light was transmitted to the QEPro CCD detector (Ocean Insight, Orlando, Florida, USA) with HC1 grating operating in the range of 248–1038 nm with an optical resolution of 6.78 nm FWHM. The detector was calibrated using a Spectralon (Edmund Optics, Barrington, New Jersey) 99% diffuse reflectance standard. No less than 40 scans were averaged for a single-spectrum acquisition with an integration time of 0.020 to 0.030 s. Multiple spectra were acquired for each sample, with decorations treated as different samples. Reflectance spectra were normalized by setting their minimum value to 0 and their maximum value to 100.

2.2.3. Portable X-ray Fluorescence (p-XRF)

An ELIO (XGLab S.R.L. Milan, Italy) was used for the acquisitions within the premises of the museum. It was equipped with a Rh anode source with the beam focused on a 1.2 mm diameter spot, and a 25 mm2 silicon drift detector (SDD). The nominal resolution of the spectra was 140 eV at the Mn Kα line. The following settings were used: time—90 s, current—40 µA, and voltage—40 keV. Three spectra were acquired from different spots on each sample. When different colors were present on the same object, three spectra were acquired from each of them.
The spectra were fitted with the PyMCA software (v. 5.6.7) [28] after creating a model with fundamental parameters, which was implemented (and verified) using the Corning Museum of Glass references A, B, and D, and several chips of archaeological glass of known composition. A separate paper is available with a more detailed description of the workflow [29]. The estimated accuracy and limit of quantification (LOQ) of the method are shown in Table 2.

3. Results

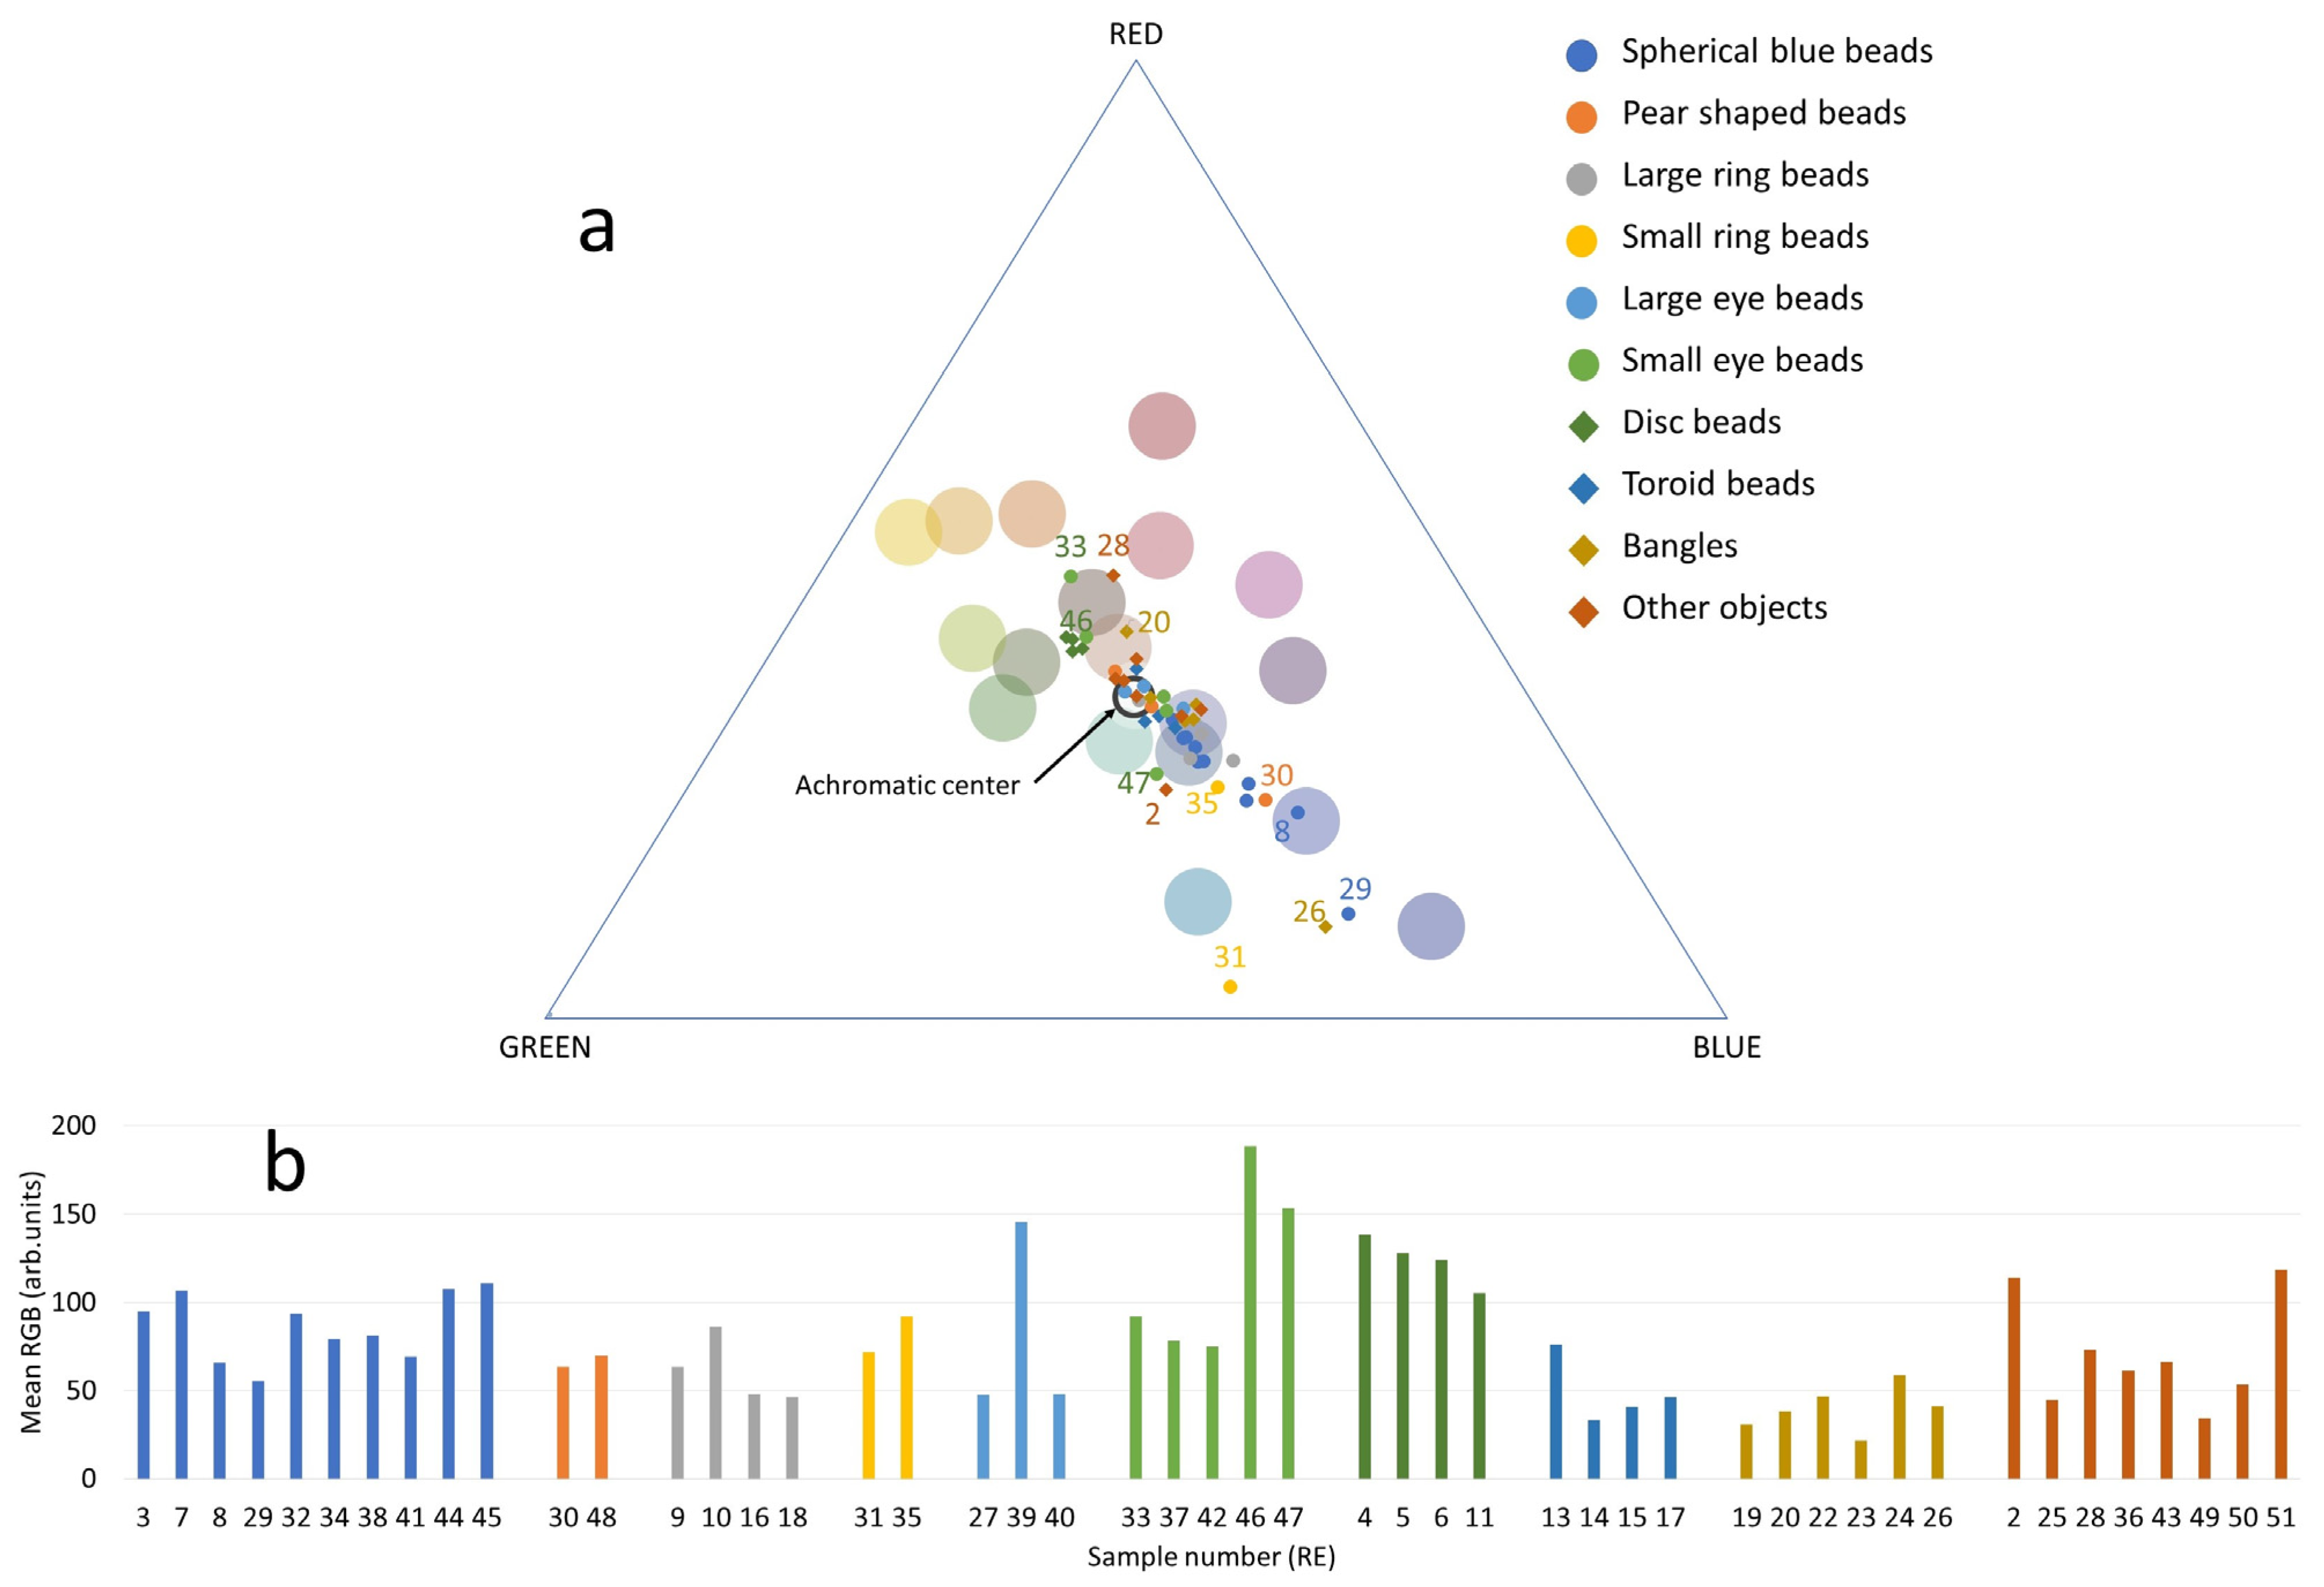
3.1. Color (from Color-Corrected Photographs)

Color is the most noticeable feature of glass objects, and it is also the most difficult to document and communicate, as color measurements, especially for translucent materials and small archaeological objects, are far from obvious [30]. Consequently, the color of archaeological glass finds is usually reported descriptively, as it appears to the eye, neglecting the subtle variations within the sample set examined. This type of information is reported in Table S1.
In this paper, we relied on an empirical procedure implemented on digital photographs in order to report the color of the studied samples (both translucent and opaque) in more detail. This approach allowed us to properly document the color similarities/differences within and between the typological groups described in Section 2.1.
The RGB values extracted from the color-corrected digital photographs of the samples are shown in a ternary plot (Figure 2a). The large colored dots in the triangle represent the RGB coordinates for the colored squares of the ColorChecker (see Section 2.2 for details); they guide the eye to the hues in the RBG ternary plot. The lightness/darkness of each sample is represented in the bar graph (Figure 2b), which shows the mean value calculated from the three RGB values of each sample. Darker colors have lower mean values, and lighter colors have higher mean values.
The majority of the samples in all the outlined groups tend to lie on the trend line that runs approximately from yellow to blue through the center of the ternary plot, where the grayscale values are placed (achromatic center). The higher the color saturation, the farther the position of the sample from the achromatic center, while the samples closer to the center have more even RGB values and therefore less intense hues.
In the center of the ternary plot, we find samples with relatively high blue tones within the dense group. As expected, this includes samples from Groups 1 to 5, Group 8, most of the bangles from Group 9, and some of the samples from the “other objects” group. The heterogeneity of the two pear beads of Group 2 is evident in the ternary plot, as they are separated, with RE48 positioned on the yellow-green side of the plot. Similarly, one of the two small-ring beads in Group 4, RE31, appears to be close to the cyan area of the triangle, away from the rest of the group.
Toroid beads (Group 8) and bangles (Group 9) are much darker in color than the other blue beads (of course, if the white and yellow decorative elements are excluded), and RE20, which belongs to the latter group, is expectedly placed in the red-brown area away from the other samples but not far from the center.
The small-eye beads in Group 6 are scattered in both the ternary and bar plots: samples RE33 and RE46 are closer to the yellow-brown area, while the rest of the samples are more on the blue side, with RE47 skewed towards the green region; two of them (namely RE46 and 46) have particularly high RGB values, which is related to the generally lighter color of the matrix, the presence of white parts and a better state of preservation (Figure 1).
Group 7, consisting of weakly colored yellow beads, forms a dense and distinct group of samples between the brown and green regions of the plot, together with the small-eye bead RE46, although the lightness of this bead is much higher than that of the beads in Group 7.
As expected, the “other objects” are scattered, with RE2 being skewed to the green side, RE28 skewed to the red site, and the remaining samples closer to the center, which indicates less intense colors (Figure 2).
Color trends are reflected in the colorants used in the glass, which are presented and discussed in the following sections.

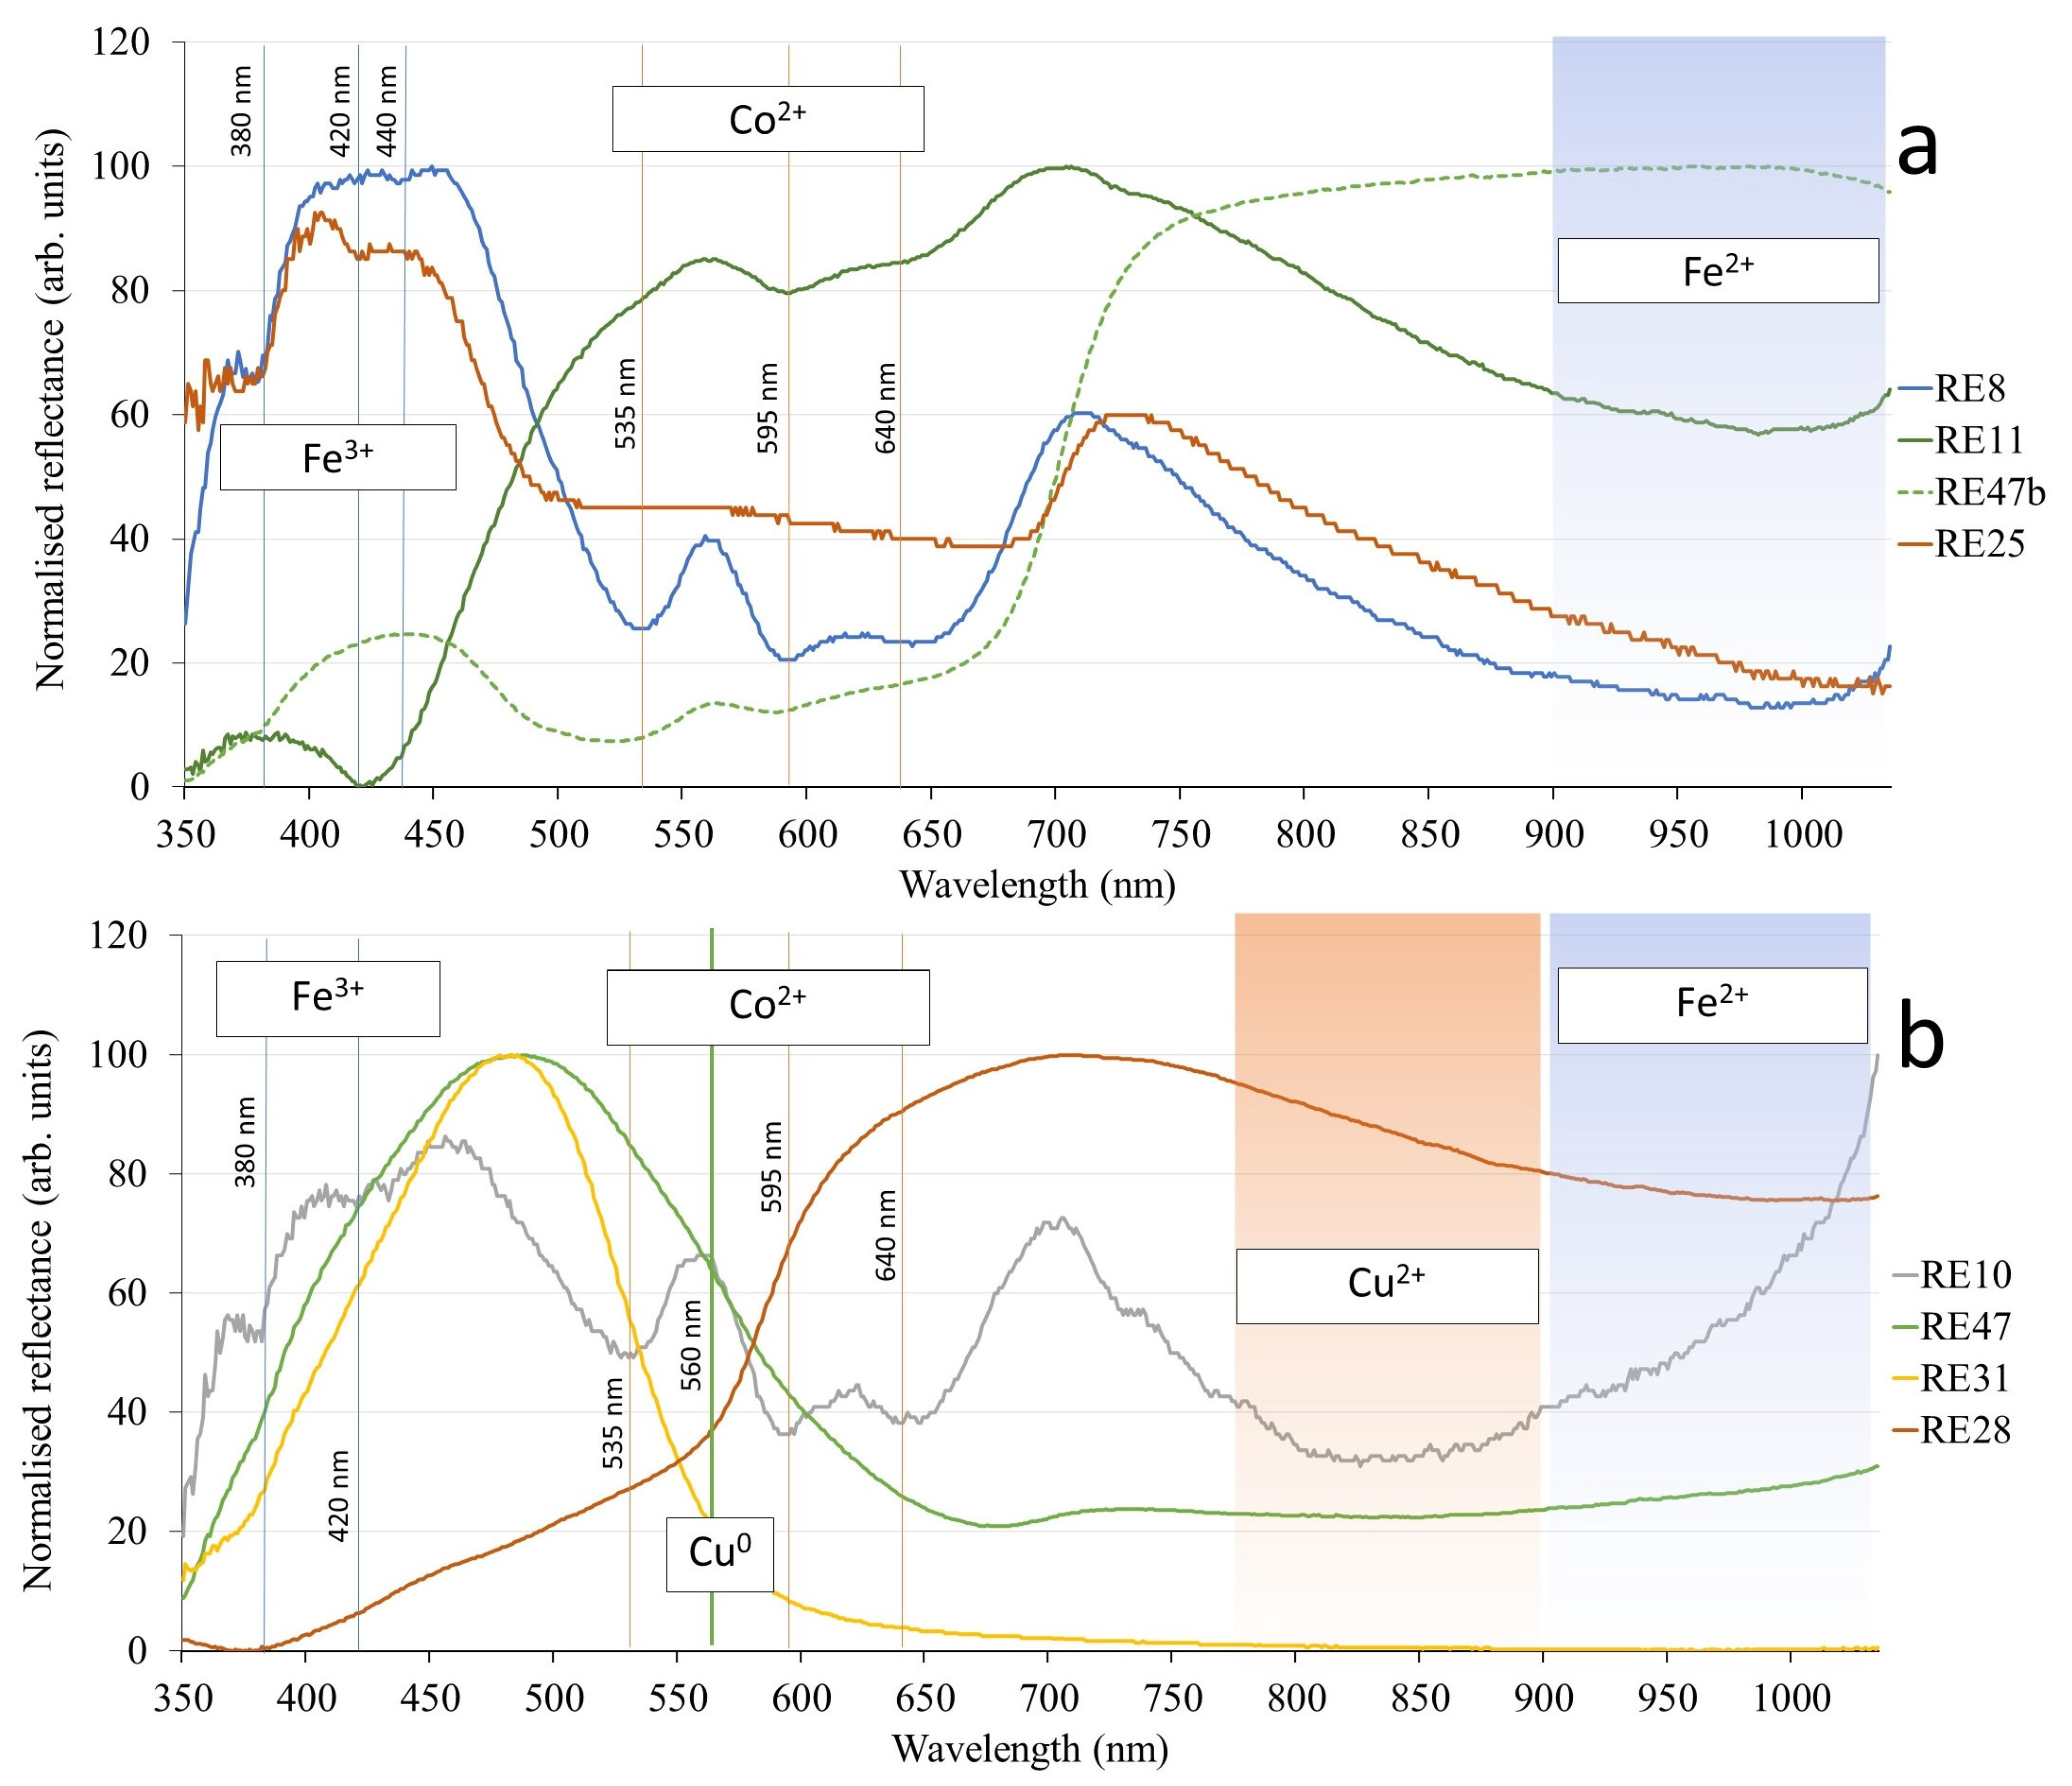
3.2. Fiber Optic Reflection Spectroscopy (FORS)

FORS allows for the differentiation of certain colorants. When color is obtained by dissolving transition metal ions, this spectroscopic approach allows the nature of the ion to be determined in terms of element, oxidation state, and coordination geometry [31]. In this section, the FORS data are presented according to the interpretation of the spectra reported in [32] and references therein. Unfortunately, interpretable spectra were not always obtained using this non-invasive approach. In particular, the spectra of white and yellow decorations did not provide any information. Therefore, the p-XRF data are a much-needed supplement for the characterization of the coloring/opacifying species in the glasses of the Chierici collection.
Table 3 summarizes the information about the chromophores detected in each group of samples. It shows that most of the spectra reveal the bands of Fe2+, Fe3+, and Co2+. The Fe2+ absorption band is broad and centered in the NIR region at about 1050 nm, which is beyond the analytical range of the spectrometer. However, it can be suggested in the spectra by the absorption starting after 800 nm. Fe3+ can exhibit several absorption bands concentrated in the UV and the blue regions of the spectrum, the most prominent ones being at approx. 380 nm and 420 nm. Co2+ is characterized by a triplet of bands at approx. 540, 590, and 650 nm.
The predominant color of the glass objects in the Reggio Emilia collection is deep blue, which is often obtained by adding cobalt. A certain amount of iron is always expected in glasses, as it usually enters the batch as an impurity of the silica source [33,34]. Samples RE10, 31, 36, 39, and 47 show the broad absorption band of Cu2+ in the NIR region (750–900 nm). Copper in octahedral coordination reflects light in the blue-green region of the visible spectrum, causing the resulting glass to turn blue.
One sample, RE28, produces spectra with the Cu0 band at ca. 560 nm. It is the only red-colored sample in the assemblage.
The spectra collected from the samples in the assemblage can be roughly divided into two types. One can be called the Fe-Co type, and it is shown in Figure 3a, where the representative spectra obtained for samples of different groups are reported. All the spherical blue beads of Group 1 show the same trend, although they show a slight variability in the RGB plot (Figure 2) and are represented in Figure 3a by RE8. The Fe3+ bands are observed at 380 and 440 nm, but at the same time, the absorption close to 1000 nm indicates the presence of Fe2+.
RE11 (Group 7) exhibits a strong absorption at 420 nm. RE25 (other objects) shows an absorption of 420 nm instead of the Fe3+ band at 440 nm. Both Fe3+ bands can also be interpreted as signals from Mn2+, as they are difficult to distinguish. We have not mentioned Mn2+ in Table 3 because it is a weak chromophore that probably has a minimal effect on the final color of these glasses. As reported in Section 3.3, Mn was detected in quantifiable amounts via XRF in all of these samples except RE8. Sample RE47b (the eye decoration of Group 6 representative) also shows the Fe3+ band at 380 nm, while Fe2+ ions were not detected in this sample (Figure 3a). The configuration of Fe3+ and possibly Mn2+ bands is variable among the remaining samples that produced this type of spectrum, just as in Figure 3. This distribution is not systematic and cannot be interpreted in a semi-quantitative way. The same can be said about the distribution of the Co2+ triplet of bands. They were not detected in RE25 because the absorption of Co2+ is too intense, as expected from the dark color of this sample (Figure 2b); therefore, only the intense absorption band between 500 and 800 nm was detected in the spectrum. This is also the case with some samples of Group 10 (bangles), which are made of deep blue glass. This glass is difficult to be analyzed with FORS because of the low diffusion of the light. For this reason, Co2+ sub-bands were not detected in RE19, 22, 23 and 25. RE11, like in all the beads of Group 7 (disk-shaped beads), shows absorption bands of an unclear chromophore at 590 and 650 nm. Similar spectra have been reported in [35] without any clear interpretation. Most of the spectra of the Fe-Co type show variously pronounced Fe2+ absorption bands in the NIR region, with intensities between those of RE25 (no absorption) and RE8 (pronounced absorption).
Another relevant type of spectra is related to the presence of copper. Examples are shown in Figure 3b, and almost all spectra of this type show a more or less pronounced absorption band of Cu2+. In addition to Cu2+, these spectra also show the absorption of Fe2+ (RE28) or Fe3+ (RE10 and 31). RE28 (other objects) is a noticeable exception, as it shows the Cu0 band, which justifies its red color.
RE10, one of the large-ring beads, shows the combination of Fe3+, Co2+, and Cu2+, although its color is perceived as similar to the other large-ring beads (Figure 2a).

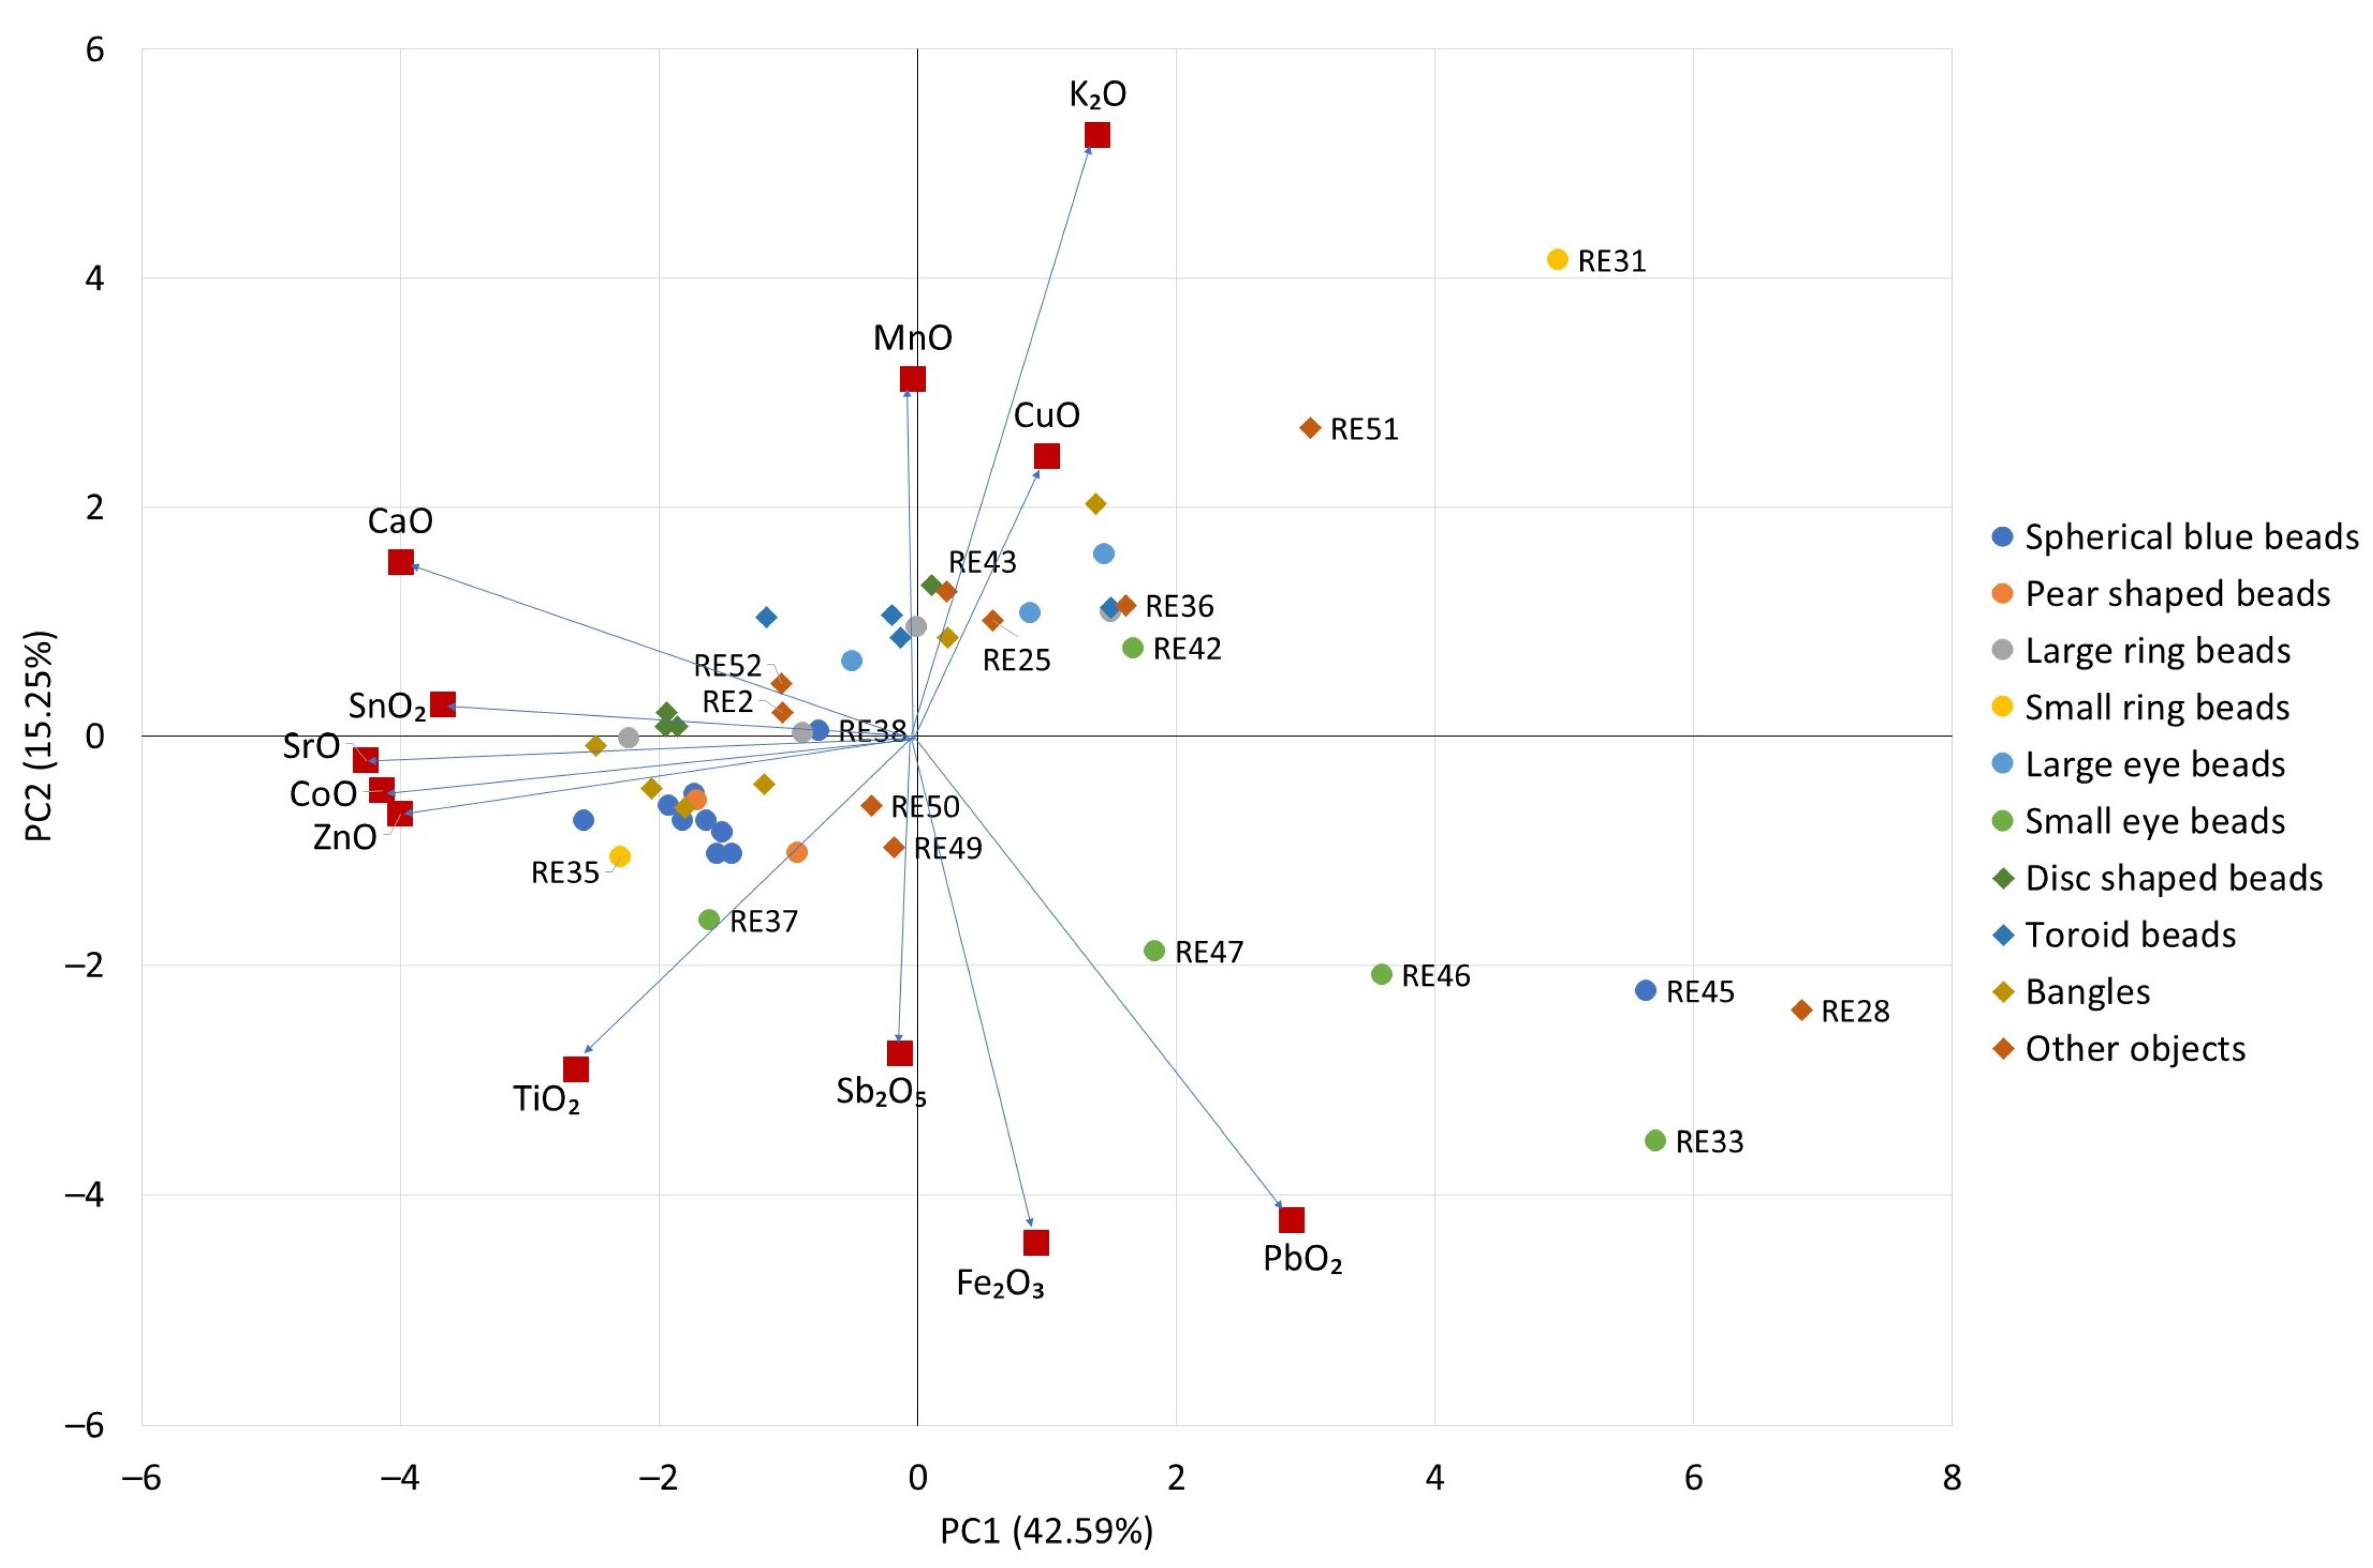
3.3. Portable X-ray Fluorescence Spectrometry (p-XRF)

It is generally accepted that, although the accuracy may not be ideal for other specific applications, p-XRF supports the classification of glass according to some major compositional differences, provided that an appropriate calibration is followed [29].
The results are reported in this section (and further discussed in Section 4), taking into account both the limitations of the approach and its strengths, without drawing conclusions that would go beyond the intrinsic issues of the collected dataset.
The data obtained here from the p-XRF analyses are reported in Table S2 (Supporting Information), subdivided according to the groups indicated in Section 2.1. The expected accuracy has been discussed in [29] and is reported in Table 2. The elements detected sporadically in a few analytical spots are not included in Table S2. In particular, vanadium was detected in RE9, the red part of RE11, RE14, and RE40; chromium was detected in RE9, RE14, RE40, and RE49; the white parts of RE29 and RE48; and the blue part of RE47; nickel was detected in RE43 and the white parts of RE14 and RE17; and zirconium was detected in RE2, RE26, RE46, and RE51. The first noticeable piece of information comes from K2O, which is mostly below 2% and higher only for a few samples without any obvious group distinction. RE51 (a pinhead of dark opaque glass, “other objects”) is notable in this regard for the high K2O concentration (7.6%).
CaO concentrations are in the 5–10% range. TiO2, Fe2O3, ZnO, and SrO were also detected rather systematically; they could have entered the batch as impurities of the raw materials, although amounts of Fe2O3 above 1% would suggest a deliberate addition for coloring purposes (or at least a deliberate selection of a silica source rich in iron). SnO, Sb2O5, and PbO are associated with the presence of white and yellow opacifiers.
The dataset is visualized in Figure 4 using a principal component analysis scatter plot, in which only data from the bulk glass were considered. Data from samples with light decorations could be influenced by the composition of these decorative elements (elevated SnO2, Sb2O5, and PbO2 values). This is due to the size of the analytical spot of the ELIO p-XRF instrument. All values below the LOQ were set to zero, and rows and columns of the data set were Z-score scaled prior to the calculation. Ten principal components were calculated, with the first two accounting for 57.84% of the explained variance (42.59% for PC1 and 15.25% for PC2). It can be seen that the negative part of PC1 is influenced by CaO, SnO2, SrO, CoO, and ZnO, and samples are stretched along PC1, with the majority of them showing negative scores on PC1. On the other hand, both large- and small-eye beads (Groups 5 and 6) tend to have positive scores on this PC. As already highlighted by their color and colorants, the two samples within the small-ring group (Group 4) are very different from a compositional point of view.
RE45, a round blue bead in Group 1, is an outlier within its group. The objects from the Reggio Emilia museum can be distinguished by two emerging trends that have different directions along the PC2, which is influenced by oxides such as MnO, CuO, Sb2O5, and Fe2O3, mostly related to color and opacity. In addition, K2O plays an important role in this PC. RE45, RE28, and most of the representatives of Group 6 are stretched within the bottom right quadrant (CaO–PbO2 axis) while large rings, large eyes, toroid beads, and bangles groups are stretched along the ZnO–CuO axis.

4. Discussion

In this section, we first discuss the data from the perspective of the typological groups, which provide the most directly accessible information, and then proceed to the full set of archaeological objects.

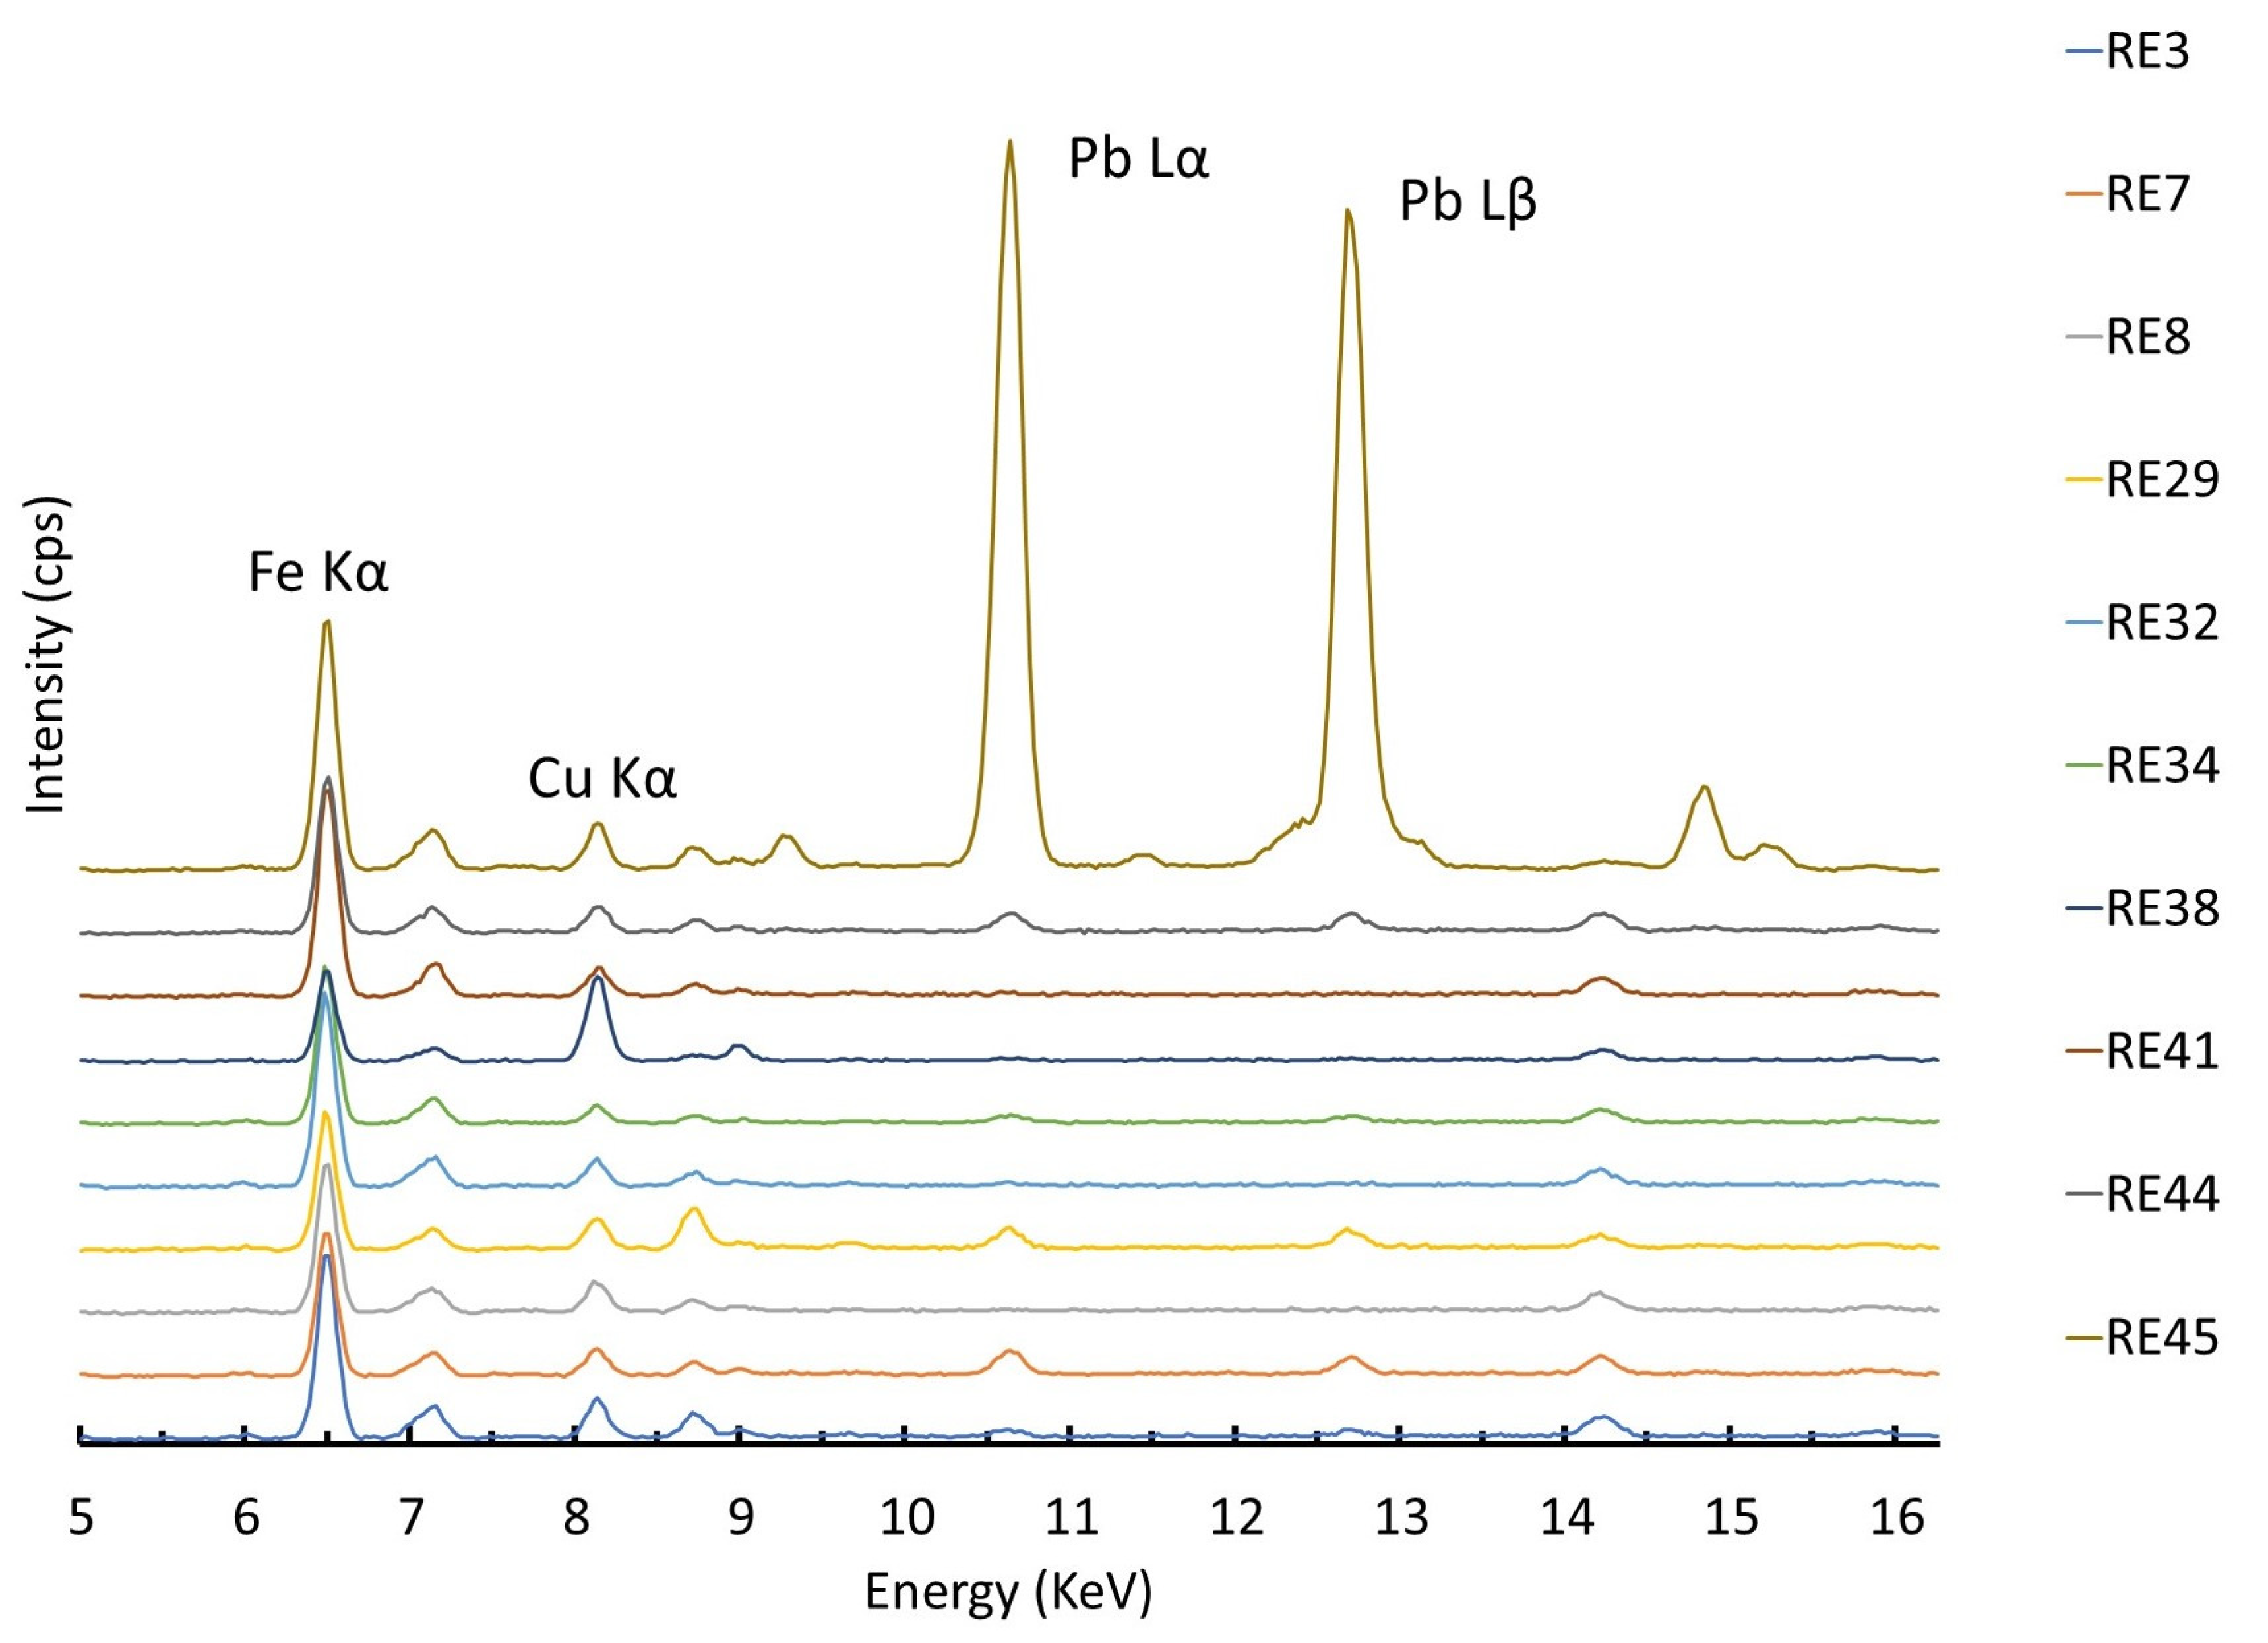
4.1. Group 1—Spherical Blue Beads

The color of these beads was achieved by Co2+ ions in tetrahedral coordination with non-bridging oxygen atoms [36], as suggested by the FORS spectra. p-XRF measurements confirmed the presence of cobalt. Only two samples within this group, namely RE38 and RE45, show CuO levels above the LOQ of the p-XRF instrument. In these samples, Cu2+ was not detected using FORS, indicating that copper was probably in the reduced state, as Co blue glasses would have required reducing conditions of the furnace [37,38], leading to the formation of Cu+, which does not significantly affect the color of the glass [39]. Given the similarity in composition, all the samples in this group, including those for which precise dating was not available, can be tentatively dated to the middle of the first millennium BCE.
In addition, RE45 contains a high amount of PbO2 (measured at 9.4%, which is only an indication of the actual value, as the calibration range of the instrument only extends to 3.13% PbO2) and a much lower amount of Sb2O5 (0.5%). If lead antimonate crystals were present in the glass matrix, the sample would likely be green, which is not the case (see Figure 2). Therefore, it is more plausible that this bead was produced by recycling Sb-containing glass without the intention of opacifying it with lead antimonate. A high amount of Pb can be attributed to the intentional addition to improve workability, or to glass recycling. However, this sample is significantly smaller than the other samples in the group and can therefore be distinguished from the other beads in the group both compositionally and typologically.
By comparing the p-XRF spectra of the other beads in this group (Figure 5), it is evident that trace amounts of copper are present in all the samples, although they are not reported in Table S2 because the amounts are below the threshold level set for reliable quantification. Lead is also present in trace amounts in several samples.
The source of cobalt in these beads can be deduced from its association with several other elements. Nickel was not detected (the absence of peaks at 7.48 KeV is shown in Figure 5). This prevents the association of these glasses with the Egyptian source of cobalt [40]. The correlation of zinc with cobalt is positive for all the samples in the group except RE29. Such an association could be indicative of the cobalt source, but the proximity of the data to the LOQ of the instrument does not allow for further speculation. The Iranian and European Erzgebirge/Krušnohoří mining regions are excluded as potential cobalt sources because the samples do not show arsenic and nickel associated with cobalt [41,42]. Also, the cobalt source employed in LMHK glass production in the Late Bronze Age in Italy, already documented in the Early Iron Age contexts [43], does not fit the compositional data due to the absence of the same type of association. It should be noted that the compositional approach used here, with the same p-XRF equipment and measurement conditions, has already allowed us to establish the origin of the color in another (and older) set of blue eye beads in Egypt [44]. For the present group of samples, a strong positive correlation between Fe2O3 and CoO (r = 0.82) can be seen in Figure 6. In addition, the presence of minor to trace amounts of copper and lead (Figure 5) would suggest that the source of cobalt could be the same as the still unknown source proposed for some Roman glass [45,46], although further analysis focusing on minor and trace elements would be necessary to support this hypothesis.

4.2. Group 2—Pear-Shaped Beads

These two samples seem to have a similar composition to those of Group 1, and we can extend the same hypothesis about the cobalt source given for the beads of Group 1 to the two pear-shaped beads in this group.
The glass for the white decoration in RE48 was probably colored with calcium antimonate, because of the high concentration of both CaO and Sb2O5 found in the white glass compared with the blue body of the bead. The content of these elements in relation to white or yellow opacifiers is shown in Figure 7. Sb-containing white decorations were usually applied as thin layers on top of the base glass; therefore, they may not be “infinitely thick” to allow for proper analysis with X-rays, causing the heavier element concentrations to be underestimated.

4.3. Group 3—Large-Ring Beads

According to the composition and the appearance of the four beads in this group, they can be further divided into three types. RE9 contains an elevated amount of MnO (4% is an indicative value beyond the calibration curve). This sample also has a detectable amount of CuO. Smaller amounts of Mn are present in all the other representatives of this group, and Mn shows a clear correlation with Fe2O3, along with the large-eye beads included in Group 5 (for both groups, r is 0.86). The much clearer glass RE10 contains less of the transition metals, although Co2+ was still detected with FORS. Finally, samples RE16 and 18 have less MnO and Fe2O3 than RE9 but more than RE10. They were also colored with Co2+, for which the same source as those suggested for Group 1 samples can be hypothesized. The distinguishing feature of RE9 is the yellow stripe, which does not appear to be an intentional decoration. p-XRF analysis shows that it may have been colored with lead stannate (due to the elevated tin and lead values). In this and other cases of yellow coloration, it is not possible to distinguish between Type I (Pb2SnO4) and Type II (PbSnO3) due to the excess of lead.

4.4. Group 4—Small-Ring Beads

RE31 and RE35 seem to be made of different glasses. They were colored with different chromophores: RE31 with Cu2+ and RE35 with Co2+, and, according to FORS data, Fe2+. p-XRF data confirm this difference and provide further information. RE31 has small amounts of tin in its composition, and the Sn/Cu mass ratio is close to 0.08, suggesting that bronze is the source of both elements in this sample [47]. On the other hand, the composition of RE35 would place this small-ring bead in Group 1.

4.5. Group 5—Large-Eye Beads

These beads tend to have elevated K2O concentrations, at 1.5–2%. In addition, MnO and Fe2O3 are correlated with Group 3 samples (r is equal to 0.86 for both groups), suggesting that these elements entered the batch from the same source, and therefore these two groups of samples can be placed in the same compositional frame. Cobalt is a primary chromophore for this group of samples, although calcium and, possibly, lead antimonate (suggested by the elevated CaO values, compared with the glass of the blue decoration, and the elevated PbO2 and Sb2O5 values compared with the rest of the samples in this group) also contributed to the pale green color of the body of RE39. As for the decorations, the blue decoration was produced through the application of Co-blue glass, whereas the yellow one (as for RE27 and RE40) was produced via the addition of lead antimonate, and the white one with calcium antimonate (Figure 7). The Pb-to-Sb ratio in the yellow decorations for all the samples is between 10 and 22, and the stoichiometric ratio for Pb2Sb2O7 is around 1.7; this indicates that lead was added in excess as oxide in the mixture with Pb2Sb2O7 (its correlation with antimony is very strong (r = 0.96)). The synthesis of Pb2Sb2O7 crystals probably occurred ex situ [48], and additional lead could help keep the crystals stable in the melt [49]. Based on the compositional evidence, the production of RE39 and RE40 can be tentatively dated to the end of the first millennium BCE–first century CE, similar to the date assigned to the beads of Group 3 and RE27 through archaeological inference.

4.6. Group 6—Small-Eye Beads

This heterogeneous group of samples is characterized by very different coloring techniques. The bodies of samples RE33 and RE46 were probably colored via the addition of lead antimonate, similar to the decorations in the previous group. FORS and XRF results for RE47 suggest that Cu2+ is the main chromophore in this glass. The opaque appearance is probably due to calcium antimonate crystals suspended in the glass matrix, as a significant amount of Sb2O5 was detected, although the CaO values are not too high compared with other samples. All of the above samples have similar decorations of alternating white and blue layers that form the stratified eyes. The white parts were realized via the addition of calcium antimonate, as indicated by the increased amounts of CaO and Sb2O5 (Figure 7). The blue beads are Co2+-colored (FORS and XRF evidence). Samples RE37 and RE42 have different colors of the body (colored with Co2+, which is associated with iron and traces of copper and lead, as shown in the XRF spectra similar to those reported in Figure 5). Their white parts were not accessible to the p-XRF equipment and were not analyzed.

4.7. Group 7—Disc-Shaped Beads

These beads are characterized by the apparent absence of colorants, the presence of MnO associated with Fe2O3 (r = 0.92), and the presence of Sb2O5 (in RE4, RE5, and RE6). The spectral features observed with FORS suggest that Fe3+ is the main chromophore in this group of samples. Mn2+ could also contribute to the spectra, as its absorption maxima coincide with those of Fe3+. Perhaps these glasses were decolorized with antimony, although this element could be related to the thin bright yellow elements within the glass matrix (perhaps colored by lead antimonate). Manganese may also have a decolorizing function in these glasses, although its low concentration (which is consistently higher than that of iron) would indicate a natural abundance of Mn- and Fe-containing minerals in the silica source. The absorption at 600 and 650 nm observed in other glasses [35] remains unexplained. These beads are more recent than the rest of the set [21] and are an example of the glass industry’s simultaneous progress in glass decolorization processes [34].

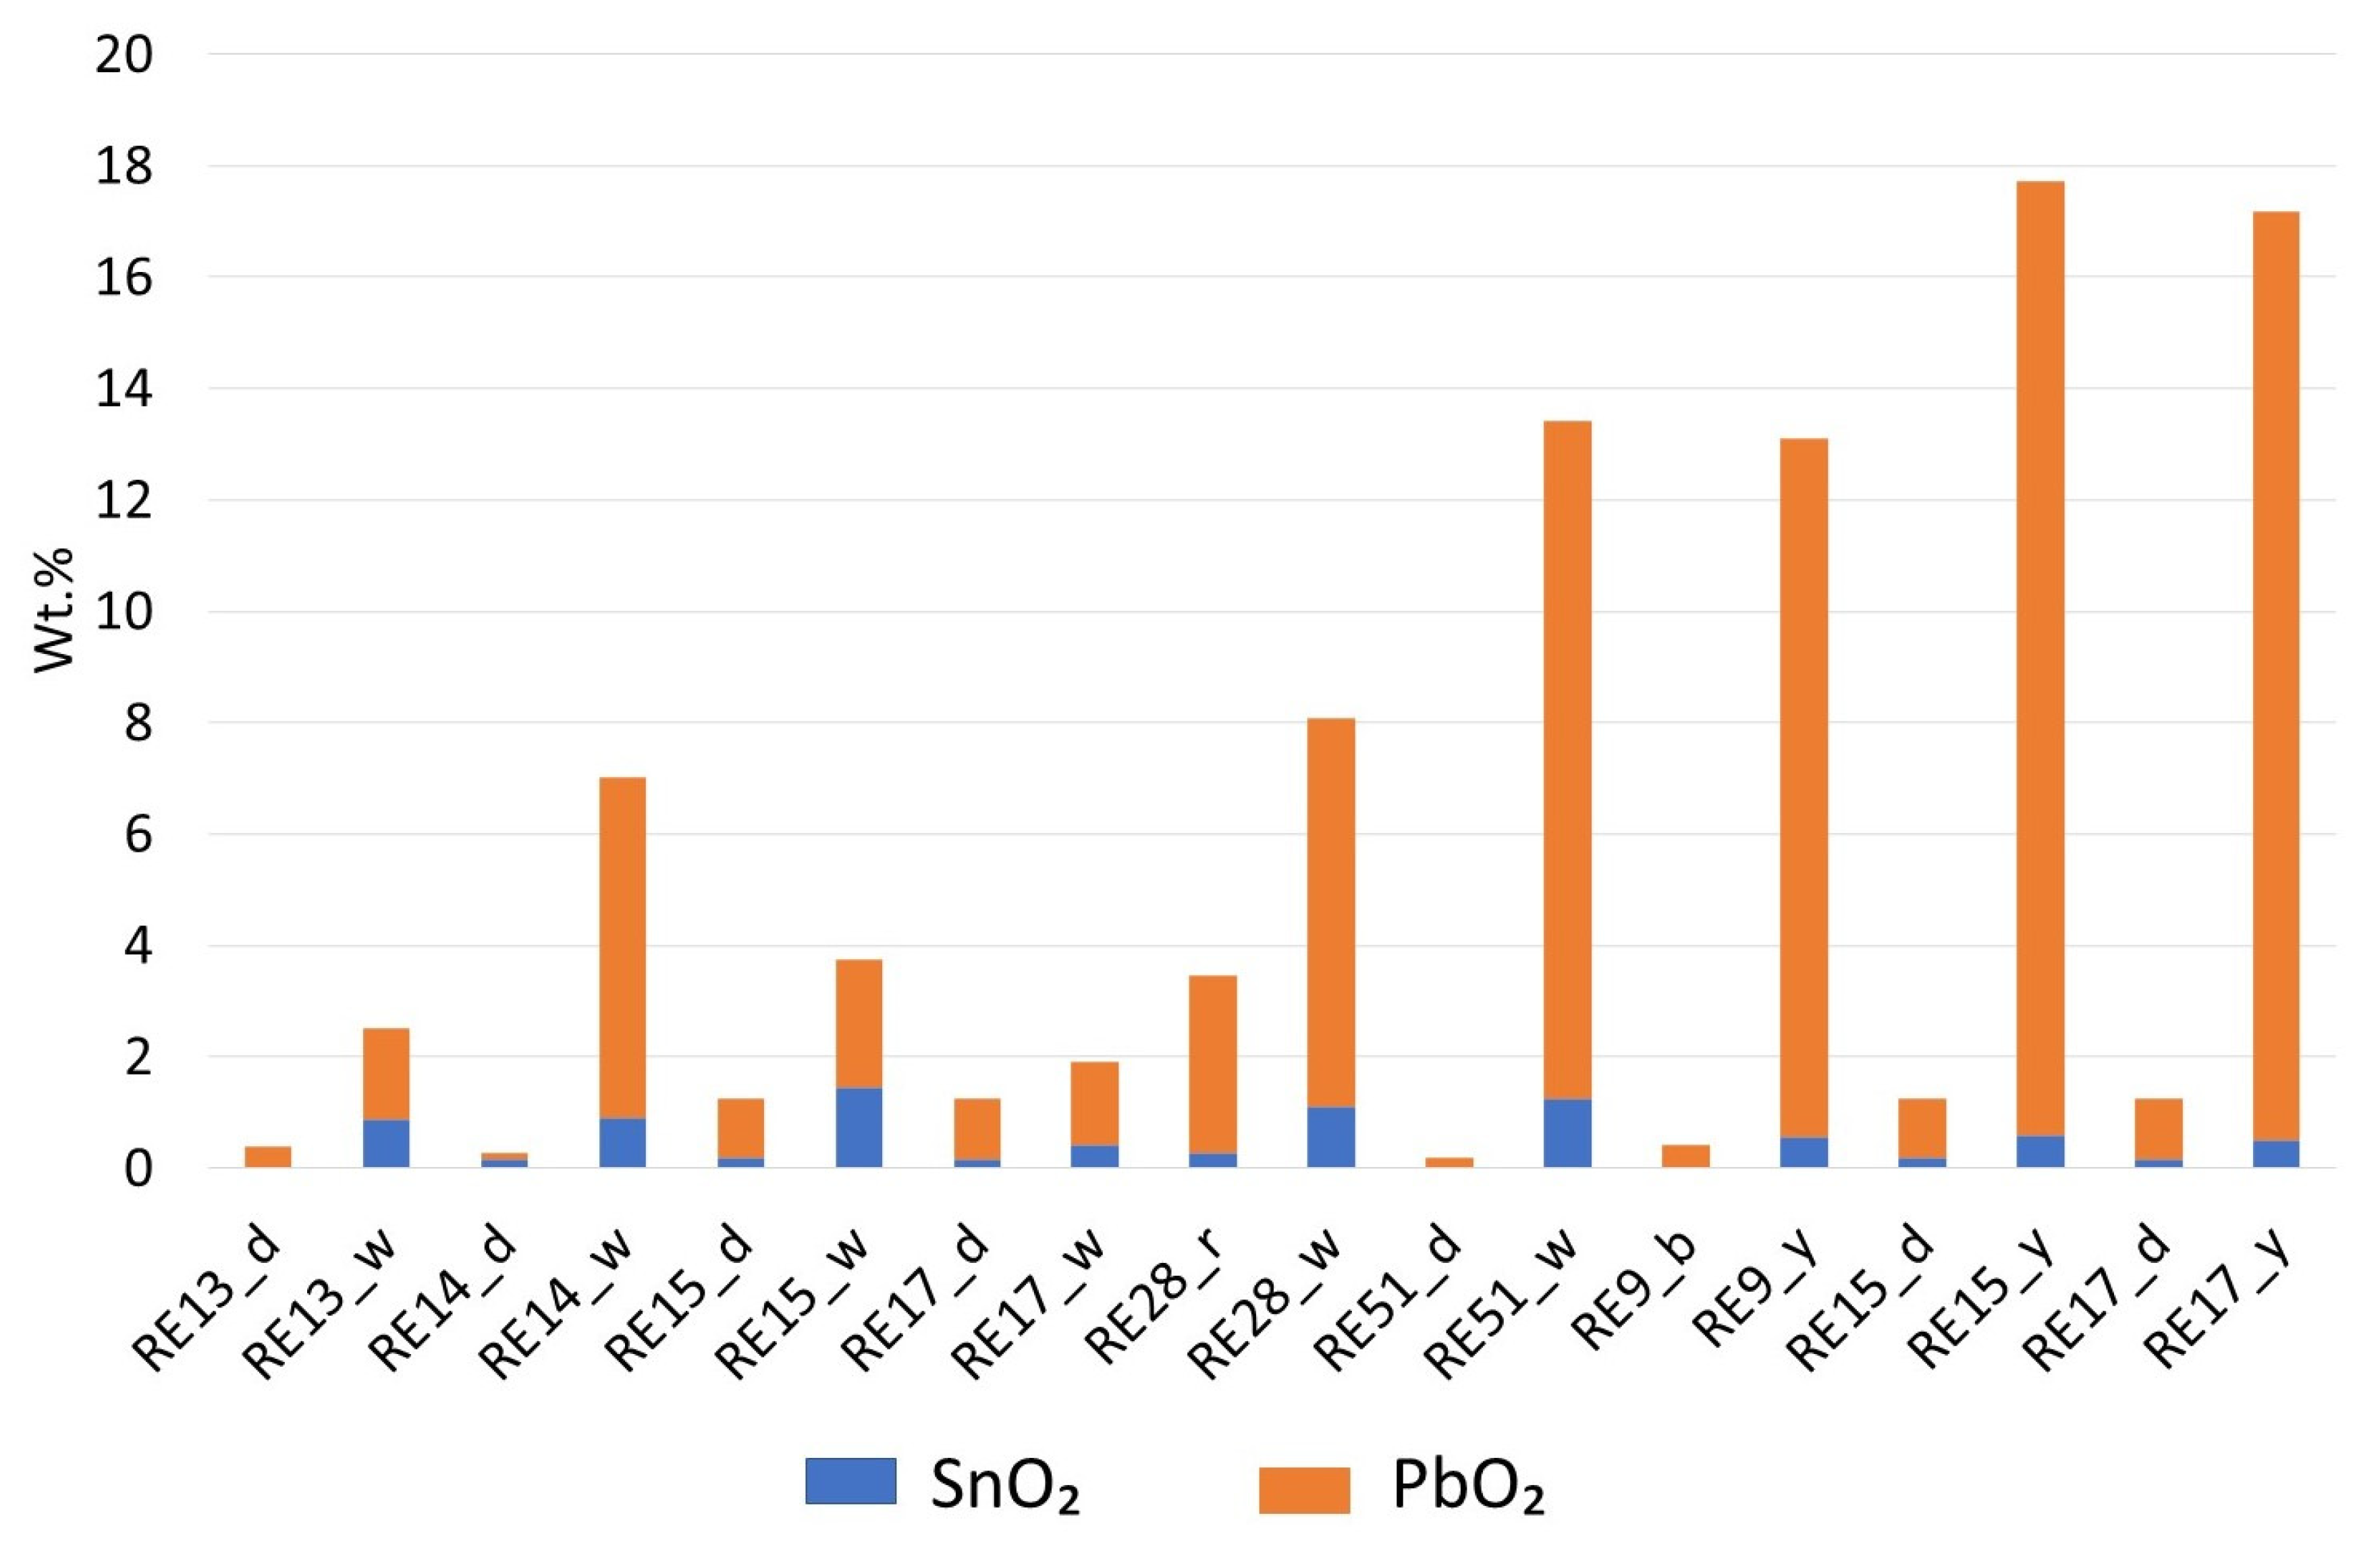
4.8. Group 8—Toroid Beads

The base glass in these beads was colored with Co2+ and Fe2+. Unlike in the previous group, high Fe2O3 levels are not associated with high MnO levels. Comparable concentrations of Fe2O3 and MnO have been found in other contemporary Co-blue objects by Roman glass makers and have been interpreted as the intentional addition of manganese compounds [50,51]. Therefore, a difference from the older glasses (such as those in Group 1) is noted. Groups 3, 5, and 7 (which are also attributed to the Roman period) tend to contain detectable amounts of MnO. This is evidence of the technological change mentioned in Section 4.7. The fact that at least some of these beads belong to a different (Celtic) glassworking tradition, which also includes large-eye beads and bangles, gives the opportunity to speculate on differences in glass supply for different glassworking sites. More robust and detailed compositional data should be obtained to significantly contribute to this discussion.
The opaque appearance could be achieved via the addition of a small amount of tin oxide or lead stannate (SnO2 levels are near the LOQ, and PbO2 concentration is also low and could be interpreted as resulting from the abundant yellow and white decorations). RE13 stands out in this picture, as no SnO2 was detected. This sample and RE17 have Mn/Fe ratios similar to that found for the samples in Groups 3, 5, and 7. White decorations contain significant amounts of SnO2 and PbO2 (Figure 8). In yellow decorations, the Pb/Sn ratio is higher. Lead–tin calx has been used to make white and yellow glass in Europe since the second century BCE, and the Pb and Sn ratio in the calx was critical in adjusting the final color. Values below 3.5 result in tin oxide opaque white glass [52,53]. Such values were determined for RE13, RE15, and RE17 (in white parts). The white glass in RE14 has a Pb/Sn ratio of 6.9, but it is still much lower than in the yellow parts of RE9, RE15, and RE17 (ranging from 22.3 to 33.5). With such a range of ratios in the yellow parts, we can assume that here, the formation of the lead stannate was achieved with calx, and then the compounds were added to the batch. Unfortunately, the p-XRF results do not allow us to further discuss the technological aspects of the opacifier production technology [52,53].

4.9. Group 9—Bangles

The FORS spectra of this group of samples typically show strong absorption in the interval from 500 to 700 nm, and p-XRF analysis revealed one of the highest CoO concentrations in the set. Such concentrations made the samples quite dark (see RGB values in Figure 2), preventing adequate reflection of the visible light and reducing the quality of the FORS data. It is possible that the cobalt in these glasses (except RE20 and 26) originated from different sources (Figure 6), although this assumption is solely based on the Co/Fe ratio. The lower amount of Fe2O3 can also be explained by the use of a purer silica source. This is not the case for RE20, where no CoO was detected in the glass, as it is likely that the color of the bulk of this sample is caused by Fe3+ ions. White and yellow decorations were colored with calcium antimonate and lead antimonate, respectively.

4.10. Other Objects

Each sample in this heterogeneous set deserves its own discussion.
RE2 could have been made from Co-Cu glass, as both elements were detected via p-XRF. RE25, on the other hand, is Co-blue glass, and the Sb2O5 amount of 0.2% suggests some recycling. RE28 was colored with Cu0 crystals in the matrix. The PbO2 concentration in this sample is quite high but insufficient to argue that copper is present in the form of dendritic crystals of cuprite. Instead, the high amounts of Fe2O3, SnO2, and Sb2O5 suggest that copper might be present in the form of microcrystals dispersed in the matrix [54]. The role of tin and antimony could also be that of opacifiers. Tin and lead play a crucial role in the color of the white to pale-green decoration on this bead. RE36, apart from a small amount of Cu (detected via FORS and p-XRF, although below the p-XRF’s LOQ), has a high concentration of MnO (4.5% is an indicative value, as it is above the calibration range of the instrument). Together with iron, manganese is responsible for the dark brown color of this sample.
RE43 appears to be colored with cobalt and possibly iron, as both elements showed high concentrations in the XRF analysis.
The composition of RE49, and the detected colorants, link this sample to the Mediterranean Group 1 glass, which from a compositional point of view supports the attribution based on the shape and decoration of the original object [6]. The sky-blue decoration color was produced by introducing Cu2+ ions together with calcium antimonate crystals. The yellow decoration was colored with lead antimonate.
RE50, like many blue and white samples, was colored with Co2+ and its white part owes its color to calcium antimonate (Figure 7).
RE51, on the other hand, belongs to the minority of objects (Group 8, as well as RE9 and RE28) whose sources of light color decoration were lead and tin compounds. The base color of this sample is apparently caused by Co2+, as suggested by its FORS spectrum. Iron ions may have also contributed to the final color.

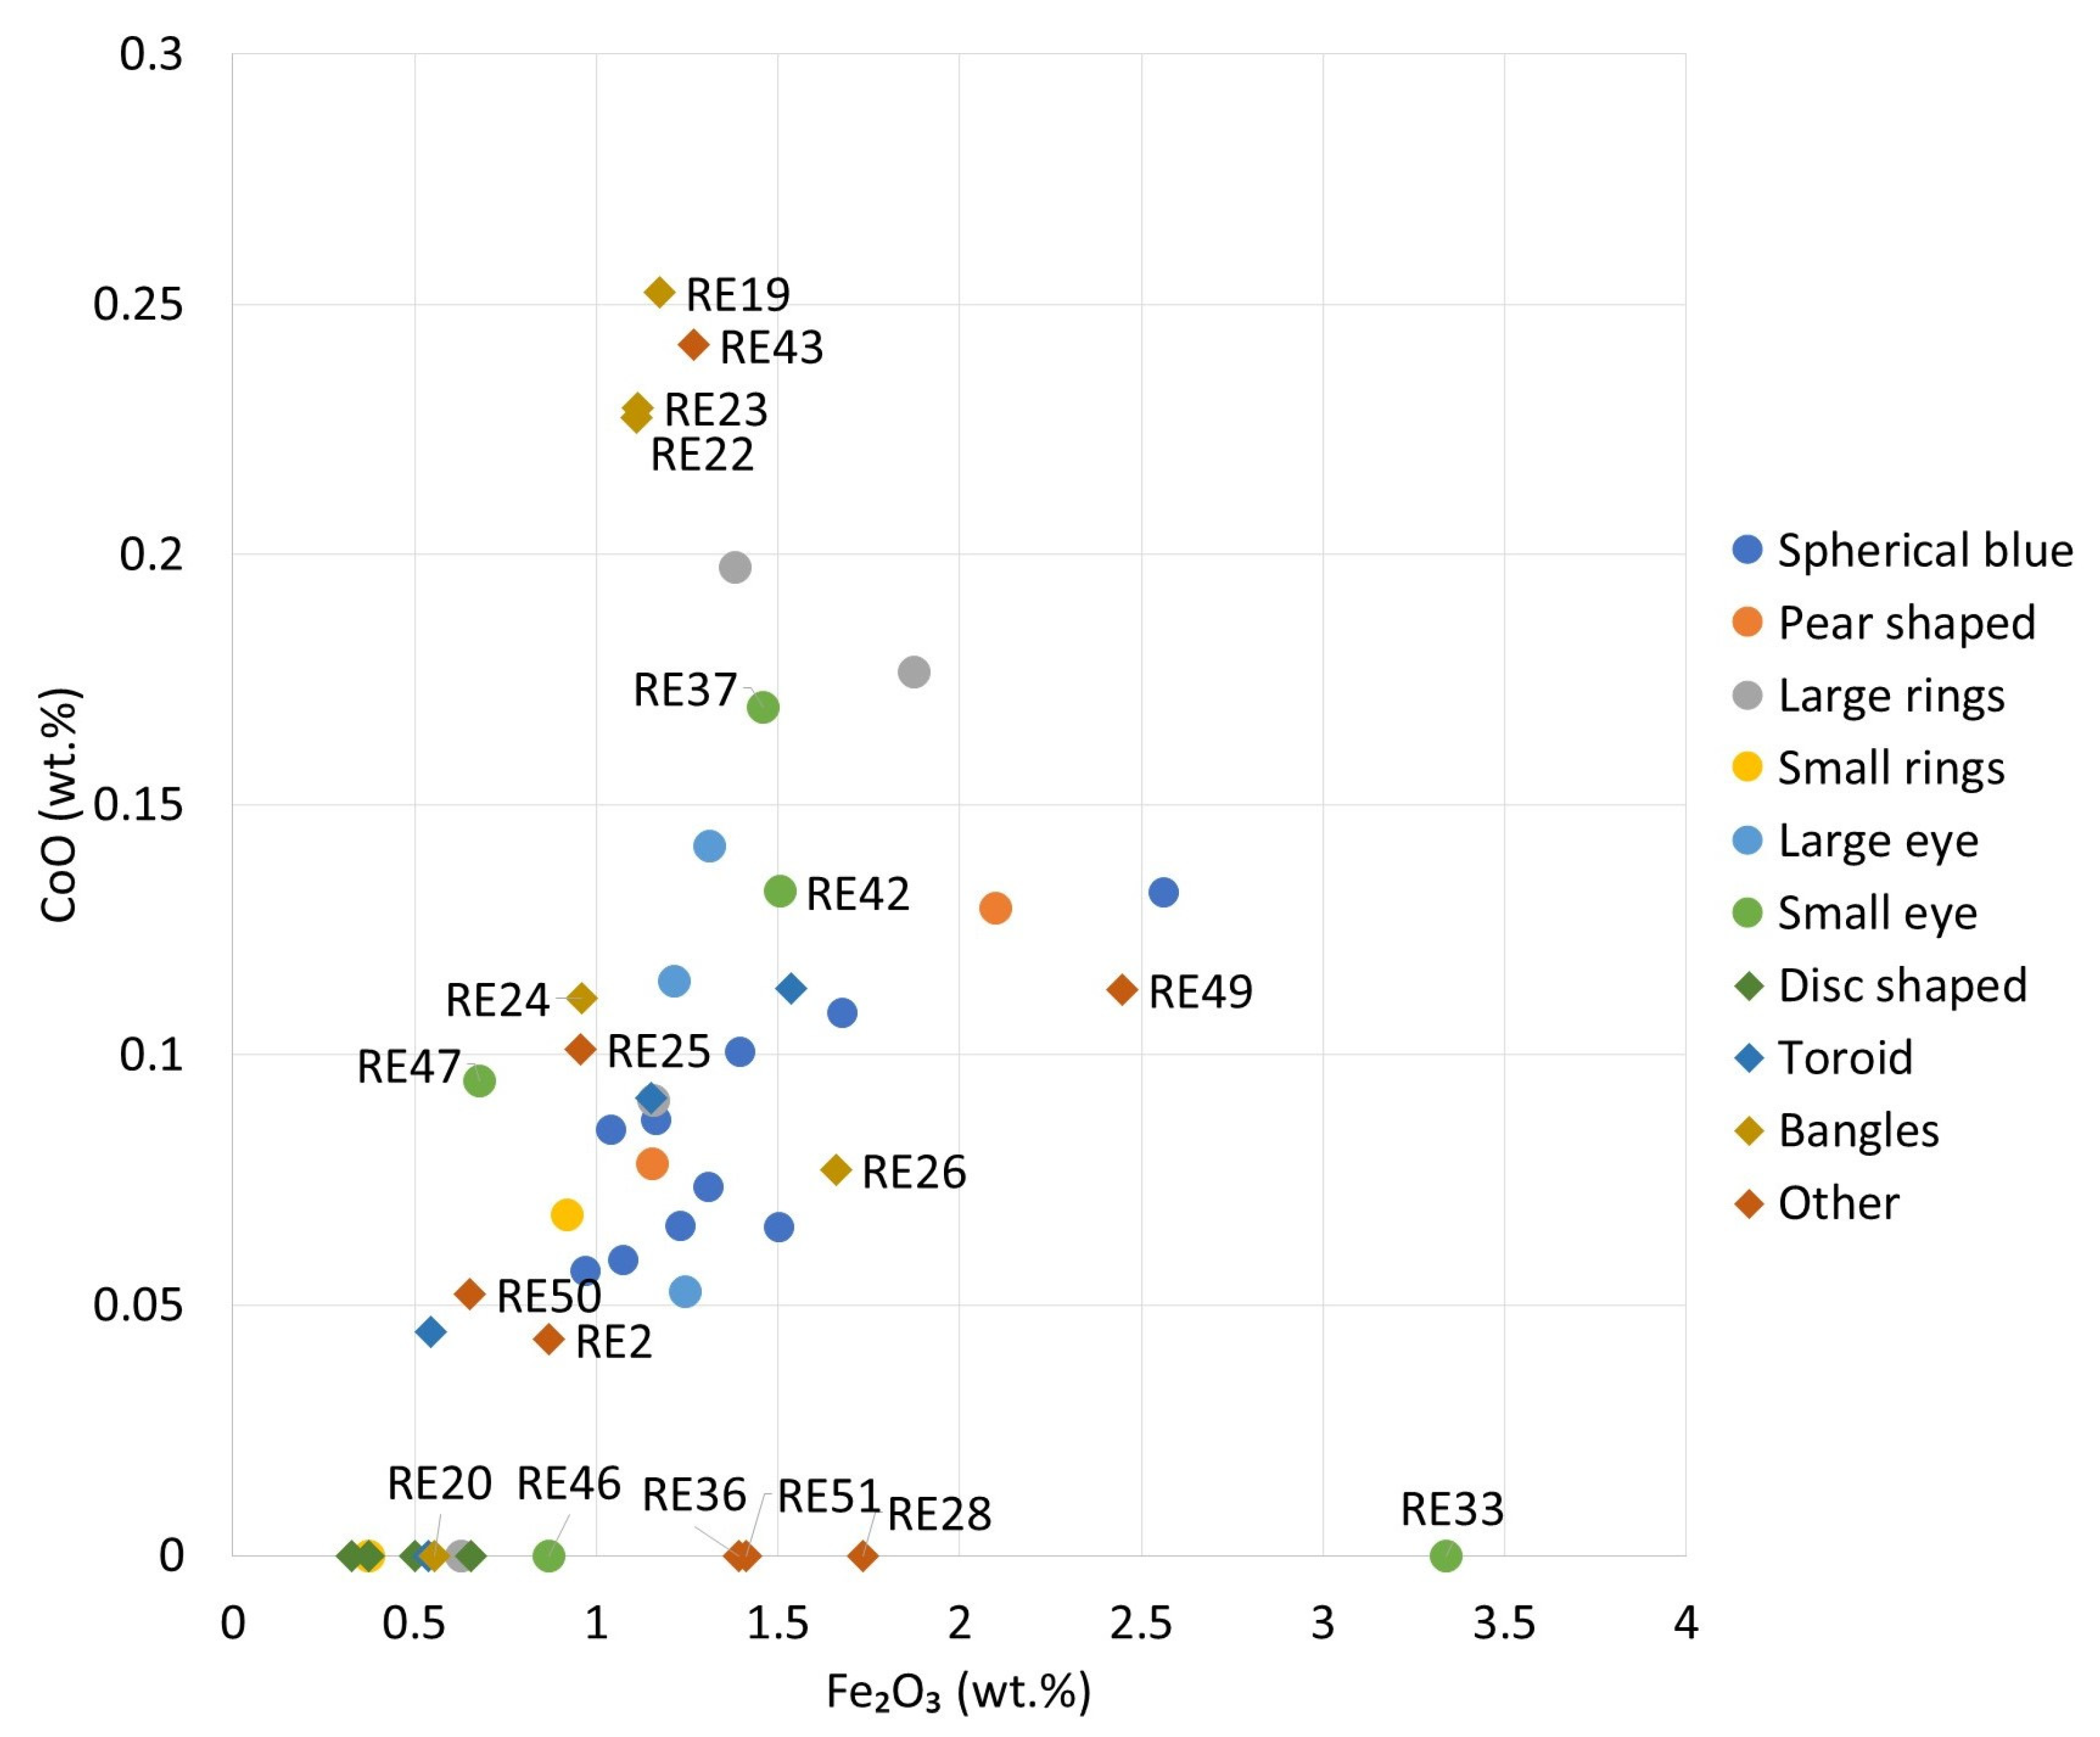
4.11. General Observations Across Groups

Cobalt is the main colorant in the objects included in this study (Groups 1, 2, and most of the objects in Groups 3, 5, 8, and 9), and compositional inferences point to the same raw materials as those used in coeval or later Mediterranean glasses [45,46]. They are different from those used in the Late Bronze Age and Early Iron Age, which have a different chemical signature [43,44]. However, the set of samples considered here also showed alternative ways of producing blue glass, such as by combining copper with cobalt.
The light-colored objects or (in most cases) their decorative parts were made with the addition of opacifying compounds (calcium and lead antimonates, lead and antimony stannates). It is interesting to note a possible relationship between white and yellow opacifiers and the age of the objects. Samples from the older contexts (dated to the middle of the first millennium BCE), such as Group 1 and 6, tend to rely on the presence of antimonates, while the more recent objects, starting from the second century BCE, may contain either antimony or tin compounds. This evidence can be a first indication. However, the beginnings of this transition in the area would be better traced by extending the number of objects analyzed.
A peculiar division can be observed by plotting CaO against SrO values (Figure 9). A strong cross-group correlation was observed between these two oxides, with 0.83, as Sr is a common substituent of Ca atoms in various materials, and most of the samples follow a single trend line. However, Groups 1, 2, 6, and 9, and most of the samples from the “other objects” group tend to have less CaO (and also SrO) in their composition than Groups 3, 5, 7, and 8, which usually have more than 8% of CaO (samples of these groups also usually have more MnO). Such a division is marked by a dotted line in Figure 9, although we cannot speak of two clusters, and such a division is only indicative. The samples in Group 4 (small-ring beads) are divided, with RE31 belonging to the low-Ca range and RE35 to the high-Ca one. This result is not surprising, since these samples are also distinguished by their colorants. RE43 (other objects) is the only representative of its part of the assemblage that belongs to the high-Ca range. The low-Ca range corresponds to the Levantine II compositional group of ancient glass and the high-Ca range to the Levantine I one. However, the peak production of the Levantine group glasses occurred in Late Antiquity [8,55], although glasses with comparable lime content occur elsewhere in similar contexts [50]. Since the pre-Roman times in the area, high-Ca contents have been associated with both the use of plant ash and the use of a mineral flux [56,57]. Groups 5 and 8 show elevated potash contents. These beads may have been made from plant ash glass, although further analyses aimed at quantifying light elements are required to identify the raw material for fluxing the silica. Nevertheless, the results for K2O and CaO suggest, if not a different origin, at least a different formula for raw glass.
Samples with K2O below the LOQ are assumed to have been prepared using mineral evaporites, such as natron, to flux the silica. On the other hand, K2O above the LOQ (>1.2% wt. oxide) was found in a smaller portion of the sample set and indicates the use of plant ash as the alkali source.
Samples with elevated K2O content are present in virtually all groups without forming any obvious pattern. For these samples, the K2O content is within 2%, which does not allow us to exclude the possibility that an evaporitic flux source was used, although plant ash glasses are known from the Early Iron Age in central Italy [43]. In fact, plant ash is not the only source of potassium in glass, as this element can also come from the silica source, glass alteration [58], or glass recycling [59].
For the few samples with K2O content above 2%, namely RE24 (bangles), RE42 (small-eye beads), and RE43 and RE51 (other objects), it can be assumed that plant ash was used in the preparation of the glass batch.

5. Conclusions

Glasses from various personal ornaments in the Civic Museums of Reggio Emilia, Italy, show a wide range of colors, which were characterized beyond their visual appearance. It was found that most of the objects owe their color to cobalt, with copper and iron ions playing a role in the final color of some samples.
The relative concentrations calculated for several key elements allowed some conclusions to be drawn about the origin of the raw materials used to introduce the colorants, distinguishing them from those found in the Late Bronze Age and in other Early Iron Age glasses, for which a comparison was possible thanks to the common analytical procedures and equipment [43,44]. For example, the set of elements that were found to be in association with cobalt (partially iron, copper, and lead) indicates a specific raw material source common to many coeval Mediterranean glasses.
It is interesting to note that the yellow and white decorative elements were divided into those colored with Sb-containing crystals and those colored with Sn-containing compounds, highlighting a transition from antimonate to stannate that may have started as early as the second century BCE.
Data on potassium and calcium concentrations suggested some differences in the primary glass recipes, some of which could be interpreted as glass recycling. In general, the elemental data highlighted some compositional similarities between different typological groups and allowed for the differentiation of some objects within the same typological cluster based on their composition, thus increasing our knowledge of the collection of glass finds of the second half of the first millennium found in the Reggio Emilia area.
Even if the information provided by such a non-invasive screening process was significant, further laboratory analyses, at least on a limited set of representative samples, would be beneficial to make the present conclusions more robust or to deepen the level of insight into production technologies and raw glass provenance in the area. Therefore, this work represents a first step that will hopefully stimulate the production of new data that will allow the possibility of comparing data from different sources. This will open new possibilities to draw conclusions about the glass supply in the region. Further typological work combined with archaeometric data can contribute to the knowledge of different glassworking traditions, providing the opportunity to better interpret the place of glass in past societies.

Supplementary Materials

The following supporting information can be downloaded at: https://www.mdpi.com/article/10.3390/heritage6070294/s1, Table S1: Some details on the Iron Age glass finds of the “Gaetano Chierici” collection at the Civic Museums of Reggio Emilia (Italy). Table S2: p-XRF data.

Author Contributions

Conceptualization, O.Y., C.I. and M.G.; methodology, O.Y., G.F., M.M., A.R. and A.L.G.; validation, O.Y. and M.G.; formal analysis, O.Y. and G.F.; investigation, O.Y., G.F. and M.M.; resources M.M., A.R. and A.L.G.; data curation, O.Y.; writing—original draft preparation, O.Y.; writing—review and editing, C.I. and M.G.; visualization, O.Y.; supervision, C.I. and M.G.; project administration, M.G.; funding acquisition, O.Y. and M.G. All authors have read and agreed to the published version of the manuscript.

Funding

This research was funded by the European Commission H2020-MSCA, grant number 754511. M.G. acknowledges the support of the Università degli Studi di Torino, Fondo Ricerca Locale 2020.

Data Availability Statement

Part of the data presented in this study are available as Supplementary Information. The rest of the data will be provided upon request to the corresponding authors.

Acknowledgments

The authors express their deepest gratitude to the administration of the Musei Civici di Reggio Emilia for providing access to the collection and organizing analytical sessions, especially to the director, Valentina Galloni, and the curator of the archaeological collections, Giada Pellegrini.

Conflicts of Interest

The authors declare no conflict of interest. The funders had no role in the design of the study; in the collection, analyses, or interpretation of data; and in the writing of the manuscript. They also had no role in the decision to publish the results. The contents of this paper are the sole responsibility of the authors.

References

  1. Henderson, J. Ancient Glass: An Interdisciplinary Exploration; Cambridge University Press: Cambridge, UK, 2013. [Google Scholar] [CrossRef]
  2. Rotroff, S.I. The introduction of the moldmade bowl revisited: Tracking a Hellenistic innovation. Hesperia J. Am. Sch. Class. Stud. Athens 2006, 75, 357–378. [Google Scholar] [CrossRef]
  3. Cosyns, P.; Nys, K. Core-Formed Glass Vessels on Cyprus Reconsidered. In Proceedings of the POCA: Postgraduate Cypriot Archaeology Conference, Nicosia, Cyprus, 18–21 October 2007; p. 231. [Google Scholar]
  4. Licenziati, F. The Techniques and Materials of Hellenistic Mosaics with a Special Focus on the Vitreous Materials of the Mosaics from Delos (Greece). In The Narnia Project; Kassianidou, V., Dikomitou-Eliadou, M., Eds.; The Narnia Project and the Archaeological Research Unit, University of Cyprus: Nicosia, Cyprus, 2014; pp. 172–182. [Google Scholar]
  5. Larson, K.A. From Luxury Product to Mass Commodity: Glass Production and Consumption in the Hellenistic World. Ph.D. Thesis, University of Michigan, Ann Arbor, MI, USA, 2016. [Google Scholar]
  6. Panighello, S.; Orsega, E.F.; van Elteren, J.T.; Šelih, V.S. Analysis of polychrome Iron Age glass vessels from Mediterranean, I., II, III groups by, LA-ICP-MS. J. Archaeol. Sci. 2012, 39, 2945–2955. [Google Scholar] [CrossRef]
  7. Rolland, J. Tracing the skills and identifying masterpieces in Celtic glass-making: Specialization through Haevernick group 15 glass bracelets. In Stories That Made the Iron Age. Studies in the Iron Age Archaeology Dedicated to Natalie; Venclová, J., Kysela, A., Danielisová, J., Militký, Eds.; Institute of Archaeology of the Czech Academy of Sciences, Charles University, Faculty of Arts: Prague, Czech Republic, 2017; pp. 101–109. [Google Scholar]
  8. Degryse, P. Glass Making in the Greco-Roman World: Results of the ARCHGLASS Project; Leuven University Press: Leuven, Belgium, 2014; p. 190. [Google Scholar] [CrossRef] [Green Version]
  9. Sassatelli, G.; Govi, E.; Turfa, J.M. Etruria on the Po and the Adriatic Sea. The Etruscan World; Turfa, J.M., Ed.; Routledge: London, UK, 2013; pp. 281–300. [Google Scholar] [CrossRef]
  10. Boaro, S.; Facchin, A. L’area della necropoli “etrusca” di Remedello Alcune Considerazioni Alla Luce Della Relazione Del Bandieri Contenuta Nel Fondo Pigorini Dell’università Di Padova in 150 Anni Di Preistoria E Protostoria in Italia; Guidi, A., Ed.; Istituto italiano di preistoria e protostoria: Florence, Italy, 2014; pp. 872–877. [Google Scholar]
  11. Holliday, P.J. Celtomachia: The representation of battles with Gauls on Etruscan funerary urns. Etruscan Stud. 1994, 1, 23–45. [Google Scholar] [CrossRef]
  12. Tirabassi, I. Antichissima Bismantova. Il Sito Pre-Protostorico Di Campo Pianelli. 150 Anni Di Ricerche. Catalogo Della Mostra, Reggio Emilia, 19 Aprile–2 Novembre 2014; CARSA Edizioni: Pescara, Italy, 2014; p. 48. [Google Scholar]
  13. De Marinis, R. Gli Etruschi a nord del Po; Campanotto: Mantova, Italy, 1988; Volume 1, p. 299. [Google Scholar]
  14. Scheeres, M.; Knipper, C.; Hauschild, M.; Schönfelder, M.; Siebel, W.; Vitali, D.; Pare, C.; Alt, K.W. Evidence for “Celtic migrations”? Strontium isotope analysis at the early La Tène (LT B) cemeteries of Nebringen (Germany) and Monte Bibele (Italy). J. Archaeol. Sci. 2013, 40, 3614–3625. [Google Scholar] [CrossRef]
  15. Zamboni, L. Frontiers of the Plain: Funerary Practice and Multiculturalism in Sixth Century BC Western Emilia. In Burial and Social Change in First-Millennium BC Italy: Approaching Social Agents; Perego, E., Scopacasa, R., Eds.; Oxbow: Oxford, UK, 2016; pp. 197–225. [Google Scholar]
  16. Sestieri, A.M.B. Italy in Europe in the Early Iron Age. Proc. Prehist. Soc. 1997, 63, 371–402. [Google Scholar] [CrossRef]
  17. Becker, H. Economy 580–450 BCE. In Etruscology; Naso, A., Ed.; Walter de Gruyter GmbH & Co. KG: Berlin, Germany, 2017; Volume 1, pp. 1013–1030. [Google Scholar] [CrossRef]
  18. Damiani, I.; Maggiani, A.; Pellegrini, E.; Saltini, A.C.; Serges, A. L’età del Ferro nel Reggiano: I Materiali Delle Collezioni dei Civici Musei di Reggio Emilia; Comune di Reggio Emilia: Reggio Emilia, Italy, 1992; p. 364. [Google Scholar]
  19. Haevernick, T.E. Glasperlen der Vorroemischen Eisenzeit; Wissenschaftliche Buchgesellschaft: Mainz, Germany, 1983; p. 178. [Google Scholar]
  20. Haevernick, T.E.; Hahn-Weinheimer, P. Die Glasarmringe und Ringperlen der Mittel-und Spätlatènezeit auf dem europäischen Festland. Römisch-Germanische Kommission, Deutsches Archäologisches Institut. Bonn. Jahrbücher 1960, 161, 500–503. [Google Scholar]
  21. Guido, M. The Glass Beads of the Prehistoric and Roman Periods in Britain and Ireland; Society of Antiquaries of London: London, UK, 1978; p. 294. [Google Scholar]
  22. Ambrosetti, G.; Macellari, R.; Malnati, L. Vestigia Crustunei: Insediamenti Etruschi Lungo il Corso del Crostolo. Comune Di Reggio Emilia, Assessorato Alle Istituzioni Culturali, Civici Musei, in Collaborazione Con La Soprintendenza Archeologica Dell’emilia Romagna; Comune di Reggio Emilia: Reggio Emilia, Italy, 1990; 269p. [Google Scholar]
  23. Koch, L.C. Früheisenzeitliches Glas und Glasfunde Mittelitaliens: Eine Übersicht von der Villanovazeit bis zum Orientalizzante und Eine Analyse der Glasperlen Als Grabbeigabe des Gräberfeldes Quattro Fontanili in Veji; Leidorf: Rahden, Germany, 2011; p. 254. [Google Scholar]
  24. Bertini, M.; Mokso, R.; Krupp, E.M. Unwinding the spiral: Discovering the manufacturing method of Iron Age Scottish glass beads. J. Archaeol. Sci. 2014, 43, 256–266. [Google Scholar] [CrossRef]
  25. Ivleva, T. Romano-British glass bangles. Rom. Finds Group Datasheet 2018, 9, 1–6. [Google Scholar]
  26. Myers, R.D. Colorchecker Passport Technical Review. In Robin Myers Imaging; 2010; pp. 1–10. Available online: https://chromaxion.com/information/ColorChecker_Passport_Technical_Report.pdf (accessed on 10 July 2023).
  27. Rueden, C.T.; Schindelin, J.; Hiner, M.C.; DeZonia, B.E.; Walter, A.E.; Arena, E.T.; Eliceiri, K.W. ImageJ2: ImageJ for the next generation of scientific image data. BMC Bioinform. 2017, 18, 529. [Google Scholar] [CrossRef] [Green Version]
  28. Solé, V.A.; Papillon, E.; Cotte, M.; Walter, P.; Susini, J. A multiplatform code for the analysis of energy-dispersive X-ray fluorescence spectra. Spectrochim. Acta Part B At. Spectrosc. 2007, 62, 63–68. [Google Scholar] [CrossRef]
  29. Yatsuk, O.; Ferretti, M.; Gorghinian, A.; Fiocco, G.; Malagodi, M.; Agostino, A.; Gulmini, M. Data from Multiple Portable XRF Units Their Significance Anc. Glass Studies. Molecules 2022, 27, 6068. [Google Scholar] [CrossRef]
  30. Simonot, L.; Hébert, M.; Mazauric, S.; Hersch, R.D. Assessing the proper color of translucent materials by an extended two-flux model from measurements based on an integrating sphere. In Proceedings of the IS&T International Symposium on Electronic Imaging, Burlingame, CA, USA, 29 January–2 February 2017; pp. 48–56. [Google Scholar] [CrossRef] [Green Version]
  31. Möncke, D.; Papageorgiou, M.; Winterstein-Beckmann, A.; Zacharias, N. Roman glasses coloured by dissolved transition metal ions: Redox-reactions, optical spectroscopy and ligand field theory. J. Archaeol. Sci. 2014, 46, 23–36. [Google Scholar] [CrossRef]
  32. Micheletti, F.; Orsilli, J.; Melada, J.; Gargano, M.; Ludwig, N.; Bonizzoni, L. The role of IRT in the archaeometric study of ancient glass through XRF and FORS. Microchem. J. 2020, 153, 104388. [Google Scholar] [CrossRef]
  33. Jackson, C.M. Making colourless glass in the Roman period. Archaeometry 2005, 47, 763–780. [Google Scholar] [CrossRef]
  34. Silvestri, A.; Molin, G.; Salviulo, G. The colourless glass of Iulia Felix. J. Archaeol. Sci. 2008, 35, 331–341. [Google Scholar] [CrossRef]
  35. Babini, A.; Green, P.; George, S.; Hardeberg, J.Y. Comparison of Hyperspectral Imaging and Fiber-Optic Reflectance Spectroscopy for Reflectance and Transmittance Measurements of Colored Glass. Heritage 2022, 5, 1401–1418. [Google Scholar] [CrossRef]
  36. Dondi, M.; Ardit, M.; Cruciani, G.; Zanelli, C. Tetrahedrally coordinated Co2+ in oxides and silicates: Effect of local environment on optical properties. Am. Mineral. 2014, 99, 1736–1745. [Google Scholar] [CrossRef] [Green Version]
  37. Arletti, R.; Quartieri, S.; Freestone, I.C. A XANES study of chromophores in archaeological glass. Appl. Phys. A 2013, 111, 99–108. [Google Scholar] [CrossRef] [Green Version]
  38. Hunault, M.; Bauchau, F.; Loisel, C.; Hérold, M.; Galoisy, L.; Newville, M.; Calas, G. Spectroscopic investigation of the coloration and fabrication conditions of medieval blue glasses. J. Am. Ceram. Soc. 2016, 99, 89–97. [Google Scholar] [CrossRef]
  39. Silvestri, A.; Tonietto, S.; D’Acapito, F.; Molin, G. The role of copper on colour of palaeo-Christian glass mosaic tesserae: An XAS study. J. Cult. Herit. 2012, 13, 137–144. [Google Scholar] [CrossRef]
  40. Hodgkinson, A.K.; Röhrs, S.; Müller, K.; Reiche, I. The use of Cobalt in 18th Dynasty Blue Glass from Amarna: The results from an on-site analysis using portable XRF technology. STAR Sci. Technol. Archaeol. Res. 2019, 5, 36–52. [Google Scholar] [CrossRef] [Green Version]
  41. Oikonomou, A.; Henderson, J.; Gnade, M.; Chenery, S.; Zacharias, N. An archaeometric study of Hellenistic glass vessels: Evidence for multiple sources. Archaeol. Anthropol. Sci. 2018, 10, 97–110. [Google Scholar] [CrossRef] [Green Version]
  42. Costa, M.; Barrulas, P.; Arruda, A.M.; Dias, L.; Barbosa, R.; Vandenabeele, P.; Mirão, J. An insight into the provenance of the Phoenician-Punic glass beads of the necropolis of Vinha das Caliças (Beja, Portugal). Archaeol. Anthropol. Sci. 2021, 13, 149. [Google Scholar] [CrossRef]
  43. Yatsuk, O.; Koch, L.; Gorghinian, A.; Fiocco, G.; Davit, P.; Giannossa, L.C.; Mangone, A.; Francone, S.; Serges, A.; Re, A.; et al. An archaeometric contribution to the interpretation of blue-green glass beads from Iron age Central Italy. Herit. Sci. 2023, 11, 113. [Google Scholar] [CrossRef]
  44. Yatsuk, O.; Gorghinian, A.; Fiocco, G.; Davit, P.; Francone, S.; Serges, A.; Koch, L.; Re, A.; Giudice, A.L.; Ferretti, M.; et al. Ring-eye blue beads in Iron Age central Italy–Preliminary discussion of technology and possible trade connections. J. Archaeol. Sci. Rep. 2023, 47, 103763. [Google Scholar] [CrossRef]
  45. Rehren, T.; Connolly, P.; Schibille, N.; Schwarzer, H. Changes in glass consumption in Pergamon (Turkey) from Hellenistic to late Byzantine and Islamic times. J. Archaeol. Sci. 2015, 55, 266–279. [Google Scholar] [CrossRef] [Green Version]
  46. Gratuze, B.; Pactat, I.; Schibille, N. Changes in the signature of cobalt colorants in late antique and early Islamic glass production. Minerals 2018, 8, 225. [Google Scholar] [CrossRef] [Green Version]
  47. Smirniou, M.; Rehren, T. Shades of blue–cobalt-copper coloured blue glass from New Kingdom Egypt and the Mycenaean world: A matter of production or colourant source? J. Archaeol. Sci. 2013, 40, 4731–4743. [Google Scholar] [CrossRef]
  48. Lahlil, S.; Cotte, M.; Biron, I.; Szlachetko, J.; Menguy, N.; Susini, J. Synthesizing lead antimonate in ancient and modern opaque glass. J. Anal. At. Spectrom. 2011, 26, 1040–1050. [Google Scholar] [CrossRef]
  49. Verità, M.; Maggetti, M.; Saguì, L.; Santopadre, P. Colors of Roman glass: An investigation of the yellow sectilia in the Gorga collection. J. Glass Stud. 2013, 55, 39–52. [Google Scholar]
  50. Freestone, I.; Stapleton, C.P. Composition technology and production of coloured glasses from Roman mosaic vessels. In Jackson Glass of the Roman World; Bayley, J.I., Freestone, C., Eds.; Oxbow: Oxford, UK, 2015; pp. 61–77. [Google Scholar]
  51. Bugoi, R.; Măgureanu, D.; Matei, S.; Iancu, D.; Mirea, D. A pilot study on glass finds discovered in the Geto-Dacian settlements from Cârlomăneşti and Pietroasa Mică, Buzău County, Romania. Nucl. Instrum. Methods Phys. Res. Sect. B Beam Interact. Mater. At. 2023, 541, 126–133. [Google Scholar] [CrossRef]
  52. Matin, M. Tin-based opacifiers in archaeological glass and ceramic glazes: A review and new perspectives. Archaeol. Anthropol. Sci. 2019, 11, 1155–1167. [Google Scholar] [CrossRef] [Green Version]
  53. Tite, M.; Pradell, T.; Shortland, A. Discovery, production and use of tin-based opacifiers in glasses, enamels and glazes from the late iron age onwards: A reassessment. Archaeometry 2008, 50, 67–84. [Google Scholar] [CrossRef]
  54. Bandiera, M.; Verità, M.; Lehuédé, P.; Vilarigues, M. The technology of copper-based red glass sectilia from the 2nd century AD Lucius Verus villa in Rome. Minerals 2020, 10, 875. [Google Scholar] [CrossRef]
  55. Freestone, I.C.; Gorin-Rosen, Y.; Hughes, M.J. Primary glass from Israel and the production of glass in late antiquity and the early Islamic period. MOM Éditions 2000, 33, 65–83. [Google Scholar]
  56. Conte, S.; Arletti, R.; Mermati, F.; Gratuze, B. Unravelling the Iron Age glass trade in southern Italy: The first trace-element analyses. Eur. J. Mineral. 2016, 28, 409–433. [Google Scholar] [CrossRef]
  57. Purowski, T.; Dzierżanowski, P.; Bulska, E.; Wagner, B.; Nowak, A. A study of glass beads from the Hallstatt C–D from southwestern Poland: Implications for glass technology and provenance. Archaeometry 2012, 54, 144–166. [Google Scholar] [CrossRef]
  58. Henderson, J.; Warren, S.E. X-ray fluorescence analyses of Iron Age glass: Beads from Meare and Glastonbury Lake Villages. Archaeometry 1981, 23, 83–94. [Google Scholar] [CrossRef]
  59. Schibille, N.; Sterrett-Krause, A.; Freestone, I.C. Glass groups, glass supply and recycling in late Roman Carthage. Archaeol. Anthropol. Sci. 2017, 9, 1223–1241. [Google Scholar] [CrossRef] [Green Version]
Figure 1. Photographs of the archaeological objects involved in the study. The samples are divided into groups. The scale is the same for all samples and is indicated in the figure.
Heritage 06 00294 g001
Figure 2. (a) Ternary plot of the RGB data collected from the color-corrected photographs. The colored numbers are the Lab. ID of specific samples, as reported in Table 1. Large round markers are the values measured for ColorChecker tiles; their color reflects the color of the tile and guides the eye in identifying the distribution of the hues in the ternary plot. The achromatic center indicates the position of the colors in the grayscale, from black to white. (b) Bar plot showing the mean of the three RGB values for each sample (decorative parts are omitted). The colors of the bars and the order of the groups reflect what is reported in the legend of the ternary plot.
Heritage 06 00294 g002
Figure 3. Representative FORS spectra. Fe-Co group of spectra (a) and copper-influenced spectra (b). The positions of the absorption bands of the labeled ions are shown as vertical lines (for Fe3+, Co2+, and Cu0) or spectral regions (Cu2+ and Fe2+).
Heritage 06 00294 g003
Figure 4. PCA scatter plot of p-XRF data (decorations excluded), with loadings and scores displayed in the same plot. Loadings are multiplied by 10 to improve readability. Percent values near the PCs are the explained variance of each PC.
Heritage 06 00294 g004
Figure 5. XRF spectra of Group 1 samples (blue bases only) with major peaks marked in the plot.
Heritage 06 00294 g005
Figure 6. p-XRF data. Fe2O3 vs CoO binary plot. Values below the LOQ are set to 0.
Heritage 06 00294 g006
Figure 7. Comparison of CaO and Sb2O5 concentrations in some of the white decorations (indicated as _w) with respect to the base glass of different colors: b—blue; br—brown; d—dark; g—green; lb—light blue.
Heritage 06 00294 g007
Figure 8. The ratio of SnO2 and PbO2 in some white and yellow decorations compared with the corresponding (dark) base glasses.
Heritage 06 00294 g008
Figure 9. The binary plot of SrO vs. CaO. Low-Ca groups are marked with round symbols and high-Ca groups are marked with diamonds. The suggested boundary between the low and high-Ca groups is marked by a dotted line to guide the eye. Other objects, marked with triangles, tend to be concentrated in the low-Ca range.
Heritage 06 00294 g009
Table 1. List of the samples with their attribution and references to similar type/archaeological context; “-“ indicates the item is still unpublished.
Group 1. Spherical Blue Beads
Museum IDLab IDSiteApprox. dateRef.
S.53/126RE3Remedello Sotto--
S.53/131RE7Remedello Sotto--
S.53/129RE8Remedello Sotto--
S.27/120RE29Sepolcreto di Bismantova
(or surroundings)
500––50 BCE[18]
S.38/123RE32S.Polo campo Servirola600–500 BCE[18]
S.38/125RE34S.Polo campo Servirola--
S.38/129RE38S.Polo campo Servirola525–450 BCE[19]
S.38/131RE41S.Polo campo Servirola--
S.38/134RE44S.Polo campo Servirola600–500 BCE[18]
S.38/135RE45S.Polo campo Servirola--
Group 2. Pear-shaped beads
Museum IDLab IDSiteApprox. dateRef.
S.27/214RE30Sepolcreto di Bismantova
(or surroundings)
400 BCE–100 CE[12]
S.38/143RE48S.Polo campo Servirola525–450 BCE[18]
Group 3. Large-ring beads
Museum IDLab IDSiteApprox. dateRef.
S.53/134RE9Remedello Sotto300 BCE–100 CE [20]
S.53/138RE10Remedello Sotto300 BCE–100 CE[20]
T.89RE16Remedello Sotto300 BCE–100 CE[20]
T.89RE18Remedello Sotto300 BCE–100 CE [20]
Group 4. Small-ring beads
Museum IDLab IDSiteApprox. dateRef.
S.27/230RE31Sepolcreto di Bismantova
(or surroundings)
--
S.38/126RE35S.Polo campo Servirola600–500 BCE[18]
Group 5. Large-eye beads
Museum IDLab IDSiteApprox. dateRef.
S.27/36RE27Sepolcreto di Bismantova
(or surroundings)
400 BCE–100 CE[12]
S.38/130RE39S.Polo campo Servirola--
S.38/130(1)RE40S.Polo campo Servirola--
Group 6. Small-eye beads
Museum IDLab IDSiteApprox. dateRef.
S.38/124RE33S.Polo campo Servirola500–400 BCE[18]
S.38/128RE37S.Polo campo Servirola500–400 BCE[18]
S.38/132RE42S.Polo campo Servirola500–400 BCE[18]
S.38/136RE46S.Polo campo Servirola500–400 BCE[18]
S.38/137RE47S.Polo campo Servirola500–400 BCE[18]
Group 7. Disc-shaped beads
Museum IDLab IDSiteApprox. dateRef.
S.53/127RE4Remedello Sotto200 BCE–100 CE[21]
S.53/130RE5Remedello Sotto200 BCE–100 CE [21]
S.53/132RE6Remedello Sotto200 BCE–100 CE [21]
S.53/140RE11Remedello Sotto200 BCE–100 CE [21]
Group 8. Toroid beads
Museum IDLab IDSiteApprox. dateRef.
S.53/136RE13Remedello Sotto300 BCE–100 CE[20]
T.89RE14Remedello Sotto300 BCE–100 CE[20]
T.89RE15Remedello Sotto300 BCE–100 CE[20]
T.89RE17Remedello Sotto300 BCE–100 CE[20]
Group 9. Bangles
Museum IDLab IDSiteApprox. dateRef.
S.44/163RE19Bibbiano300 BCE–100 CE[22]
S.44/164RE20Bibbiano300 BCE–100 CE[22]
S.44/166RE22Bibbiano300 BCE–100 CE[22]
S.44/167RE23Bibbiano300 BCE–100 CE[22]
S.44/168RE24Bibbiano300 BCE–100 CE[22]
S.44/170RE26Bibbiano300 BCE–100 CE[22]
Other objects
Museum IDLab IDSiteApprox. dateRef.
S.97/24–38RE2S.Ilario d’Enza525–400 BCE[18]
S.44/169RE25Bibbiano--
S.27/37RE28Sepolcreto di Bismantova
(or surroundings)
--
S.38/127RE36S.Polo campo Servirola--
S.38/133RE43S.Polo campo Servirola600–500 BCE[18]
S.38/170RE49S.Polo campo Servirola525–400 BCE[17]
S.73/100RE50Volterra--
S.73/101RE51Volterra--
Table 2. Accuracy estimates for each oxide considered in the fitting procedure (see text for details) and limit of quantification (LOQ); n.a.—the estimate is not applicable.
ElementRelative Error (2σ, %)LOQ (wt%)
K2O54.51.2
CaO15.80.26
TiO232.10.26
MnO12.40.05
Fe2O333.60.04
CoOn.a.0.03
CuO22.70.4
ZnO22.70.03
SrO233.00.01
SnO2n.a.0.16
Sb2O5100.00.19
PbO233.40.09
Table 3. Results from FORS. Chromophores are listed in descending order—from the most evident features to the least prominent ones. If the group is split based on the spectra, separate samples are mentioned. Only samples that produced meaningful spectra are included in the table.
GroupSampleChromophore(s) Detected by FORS
Group 1. Spherical blue beadsAllCo2+, Fe2+, Fe3+
Group 2. Pear-shaped beadsAllCo2+, Fe2+, Fe3+
Group 3. Large ringsRE10Cu2+, Co2+, Fe3+
RE18Fe2+, Fe3+, Co2+
Group 4. Small ringsRE31Cu2+
RE35Co2+, Fe2+, Fe3+
Group 5. Large-eye beadsRE27, 39Co2+, Fe2+, Fe3+
RE40Fe2+, Fe3+, Co2+
Group 6. Small-eye beadsRE33b, 42, 46bCo2+, Fe2+, Fe3+
RE37, 47bCo2+, Fe3+
RE47Cu2+
Group 7. Disc-shaped beadsAllFe3+, Fe2+
Group 8. Toroid beadsAll (except RE17)Co2+, Fe2+, Fe3+
Group 9. BanglesRE20Fe2+, Fe3+
RE19, 22, 23, 24Co2+, Fe2+, Fe3+
RE26Co2+
Other objects RE25Fe3+, Fe2+
RE28Cu0, Fe2+
RE36, 49bCu2+, Fe3+
RE49d, 50, 51Co2+, Fe2+, Fe3+
Disclaimer/Publisher’s Note: The statements, opinions and data contained in all publications are solely those of the individual author(s) and contributor(s) and not of MDPI and/or the editor(s). MDPI and/or the editor(s) disclaim responsibility for any injury to people or property resulting from any ideas, methods, instructions or products referred to in the content.

