Abstract
This study aims to enable users of digitized cultural heritage artefacts to understand the correlation between artefacts and their context, discover new knowledge, and gain inspiration. We have developed data labelling and visualization technologies specific to cultural heritage so that users, such as curators, cultural heritage experts, and museum visitors, can easily and quickly access the information that they want through the correlation between artefacts. We came up with a web-based labelling tool for cultural heritage data and applied it to data on 45,692 artefacts from the National Museum of Korea. We also invented a web-based visualization tool that converts lists of attribute information in Excel spreadsheets into visualized content and edits the attributes. The meanings of thumbnails of visualized cultural heritage and that of connected lines, a search function, and visualized cultural heritage will allow users to quickly and easily access the cultural heritage information they are looking for.
1. Introduction
This research intends to enable users, such as curators, cultural heritage experts, and museum visitors, to understand the context of heritages. Specifically, this research aims to offer new insights by providing them with digitized heritage data and information through semantic correlations between heritages. Currently, the National Museum of Korea supports detailed searches and recommends related heritages through their own service. Nevertheless, there is a limitation to providing correlations between heritages.
We have focused on developing data labelling and visualization technologies specialized for cultural heritage to overcome this drawback. Firstly, in regards to the data labelling tool, we defined the words and related word attributes used in the description of cultural heritage. Secondly, we developed a visualization technology based on the extracted data to envision any relations that may exist among them. This research is expected to help curators virtually simulate an exhibition and aid visitors or researchers in identifying related artefacts, as well as employing them when searching for relations.
Machine learning algorithm labels are required in semantic search that allows users to easily and quickly access desired information. However, labelling of cultural heritage data is difficult because it is formed in various types of detailed information and numerical values to an object of interest, such as assigning categorical labels to an instance, or defining relations between the objects or label categories [1]. In addition, labelling of cultural heritage data requires cross-validation through collaboration with labellers and inspections by experts. To solve this problem, we developed a web-based labelling tool that allows many labellers to immerse themselves in labelling work and cross-validate results to prepare the product for inspection by experts. We also defined the attributes of words used in the description of artefacts and defined the relationship between words, which made it possible to search for artefacts from the National Museum of Korea and its affiliated museums.
For data visualization, we developed a tool that can edit the extracted data and imagine a relation network, in order to apply it to the collection of the National Museum of Korea to demonstrate its capabilities. We developed a web-based authoring tool that converts the list of cultural heritage attributes from an Excel format into visualized content and edits the attributes. This resulted in meanings of thumbnail sizes of visualized cultural heritage, meanings of connected lines, a search function, and a visualized cultural heritage aim to enable users to access and navigate the cultural heritage information with ease. Furthermore, the goal is for users to discover new knowledge and gain inspiration through the relationship between artefacts.
The purpose of this study is to develop web-based tools which facilitate the creation of labels and visualisation of relationships among artefacts which are required for cultural heritage intelligent curation. Cultural heritage intelligent curation refers to technology that can provide customized information such as cultural heritage assets, semantic or visual searches, visualisation of artefact information and interrelations, visitor tracking and analysis, and the automatic creation of copyright over the cultural heritage data/information. This study aims to introduce how specific examples of cultural heritage intelligent curation technologies have developed, with a focus on semantic search and visualisation technologies which make it easier for users, including visitors and curators, to utilise data.
Firstly, this study introduces the function and development process of a web-based labelling tool for generating machine learning data labels for semantic searches, that automatically connects semantic relationships to their cultural heritage. Secondly, this study introduces the function and development process of an authoring tool for visualizing the relationship network between cultural heritage information. This study will contribute to vitalizing GLAM (galleries, libraries, archives, museums) which aim to improve accessibility to knowledge resources of institutions, including collections, through the preservation, management, and utilization of cultural heritage data by supporting intelligent digital curation of cultural heritage data moving forward.
2. Related Works
2.1. Data Labelling
Data labelling refers to the process of marking a lot of unrefined data so that anAI can learn. Currently, most of the basic data-labelling tasks are performed by humans. Although it is an essential task for AI development, it is considered one of the most difficult processes in AI development because it consumes a lot of absolute time.
A study presented the availability of large cultural heritage image collections that are currently being digitized. The authors noted that content-based indexing will be in the limelight, and reviewed content-based indexing technology. The large collection used this study is the Bibliothèque Nationale de France collection, which currently contains around 275,000 images in online databases. But it is pointed out that there is more research to be done to achieve satisfactory results. In particular, authors noted that numerical design, which can encode both microscopic characteristics such as canvas patterns or calligraphy in painting, and macroscopic characteristics such as scene layout and lighting direction will be the most challenging [2].
Another study developed a method to efficiently label cultural heritages such as ceramics and clothing that have the potential to be continuously used in modern design and entertainment. They developed a graphical icon-based labelling system prototype to encourage novice labelling. In particular, gamified labelling systems through goal setting, levels, rewards, and customization motivate users to participate in the task, and the levels in particular have had a positive effect of encouraging participants to perform a task to reach the next level [3].
Currently, when researchers deal with cultural heritage collections that inhere a manifold of uncertainties, almost all tasks of annotating data are left to domain experts. To improve this problem, authors suggested (1) a uniform set of descriptive labels for the combined data set, and (2) a hierarchical classification of a high quality that can be used as a valuable input for supervised machine learning [4].
According to the most recent study, cultural heritage inventories are created to collect and preserve culture, allow stakeholder and community engagement, and promote and disseminate knowledge [5]. However, the existing problem is that the inventories that grant data access through web services or open data, and the inventories that are blocked from external access and can only be visited through a dedicated website, are not integrated. It can cause data silos to create barriers in information-sharing collaborations across institutions or systems. Integrating data from different archives allows users to compare different cultures and traditions on opposite sides of the world and find more commonalities than one might expect. The purpose of The Query Lab Portal, developed in this study, is to provide a query tool that transparently manages web services provided by cultural heritage databases so that users can obtain results from all inventories. In addition, the introduction of the studied ICH-Light model for intangible cultural heritage mapping makes it possible to collect, index, and integrate inventory data into a portal. This effort has allowed the creation of an environment dedicated to intangible data and also made it possible to search for traditions, knowledge, ceremonies, and festive events [5].
Based on these previous studies, our research team developed a data labelling tool for labelling attributes and related words of cultural heritage in order to develop an intelligent analysis/search/visualization technology specialized for cultural heritage. This tool provides a UI for visually easy tagging of data when uploading data in Excel file format.
The CIDOC CRM provides an extensible official ontology that makes it suitable to integrate, exchange, and connect information in cultural heritage. Moreover, it is a conceptual model that enables integration, mediation, and interchange of heterogeneous but similar information in cultural heritage and other fields [6]. The International Council of Museums started to develop CIDOC CRM to solve the technical problem of knowledge integration between museum databases. The International Committee for Documentation worked on the development in collaboration with computer scientists, archaeologists, museum curators, art historians, bibliographers, physicists, and philosophers [7].
The CIDOC CRM is meaningful in enabling semantic inter-operability of museum databases recorded by each institution and provides each document as an intelligent structured model using logical terms. The Korea National University of Cultural Heritage (KNUCH) developed a model that comprehensively connects the relationship between information and attributes of artefacts in the e-Museum of the National Museum of Korea to classify the attributes and relationships of cultural heritage in Korea. This is based on the CIDOC CRM, which was mainly used in the past, but referred to the KCHDM, which was created to share resources operated with an independent data model or Korean institutional standards. The KNUCH developed an intelligent analysis, retrieval, visualization technology specialized for cultural heritage and reclassified the attributes of cultural heritage data for meaning-based intelligent heritage search. In addition, the relationship between the artefact data was analysed by identifying the relationship between the tagged attributes. Relational words can link the relationship between attributes, and although it was based on the existing CIDOC CRM, it referred to the KCHDM used for sharing resources operated by an independent data model or institutional standards in Korea. Unlike the attribute definitions used based on the existing corpus, the relational word definition was newly developed by the KNUCH in order to comprehensively connect the relationship between the heritage information and attributes of the e-Museum [8].
2.2. Data Visualization
The existing ways of digital preservation and digital archiving are sometimes used interchangeably with digital curation. Digital archiving is a concept to achieve the purpose of digital curation, and digital curation can be seen as an umbrella concept of the other two concepts [9]. The term ‘digital curation’ first appeared at the ‘Digital Curation: digital archives, libraries and e-science seminar’ held in London in October 2001. Digital curation is the process of establishing and developing a long-term repository of digital resources for current and future reference by researchers, scientists, and historians. This definition includes not only the process of digital archiving and preservation but also all the processes necessary for producing and managing high-quality data and the ability to add new value to data to produce new information and knowledge sources [10]. As digital technology developed, cultural heritage-related organizations such as GLAM began to digitize data collection and improved accessibility.
As a methodology of digital curation, the need for data visualization increased, and it was quickly applied to the field of cultural heritage. Various approaches have been developed over the past few years to visualize data in the cultural heritage sector. Data visualization is an area that studies the visual representation of data and aims to improve the communication efficiency of information using graphics [11]. It is also referred to by various words such as information visualization and big data visualization.
Researchers in the study developed a Semantic Web 2.0 form of ‘CultureSampo’, which can process Finnish cultural heritage data. Through this, a methodology for how to integrate and visualize heterogeneous cultural heritage data was presented. In particular, it was intended to integrate the databases of each institution through data processing pipelines and improve users’ data accessibility through exhibition generation interfaces. CultureSampo’s search and organize view were expected to leverage this to enable intuitive yet expressive exhibition generation interfaces and various kinds of exhibition visualizations [12].
One of the related works to information visualization reviewed the information visualization theories of the digital collection of cultural heritage and summarized the interfaces of existing cases. In addition, the arrangement method and design method of the interface were reviewed. As a result, it was revealed that cases focused on cultural heritage objects whereas actors focused on expression using images, and the project mostly focused on interface construction [13].
Another study dealt with the task of analysing casual users and developing interfaces for them in two aspects: digital humanities and information visualization. In particular, after a preceding literature review of the information search activities of casual users, they proposed a user-centred design process to meet the requirements of casual users. In addition, they emphasized that the convergence of digital humanities and information visualization can bring benefits, and argued that it is necessary to observe casual users and understand their goals and activities [14].
Shabani et al. presented use cases for annotation, linking, visualization, and browsing of cultural heritage data and suggested several directions to achieve visual analysis. The study also aimed to improve the user search experience for cultural heritage by understanding the user’s search context and providing quick access to relevant information [15].
Windhager et al. presented future challenges by collecting, summarizing, and analysing the achievements of 70 cultural heritage collection information visualization systems. As a result, it was revealed that the difference in the interface between the general public and experts in the collection of digital cultural heritage was not as fundamental as expected. The authors elicited an additional discussion about visualization methods for temporal data that were studied in 2D format, and lists and slideshows were used for non-temporal data, etc. Furthermore, common opinions such as serendipity, generosity, criticality, user guidance and narration, remote access and being there, facets of uncertainty, and contextualization were also drawn [16].
Based on the above previous studies, researchers at the Korea National University of Cultural Heritage tried to organize the metadata of the Curator’s Picks Collection provided by the National Museum of Korea e-Museum in Excel form and effectively develop not only information on the artefacts but also visualization of the relationship between the artefacts. When two or more conditions are selected, various attributes connected to one artefact can be identified, and it was designed using the principle of gravity, so that highly related objects can be located close to each other. In addition, we also completed a foundation to provide customized personalization services to casual users who use our results.
3. Data Labelling Tool
Data labelling is the process of identifying raw data (images, text files, videos, etc.) and adding one or more meaningful and informative labels to provide context so that a machine learning model can learn from it. We intended to develop a digital tool for cross-validation through collaboration with labellers and inspection by experts. The labelling tool is designed to assign attributes and related words to artefacts. It uploads data in Excel spreadsheets to a tool and provides a user-interface that allows users to easily tag the data. We developed attributes and relation words, which were applied to the tool, and cultural heritage manually tagged the artefact data of the National Museum of Korea using this tool.
We developed an intelligent analysis/retrieval/visualization technology specialized for cultural heritage and reclassified the attributes of cultural heritage data for meaning-based intelligent heritage search. In addition, the relationship between the artefact data was analysed by identifying the relationship between the tagged attributes. We intended to foresee the relation network with the extracted data and provide customized heritage information to museum visitors.
The attributes comprised 10 major categories and 92 sub-categories. In reference to the Korean corpus repository developed by the National Institute of the Korean Language in 2020, we analysed 15 major categories and 150 sub-categories in the repository. This was revised to tailor to the form of cultural heritage, and the attributes were produced. The major categories include person (PS), location (LC), artefact (AF), civilization (CV), date (DT), event (EV), plant (PT), animal (AM), material (MT), and terminology (TM).
Relational words can link the relationship between elements, and although it was based on the existing CIDOC CRM, it referred to the KCHDM used for sharing resources operated by an independent data model or institutional standards in Korea. Unlike the attribute definitions used based on the existing corpus, the relational word definition was newly developed by the KNUCH in order to comprehensively connect the relationship between the heritage information and features of the e-Museum.
The relation words consist of 14 items including A depicts B (B isDepictedIn A), A consistsOf B, A wears B (B isWornBy A), A hasCreated B (B wasCreatedBy A), A hasDestroyed B (B wasDestoryedIn A), A hasSection B (B isLocatedIn A), A originatedIn B, A hasTime B (B wasTimeOf A), A hasCarriedOut B (B wasCarriedOutBy A), A servedAs B, A isConnectedWith B, A documents B (B isDocumentedIn A), A isUsedIn B, and A fallsWithin B (Table 1).

Table 1.
Relation words developed by KNUCH (Attribute).
A depicts B (B isDepictedIn A) indicates cases where a place or civilization is depicted or described, or depicts the colour or shape of an artefact. A consistsOf B indicates a case where a place, artefact, civilization, or material is used as a component. A hasCreated B (B wasCreatedBy A) is used when a subject wears clothes, hats, shoes, or accessories. Lastly, A originatedIn B describes an event such as work and systems created by a subject.
A hasDestroyed B (B wasDestroyedIn A) associates a specific place, date, or event with the damaged object. A hasSection B (B isLocatedIn A) associates an artefact with the place it is located in. A originatedIn B connects artefacts and techniques with the places, civilizations, and events from which they originated. Finally, A hasTime B (B wasTimeOf A) describes a material, technique, style, or artefact that was popular at a particular time or describes the temporal constraints of an event.
A hasCarriedOut B (B wasCarriedOutBy A) describes the event executed by the subject, and A servedAs B describes the position or duty the person has. However, this does not draw the relationship between the subjects. A isConnectedWith B connects the relationship between the subjects. Unlike A servedAs B, this does not imply a subject’s position or duty. In addition, A documents B (B isDocumentedIn A) connects the artefact and its description. A isUsedIn B connects an artefact with the purpose of the use or event for which it was used. Finally, A fallsWithin B connects an object and the category containing the object.
The tool views the status of labelling and inspection, as well as the overall data status, and shows how the data are classified through statistics. In addition, to improve user convenience, we separated attributes and relation words, and users can quickly tag through shortcut keys. Moreover, because the tool is web-based and connected to the data server, users can access it from anywhere through the internet.
The labelling work was performed by a total of three groups, and each group had a total of sixteen participants, including one labeller majoring in cultural heritage and four general labellers. At the end of each group’s work, the other group was cross-validated. Inspection was indicated in the data list of the web-based labelling tool. If an issue occurred during labelling, one labeller majoring in cultural heritage resolved it and provided a solution.
In general, users can access the information of the e-Museum at the National Museum that has been uploaded in ‘Go to Labelling’, and classify the information by tagging it with suitable attributes. Attribute tagging can be executed by clicking the button on the right, and detailed attributes appear when clicking the main category of attributes. In addition, the labelled content appears on the left, and through this, users can inspect whether the data are tagged correctly. Relation words can also be tagged in the same way as attribute tagging, and they can be registered with the button on the right by selecting pre-tagged attributes (Figure 1).
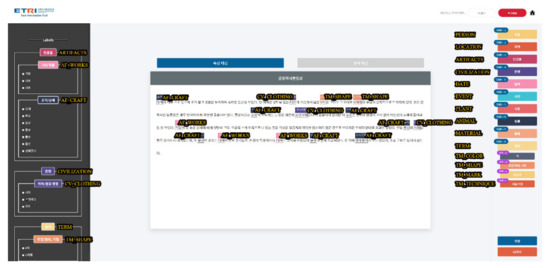
Figure 1.
Attribute tagging through the annotation tool developed in the CHIC project.
This paper objectively visualized the work procedure using CIDOC CRM and CIDOC CRMdig to prove the reliability of the work using the annotation tool (Figure 2). Looking at the diagram step by step, C3 formal derivation represents the process of deriving an output from the onset. The e-Museum data (C1 digital object) in XML format are used as the data for the new output (S21 used as the derivation source) and a resource (S2 used as the source) when executing the annotation tool (C10 software execution).
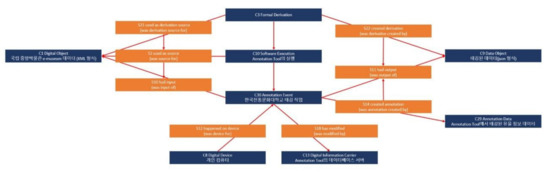
Figure 2.
A visualized work procedure of the annotation tool through CIDOC CRMdig (navy: entity, orange: attribute).
In addition, the data serve as an input value in the annotation work (C30 annotation event) in progress at the KNUCH (S10 had input). The input value produces annotated data (C29 annotation data) by tagging the information (S14 created annotation), which is the output of the job (S11 had output), and the tagged data in JSON format (C9 data object) produced (S22 created derivative).
This work is carried out by users’ personal computers (C8 digital device) (S12 happened on device). Moreover, when a work is carried out (C30 annotation event), the artefact data in the annotation tool’s data server (C13 digital information carrier) is modified (S18 has modified).
Through the abovementioned work, we tagged a total of 45,692 artefact data for 2021 by attribute and relationship. Looking at the artefact data, 187,986 words were tagged as artefacts in the main category attribute, followed by person, term, and region. By sub-categories, records took the highest proportion with 95,178 cases, followed by a person’s name and sculpture/craft.
This makes it possible to analyse which content occupies a large part of the 45,692 descriptions. As for the relation words, A depicts B, which relates the attribute that describes the shape of the artefact appropriately to the description of the artefact comprises the largest share with 9037 cases. A documents B, which refers to content recorded in books, paintings, and so on, accounted for the second largest share with 3689 cases.
This data suggests several implications for the definition of attributes and relationships. The improvement of the attributes and relationships of the e-Museum data make it possible to classify the attributes of records in a more detailed manner and to provide detailed search results suitable for each record. In addition, by suggesting the description methods in detail in A depicts B, it is possible to classify and provide information about the description techniques and methods used in cultural heritage (Figure 2).
Lastly, in the attribute classification, there were 53,194 searches by person name. Relation words representing relationships between people are tagged as A isConnectedWith B, which encompasses any relationship between people. Therefore, if the relationship is classified in detail and the relationship between the characters is diversified such as ruler and ruled, father and son, brothers and sisters, and so on, the data on cultural heritage can be interpreted more accurately than the current tagged information.
4. Visualization Tool
We developed a system to visualize the relationship between artefacts so that the public can easily understand them. This system aims to help curators and cultural heritage experts simulate during the planning stage of exhibitions and to help researchers identify semantically related artefacts and use them in their search for meaning. In addition, non-experts can also obtain more extensive information by identifying the relationship between artefacts through visualized content.
We used 549 Curator’s Picks Collections provided by the e-Museum of the National Museum of Korea as data visualization materials. In the case of curator-recommended collections, metadata is sufficiently prepared for each artefact, and since it has already been verified, it has the advantage of not requiring a separate data verification process. In addition, not only set metadata, but also curation was already in place to provide explanations in connection with related artefacts centred on a specific topic. Accordingly, it was determined that it was appropriate to work on ‘development of auxiliary tools for exhibition simulation of curators’, which is the main purpose of this visualization work.
The metadata of the artefacts was sorted based on the classification of artefacts presented on the e-Museum website of the National Museum of Korea. Conditions for artefact relationships were classified into ‘artefact type’, ‘artefact classification’, ‘nationality/era’, and ‘material’. The information about the object to be visualized was entered into an Excel file. We developed a data converter programme for Windows to convert Excel files into a usable data format. Subsequently, we developed an artefact management system that allows users to directly add, modify, and delete data to increase utilization and sustainability. For effective visualization, various factors such as thumbnail size, line colour, and the principle of gravity were utilized.
The visualization tool developed by the researchers can be checked on the asset network page of the cultural heritage asset management platform developed by the National Museum of Korea (Figure 3). A list of recommended collectibles appropriate for the project can be used by curators when searching for information for exhibition planning and simulation.
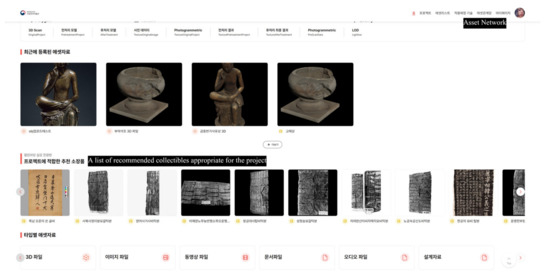
Figure 3.
A cultural heritage asset management platform developed by the National Museum of Korea.
4.1. Data Editing Function
First of all, in order to enter the information of the objects to be visualized into a database, the metadata of the recommended collections provided by the e-Museum of the National Museum of Korea was organized in spreadsheets. Each metadata was categorized into ‘artefact type’, ‘curation theme’, ‘artefact name’, ‘artefact name (in Korean)’, ‘artefact description’, ‘other names’, ‘nationality/era’, ‘classification’, ‘material’, ‘artist’, ‘size’, ‘designated cultural heritage’, ‘collection number’, and ‘e-Museum link’. The metadata of a total of 549 artefacts was sorted, and curation themes without artefacts were removed in the process. Afterwards, folders were created for each sub-attribute of each condition, and individual folders were created in each sub-attribute folder. Each folder has photographs of the artefacts. The database server (DBMS) is designed in a way that all visualization programmes using MariaDB operate based on the content stored in this database server.
To visualize the organized data, the ‘artefact management programme’ and ‘data converter programme’ were developed as data management tools. These two programmes used Visual Basic NET to create applications for Windows. A data converter programme was used to read the Excel file and convert the data format. The size of the local image data was converted and automatically uploaded (Figure 4).
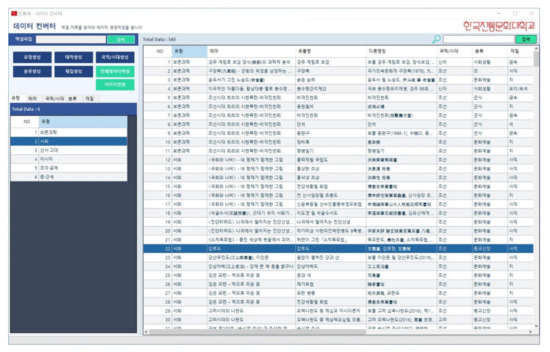
Figure 4.
A spreadsheet imported through a data converter programme.
In the artefact management programme, information on sub-attributes and artefacts can be modified or deleted. Users can add or modify content by clicking the buttons of ‘Artefact Management’, ‘Type Management’, ‘Theme Management’, ‘Nationality/Era Management’, ‘Classification Management’, and ‘Material Management’ at the top left of the programme. Figure 5 shows the screen that appears when material management is selected. Users can check sub-attributes related to materials such as ‘metal’, ‘fabric’, and ‘paper’ and see the total number of materials and codes assigned to each sub-attribute.
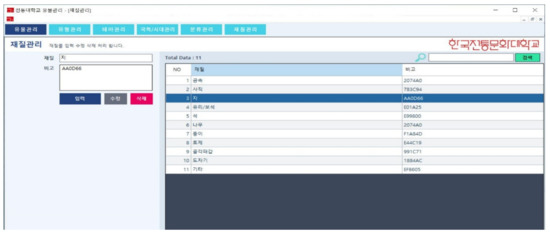
Figure 5.
Material management page of artefact management programme.
Figure 6 shows the page that appears when the ‘Artefact Management’ button is selected. On this page, users can directly input data and can also modify and delete it. On the far left of the screen, empty slots are listed where users can enter the attributes of artefacts used when creating a spreadsheet. When selecting ‘Search’, users can check the list created as sub-attributes of the artefacts and select one. In the box located at the bottom of the screen, users can see the list of photos and files associated with the artefact.
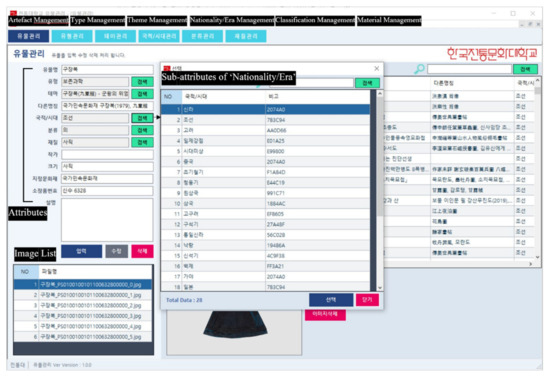
Figure 6.
Management page of the artefact management programme.
4.2. Visualization Method of Artefact Information
We came up with a visualization method and have created a web page of ‘Intelligent Curation for Immersive Experience in Cultural Heritage’ so that curators can utilize the database built through the above process. We used JavaScript to visualize the network and to interact with users. PHP was used to connect the visualization viewer and the database and transmit/receive data. HTML and CSS were used to create web pages.
In the web pages developed so far, check boxes for five artefacts’ relationship conditions are presented on the left so that users can select the relationship condition they want. Users can check the visualized artefact information on the right side of the page by clicking ‘Create Relation Network’ after selecting an artefact relationship condition. Each artefact and sub-attribute is represented by a circular shape. Sub-attributes appear as text, and photos appear as thumbnails (Figure 7).
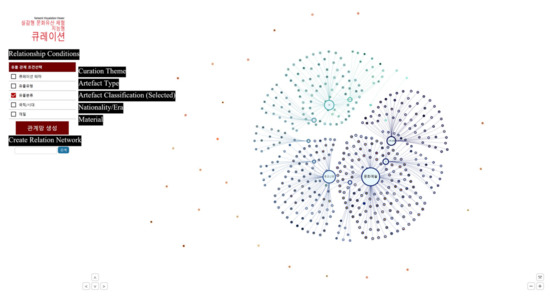
Figure 7.
Visualization when choosing an ‘artefact classification’.
When users click on each artefact, a photo linked to the thumbnail and a summary about the artefact appear in a pop-up (Figure 8a). When selecting the ‘View Details’ icon in the pop-up, users can see more detailed information (Figure 8b). The name of the artefact appears at the top, and the title of the curation created by the curator and the name of the curator are displayed at the bottom. In the main text, users can see the description provided by a curator at the National Museum of Korea and information and photos of related artefacts (Figure 8).
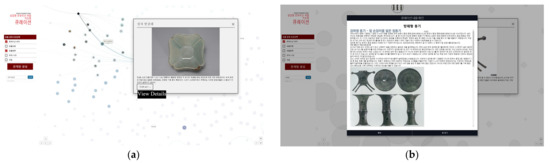
Figure 8.
Artefact information pop-up: (a) a summary about the artefact; (b) curation of the related artefacts.
Users can search for the artefact they want to explore. First, users can enter the name of the artefact in the search box after selecting the conditions related to the artefact they want to find out. If users click the ‘Search’ button after entering an artefact name, they will be directed to a page with the artefact or attribute, and then the information related to the searched word will be highlighted and displayed. Through this, users can obtain visual information about the artefact and its relationship with other related artefacts (Figure 9).
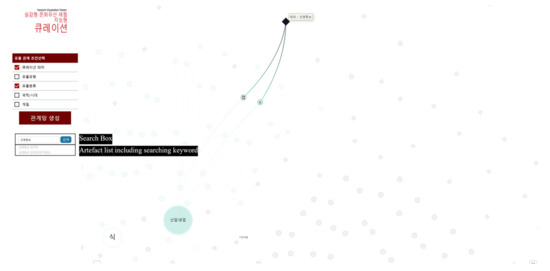
Figure 9.
Visualization of the location of the artefact by highlighting when searching for ‘Sangpyeong Tongbo (a copper coin)’.
Within one condition, each sub-attribute has a designated colour, and each artefact is connected by a line of that colour. In the sub-attributes, the larger the number of related artefacts, the larger the circle size, and the smaller the number of related artefacts, the smaller the size. As in the example of Figure 10, when the condition of ‘nationality/era’ is selected, the size of the circle of ‘Joseon’ is the largest as it has the most related artefacts.
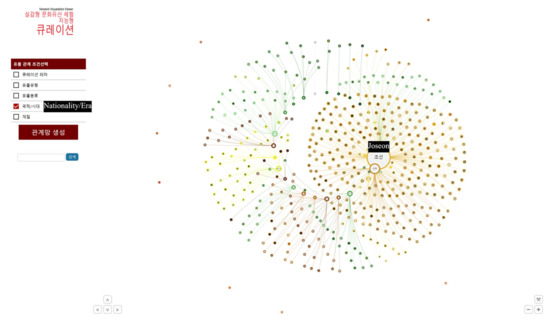
Figure 10.
The size of the circle of ‘Joseon’ is the largest as it has the most related artefacts.
4.3. Visualization Method of Artefact Relationship
Users can understand relations between artefacts by selecting multiple artefact relationship conditions. When two or more conditions are selected, various sub-attributes connected to one artefact are shown, and the principle of gravity is used so that related things can be located close to each other. As shown in Figure 11, when ‘artefact type’ and ‘artefact classification’ are selected, the sub-attributes of ‘artefact classification’ appear in the form of a circle on the left side of the screen, and the sub-attributes of ‘artefact type’ also appear in a circle on the right. In addition, related artefacts are grouped together.
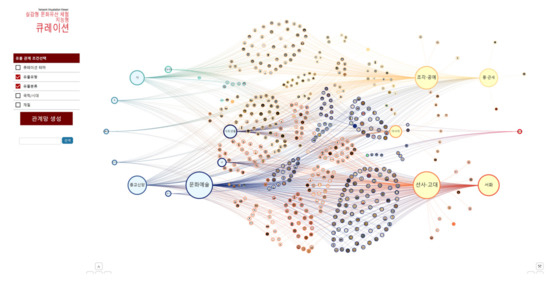
Figure 11.
Visualization when multiple conditions (‘artefact type’ and ‘artefact classification’) are selected.
When multiple conditions are selected, the edge of a circle with artefacts connected to two or more sub-attributes is set to the colour of the sub-attribute which has a large number of connected artefacts. Gradient change is applied to the colour of the line. For example, Figure 12 shows that ‘Gyuhwa Myeongseon’ is connected to ‘culture and art (blue)’ in ‘artefact classification’ and ‘middle and early modern period (yellow)’ in ‘artefact type’. The number of artefacts connected to ‘culture and art’ is greater; thus, the yellow line that started from ‘middle and early modern times’ changes to blue.
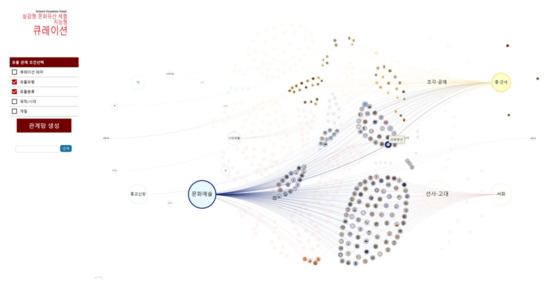
Figure 12.
Line colour of ‘Gyuhwa Myeongseon’ changes from yellow to blue.
When hovering the mouse over a thumbnail that a user wants to learn about, only the related artefacts and attributes are highlighted (Figure 13). For users to easily grasp the relationship visually, unrelated artefacts are greyed out to create contrast. If a user clicks the artefact after hovering over it, the edge of the artefact gets thicker and fixed. Even after the mouse moves, the position can be confirmed through the thickness of the edge.
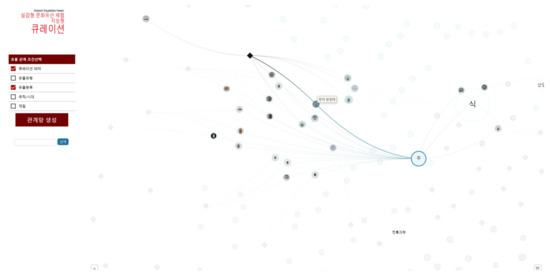
Figure 13.
Visualization when hovering a mouse over ‘Celadon Pedestal’.
Figure 14 is when conditions and sub-attributes are selected together. After selecting the conditions for ‘curation theme’ and ‘artefact classification’, this image is displayed when hovering a mouse over and clicking ‘conservation science’, a sub-attribute of ‘artefact classification’. Users can check the location of artefacts (circles) connected to ‘conservation science’ and see the location and number of related curation themes (black rhombi). Users can see the visualization and go to several curation themes under ‘conservation science’ to understand the relationship and context between artefacts.
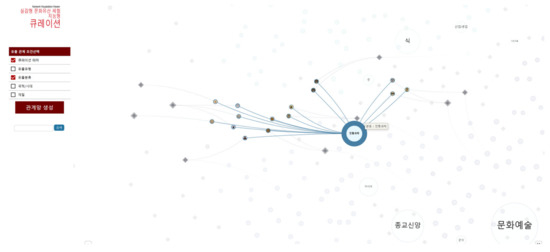
Figure 14.
Visualization of related themes and related artefacts when selecting the ‘Traditional Science’ attribute.
Figure 15 shows how it looks when clicking after hovering the mouse over one of the curation themes (black rhombus). Users can guess that the selected themes ‘Creator God Bok-Hui and Yeo-Hwa—keywords to understand the funeral culture of Turpan Gochang-Guk’—are mainly related to ‘culture and art’ and ‘social life’; they can also see the four artefacts related to this.
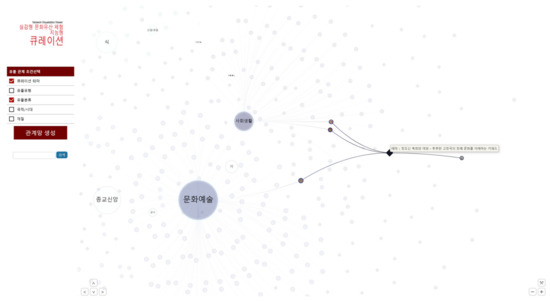
Figure 15.
A visualization that shows the selected theme is related to ‘culture and art’ and ‘social life’.
5. Discussion
The labelling tool proposed in this study was developed for labellers who work on artificial intelligence label generation. The Korean corpus repository was mainly used to determine the words and relational properties used for labelling. Additionally, opinions were reflected in the classification of word properties through the interviews conducted with exhibition curators. They wanted to establish a relationship between artefacts that have common context information (e.g., historical background and the events appearing in the descriptions of the artefacts) as well as between those with general attributes (e.g., material, nationality, and era). They wanted to connect the artefacts with the various materials and historical information related to the artefacts such as dance, food, and technology. As a result, person (PS), location (LC), artefact (AF), civilization (CV), date (DT), event (EV), plant (PT), animal (AM), material (MT), and terminology (TM) were derived.
As a result of analysing the labellers’ requirements received during the labelling tool’s development process, they wanted a tool that supports easy, quick, and intuitive tag labelling during the work process. To this end, we added a function that enables label tagging using shortcut keys and provided an information list to understand the labelled situation in case of inspection. Labelling statistics and inspection status were provided so that mid-level managers could integrate and examine them. In this study, we proposed using word property definition for creating artificial intelligence labels for connecting semantic relationships and contextual information between artefacts. We also introduced a web-based labelling tool that facilitates labelling and inspection. In the future, we will use the created labels to visually show the connection of contextual information. The labelling tool can support labelling tasks and can be used for artificial intelligence label creation using English and other cultural heritage descriptive information. To this end, if word and related word properties are modified and supplemented in response to the classification of cultural heritage (defined by CIDOC CRM, an international data model), it can be used for visualization of multilingual relic information.
On the other hand, as a result of analysing the requirements of curators in the process a content visualization tool to visualize artefact distribution and expressed the relationship between related artefacts was developed. We developed an editing tool that allows content developers to upload a list of text files, including Excel, to a content visualization and edit the content’s information (artefact type, artefact classification, nationality/era, material) and thumbnail images. In this study, we visualized artefacts appearing in a storytelling-based virtual exhibition that is composed of existing curator-recommended collections. This allowed us to explain the visualization tools. Visualization content created through the content visualization tool can be used in an intelligent curation platform to search for related artefacts when simulating a curator’s exhibition. In addition, it will be used for digital exhibitions in museums and art galleries by utilizing media walls, etc., to provide an opportunity for the general public to more fully understand artefacts’ contexts as they access and explore the relationships between artefacts.
6. Conclusions
This study aims to develop digital tools for intelligent curation, which support users and allow them to get to grips with the semantic relationship of cultural heritage. For that purpose, we defined attributes including period, materials, and categories as well as attributes and related words. In addition, we also developed a tool to support labelling data and visualization. In the future, we intend to conduct research on overall cultural heritage intelligent curation, such as data analysis, management, and utilization. This will enable intelligent curation services to be built through reliable data analysis, attributes, and relationship classification.
We will include functions which curate and recommend customized information based on user profiles such as age, region, and prior knowledge. We will also design functions which allow users to gain a better understanding of the artefacts in a linear structure and in relation to their story and context. We plan to develop a visualization process using an artificial intelligence labelling tool in the future, where the target of the content visualization tool will be limited to curator-recommended collections. We want to add a storage and sharing system for relics of interest to accommodate user requirements and add personalization services in the case of visualization content.
We aim to improve both the user experience and interface so that curators or even humanities majors without a technical background can collect artefact data according to their relevant theme and intuitively design them with their desired concept. We aspire to develop this as an educational tool which allows users to not only create content but also collaborate and edit them on the web. This research will lead to the construction of an integrated ontology that can encompass very detailed descriptions and information about artefacts including people, events, and architectural heritage as well as intangible and natural heritage. It will also contribute to establishing a semantic web platform that enables an integrated search of cultural heritage.
Author Contributions
Methodology, J.L.; Project administration, J.L.; Supervision, J.L.; Visualization, H.S. and S.I.; Writing—original draft, H.S. and S.I. All authors have read and agreed to the published version of the manuscript.
Funding
This research was supported by A Development of Intelligent Curation and Service Platform based Digital Asset for Immersive Cultural Heritage funded by Korea Creative Content Agency (Ministry of Culture, Sports and Tourism) (No. R2020040045).
Institutional Review Board Statement
Not applicable.
Informed Consent Statement
Not applicable.
Data Availability Statement
Not applicable.
Acknowledgments
This research was supported by a Development of Intelligent Curation and Service Platform-based Digital Asset for Immersive Cultural Heritage funded by the Korea Creative Content Agency (Ministry of Culture, Sports and Tourism) (No. R2020040045).
Conflicts of Interest
The authors declare no conflict of interest.
References
- Christofer, M. Labeling of Cultural Heritage Collections on the Intersection of Visual Analytics and Digital Humanities. In Proceedings of the 2022 IEEE 7th Workshop on Visualization for the Digital Humanities (VIS4DH), Oklahoma City, OK, USA, 16 October 2022. [Google Scholar]
- Picard, D.; Gosselin, P.-H.; Gaspard, M.-C. Challenges in Content-Based Image Indexing of Cultural Heritage Collections. IEEE Signal Process. Mag. 2015, 32, 95–102. [Google Scholar] [CrossRef]
- Lee, J.; Yi, J.H.; Kim, S. Cultural Heritage Design Element Labeling System with Gamification. IEEE Access 2020, 8, 127700–127708. [Google Scholar] [CrossRef]
- Christofer, M.; Guéville, E.; Wrisley, D.J.; Jänicke, S. A Visual Analytics Framework for Composing a Hierarchical Classification for Medieval Illuminations. arXiv 2022, arXiv:2208.09657v1. [Google Scholar]
- Artese, M.T.; Gagliardi, I. Integrating, Indexing and Querying the Tangible and Intangible Cultural Heritage Available Online: The QueryLab Portal. Information 2022, 13, 260. [Google Scholar] [CrossRef]
- Bekiari, C.; Bruseker, G.; Doerr, M.; Ore, C.-M.; Stead, S.; Velios, A. Definition of the CIDOC Conceptual Reference Model Version 7.1.1; The CIDOC CRM Special Interest Group: Athens, Greece, 2021; p. 9. [Google Scholar]
- Bruseker, G.; Carboni, N.; Guillem, A. Cultural Heritage Data Management: The Role of Formal Ontology and CIDOC CRM; Springer: Cham, Switzerland, 2017; p. 108. [Google Scholar]
- Kim, B.-R. A Study on the Application of Intelligent Curation System to Manage Cultural Heritage Data. J. Korean Cult. Herit. 2022, 29, 115–153. [Google Scholar]
- Yakel, E. Digital Curation. OCLC Syst. Serv. Int. Digit. Libr. Perspect. 2007, 23, 335–340. [Google Scholar] [CrossRef]
- Dallas, C. Digital curation beyond the “wild frontier”: A pragmatic approach. Arch. Sci. 2016, 16, 421–457. [Google Scholar] [CrossRef]
- Lee, J. A Study on Visualizing Method and Expression of Information Design for Big Data. J. Basic Des. Art 2013, 14, 259–269. [Google Scholar]
- Mäkelä, E.; Hyvönen, E.; Ruotsalo, T. How to deal with massively heterogeneous cultural heritage data—Lessons learned in CultureSampo. Semant. Web 2012, 3, 85–109. [Google Scholar] [CrossRef]
- Windhager, F.; Federico, P.; Mayr, E.; Schreder, G. A Review of Information Visualization Approaches and Interfaces to Digital Cultural Heritage Collections. In Proceedings of the 9th Forum Media Technology 2016, St. Pölten, Austria, 23–24 November 2016. [Google Scholar]
- Mayr, E.; Federico, P.; Miksch, S.; Schreder, G.; Smuc, M.; Windhager, F. Visualization of Cultural Heritage Data for Casual Users. In Proceedings of the IEEE VIS Workshop on Visualization for the Digital Humanities, Baltimore, MD, USA, 24 October 2016. [Google Scholar]
- Shabani, S.; Liu, Z.; Sokhn, M. Semantic Network Visualization of Cultural Heritage Data. In Proceedings of the Current Trends in Web Engineering—ICWE 2018, Cáceres, Spain, 5–8 June 2018; Volume 11153, pp. 288–291. [Google Scholar]
- Windhager, F.; Federico, P.; Schreder, G.; Glinka, K.; Dörk, M.; Miksch, S.; Mayr, E. Visualization of Cultural Heritage Collection Data: State of the Art and Future Challenges. IEEE Trans. Vis. Comput. Graph. 2019, 25, 2311–2330. [Google Scholar] [CrossRef] [PubMed]


Disclaimer/Publisher’s Note: The statements, opinions and data contained in all publications are solely those of the individual author(s) and contributor(s) and not of MDPI and/or the editor(s). MDPI and/or the editor(s) disclaim responsibility for any injury to people or property resulting from any ideas, methods, instructions or products referred to in the content. |
© 2023 by the authors. Licensee MDPI, Basel, Switzerland. This article is an open access article distributed under the terms and conditions of the Creative Commons Attribution (CC BY) license (https://creativecommons.org/licenses/by/4.0/).