Abstract
There is little information on the actual use of early synthetic organic pigments (SOPs) in art objects, especially those from before 1950. Their presence can, however, pose a challenge to conservation because their chemical composition, as well as their lightfastness and sensitivity to solvents, are often unknown. Here, a study on the non-invasive identification of SOPs in historic pre-1950 varnished paint-outs from artists’ materials manufacturer Royal Talens is presented. The paints were analysed using a handheld Raman device. Spectra were evaluated by recording the spectra of the same samples with a benchtop instrument. This study demonstrated that the identification of SOPs in varnished oil paints with a non-invasive approach is possible and rather straightforward. The handheld Raman device allowed us to identify fourteen SOPs from eight pigment classes. Besides the occurrence of expected and the known SOPs of this time period, there were also some surprising results, like the detection of the triarylcarbonium pigments PG2 and PB8, and the monoazo Mordant Yellow 1.
1. Introduction
After the accidental discovery of mauveine in 1856, a new class of dyestuffs and pigments was developed and introduced to the market. These were formerly defined as coal-tar dyes and are nowadays called synthetic organic pigments (SOPs). SOPs are “manufactured colourants that have a carbocyclic ring skeleton” [1]. In contrast to natural organic pigments, they are synthesized in a laboratory environment and produced on an industrial scale, so that natural organic pigments like indigo and alizarin can be considered as SOPs when they are produced industrially [1].
After their introduction, paint manufacturers started to use SOPs for their tube paints, which led to new shades in artists’ colours and to the imitation of traditional pigments [2,3,4]. As it was initially not mandatory for manufacturers to indicate the use of SOPs in their paint formulations, artists often lacked knowledge of the exact content of their supplies. Considering the minor fastness characteristics of the early SOPs compared to traditional pigments, their use also led to material problems previously unknown to the artists, who tended to take a critical view on these new pigments [2,5]. In contrast to the traditional artists’ pigments, the availability of certain SOPs is linked to an exact date of introduction, which can be traced by means of patents. Therefore, the identification of SOPs can not only provide information about the dating of an artwork, but can also expose forgeries [6]. Furthermore, knowledge of the occurrence of certain SOPs can provide useful information for restoration and conservation approaches or art technological studies.
SOPs can be difficult to detect in paint samples, because, due to high tinting strength, relatively small amounts are generally present [7]. Furthermore, these pigments have a very small particle size and are usually part of a complex system of ingredients in artists’ tube paints. Therefore, traditional methods for pigment identification, such as polarised light microscopy, can hardly be used. Identification with Fourier transform infrared (FTIR) spectroscopy may be equally complicated, because the strong and broad peaks of paint binders, inorganic substrates, or extenders can interfere with the SOPs’ information [8]. Invasive and destructive methods like pyrolysis gas-chromatography/mass-spectrometry (Py-GC/MS) can sometimes provide useful information on the presence of certain SOPs, such as azo-pigments. Others may not be suitable for this technique due to their thermal and chemical instability [9,10]. High performance liquid chromatography-mass spectrometry (HPLC-MS) can be challenging too, as getting the pigment to dissolve can be difficult and the effects of dissolution on the pigment structure may be problematic for interpretation [11]. MicroRaman spectroscopy (μ-RS) has been demonstrated to be a suitable analytical tool for the identification of SOPs. It is relatively sensitive towards these pigments, requires little sample material, and allows samples to be used for further, complementary analysis [12,13,14]. Approaches for μ-RS SOPs identification in samples from artworks are under constant development [9,10,15,16]. The main limitation in using μ-RS to identify SOPs in artists’ paints, however, is related to the fluorescence associated with organic binders, varnish layers and additives, or sometimes even with the target pigments themselves. In order to obtain an interpretable spectrum, it is important to perform measurements in equilibrium between fluorescence and the intensity of the Raman signal, which makes this approach time-consuming [8,17].
All these analytical techniques, however, require the sampling of small paint fragments, which, besides being destructive, can be challenging, as the probability that the samples are not representative for the materials studied might be quite high [18]. An analytical approach using non-invasive devices that allow for unlimited measurements therefore seems desirable [19]. The use of visible reflectance spectroscopy and visible-excited spectrofluorimetry was successful for the non-invasive identification of contemporary SOPs [20]. Yet, for the non-invasive study of artworks, Longoni et al. [20] recommend the use of further complementary non-invasive analysis. The usage of portable Raman systems seems to be promising [21,22]. A portable device that minimizes fluorescence and can operate at low energy is needed. Damage by strong laser absorption should be avoided to prevent local burns, which may occur especially on opaque or dark materials [8].
Different handheld Raman systems have been reviewed and tested for their application in the field of cultural heritage [19,23,24,25]. Technological developments have countered the most difficult problems, such as low Raman signal, high fluorescence, and environmental interactions, as well as the positioning and focusing of the laser [26,27]. To date, the Bravo handheld Raman instrument developed by Bruker seems to be the most promising device [19] and its applicability to the study of modern art was evaluated [28]. This device employs a DUO Laser system (785 nm and 853 nm), recording spectra in two separate spectral ranges of 300–2200 and 1200–3200 cm−1, respectively. The patented sequential shifted excitation (SSETM) works by temperature-shifting the lasers over a small wavelength range and recording three spectra per laser, finally merging them into a seventh averaged spectrum. In this way, and through the use of near infrared lasers, the system is able to reduce fluorescence and excite colour with low efficiency, also enabling the measurement of, for example, varnished paint samples [19,23,27]. However, Pozzi et al. [19] observed that if the peaks and curves of the individual spectra differ too much from each other, there is a risk of creating artefacts within the averaged spectrum. Another disadvantage of the device is related to the fact that the only two adjustable settings are exposure time and acquisition number, but not the energy of the laser, which can be a risk for certain art-technological studies [19]. These aspects, regarding the spectral quality and applicability, are discussed within this study.
The aim of this research is to study the potential of a handheld Raman device in identifying SOPs in historical varnished paint-outs (1932–1950) with consideration to future applications in the non-invasive study of early SOP-containing paintings.
Ongoing work on the collection of SOPs Raman reference spectra (https://soprano.kikirpa.be, accessed on 30 June 2021 [14,29]) enables and simplifies pigments’ identification. These reference spectra were often obtained by studying modern artists’ supplies and can give an idea of the actual SOPs that can be expected.
Before 1950, the following SOP groups were already developed and established: β-Naphthol pigment lakes; BON pigment lakes (pigments produced with 2-hydroxy-3-naphthoic acid as coupling component); β-Naphthol; Pyrazolones; Hansa Yellows; Diarylides; Naphthol AS; Iron complex Pigment Green B; Phthalocyanines; Nickel Azo Yellow [30]. However, as already mentioned, the actual distribution and use of this “new” group of pigments within artists’ materials is still unclear today. Attempts to provide an overview of the SOPs that were known before 1950 and of their occurrence in artists’ paints demonstrated the need for more research [7,30]. A starting point could be the study of the production archives of artists’ material suppliers.
Our research in the archives of Royal Talens and its main pigment suppliers before 1950, BASF and Bayer, shows that there are considerably more SOPs used in artists’ paints than hitherto known [4,11,31]. Notably, most of them have not been traced in paintings.
This study focuses on SOPs in Royal Talens’ artists’ oil paints from before 1950. Soon after its foundation in 1899, Talens developed into a major international player on the market, already selling more than 1,500,000 oil paint tubes in 1918 [32]. European artists such as van Dongen, Kirchner, Appel, and Munch used Talens’ Rembrandt oil paints [33]. In this position, Talens declared the use of SOPs in fine artists’ oil paint publicly in the beginning of the 1930s.
Based on pre-1950 oil paint recipes [4,16], a selected set of paint-outs (1932–1950) from the Royal Talens’ archive was investigated. For the assessment and evaluation of the handheld Raman spectra, micro samples of the historic Talens paint-outs were also analysed with a benchtop microRaman spectrometer.
Handheld Raman spectra were evaluated, taking into account their major points of criticism, like background fluorescence, the intensity of the Raman signal, spectral resolution, and the risks of laser energy induced damages.
2. Materials and Methods
2.1. Samples
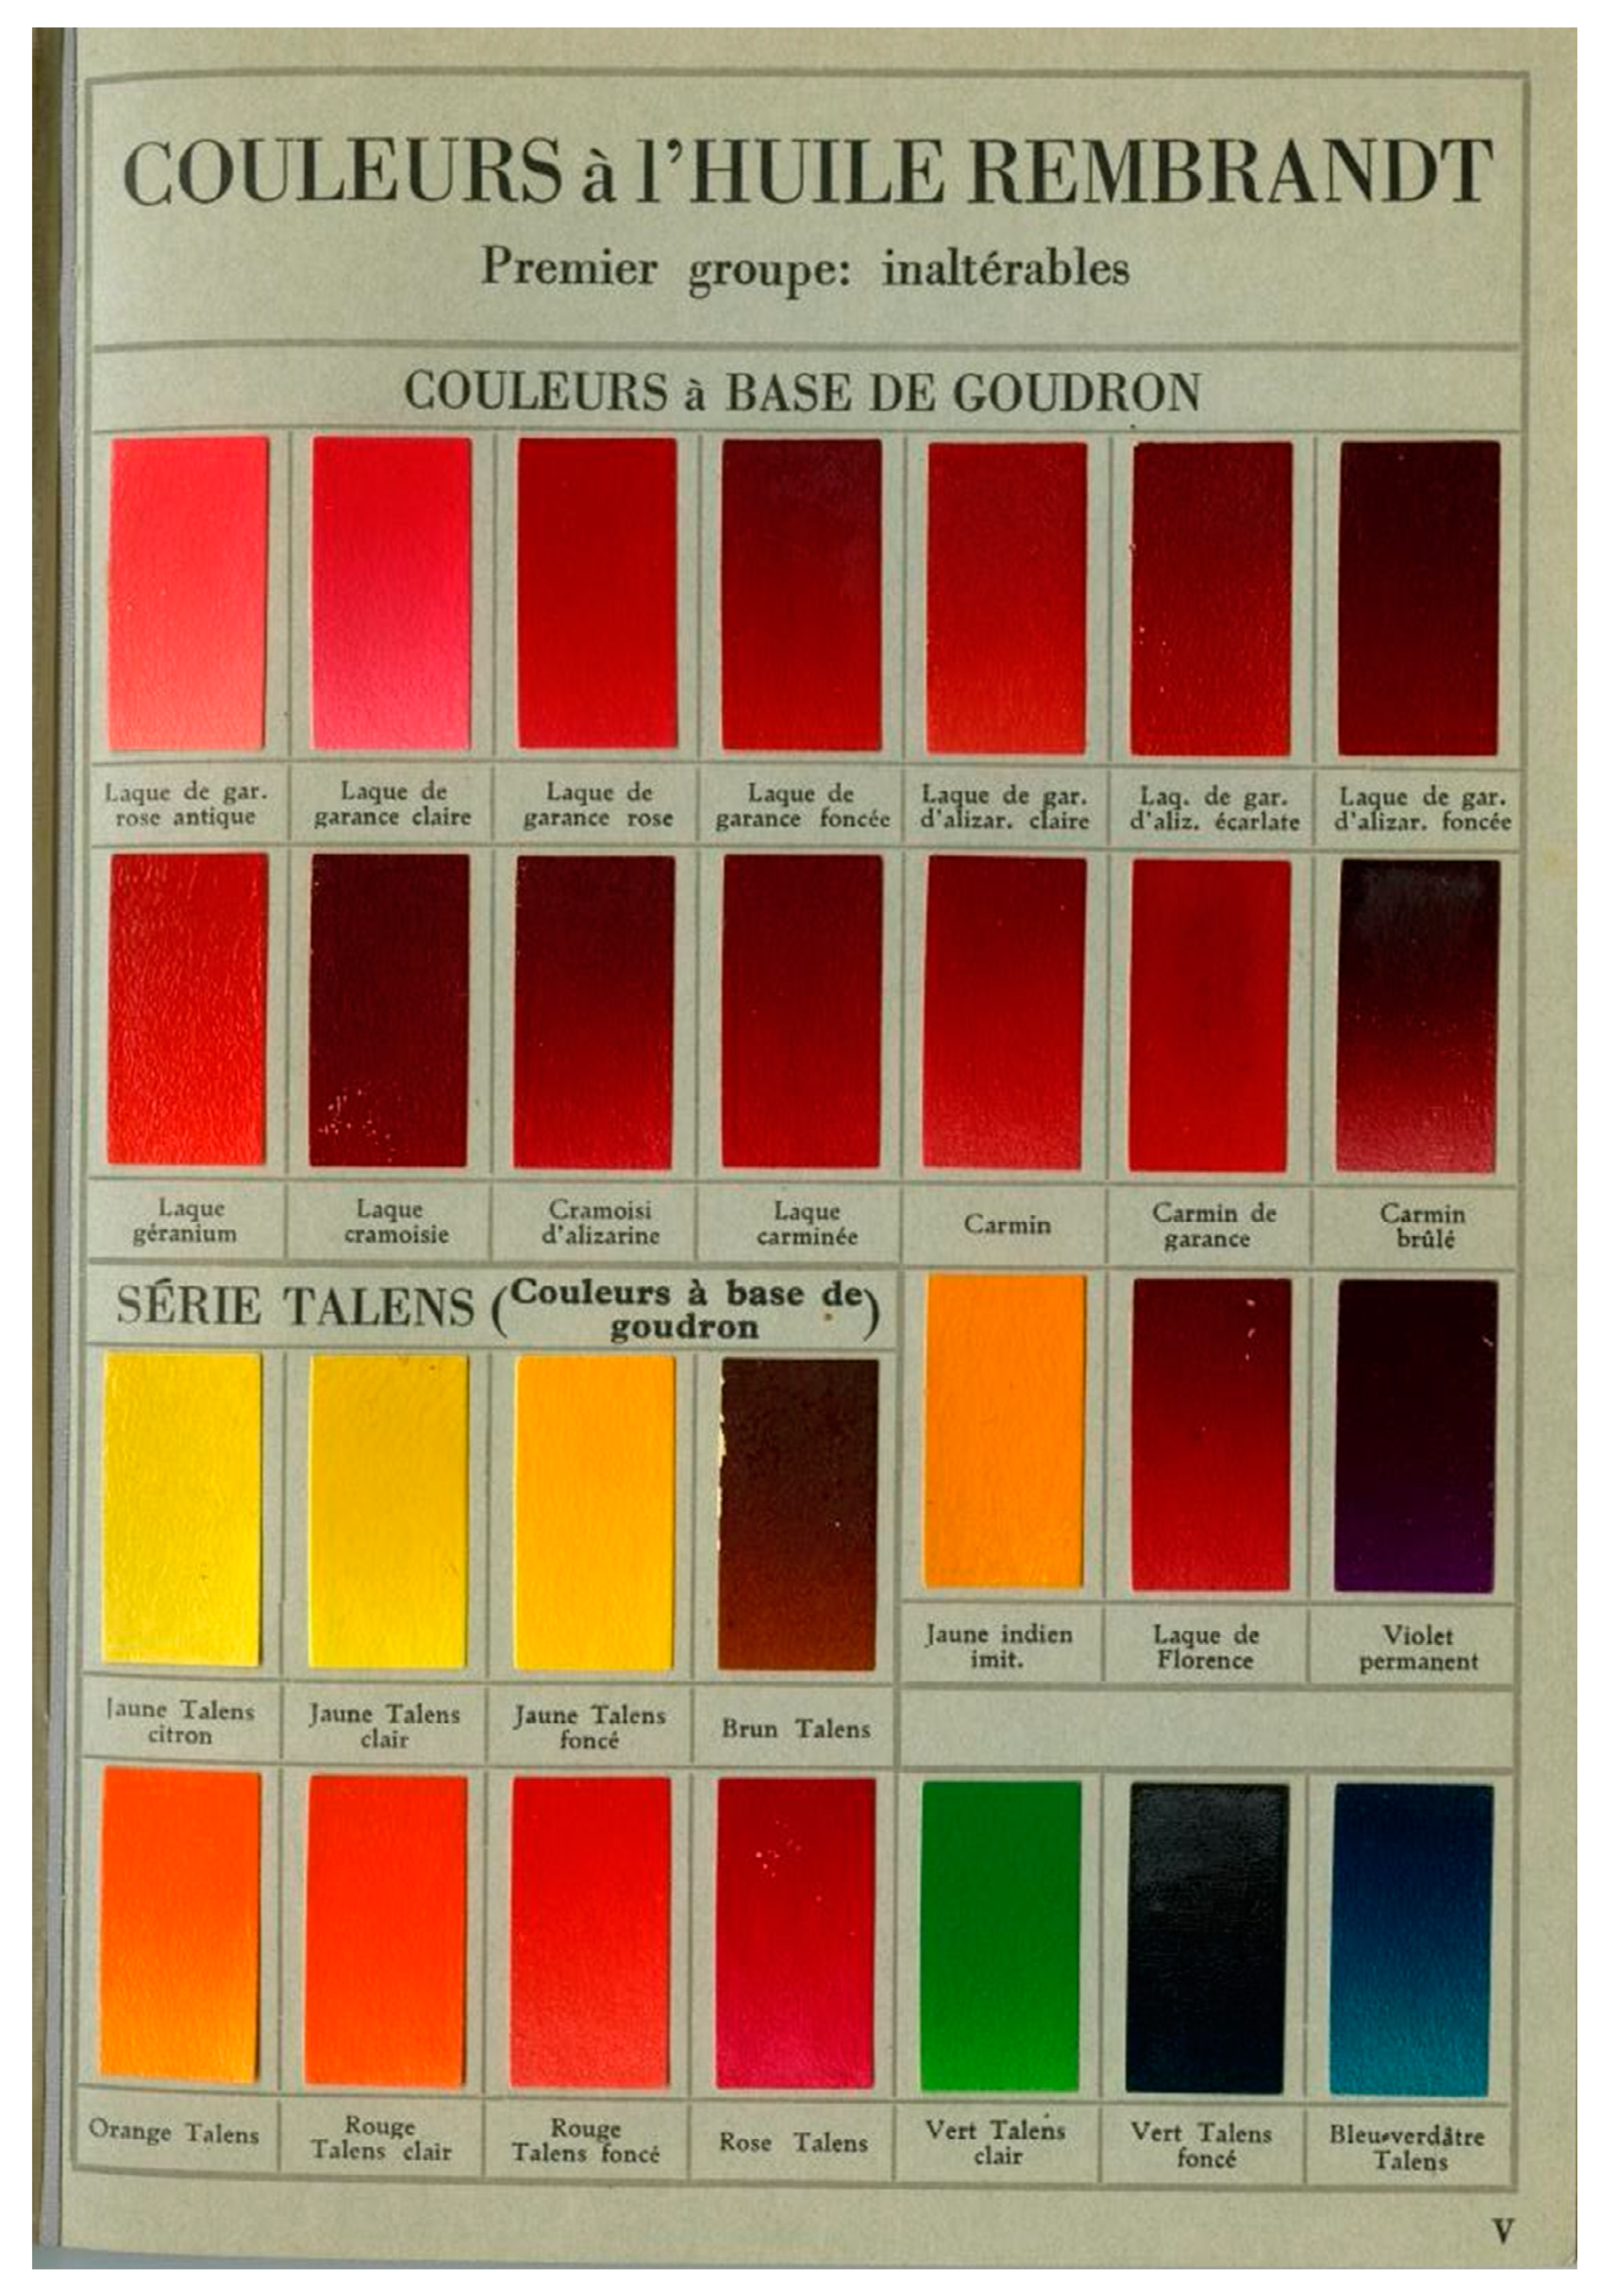
The sample selection consisted of paint-outs from 1932 to 1950. These were included within colour charts specifically dedicated to coal-tar pigments, labelled as unalterable Teerkleurstoffen [coal-tar dyes] (Figure 1), which were published in six editions of the book Kunstschildersmaterialen en Schildertechniek [Painting materials and painting technique] [34,35,36,37,38,39,40]. The books deal with Talens’ fine Rembrandt artists’ oil paints, which were on the market since 1904 [4,33]. In addition, some paint-outs that were listed under inorganic names within the inorganic paint colour charts, but suspected to contain SOPs according to recipe interpretation, were examined as well. To obtain results on a larger data set, it was decided to measure (if available) the same set of 42 potentially SOP-containing paint-outs in each Kerdijk edition, even if, according to the recipes, the same SOPs were to be expected. In total, 193 samples were analysed with handheld Raman spectroscopy and for comparison with benchtop microRaman spectroscopy. Samples were labelled with a “K” (Kerdijk) and the year of publication. All paint-outs were varnished.
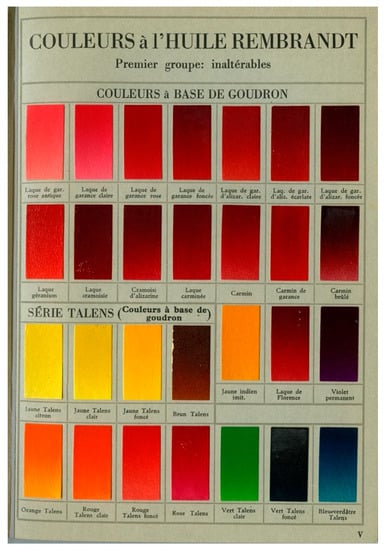
Figure 1.
Kerdijk colour chart from 1932, presenting a selection of Talens’ Rembrandt artists’ oil paints ‘à base de goudron’ (based on coal tar). Please note that the colours are defined as ‘inaltérables’ (unalterable).
2.1.1. Instrumentation
The handheld Raman measurements were conducted with a Bravo Spectrometer (Bruker). The device works with two excitation wavelengths, recording spectra in two separate spectral ranges of 300–2200 and of 1200–3200 cm−1 with a DUO Laser system (785 nm and 853 nm). The near infrared lasers (NIR) aid in reducing fluorescence, as the photon does not possess enough energy to induce high molecular fluorescence [22,41]. Furthermore, using two lasers enables researchers to obtain better quality data in the overlap region of 1200–2200 cm−1 and lowers fluorescence interference [19]. The energy reaching the surface during the measurement is officially stated to be less than 100 mW (Table 1). Since the energy cannot be set manually, this indication is too unspecific to be taken as a guide value when analysing delicate cultural heritage objects. In order to estimate the energy that actually reaches the surface of the sample, measurements were carried out with a “Power and Energy Meter” from Thorlabs, using the same settings of the historic Talens paint-outs analyses. The measured energy value was about 45 mW, with measurements conducted at a distance of about half a millimetre, with a spot size of 1 mm. This value also agrees with that determined by Pozzi et al. of about 50 mW [19].

Table 1.
Characteristics of the microRaman and handheld Raman devices.
To evaluate the handheld device’s performance for the identification of SOPs, the colour charts were also analysed with a benchtop microRaman instrument. These reference spectra were recorded with a RamanMicro 300 in combination with a RamanStation 400F (Perkin Elmer, Waltham, MA, USA) and an Olympus BX51M microscope (Table 1). MicroRaman spectra were acquired from very small samples of the same paint-outs. After the mechanical removal of the varnish from the sampling area, minute paint fragments were taken at the upper right edge where the paint film is thickest. The samples were placed on an aluminium tape, mounted on a glass slide, and positioned as close to perpendicular to the optical axis as possible to reduce fluorescence [42].
Spectra were recorded in the range of 300–2000 cm−1, in order to perform the analysis within the same range as the handheld Raman. The microRaman reference spectra were only baseline corrected when necessary for their readability.
2.1.2. Acquisition of Spectra
As the Bruker Bravo does not include a camera, the measurement preparation demanded precise positioning. To locate and define the measuring spot on the paint-outs, a Melinex® template in the shape of the optical head was used. Measurements were taken at the closest possible distance without touching the surface, which was approximately half a millimetre. Since this study was undertaken to investigate the possibility of analysing SOPs in real artworks where focusing on well-defined paint spots is mandatory, it was decided not to use the de-focusing tip. Handheld Raman spectra were recorded with initial settings of 100 ms and 20 acquisitions within the spectral range of 300–2000 cm−1. These settings proved to be efficient to verify the Raman signal and fluorescence. Depending on the signal to noise ratio of the spectrum, these settings were tuned to: acquisition times 100–300 ms; 50–200 acquisitions.
A common limitation of portable Raman devices is the reduced possibilities to control the measurement settings [19]. For the Bravo spectrometer, the lack of direct control of the laser energy was considered potentially problematic. As the maximum energy reaching the surface is quite high in comparison to the Perkin Elmer microRaman instrument (Table 1), the measurement spot was checked under the microscope before and after analysis in order to be able to track possible laser induced damage.
Measurements were recorded without removing the varnish layer from the paint-outs at the upper middle edge of the samples, in order to measure a spot with high pigment density.
2.1.3. Interpretation of Raman spectra
Handheld Raman spectra were interpreted using reference spectral databases. Raman reference spectra of SOPs have been published listing the peaks with their relative intensity or in digital databases [10,14,29]. Furthermore, the continuously updated in-house built Raman spectral library was used.
It should, however, be taken into account that reference spectra are mostly acquired on pure materials, like pigment powders. When compared with paint systems, differences in heat dispersion or fluorescence behaviour may lead to slight differences in the spectra [43,44]. The excitation wavelength and power of the laser can influence the reference spectra too. As KIK-IRPA documents the exact measurement settings for each reference spectrum (https://soprano.kikirpa.be, accessed on 21 August 2020), their database was used as the main reference for the interpretation of the spectra, in addition to the in-house database.
In some cases, it was not possible to interpret the Raman spectrum and assign it to a defined pigment. In these specific cases, additional methods, such as ultra-high performance liquid chromatography mass spectrometry (UHPLC-MS), were used to try to identify the unknown samples. These results were verified by analysing corresponding references from the in-house reference collection.
3. Results and Discussion
As a pre-interpretation step of the Raman spectra acquired from the Kerdijk paint-outs, production recipes collected at the Talens’ archives were studied and evaluated and a list of expected SOPs was made [4]. Where possible, the commercial names used in the recipes were related to the Colour Index definitions, e.g., the pigment Hansa Geel 10 [Hansa Yellow 10] corresponds to PY3. Then, the acquired Raman spectra were compared with the reference spectra of the expected SOPs.
Table 2 gives a detailed overview of the analysed paint-outs and their interpretation. The expected SOPs according to the recipes are reported. The settings for acquisition refer to the averaged settings yielding the best result. It was found that the handheld Raman produces readable and interpretable spectra with defined peaks at almost constant settings of 150–200 ms exposure time and 100–200 acquisitions.
Table 2.
Summary of the results obtained with the handheld Raman device on Kerdijk colour charts with Talens’ Rembrandt oil paint-outs dated 1932–1950.
3.1. Identified SOPs
The Talens Rembrandt oil paints of the Kerdijk colour charts were revealed to contain the SOPs of eight different pigment groups. Furthermore, it was also possible to identify paints that contained a mixture of SOPs (Table 2).
Some of these SOPs belong to groups that are already well known to have been used in fine artists’ materials and can be expected in this time period. This concerns SOPs belonging to the BONA, monoazo, and phthalocyanine group as well as the ß-Naphthol pigments PR3 and PO5, which have indeed been found in artworks from before 1950 [30]. In other cases, the Kraplak [madder], Karmijn [carmine], and Alizarine [alizarine] paint-outs provided well defined spectra, but the SOPs have not yet been identified and are labeled as “unknowns”.
Among the identified SOPs, there are also some pigments that were not yet known to have been used for the production of fine artists’ paints dated before 1950. The occurrence of the mordant dyes and triarylcarbonium pigments are among the most surprising results of this study and emphasizes the importance of searching unexpected possible pigment groups in pre-1950 artists’ materials. Three examples are discussed in more detail.
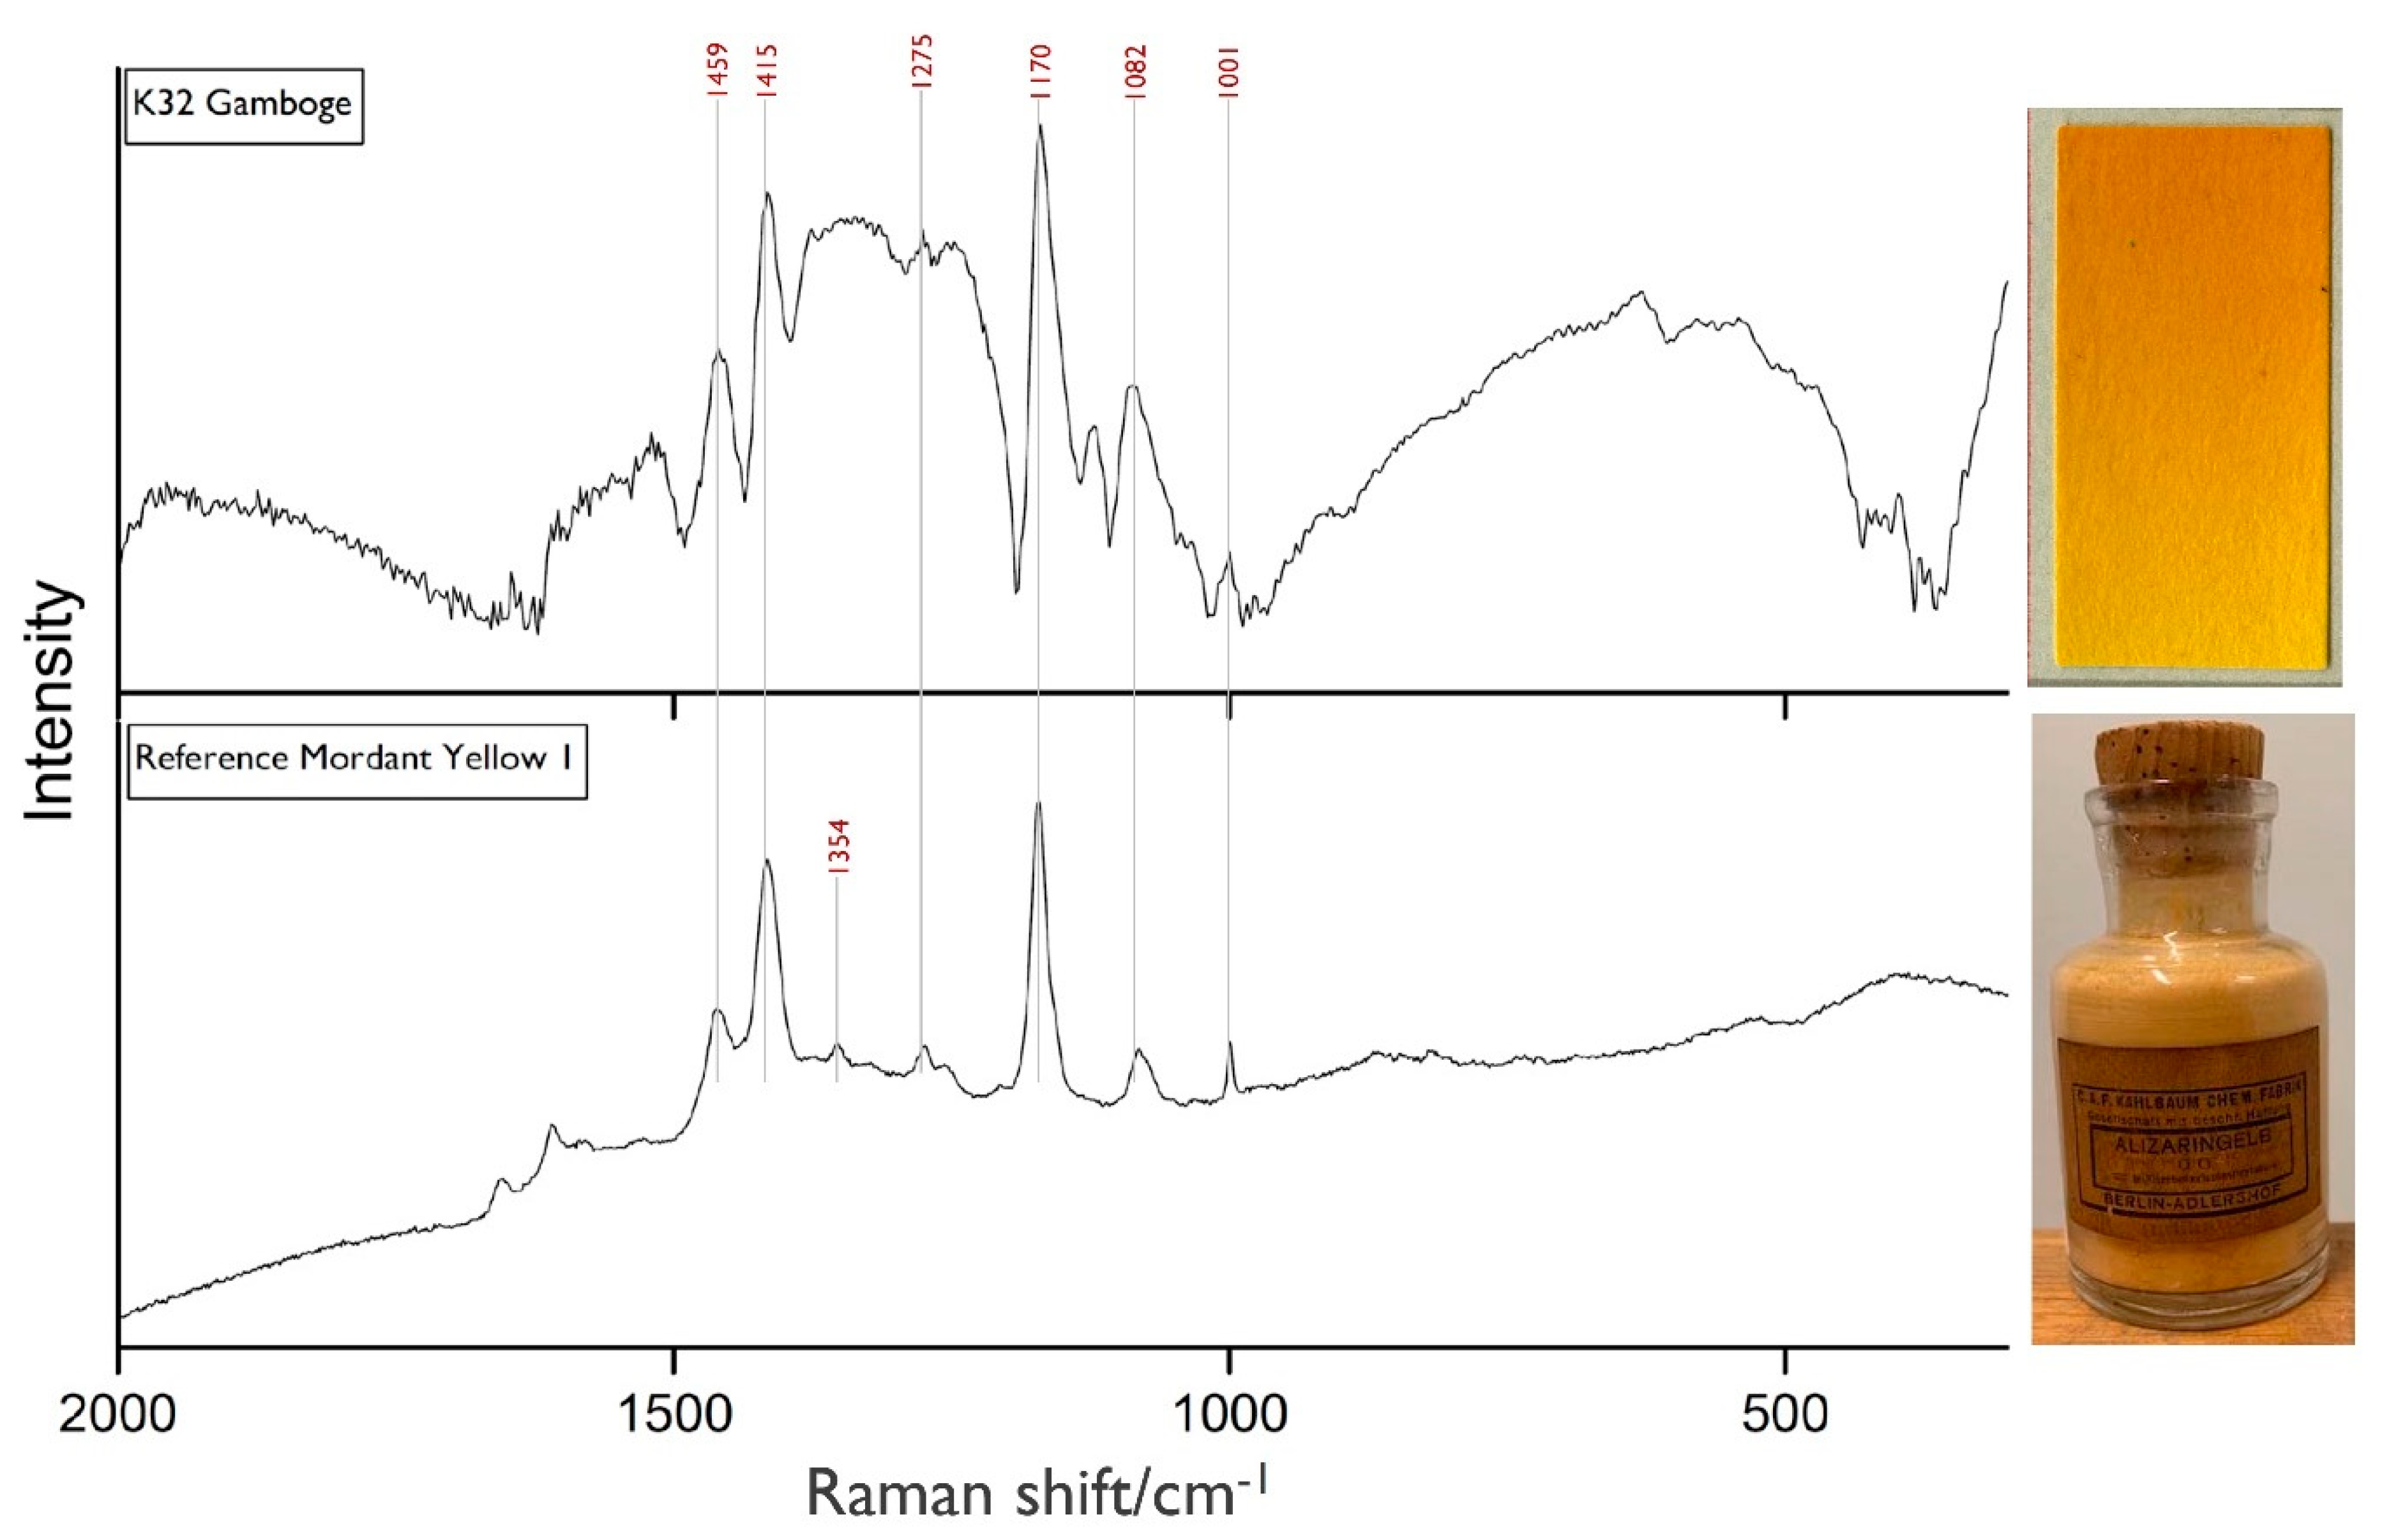
The paint-out Gamboge from 1932 was revealed to contain Mordant Yellow 1. This SOP was discovered by Nietzki in 1887 and is also known as Alizaringelb GG [Alizarine Yellow GG] or Beizengelb TG [Mordant Yellow TG] [45]. Wagner (1928) reports that this pigment was not very popular because of the elaborate preparation needed to obtain a pure product. It is therefore surprising that, according to the recipe records, Talens has used this SOP for fine artists’ material production for almost 20 years [34,46]. Figure 2 displays the handheld Raman spectrum of the paint-out Gamboge and the microRaman spectrum of Mordant Yellow 1 from the in-house reference collection. The handheld Raman spectrum displays the peaks that allow an interpretation, but also contains artifacts.
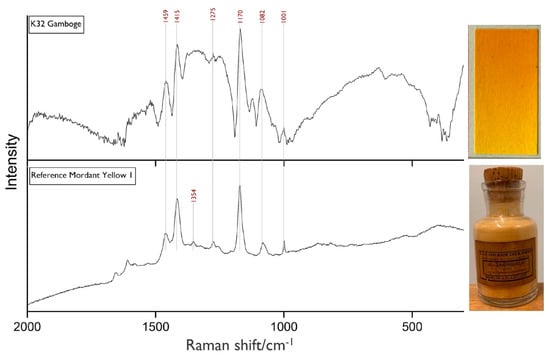
Figure 2.
Handheld Raman spectrum of the paint-out Gamboge (K32) and the microRaman spectrum of Mordant Yellow 1, labelled as Alizarine Yellow GG (reference collection of the Cultural Heritage Agency of the Netherlands, Amsterdam, the Netherlands).
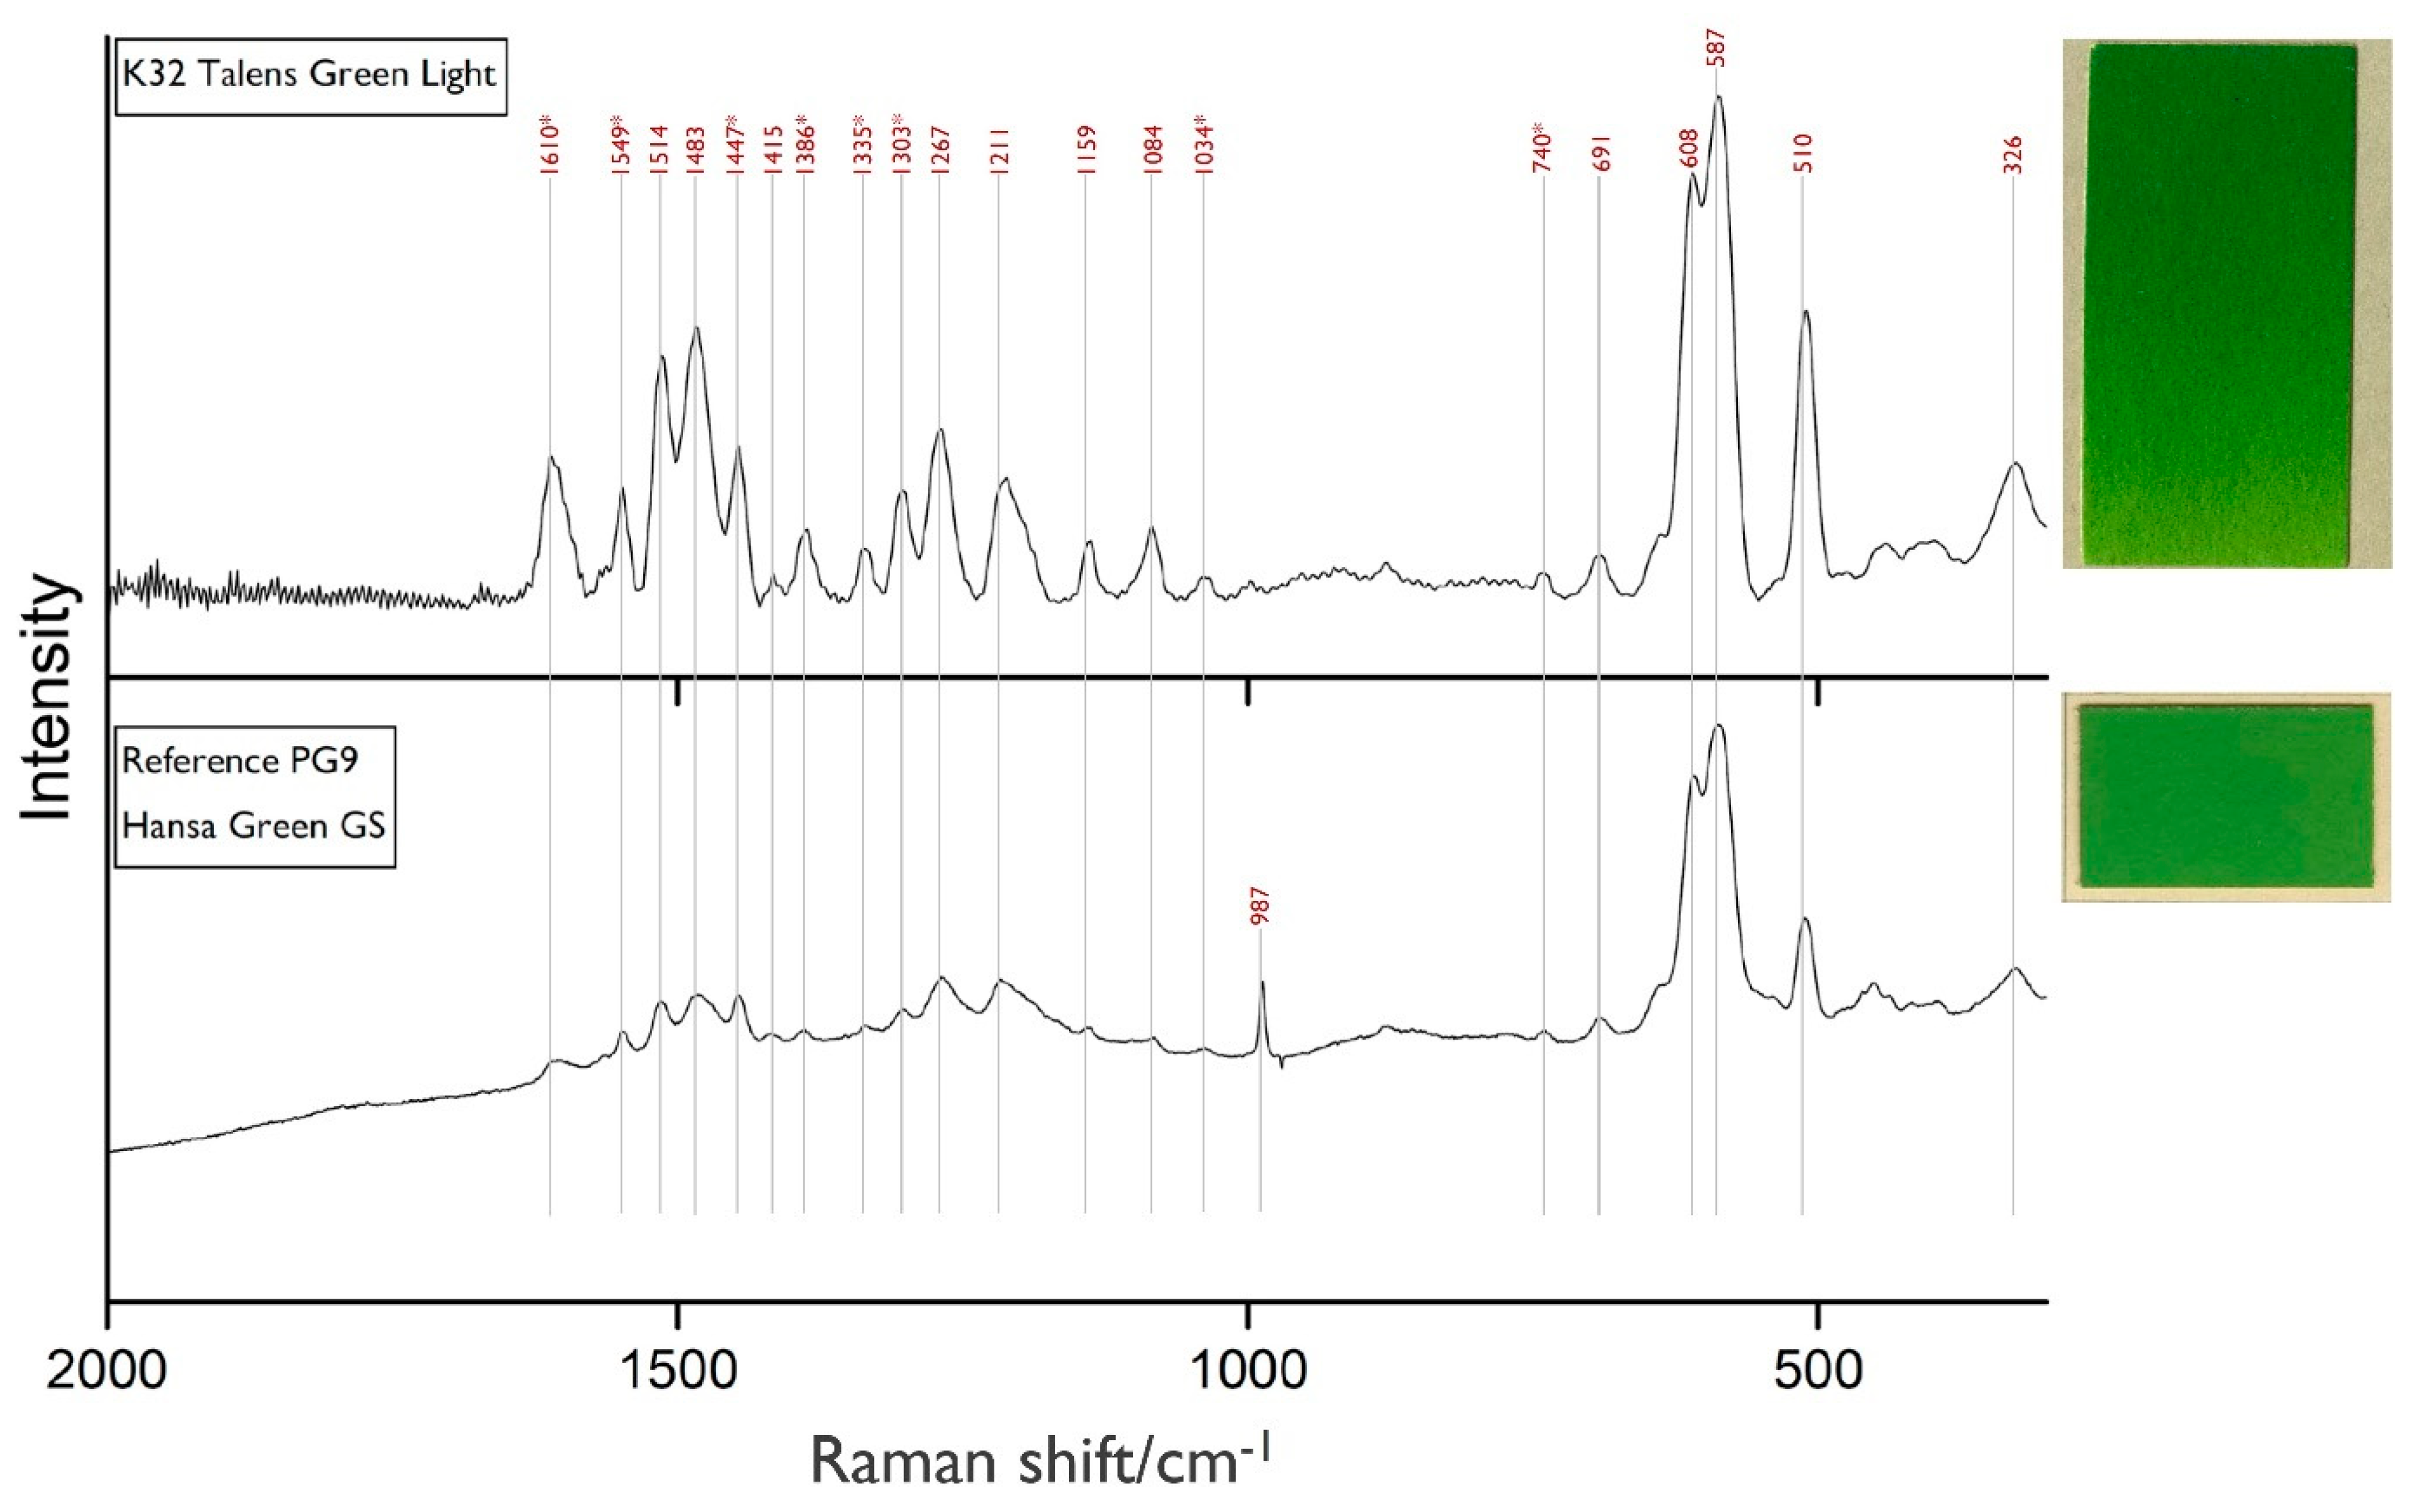
Within the paint-out Talens Groen Licht [Talens Green Light] the pigment PG9, a SOP belonging to the group of Indamine, was detected. This pigment, a barium salt of an iron complex, was discovered in 1909 and labelled as Hansagrün GS [45]. It was recommended by the Colour Index to be used “particularly in mixture with CI PY 1 or 3” [45,46,47]. Schultz (1931) describes the pigment as a “very lively green when mixed with Hansa Yellow for all purposes (almost as fiery as Schweinfurter Green)” [48]. This suggests its use in artists’ colours in mixture with monoazo yellows as a substitute of the toxic inorganic pigment and fits therefore to Talens’ application, documented in the recipe of Talens Green Light.
Figure 3 shows the handheld Raman spectrum of the paint-out Talens Green Light and, for comparison, the microRaman spectrum of a Hansagrün GS reference (paint-out from Wagner, 1928). The peaks of the PY3 component in the reference spectrum are very faint, which can be related to different PY3 and PG9 ratios within the samples.

Figure 3.
Handheld Raman spectrum of paint-out Talens Green Light (K32) and the microRaman spectrum of reference Hansagreen GS (Wagner, 1927), mixed with barium sulphate (987 cm−1), both showing the characteristic peaks of PG9 in mixture with PY3. The peaks that clearly correspond to the KIK-IRPA reference for PY3 are highlighted with a star.
Two paints of the Talens in-house brand, labelled as “Talens paints”, showed triarylcarbonium pigments. In the paint-out Talens Groen Donker [Talens Green Dark] of the 1941–1950 editions, the green pigment PG2 was identified. PG2, brought to the market under the product name Fanalgelbgrün [Fanal Yellow Green], is defined as either a mixture of Basic Green 1 and Basic Yellow 1, precipitated with phosphotungstomolybdic acid (PTMA), or Basic Green 1 with Auramin O, precipitated with PTMA [31,45,48].
The other triarylcarbonium pigment that was identified is PB8. It was detected in the paint-out Talens Green Dark (1932), contradicting the recipe (Table 2), and in the Talens Groen Blauw [Talens Green Blue] in the editions from 1932 and 1937. PB8, labelled in the Talens recipes as Fanalbremerblau G neu [Fanal Bremer Blue G new], is a mixture of Basic Blue 5 and Basic Green 1, precipitated with PTMA [17]. Figure 4 displays the handheld Raman spectrum of Talens Green Blue and the reference microRaman spectrum of a reference sample, labelled as a mixture of Basic Blue 5 and Basic Green 1 precipitated with PTMA, provided from the Historic dye collection of the technical university in Dresden.
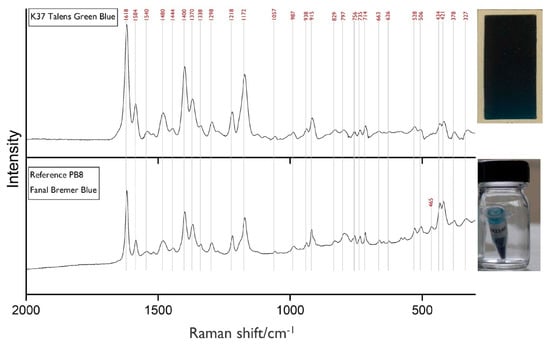
Figure 4.
Handheld Raman Spectrum of paint-out Talens Green Blue (K32) and the microRaman spectrum of a reference sample containing Basic Blue 5 and Basic Green 1, precipitated with PTMA (Historic Dye Collection, Dresden, Germany).
Both PB8 and PG2 belong to the Fanal brand, which was introduced by I.G. Farben in 1924 [31]. Lomax et al. [1] point out that “the major use of these pigments [triarylcarbonium] is in the printing ink industry” and it seems surprising that Talens chose these SOPs for their fine artists’ oil paint brand. However, Steger et al. detected two pigments (PV2 and PG1), belonging to this group, in a reverse glass painting from 1945 [49].
3.2. Evaluation of the Handheld Raman’s Applicability
Raman spectra were not only interpreted for pigments’ identification, but also evaluated for readability and quality. When dealing with the handheld Raman spectra that were acquired from our samples, we came across some of the issues that generally arise in the discussions about the applicability of handheld Raman spectroscopy [19].
A common problem which can lead to uninterpretable spectra is the occurrence of strong fluorescence that obscures the Raman scattering signal and affects the accuracy and sensitivity of the measurements [50]. As mentioned, the Bravo-Raman device uses sequentially shifted excitation, a patented fluorescence minimization method [19].
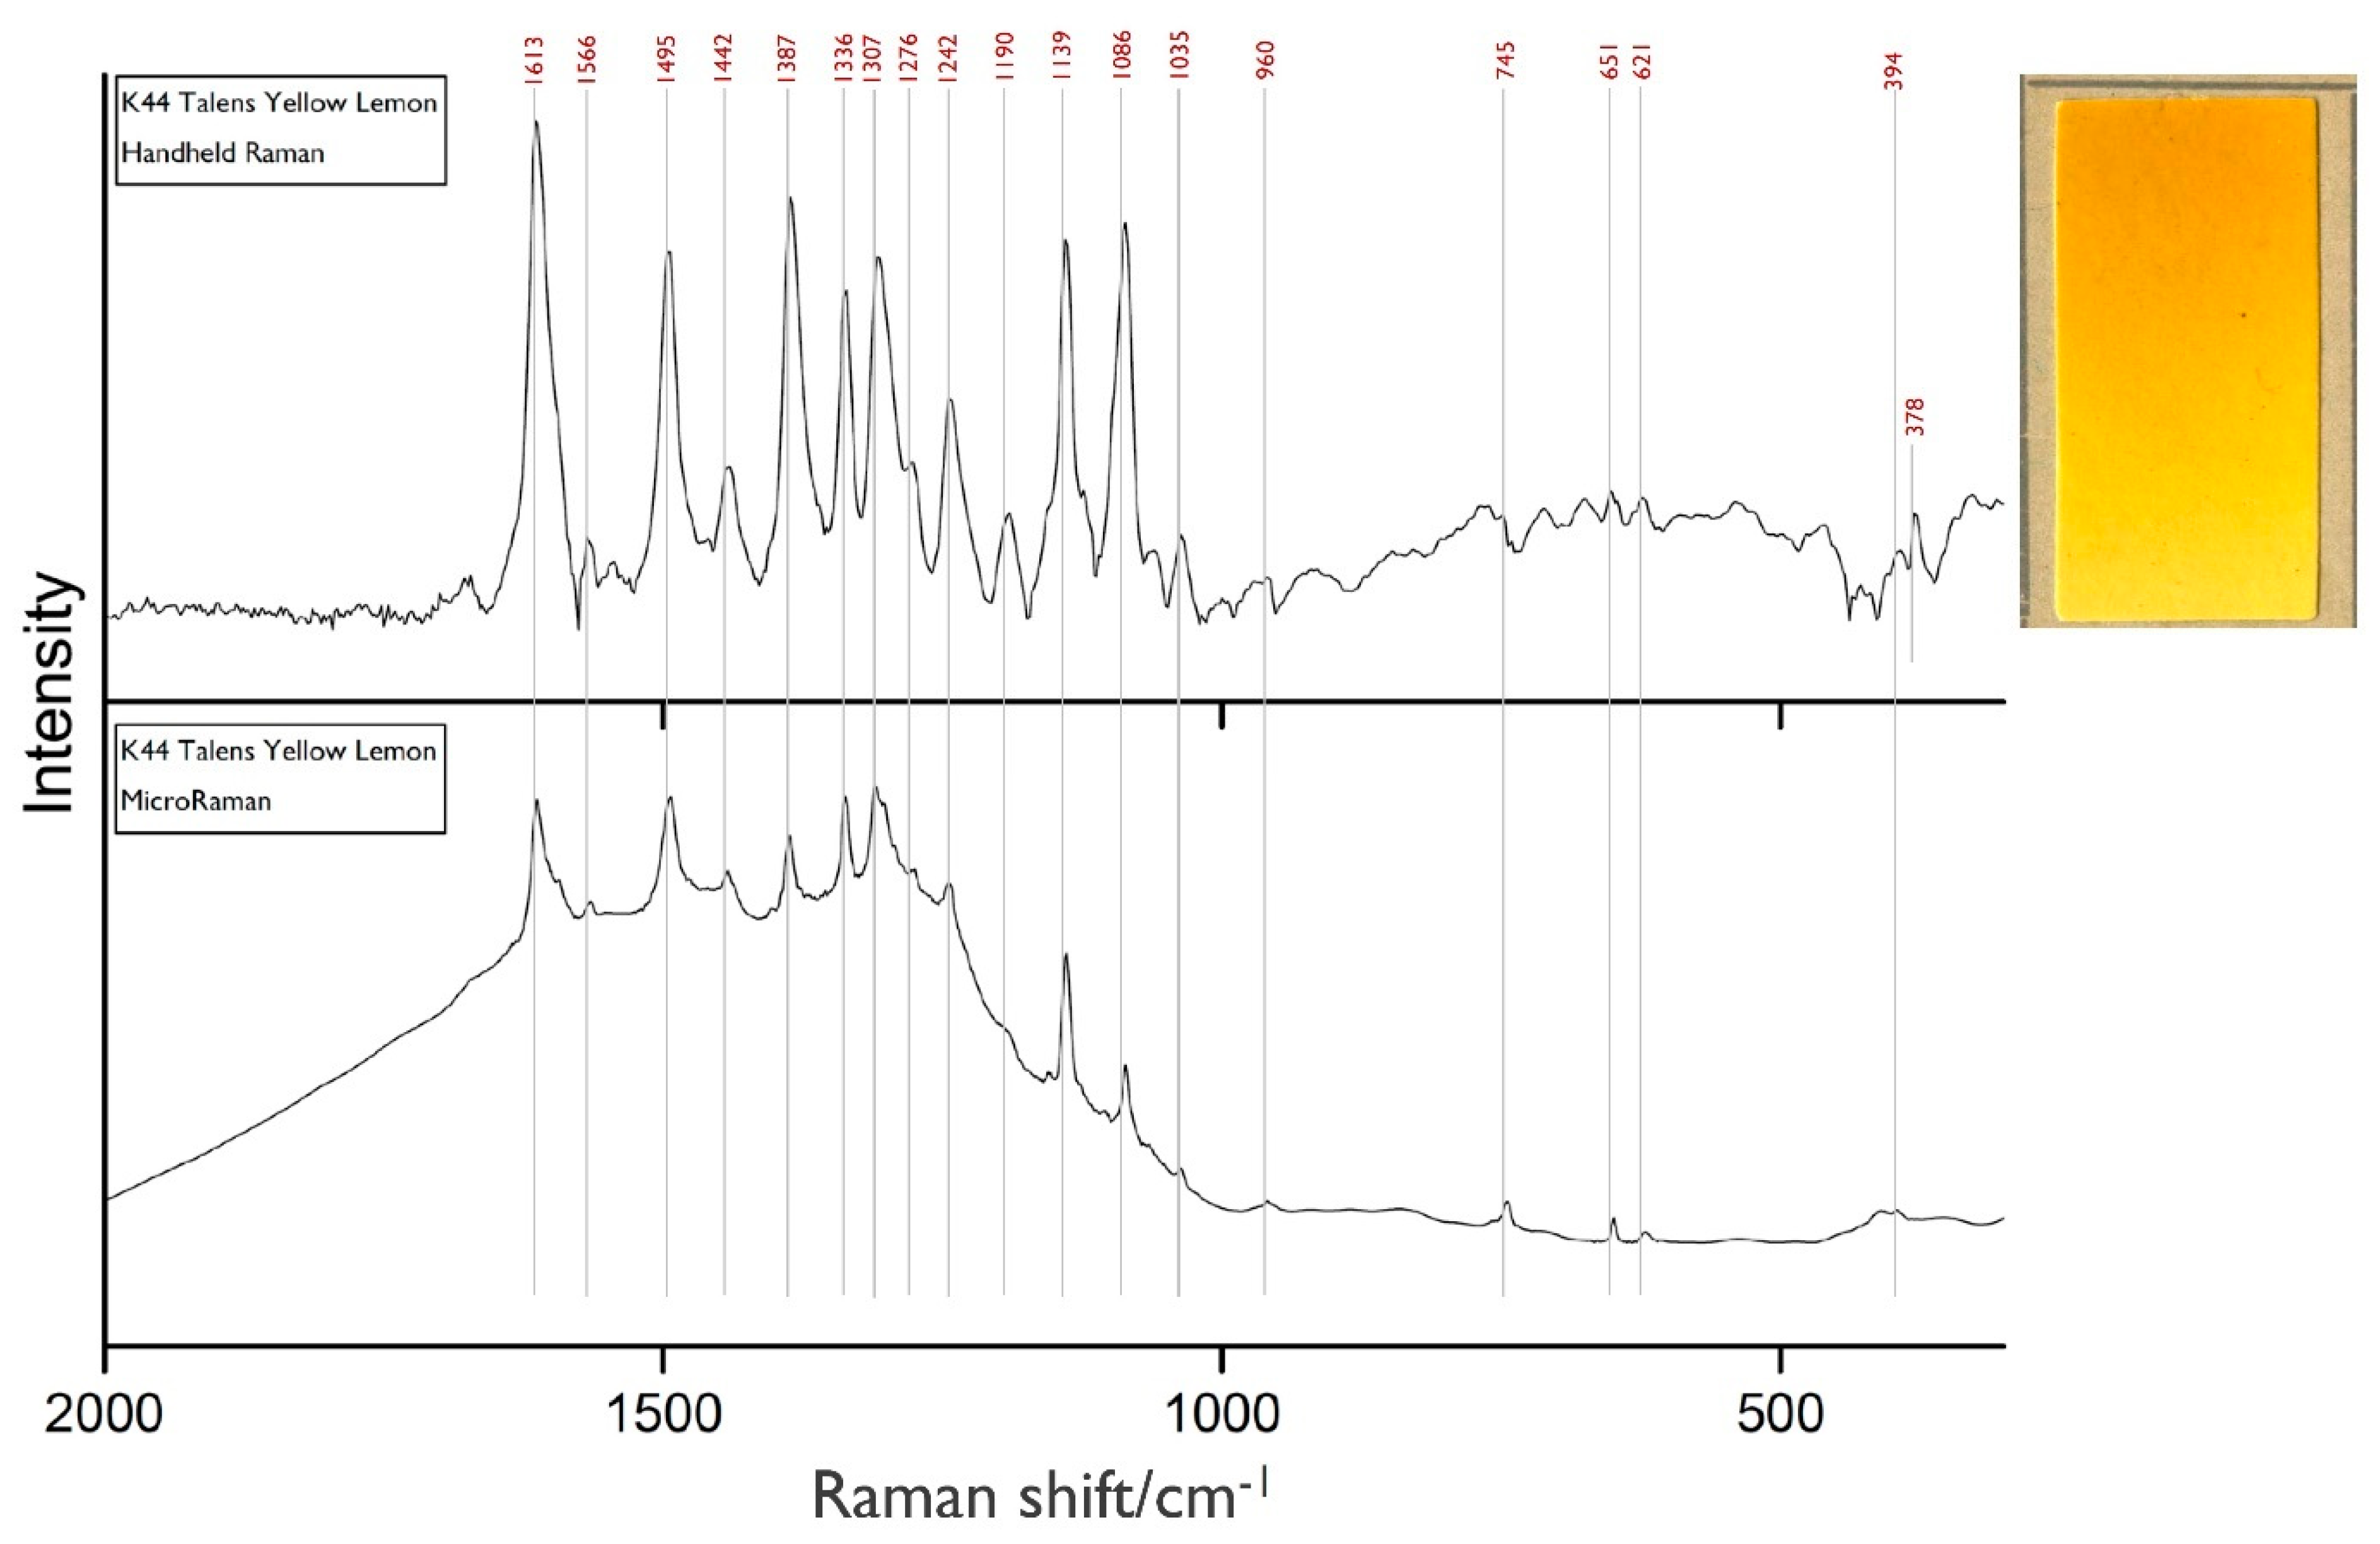
As an example, a paint-out containing a Hansa Yellow pigment was selected to demonstrate the result of the automatic fluorescence reduction. This important class of SOPs, which is commonly found in modern artworks [30], often exhibits strong fluorescence in Raman spectroscopy. Figure 5 shows the handheld Raman spectrum of the paint-out Talens geel citroen [Talens yellow lemon], where Hansa Yellow (PY3) was identified. The spectrum recorded with the microRaman was not further processed after acquisition and shows a distinct fluorescence, whereas the spectrum recorded with the handheld Raman appears to be corrected in this respect, thanks to the SSE approach and the two lasers. The spectrum presents intense peaks, although the spectral resolution is not very high, as demonstrated by the lack of a peak at ~1593 cm−1, which was present in the microRaman spectrum.

Figure 5.
Handheld and microRaman spectra of paint-out K44 Talens Yellow Lemon.
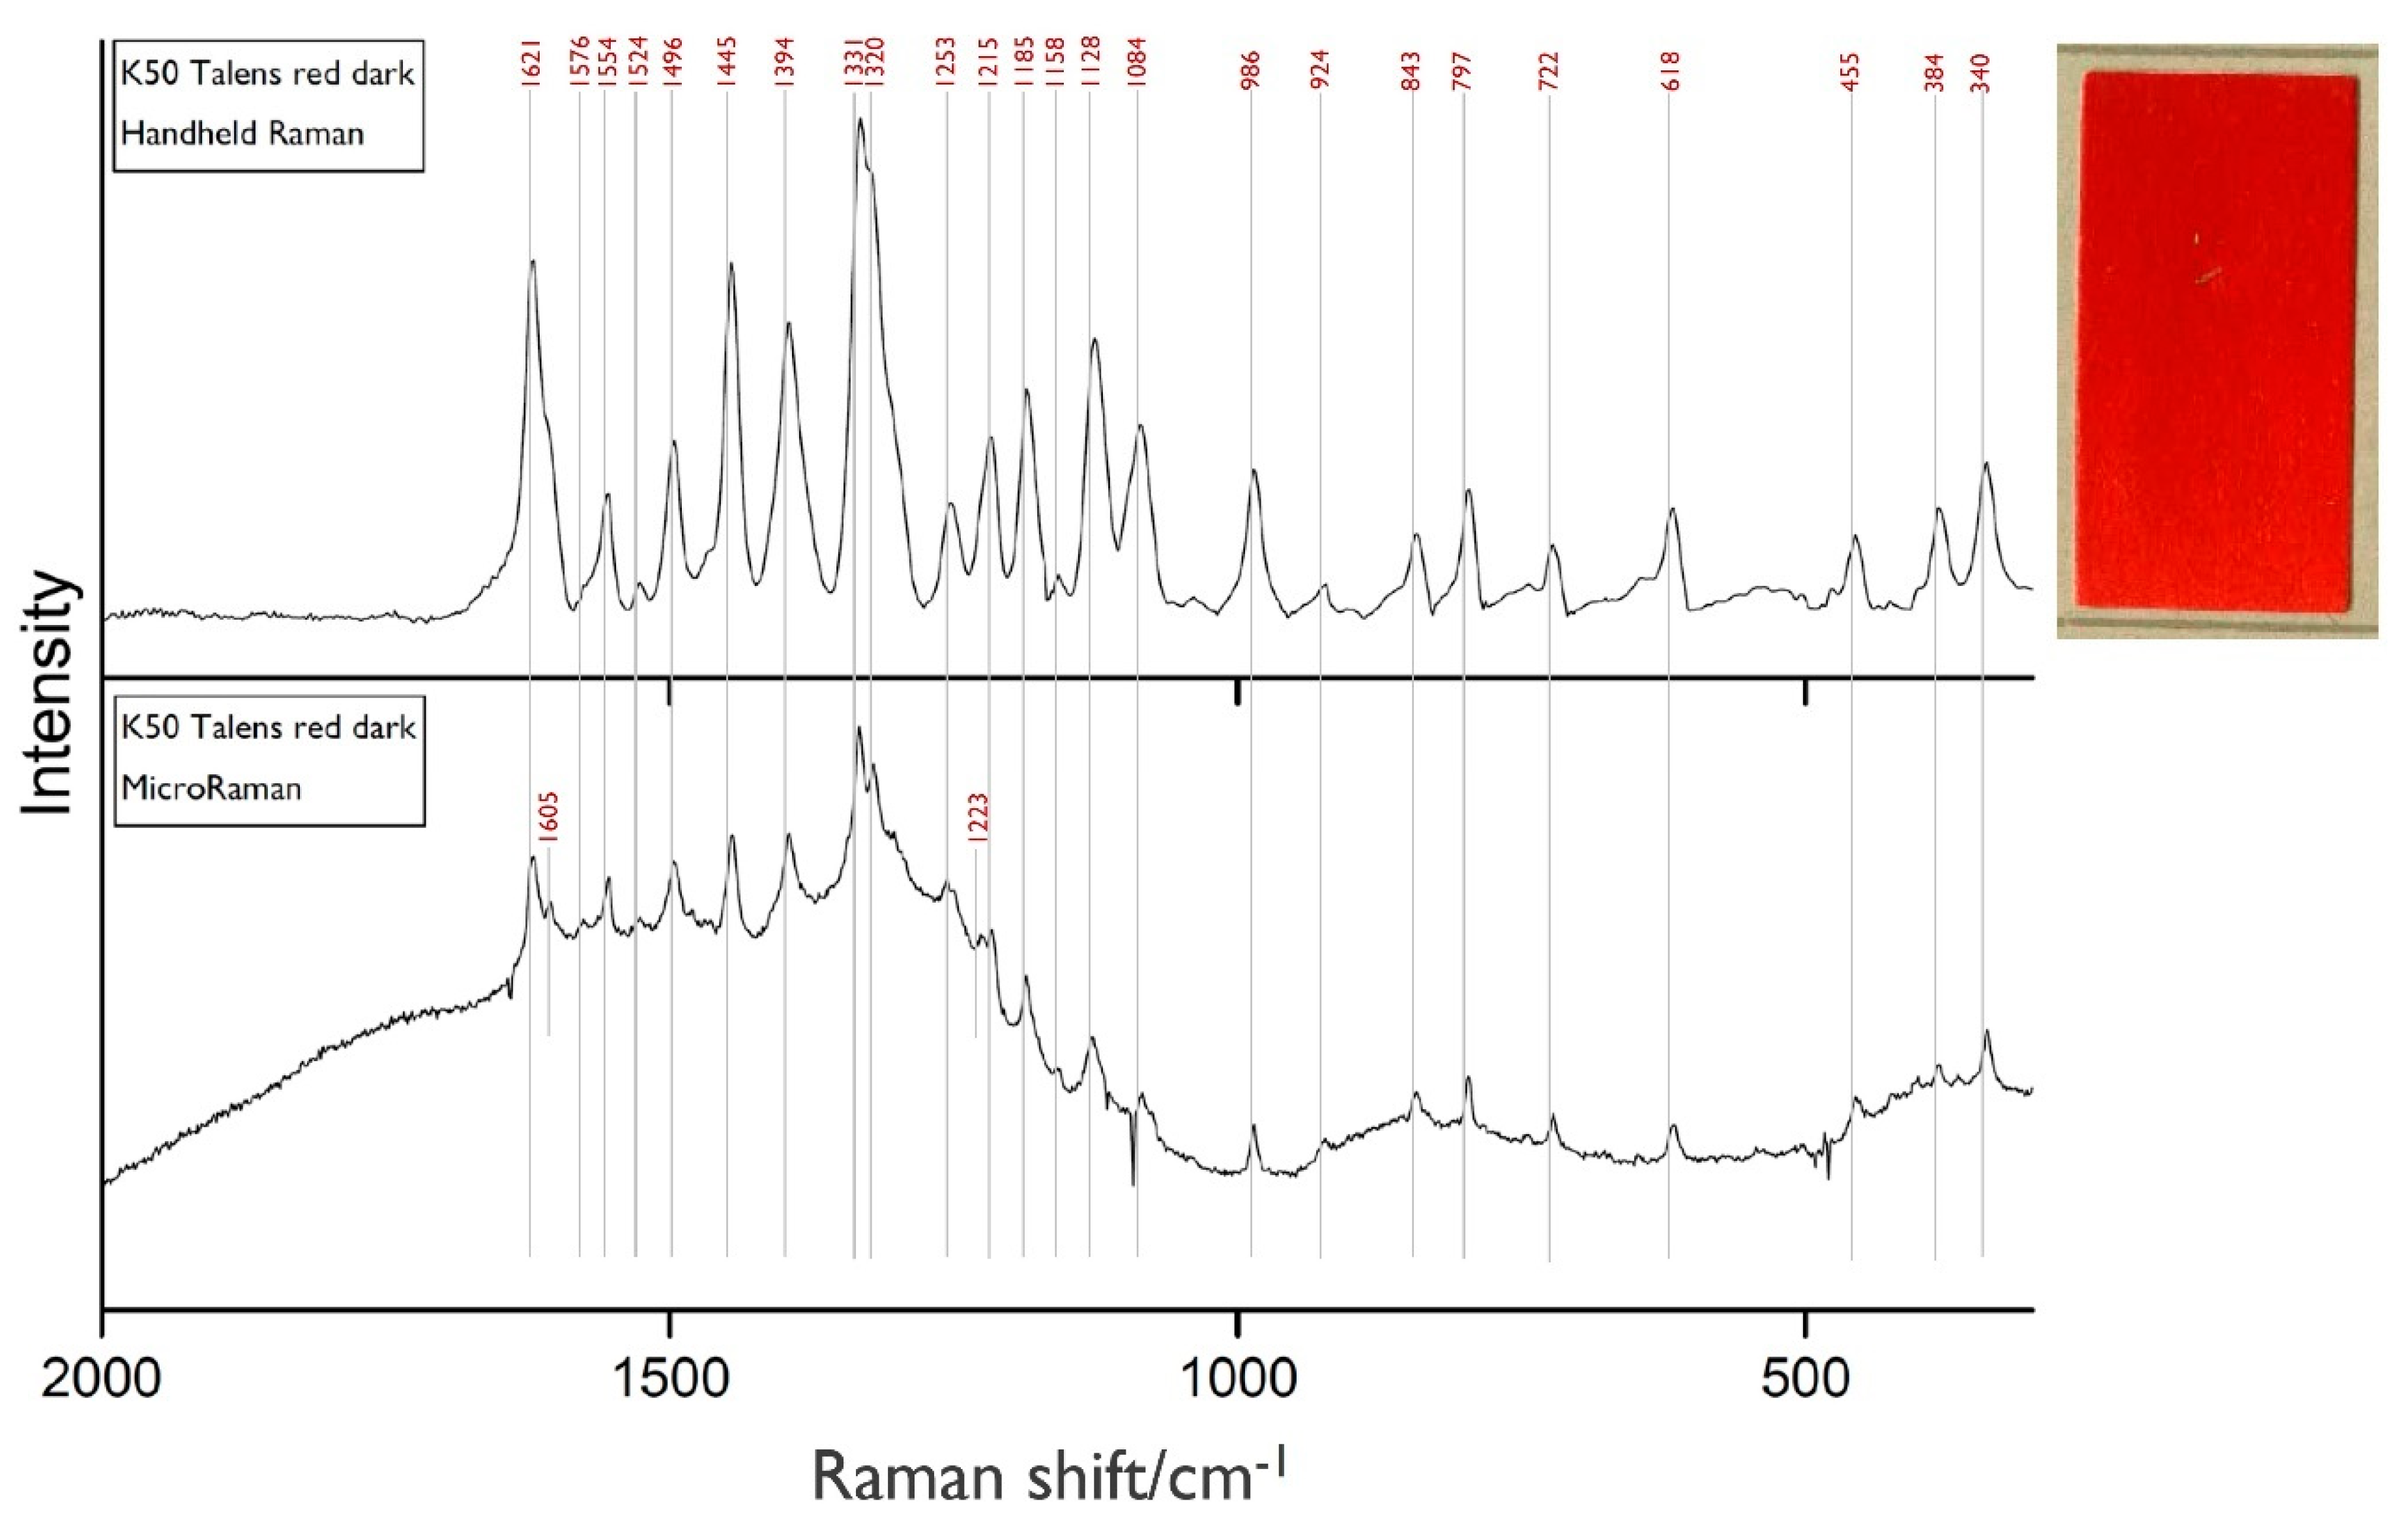
Another issue we considered was the merging or shifting of peaks as a consequence of over excitation, when measuring with a high, non-adjustable energy. This was observed in the Handheld Raman analysis of the paint-out Talens Rood Donker (Talens Red Dark), containing PR3 (Figure 6). Peaks that are close to each other and similar in intensity seem to be smoothed. This could be due to the high laser power, which might be responsible for a shift in peaks to lower wavenumbers, peak broadening, or twin peaks merging (for example at 1621 cm−1 and 1605 cm−1).

Figure 6.
Handheld and microRaman spectra of paint-out K50 Talens red dark, mixed with barium sulphate (986 cm−1).
Another example of possible overexcitation is reported in Figure 7. Here the handheld Raman spectrum of paint-out K41 Rembrandtgroen [Rembrandtgreen] is shown where the green copper phthalocyanine pigment PG7 was identified. Analysing phthalocyanine pigments with Raman spectroscopy can lead to overexcitation and peak shifts [29,51]. Fremout et al. (2012) made this observation while analysing the related PB15 pigment and state that the exact reason for this phenomenon is unclear and that a reversible, heat induced deformation of the crystal structure is possible [29]. The handheld Raman and microRaman spectra seem indeed to be shifted when compared to the KIK-IRPA reference spectrum (https://soprano.kikirpa.be, accessed on 30 June 2021 [30]) (Figure 7). However, the PG7 spectrum published by Schulte et al. fits our Raman spectrum [10]. These discrepancies might be explained by the spectral differences observed for dry pigment powder and paint systems. Defeyt et al. noticed peak shifts when comparing the Raman spectra of blue copper phthalocyanine PB15 as a dry pigment powder and mixed with a binder [43].
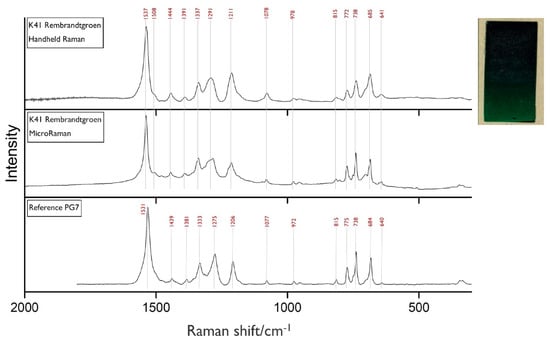
Figure 7.
Handheld and microRaman spectra of paint-out K41 Rembrandtgroen and the KIK-IRPA reference spectrum for PG7.
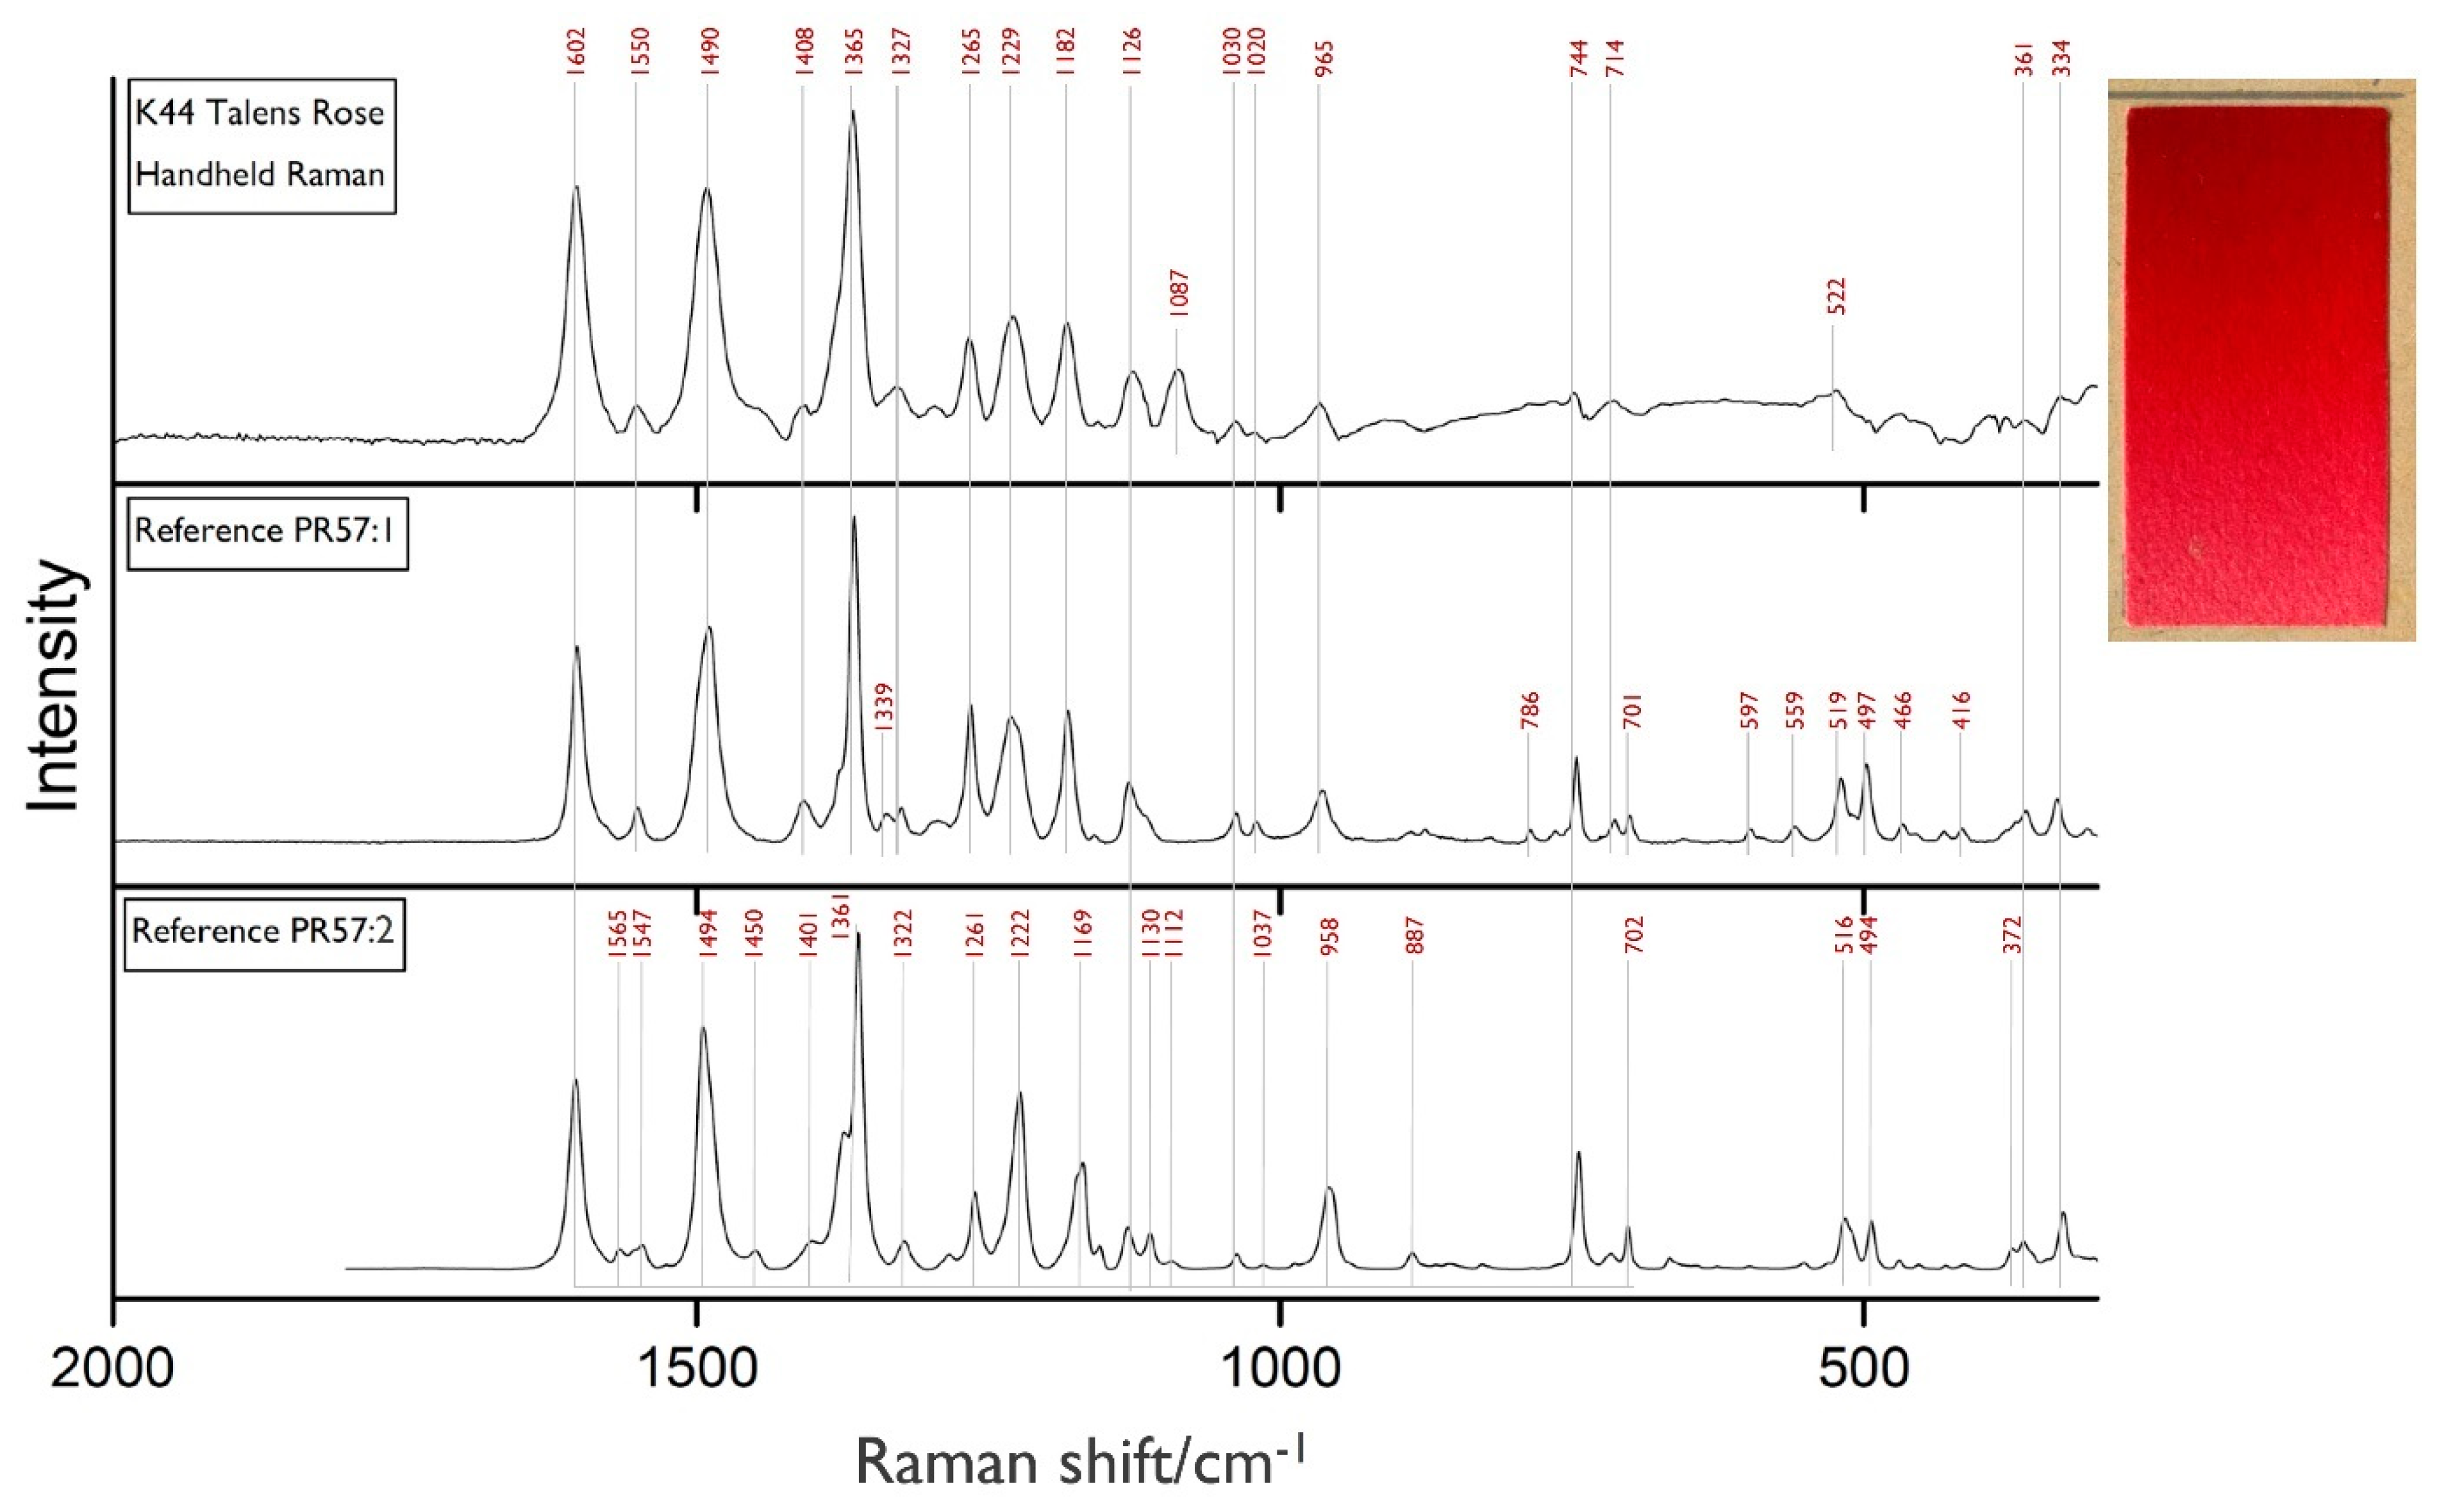
Figure 8 reports the spectrum of Talens rose [Talens pink] in comparison with the reference spectra of the BON pigment lake Lithol Rubine, precipitated on two different substrates. This example was chosen to illustrate the possible effects of the minor spectral resolution of the handheld Raman device when examining closely related pigments. The KIK-IRPA references of Lithol Rubine PR57:1 (calcium carbonate salt) and PR57:2 (barium salt) show slight spectral differences, allowing a differentiation, given that the recorded spectrum is well defined. The spectral resolution of the Bravo device is 10–12 cm−1, which turns out to be almost three times lower than that of our microRaman device (Table 1). Pozzi et al. also noted that “the inferior spectral resolution compared with benchtop spectrometers may cause difficulties in differentiating among closely related molecules with similar Raman fingerprints, especially if the analyses have poor Raman cross section or their spectra are characterized by low signal-to-noise ratio” [19]. It was, however, shown that the handheld Raman spectrum of Talens rose [Talens pink] contains the small spectral features that allow the assignment to PR57:1. In this case, the minor spectral resolution of the handheld Raman proved to be sufficient to allow a clear identification.

Figure 8.
Handheld Raman spectrum of paint-out Talens rose and Raman spectra of the KIK-IRPA PR57:1 and PR57:2 references.
Two paint-outs (K37 Paul Veronesegroen [Paul Veronese Green] and K37 Dekgroen [Dekgreen]) were revealed to be rather sensitive to the handheld Raman lasers. The after-measurement check of the surfaces showed local burns, resulting in a small (~0.5 mm) black discoloration. According to Talens’ recipes, these samples should contain a green SOP, but the X-ray fluorescence (XRF) measurements identified a copper arsenic pigment, which is rather sensitive to Raman laser irradiation. The analysis of these paint-outs highlights a strong disadvantage of the handheld Bravo, namely the non-adjustable laser energy, which is about 50 mW, more than two times higher compared to the microRaman instrument we used. The laser power can, however, be reduced by increasing the working distance to 1–2 mm. In this way, potential changes or thermal damage can be minimized or even prevented. Pozzi et al. [19] address this problem by proposing preventive measurement settings for sensitive samples. Other recommended options to avoid damage are the placement of a neutral density filter in front of the laser spot or the use of a defocusing tip.
It is worth mentioning that no SOP-containing paint-out showed any comparable damage. Since the sensitivity of emerald green is known, preliminary elemental analysis with XRF spectroscopy would have raised attention to this risk and demanded preventive action by adjusting the measurements settings.
4. Conclusions
This study demonstrated that identification of SOPs with a non-invasive approach in modern oil paint systems, also in the presence of a varnish layer, is possible. The handheld Raman was able to identify a large variety of SOPs—belonging to eight different pigment groups—within the historic varnished paint-outs of a leading artists’ paint manufacturer and provided in the meantime a very useful insight into the use of early SOPs in modern artists’ oil paints dated 1932–1950.
This research intends to provide a basis for future research into the non-invasive identification of SOPs in pre-1950 works of art. Detailed knowledge about the type and the characteristics of modern SOPs contributes to a better understanding of artists’ materials from this period and helps to assess the restoration and conservation needs. Setting these pigments into their art technological context will contribute to studying the history of certain works of art and add to the knowledge available to detect forgeries.
Some of the SOPs identified within this study have not yet been analytically detected within works of art from before 1950. This outcome emphasizes the importance of further and intensive study of the use of SOPs in modern art. On the one hand, the knowledge of how to analyse SOPs without taking samples in a scan-like examination setup opens up new possibilities for their further investigation. On the other hand, this non-invasive approach can be used to clearly determine adequate spots for sampling, when necessary.
The advantages and drawbacks of the use of handheld Raman spectroscopy in the investigation of SOPs in artists’ materials were considered. Thanks to the efficient suppression of fluorescence, varnished paint systems could be analysed and it was even possible to identify the mixtures of SOPs. The rather low resolution was a limiting factor, but turned out to be not too problematic for this set of samples. In some cases subtle spectral differences could still be detected, enabling a distinction between pigment substrates. The issue of non-adjustable energy was revealed to only be risky for one inorganic pigment, but this can be addressed with other non-invasive complementary techniques, such as handheld X-ray fluorescence spectroscopy. Another challenge is the lack of a camera for exact positioning. In this study a Melinex®template was successfully used for the analysis of the paint-outs, but the examination of specific and/or detailed paint areas in artworks could be hindered or difficult, depending on the surface and type of object.
Author Contributions
Conceptualization, R.P., I.D.v.d.W., and K.J.v.d.B.; methodology, R.P., I.D.v.d.W., and K.J.v.d.B.; investigation, R.P.; writing—original draft preparation, R.P., I.D.v.d.W., and K.J.v.d.B.; writing—review and editing, R.P., I.D.v.d.W., and K.J.v.d.B.; supervision, I.D.v.d.W. and K.J.v.d.B. All authors have read and agreed to the published version of the manuscript.
Funding
This research received no external funding.
Institutional Review Board Statement
Not applicable.
Informed Consent Statement
Not applicable.
Data Availability Statement
Data available on request. The data presented in this study are available on request from the corresponding author.
Acknowledgments
The authors would like to thank Royal Talens for allowing access to their production archive and the Historical collection of dyes of the TU Dresden for providing reference samples, as well as Art Ness Proaño Gaibor, Sanne Berbers (Cultural Heritage Laboratory, Cultural Heritage Agency of the Netherlands, Amsterdam, the Netherlands) and Brynn Sundberg (University of Amsterdam, Amsterdam, the Netherlands) for conducting conclusive UHPLC-MS analyses. Furthermore we would like to thank the SOPRANO network, especially Wim Fremout (KIK-IRPA), for providing reference spectra.
Conflicts of Interest
The authors declare no conflict of interest.
References
- Lomax, S.Q.; Learner, T. A review of the classes, structures, and methods of analysis of synthetic organic pigments. J. Am. Inst. Conserv. 2006, 45, 107–125. [Google Scholar] [CrossRef]
- Schäning, A. Synthetische Organische Farbmittel aus einer Technologischen Materialsammlung des 19./20. Jahrhunderts: Identifizierung, Klassifizierung und ihre Verwendung Sowie Akzeptanz in (Künstler) Farben Anfang des 20. Jahrhunderts. Ph.D. Thesis, Akademie der Bildenden Künste Wien, Wien, Austria, 2010. [Google Scholar]
- Stege, H.; Krekel, C. Keiner Hat Diese Farben Wie Ich—Kirchner Malt; Schick, K., Skowranek, H., Eds.; Hatje Cantz Verlag Ostfildern: Berlin, Germany, 2011. [Google Scholar]
- Pause, R.; Neevel, J.; van den Berg, K.J. Synthetic organic pigments in talens oil paint 1920–1950—The case of vermillion imit. In Conservation of Modern Oil Paintings; van den Berg, K.J., Bonaduce, I., Burnstock, A., Ormsby, B., Scharff, M., Carlyle, L., Heydenreich, G., Keune, K., Eds.; Springer International Publishing: Cham, Switzerland, 2019; pp. 109–118. [Google Scholar]
- Doerner, M. Zur Abwehr! Tech. Mitt. Malerei 1931, 47, 13. [Google Scholar]
- Saverwyns, S. Russian avant-garde… or not? A micro-Raman spectroscopy study of six paintings attributed to Liubov Popova. J. Raman Spectrosc. 2011, 41, 1525–1532. [Google Scholar] [CrossRef]
- Quillen Lomax, S.; Lomax, J.F.; De Luca-Westrate, A. The use of Raman microscopy and laser desorption ionization mass spectrometry in the examination of synthetic organic pigments in modern works of art. J. Raman Spectrosc. 2014, 2, 37–38. [Google Scholar]
- Bouchard, M.; Rivenc, R.; Menke, C.; Learner, T. Micro-FTIR and micro-Raman study of paints used by Sam Francis. E Preserv. Sci. 2009, 6, 27–37. [Google Scholar]
- Lutzenberger, K.; Stege, H. Künstlerfarben im Wandel—Synthetische organische pigmente des 20. Jahrhunderts und Möglichkeiten ihrer zerstörungsarmen, analytischen Identifizierung. E Preserv. Sci. 2009, 6, 89–100. [Google Scholar]
- Schulte, F.; Brzezinka, K.W.; Lutzenberger, K.; Stege, H.; Panne, U. Raman spectroscopy of synthetic organic pigments in 20th century works of art. J. Raman Spectrosc. 2008, 39, 1455–1463. [Google Scholar] [CrossRef]
- Sundberg, B.N.; Pause, R.; van der Werf, I.D.; Astefanei, A.; van den Berg, K.J.; van Bommel, M. Analytical approaches for the characterization of early synthetic organic pigments in artists’ paints. Microchem. J. 2021. under review. [Google Scholar]
- Bell, I.M.; Clark, R.J.H.; Gibbs, P.J. Raman spectroscopic library of natural and synthetic pigments (pre- ≈ 1850 AD). Spectrochim. Acta Part A Mol. Biomol. Spectrosc. 1997, 53, 12. [Google Scholar] [CrossRef]
- Saverwyns, S.; Fremout, W. Genuine or fake: A Micro-Raman spectroscopy study of an abstract painting attributed to vasily kandinsky. In Proceedings of the 10th International Conference on Non-Destructive Investigations and Microanalysis for the Diagnostics and Conservation of Cultural and Environmental Heritage, Florence, Italy, 13–15 April 2011. [Google Scholar]
- Scherrer, N.C.; Zumbühl, S.; Delavy, F.; Fritsch, A.; Kühnen, R. Synthetic organic pigments of the 20th and 21st century relevant to artist’s paints: Raman spectra reference collection. Spectrochim. Acta Part A Mol. Biomol. Spectrosc. 2009, 73, 505–524. [Google Scholar] [CrossRef]
- Standeven, H.A.L. The history and manufacture of Lithol Red, a Pigment used by Mark Rothko in his Seagram and Harvard Murals of the 1950s and 1960s. Tate Papers 2008, 10, 1–8. [Google Scholar]
- Vandenabeele, P.; Moens, L. The Application of Raman Spectroscopy for the Nondestructive Analysis of Art Objects; The International Society for Optical Engineering: Bellingham, WA, USA, 2000; Volume 4098. [Google Scholar]
- Vandenabeele, P.; Edwards, H.G.M.; Moens, L. A decade of Raman spectroscopy in art and archaeology. Chem. Rev. 2007, 107, 675–686. [Google Scholar] [CrossRef] [PubMed]
- Miliani, C.; Rosi, F.; Brunetti, B.G.; Sgamellotti, A. In situ noninvasive study of artworks: The MOLAB multitechnique approach. Acc. Chem. Res. 2010, 43, 728–738. [Google Scholar] [CrossRef]
- Pozzi, F.; Basso, E.; Rizzo, A.; Cesaratto, A.; Tague, T.J., Jr. Evaluation and optimization of the potential of a handheld Raman spectrometer: In situ, noninvasive materials characterization in artworks. J. Raman Spectrosc. 2019, 50, 1–12. [Google Scholar] [CrossRef]
- Longoni, M.; Freschi, A.; Cicala, N.; Bruni, S. Non-invasive identification of synthetic organic pigments in contemporary art paints by visible—Excited spectrofluorimetry and visible reflectance spectroscopy. Spectrochim. Acta Part A Mol. Biomol. Spectroscopy. 2020, 229, 117907. [Google Scholar] [CrossRef]
- Casadio, F.; Daher, C.; Bellot-Gurlet, L. Analytical Chemistry for Cultural Heritage, Topics in Current Chemistry Collections; Mazzeo, R., Ed.; Springer: Cham, Switzerland, 2016; pp. 1–51. [Google Scholar]
- Colomban, P. The on-site/remote Raman analysis with mobile instruments: A review of drawbacks and success in cultural heritage studies and other associated fields. J. Raman Spectrosc. 2012, 43, 1529–1535. [Google Scholar] [CrossRef]
- Conti, C.; Botteon, A.; Bertasa, M.; Colombo, C.; Realini, M.; Sali, D. Portable sequentially shifted excitation Raman spectroscopy as an innovative tool for in situ chemical interrogation on painted surface. Analyst 2016, 141, 4599–4607. [Google Scholar] [CrossRef] [PubMed] [Green Version]
- Jehlička, J.; Culka, A.; Bersani, D.; Vandenabeele, P. Comparison of seven portable Raman spectrometers: Beryl as a case study. J. Raman Spectrosc. 2017, 48, 1289–1299. [Google Scholar] [CrossRef] [Green Version]
- Kantoğlu, Ö.; Ergun, E.; Kirmaz, R.; Kalayci, Y.; Zararsiz, A.; Bayir, Ö. Colour and ink characterization of ottoman diplomatic documents dating from the 13th to the 20th century. Int. J. Preserv. Libr. Arch. Mater. Restaur. 2018, 39, 4. [Google Scholar] [CrossRef]
- Germinario, C.; Francesco, I.; Mercurio, M.; Langella, A.; Sali, D.; Kakoulli, I.; De Bonis, A.; Grifa, C. Multi-analytical and non-invasive characterization of the polychromy of wall paintings at the Domus of Octavius Quartio in Pompeii. EPJP 2018, 133, 359. [Google Scholar] [CrossRef]
- Rousaki, A.; Costa, M.; Saelens, D.; Lycke, S.; Sanchez, A.; Tuñón, J.; Ceprián, B.; Amate, P.; Montejo, M.; Mirão, J.; et al. A comparative mobile Raman study for the on field analysis of the mosaico de los amores of the cástulo archaeological site (Linares, Spain). J. Raman Spectrosc. 2020, 5, 1913–1923. [Google Scholar] [CrossRef]
- Vagnini, M.; Gabrieli, F.; Daveri, A.; Sali, D. Handheld new technology Raman and portable FT-IR spectrometers as complementary tools for the in situ identification of organic materials in modern art. Spectrochim. Acta A Mol. Biomol. Spectrosc. 2017, 76, 174–182. [Google Scholar] [CrossRef]
- Fremout, W.; Saverwyns, S. Identification of synthetic organic pigments: The role of a comprehensive digital Raman spectral library. J. Raman Spectrosc. 2012, 43, 1536–1544. [Google Scholar] [CrossRef]
- De Keijzer, M. The delight of modern pigment creations. In Issues in Contemporary Oil Paint; van den Berg, K.J., Burnstock, A., de Keijzer, M., Krueger, J., Learner, T., de Tagle, A., Heydenreich, G., Eds.; Springer: Cham, Switzerland, 2014; pp. 45–73. [Google Scholar]
- Pause, R.; de Keijzer, M.; van den Berg, K.J. Phosphor, tungsten and molybdenum—From Brilliant to Fanal, unusual precipitation methods of triphenylmethane dyes in the early 20th century. Stud. Conserv. 2020. currently under review. [Google Scholar]
- Eskes, P. Terugblik op de Historie van Talens, 1st ed.; Koninklijke Talens, B.V., Ed.; Koninklijke Talens: Apeldoorn, The Netherlands, 1989. [Google Scholar]
- Van den Berg, K.J.; van Gurp, F.; Bayliss, S.; Burnstock, A.; Ovink, B.K. Making paint in the 20th century: The Talens Archive. In Sources on Art Technol. Back to Basic; Archetyp Publications Ltd.: London, UK, 2016; pp. 43–50. [Google Scholar]
- Pause, R. Synthetic Organic Pigments in Talens Oil Paint in the First Half of the 20th Century. Master’s Thesis, Staatliche Akademie der Bildenden Künste Stuttgart, Stuttgart, Germany, 2018. [Google Scholar]
- Kerdijk, F. Kunstschildersmaterialen en Schildertechnik—Kleurstoffen, Bindmiddelen en Vernissen in de Olieverftechniek, 1st ed.; Talens & Zoon: Apeldoorn, The Netherlands, 1932. [Google Scholar]
- Kerdijk, F. Kunstschildersmaterialen en Schildertechnik—Kleurstoffen, Bindmiddelen en Vernissen in de Olieverftechniek, 2nd ed.; Talens & Zoon: Apeldoorn, The Netherlands, 1937. [Google Scholar]
- Kerdijk, F. Kunstschildersmaterialen en Schildertechnik—Kleurstoffen, Bindmiddelen en Vernissen in de Olieverftechniek, 3rd ed.; Talens & Zoon: Apeldoorn, The Netherlands, 1941. [Google Scholar]
- Kerdijk, F. Kunstschildersmaterialen en Schildertechnik—Kleurstoffen, Bindmiddelen en Vernissen in de Olieverftechniek, 4th ed.; Talens & Zoon: Apeldoorn, The Netherlands, 1942. [Google Scholar]
- Kerdijk, F. Kunstschildersmaterialen en Schildertechnik—Kleurstoffen, Bindmiddelen en Vernissen in de Olieverftechniek, 5th ed.; Talens & Zoon: Apeldoorn, The Netherlands, 1944. [Google Scholar]
- Kerdijk, F. Kunstschildersmaterialen en Schildertechnik—Kleurstoffen, Bindmiddelen en Vernissen in de Olieverftechniek, 6th ed.; Talens & Zoon: Apeldoorn, The Netherlands, 1950. [Google Scholar]
- Wahadoszamen, M.; Rahaman, A.; Hoque, N.M.R.; Talukder, A.I.; Abedin, K.M.; Haider, A.F.M.Y. Laser Raman spectroscopy with different excitation sources and extension to surface enhanced raman spectroscopy. J. Spectrosc. 2015, 2015, 1–8. [Google Scholar] [CrossRef] [Green Version]
- Colomban, P. On-site Raman study of artwork: Procedure and illustrative examples. J. Raman Spectrosc. 2018, 49, 921–934. [Google Scholar] [CrossRef]
- Defeyt, C.; Vandenabeele, P.; Gilbert, B.; Van Pevenage, J.; Clootse, R.; Strivaya, D. Contribution to the identification of α-, β- and ε-copper phthalocyanine blue pigments in modern artists’ paints by X-ray powder diffraction, attenuated total reflectance micro-fourier transform infrared spectroscopy and micro-Raman spectroscopy. J. Raman Spectrosc. 2012, 43, 1772–1780. [Google Scholar] [CrossRef]
- González-Vidal, J.J.; Pérez-Pueyo, R.; Soneira, M.J.; Ruiz-Moreno, S. Automatic classification system of Raman spectra applied to pigments analysis. J. Raman Spectrosc. 2016, 47, 1408–1414. [Google Scholar] [CrossRef] [Green Version]
- Colour Index (Ed.) Society of Dyers and Colourists, and American Association of Textile Chemists and Colorists, 3rd ed.; Society of Dyers and Colourists and Associates: Bradford, UK, 1971. [Google Scholar]
- Colour Index (Ed.) Society of Dyers and Colourists, and American Association of Textile Chemists and Colorists, 2nd ed.; Society of Dyers and Colourists and Associates: Bradford, UK, 1956. [Google Scholar]
- Wagner, H. Chemie in Einzeldarstellungen, 1st ed.; Wissenschaftliche Verlagsgesellschaft MBH: Stuttgart, Germany, 1927; Volume 13. [Google Scholar]
- Schultz, G. Farbstofftabellen, 7th ed.; Akademische Verlagsgesellschaft MBH: Leipzig, Germany, 1931. [Google Scholar]
- Steger, S.; Stege, H.; Bretz, S.; Hahn, O. A complementary spectroscopic approach for the non-invasive in-situ identification of synthetic organic pigments in modern reverse paintings on glass (1913–1946). J. Cult. Herit. 2019, 38, 20–28. [Google Scholar] [CrossRef]
- Sichel, W. Properties and economics. In Pigment Handbook; Lewis, P.A., Ed.; Wiley: New York, NY, USA, 1988; Volume 1, pp. 613–615. [Google Scholar]
- Scherrer, N.C. Laser dependent shifting of Raman bands with phthalocyanine pigments presented at RAA2011. In Proceedings of the 6th international Congress on the Application of Raman Spectroscopy in Art and Archaeology, Parma, Italy, 5–8 September 2011; pp. 203–204. [Google Scholar]


Publisher’s Note: MDPI stays neutral with regard to jurisdictional claims in published maps and institutional affiliations. |
© 2021 by the authors. Licensee MDPI, Basel, Switzerland. This article is an open access article distributed under the terms and conditions of the Creative Commons Attribution (CC BY) license (https://creativecommons.org/licenses/by/4.0/).