Abstract
The diagnosis-related group (DRG) system classifies patients into different groups in order to facilitate decisions regarding medical insurance payments. Currently, more than 600 standard DRGs exist in China. Payment details represented by DRG weights must be adjusted during decision-making. After modeling the DRG weight-determining process as a parameter-searching and optimization-solving problem, we propose a stochastic gradient tracking algorithm (SGT) and compare it with a genetic algorithm and sequential quadratic programming. We describe diagnosis-related groups in China using several statistics based on sample data from one city. We explored the influence of the SGT hyperparameters through numerous experiments and demonstrated the robustness of the best SGT hyperparameter combination. Our stochastic gradient tracking algorithm finished the parameter search in only 3.56 min when the insurance payment rate was set at 95%, which is acceptable and desirable. As the main medical insurance payment scheme in China, DRGs require quantitative evidence for policymaking. The optimization algorithm proposed in this study shows a possible scientific decision-making method for use in the DRG system, particularly with regard to DRG weights.
1. Background
1.1. Diagnosis-Related Groups in Medical Insurance Payment
A diagnosis-related group (DRG) is a patient classification scheme that divides patients into several diagnostic groups for management based on diagnosis, treatment, complications, age, disease severity, and resource consumption. DRG works as a tool to decide medical insurance payments and measure the quality and efficiency of medical services. An efficient DRG payment system can achieve a win–win solution for insurers, doctors, and patients. It prevents medical insurance funds from being overspent, standardizes the diagnosis and treatment processes of hospitals, and provides patients with high-quality medical services and a convenient settlement at the cost of reasonably compensated medical expenses. There are two main reasons for the use of the DRG system, which are similar across various countries. First, using DRGs, countries can increase the transparency of their hospital services, which are represented by patient classification and measurements of hospital output. Second, the payment of hospital fees based on the quantity and category of cases treated could encourage the effective use of medical resources in hospitals. These two factors can help to ensure and improve the quality of national healthcare services.
Reimbursement mechanisms based on DRGs were first proposed in the United States in 1983 as an integral part of the Medicare program and were soon adopted in many other countries [1]. Healthcare policy planners and researchers from Europe launched the EuroDRG social project to pay hospitals. Although they are widely used, DRGs have different meanings across Europe [2]. Finland and Sweden use DRGs primarily to measure hospital case portfolios, while in countries such as Germany and France, DRGs are a synonym for payment. This is because the DRG application process differs among countries, and each country has adapted the DRG system based on the needs of their healthcare systems. For example, the primary objective of the early adoption of DRGs was to improve medical transparency in countries such as France and Portugal. However, countries that have introduced DRGs more recently, such as Poland and the Netherlands, have generally aimed to pay hospitals based on the DRG system [2]. In many countries, compensation mechanisms based on DRGs may face certain challenges, such as doctors’ unfamiliarity with DRGs [3,4], poor medical record-keeping [5], and confusion regarding data encoding [6]. Several solutions for this problem have been proposed: Barouni [1] emphasized the consideration of disease complexity and severity, number of complications, and type when modifying or creating DRGs, while Wild [7] suggested increasing budgets for unusual and complex groups. Furthermore, the standardization of clinical decision-making procedures requires further attention.
At present, there are more than 600 standard diagnosis-related groups in China, and payment details need to be adjusted during decision-making. Kun Zou [8] pointed out that DRG payments in China may negatively affect the quality and equity of healthcare at the cost of a mild improvement in efficiency. Therefore, policymakers should carefully design the components and weights of DRGs based on policy goals; to enable this, there is a need for comparative studies and randomized trials to provide evidence of the effects of DRGs.
The current DRG payments in China usually take average cost of diseases across one province or one city as the benchmark for DRG weights. This may cause potential non-financial effects, such as quality of care, perverse incentives, or inequality between hospitals and regions. Zhang’s research [9] shows that the implementation of diagnosis-related group reimbursement systems may mitigate excessive medical interventions and optimize resource utilization. Paradoxically, this approach coincides with emerging systemic challenges such as heightened clinician–patient communication demands, constraints on innovative medical technology adoption, strategic case fragmentation, and selective admission practices.
With the full coverage of medical insurance in China, medical costs have grown rapidly. According to the National Health Commission of the PRC, the total health expenditure in 2019 exceeded CNY 6.5 trillion, accounting for 6.6% of GDP, up 0.15% from 2018. Per capita health expenditure increased by 12.24% from 2018 to CNY 4656.7. The medical insurance fund is at risk of deficit; therefore, regularizing the intensive use of funds, such as payment standards, has become a priority in the reform of medical insurance policy. We believe that reasonable numerical simulations and efficient model optimization based on artificial intelligence and learning algorithms can introduce convenience to DRG medical insurance payment research.
1.2. Data-Driven Methods for Public Policy Formulation
Artificial intelligence (AI) and optimization techniques have greatly facilitated innovations in social systems [10]. In healthcare, AI serves as a powerful reshaping force that enables early disease detection and timely clinical treatment [11,12,13]. Furthermore, artificial intelligence and learning techniques are emerging to address public health challenges, especially those related to clinical decision-making and healthcare planning. For policy modeling, Silva [14] presented an M/M/c/K queuing model depicting an Internet of Healthcare Things infrastructure with a three-layer cloud/fog/edge computing system to improve healthcare management in hospitals during the COVID-19 pandemic; for policy planning, Tutsoy [15] developed an artificial intelligence-based algorithm for planning long-term policies and making decisions for the reopening of schools during the COVID-19 pandemic; and for policy evaluation, Yu [16] presented a method based on system dynamics to explain mechanisms and evaluate performance in the macroscopic implementation of public policy, which verified that the use of computer simulation is feasible in policy planning.
To formulate medical insurance payment policy scientifically, the national healthcare security administration of China recommends simulation before implementation, as the data accumulated in the simulation could provide a reference for policy evaluation. It is necessary to improve DRG payment optimization based on artificial intelligence and learning algorithms, as this approach has gained little attention worldwide. Patrick [17] proposed an agent-based GAP-DRG model to formulate payment standards. This model reflects the process of treatment, payment, and reimbursement to compare different reimbursement schemes in outpatient care. However, the GAP-DRG model simplifies many assumptions from reality and thus lacks practicality. Currently, complex models adapted to reality and optimized solutions obtained using learning algorithms are being developed for two reasons: first, data from both real and simulated situations can support policy planning and parameter setting, and second, increasing computing power improves efficiency while ensuring accuracy. Therefore, the conditions are right for developing a data-driven approach to DRG medical insurance payment policy based on an optimization algorithm.
2. Methods
2.1. DRG-Based Medical Insurance Payment Policy Formulation
This research focuses on formulating medical insurance payment standards and helps achieve certain policy objectives under constraints that can provide a decision support tool for experts adjusting DRG reimbursement standards. While numerous details (represented by DRG weights in the payment policy) affect the reimbursement standard and final payment effect, this decision-making process could be modeled as a parameter-searching problem based on optimization; DRG weights are the decision variable, policy goals formulate objective functions, and restrictions are transformed into constraint conditions. Ignoring the indirect impact on doctors’ behavior and patients’ welfare, this study evaluates medical insurance funds and hospital operations using budget balance rates and insurance payment rates, respectively. The budget balance rate refers to the percentage of the medical insurance budget remaining after payment, reflecting the security of the medical insurance fund. The insurance payment rate refers to the proportion of the actual payment amount to the amount applied for, which represents the operating level of the hospital.
DRG weights serve as the decision variables, reflecting the relative treatment difficulty and economic costs for each DRG. As shown in Equation (1), the weights are initialized by the ratio of the average cost from a specific group to the average cost. is the initial weight of DRG group , is the average cost of DRG group , and is average cost of all DRG groups.
The insurance payment rate serves as the main objective function and can be formulated as Equation (2). V represents the insurance payment rate, is the actual payment from the medical insurance fund, and is the amount applied for by the hospital. In our research, is simulated according to payment settlement rules and thus acts as a function of the DRG weights. is a constant for each patient and is not affected by the medical insurance settlement rules within a specific group. Our mission is to impel the insurance payment rate close to the value , assumed as a policy goal, so that the policy-formulating situation can be transformed into an optimization-solving problem. The objective function is set as Equation (3) and is used to minimize the difference between the actual payment rate and the payment rate set by the government.
Restrictions from insurance accounts, hospitals, and regions served as constraint conditions, as listed in Table 1. Overall budget balance rate controls the overall payment of insurance in a city/province/country. If the payment exceeds the budget too much, future medical expenses will be affected. If it is too much lower than the budget, the guarantee of current medical services will be affected. The insurance payment rate per hospital will balance the payment for different hospitals, and if this rate for a certain hospital is too low, financial problems will be caused for that hospital. The insurance payment rate per insurance account will balance the payment for each government insurance account. The Budget balance rate per region will balance the different regions in one city. The weighted average of DRG weights should always be 1, so that the DRG weights can be used for the future payment and the total cost of all patients will be the same.

Table 1.
Constraint conditions.
In DRG payment policy planning, we assume other parameters to be constants, including the payment rate, the upper and lower bounds of payment, and the payment ratio beyond bounds, as shown in Table 2.
Table 2.
Parameters of constant settings.
2.2. Data Description
We used 324,832 data points involving insurance payments in a city for simulation and optimization, covering 747 diagnosis-related groups and 11,644 disease categories. The type of variables used in the dataset include DRG group, original diagnosis, hospital department, hospital, type of hospital, actual payment amount, and payment applied for by the hospital. Distribution of cases by type of hospital, level of hospital, and subgroup is shown as Table 3. Cases are mainly concentrated in general hospitals and Level III hospitals, and 66.34% of total cases fall in the physician and surgeon subgroups of Level III hospital.
Table 3.
Distribution of cases by type of hospital.
Table 4 summarizes the top ten DRGs with the largest number of cases.
Table 4.
Top 10 DRGs with the largest number of cases.
Table 5 lists the top 10 DRGs with the highest total costs, and Table 6 shows the top 10 DRGs with the highest average hospitalization cost per case. As can be seen, the average cost and total cost of different DRGs differ greatly. For DRGs with a higher total cost, a 1% weight change is seen, and thus the change in total cost may be up to CNY 10 million. For DRGs with a higher average cost per case, the impact of a 1% weight change on a single case can be up to CNY 1000.
Table 5.
Top 10 DRGs with the highest total costs.
Table 6.
Top 10 DRGs with the highest average hospitalization cost per case.
2.3. Optimization Algorithm
2.3.1. Proposed Algorithm: Stochastic Gradient Tracking (SGT)
As the formulation of DRG-based medical insurance payment policy shows, the complexity of the payment policy brings challenges for decision-makers to find the perfect DRG weights to balance the interests of hospitals, patients and medical insurance.
Inspired by stochastic gradient descent [18], we propose a novel stochastic gradient tracking algorithm to anchor the target insurance payment rate and the search weights of the DRGs. Stochastic gradient tracking first initializes the DRG weight vector , total step size , the gradient-updated upper bound , and the top DRGs with the highest costs to formulate the candidate set . Focusing on minimizing the objective function , stochastic gradient tracking attempts to find a suitable gradient descent direction and calculate the descent step size during each iteration. Both effectiveness and randomness were considered when determining the descending direction. In each iteration, in addition to the top DRGs with the highest cost, other DRGs are randomly selected as extra descending directions with the probability parameter . The forward and backward gradients, and , are calculated using Equations (4) and (5). Updated step sizes are comprehensively restricted by three conditions: the upper or lower bound in each group, the gradient-updated upper bound , and the total step size .
Customized constraint conditions are checked in each iteration as an optional step. For example, insurance payment rate per hospital in Table 1, is set as the balance between hospitals to avoid the DRG weight will cause a certain hospital financial problem. It is formulated in Table 1, and the algorithm will check whether insurance payment rate per hospital exceeds the feasible range in Table 1, If it exceeds the feasible range, a penalty coefficient will be added to the objective function. The hyperparameters of the stochastic gradient tracking algorithm are shown in Table 7, and the pseudo code of the algorithm is shown in Table 8.
Table 7.
Hyperparameters of stochastic gradient tracking algorithm.
Table 8.
Stochastic gradient tracking algorithm.
The loop and converging rate are controlled by the number of DRG groups n, and the complexity of the algorithm is O(n).
2.3.2. Genetic Algorithm (GA)
The genetic algorithm [19] is a method that searches for an optimal solution by simulating the process of biological evolution and natural selection. There are five main steps in the GA: encoding the parameter space; setting the initial population; designing the fitness function; designing genetic operations, including selection crossover and variation; and setting control parameters. The GA does not require the objective to be differentiable and continuous and shows high adaptiveness when adjusting the search direction. Our research uses the GA as a baseline for comparison with the proposed stochastic gradient tracking algorithm.
GA operates on a population of candidate solutions (termed individuals or chromosomes), iteratively improving fitness through stochastic operations. The key components of GA include:
Initialization: A population of individuals is generated randomly, each representing a potential solution encoded as a bitstring, real-valued vector, or other structures. In this research, DRG weights are initialized with Equation (1).
Fitness evaluation: Each individual’s quality is assessed via a user-defined fitness function. In this research, the objective function and constraint conditions are used as fitness function.
Selection: High-fitness individuals are probabilistically chosen for reproduction using methods like tournament selection or roulette wheel selection. In this research, DRG weights of the highest average cost will change first.
Mutation: Random alterations introduce diversity, preventing premature convergence to local optima. In this research, a random portion of DRGs will also change the weight.
Generational replacement: Offspring replace low-fitness individuals, forming a new population. This loop repeats until convergence.
2.3.3. Sequential Quadratic Programming (SQP)
Sequential quadratic programming [20,21] is efficient in nonlinear constrained optimization problems and divides the original problem into a series of quadratic programming subproblems. Our research used sequential least squares programming (SLSQP) [21] as a baseline for comparison with the proposed stochastic gradient tracking algorithm.
At every iteration, SQP follows this workflow:
Build a local model: approximate the objective function as a quadratic “bowl-shaped” curve (retains curvature information). Approximate constraints (constraint condition in Table 1) as straight lines.
Solve the QP subproblem: find the best direction to move by minimizing the quadratic model while staying within linearized constraints.
Choose a safe step size: avoid overcommitting to the QP solution (approximations might be inaccurate).
Use line search or trust-region: objective function decreases, constraints become less violated.
Update and check convergence: move to the new point. Stop if solutions barely change and constraints are satisfied. Otherwise, repeat.
3. Results
We experimented with the comparative methods GA and SLSQP, as shown in Figure 1. Furthermore, we tested the effects of different GA hyperparameter values for tracking the goal. Figure 2 shows the effect of when , , , and . Figure 3 shows the effect of when , , , and . Figure 4 shows the effect of when , , , and . Figure 5 shows the effect of when , , , and . All experiments were conducted using a 16-core CPU and 120 G memory. The goal of all experiments was to track the insurance payment rate , and the target was set as 95%, which corresponds with the medical insurance policy target.
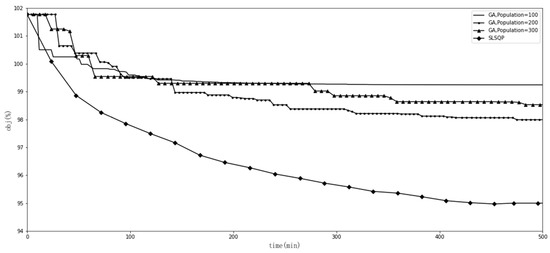
Figure 1.
Comparison of GA and SLSQP.
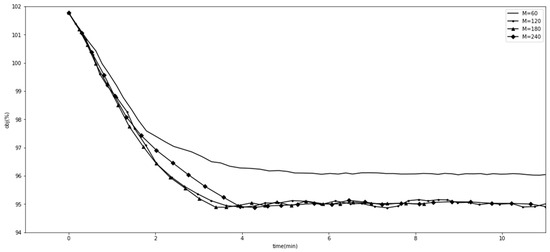
Figure 2.
Comparison with different values.
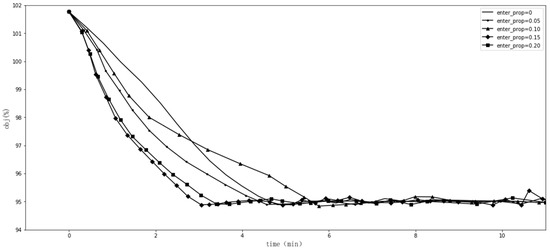
Figure 3.
Comparison with different values.
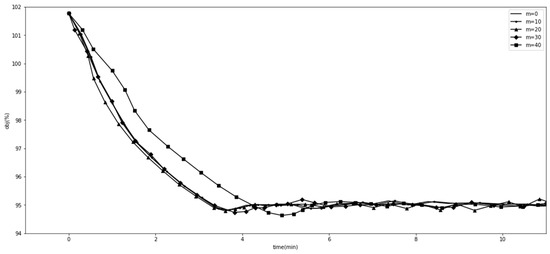
Figure 4.
Comparison with different values.
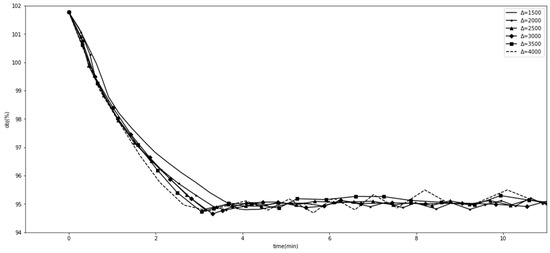
Figure 5.
Comparison with different values.
4. Discussion
We first performed an experiment with the comparative methods GA and SLSQP, as shown in Figure 1. GAs with different populations were trapped in local optima and were far from the 95% target. SLSQP worked well, reaching the target of 95%, but took more than 400 min to do so.
Figure 2, Figure 3, Figure 4 and Figure 5 show the results of SGT, in which we depict the effects of the hyperparameters. The number of DRGs chosen with the highest costs had a positive effect on tracking, while marginal utility decreased as exceeded 120. After a comprehensive comparison and careful consideration, we chose 180 as the value of the hyperparameter . The probability with which the descending directions were randomly selected, , had a slightly positive effect, so we assigned it a value of 0.15. Figure 4 shows the effect of , the number of groups randomly shuffled, which we set as 20. Figure 5 shows the effect of , the initial total step size, which we set as 3500 for the proper value.
The insurance payment rate of 95% corresponded with the target of medical insurance policies; we also tested multiple settings to determine the robustness of SGT with the above optimal hyperparameters. As shown in Table 9, we assumed the insurance payment rate to be 93% to 97% (the stop criterion is a 0.1% relative error) and the running time to be consistent, which decreases when the insurance payment rate increases. Our SGT with optimal settings completed this parameter-searching task in only 3.56 min when the insurance payment rate was set at a practical 95%.
Table 9.
The robustness of SGT on different insurance payment rates.
Limitations of this study include issues related to generalizability, model interpretability, and the comprehensive evaluation of the healthcare system. Regarding generalizability, the dataset utilized in this study was derived from a single city, which may limit the broader applicability of the findings. Future research should validate the proposed approach across multiple cities to enhance its generalizability. The challenges of generalizability would be customized policy constraint conditions and data availability. Concerning model interpretability, the complexity of the DRG weight optimization results may pose challenges for decision-makers in fully comprehending the outcomes. As a result, expert manual review remains necessary to ensure proper interpretation and implementation. With respect to the comprehensive evaluation of the healthcare system, the inherent complexity of healthcare systems means that adjustments to DRG weights could have wide-ranging implications across multiple dimensions. Further research is warranted to conduct a thorough assessment of the impacts resulting from changes in DRG weights.
More research on other relevant algorithms to solve medical insurance policy formulation will also be considered as future work. The hyperparameters were selected manually in this research, but an automated hyperparameter optimization procedure can be discussed with grid search, random search, Bayesian optimization, gradient-based optimization, and so on.
Healthcare policy decision-making necessitates engagement with a diverse constellation of stakeholders—including patients, clinicians, healthcare institutions, insurers, and pharmaceutical firms. While the establishment of an optimal evaluative framework remains an aspirational objective, its realization is inherently constrained by competing priorities. Future research should operationalize multi-objective optimization methodologies to systematize diagnosis-related group (DRG) weighting determinations.
5. Conclusions
Diagnosis-related groups (DRGs) provide a classification scheme for different patients and are widely used in countries all around the world. They support the rational utilization of medical insurance funds, standardize the diagnosis and treatment processes of hospitals, and provide patients with high-quality medical services at a reasonable cost.
In China, settlement details and DRG weights need to be fine-tuned in various areas. In this study, we introduced a mathematical paradigm into the detail-deciding problem and policy planning process. Based on emerging artificial intelligence and optimization techniques, we proposed a stochastic gradient tracking (SGT) algorithm and explored its hyperparameters in numerous experiments. SGT performed better than the genetic algorithm and maturely deployed sequential quadratic programming to solve the detail-deciding problem. Further, additional experiments with different insurance payment rates set as tracking targets demonstrated the robustness of the SGT algorithm and its potential use for future decision-making in medical insurance policy.
Finally, our stochastic gradient tracking algorithm determined parameters in only 3.56 min when the insurance payment rate was set to 95%. Our study provides a scientific and helpful reference for formulating medical insurance payment standards.
Author Contributions
Conceptualization, K.B.; methodology, K.B.; software, K.B.; validation, K.B. and B.H.; formal analysis, K.B.; writing—original draft preparation, K.B.; writing—review and editing, K.B. and B.H.; visualization, K.B.; supervision, B.H.; project administration, B.H. All authors have read and agreed to the published version of the manuscript.
Funding
This research received no external funding.
Institutional Review Board Statement
Not applicable.
Informed Consent Statement
Patient consent was waived due to the data used in the article only containing statistical data.
Data Availability Statement
The data presented in this study are available on request from the corresponding author due to administrative laws and regulations.
Acknowledgments
This research was supported by Tong Li and Dongxue Zhou in the discussion and coding of the experiment. Chaofan Hao also contributed to the editing of this article. Yuting Wang helped with the learning of the DRG knowledge.
Conflicts of Interest
The authors declare no conflicts of interest.
References
- Barouni, M.; Ahmadian, L.; Anari, H.S.; Mohsenbeigi, E. Challenges and adverse outcomes of implementing reimbursement mechanisms based on the diagnosis-related group classification system: A systematic review. Sultan Qaboos Univ. Med. J. 2020, 3, e260–e270. [Google Scholar] [CrossRef] [PubMed]
- Busse, R.; Geissler, A.; Aaviksoo, A.; Cots, F.; Häkkinen, U.; Kobel, C.; Mateus, C.; Or, Z.; O’reilly, J.; Serdén, L.; et al. Diagnosis related groups in Europe: Moving towards transparency, efficiency, and quality in hospitals? BMJ 2013, 346, f3197. [Google Scholar] [CrossRef] [PubMed]
- Sodzi-Tettey, S.; Aikins, M.; Awoonor-Williams, J.K.; Agyepong, I.A. Challenges in provider payment under the Ghana National Health Insurance Scheme: A case study of claims management in two districts. Ghana. Med. J. 2012, 46, 189–199. [Google Scholar] [PubMed]
- Notman, M.; Howe, K.R.; Rittenberg, W.; Bridgham, R.; Holmes, M.M.; Rovner, D.R. Social policy and professional self-interest: Physician responses to DRGs. Soc. Sci. Med. 1987, 25, 1259–1267. [Google Scholar] [CrossRef] [PubMed]
- Zhan, C.; Elixhauser, A.; Friedman, B.; Houchens, R.; Chiang, Y.P. Modifying DRG-PPS to include only diagnoses present on admission: Financial implications and challenges. Med. Care 2007, 45, 288–291. [Google Scholar] [CrossRef] [PubMed]
- Bray, N.; Carter, C.; Dobson, A.; Watt, J.M.; Shortell, S. An examination of winners and losers under Medicare’s prospective payment system. Health Care Manag. Rev. 1994, 19, 44–55. [Google Scholar] [CrossRef]
- Wild, V.; Carina, F.; Frouzakis, R.; Clarinval, C.; Fässler, M.; Elger, B. Assessing the impact of DRGs on patient care and professional practice in Switzerland (IDoC): A potential model for monitoring and evaluating healthcare reform. Swiss Med. Wkly. 2015, 145, w14034. [Google Scholar] [CrossRef] [PubMed]
- Zou, K.; Li, H.; Zhou, D.; Liao, Z. The effects of diagnosis-related groups payment on hospital healthcare in China: A systematic review. BMC Health Serv. Res. 2020, 20, 112. [Google Scholar] [CrossRef] [PubMed]
- Zhang, L.; Sun, L. Impacts of diagnosis-related groups payment on the healthcare providers’ behavior in China: A cross-sectional study among physicians. Risk Manag. Healthc. Policy 2021, 14, 2263–2276. [Google Scholar] [CrossRef] [PubMed]
- Trajtenberg, M. AI as the Next GPT: A Political-Economy Perspective; National Bureau of Economic Research: Cambridge, MA, USA, 2018; p. w24245. [Google Scholar]
- Yu, K.H.; Beam, A.L.; Kohane, I.S. Artificial intelligence in healthcare. Nat. Biomed. Eng. 2018, 2, 719–731. [Google Scholar] [CrossRef] [PubMed]
- Medrano, I.H.; Guijarro, J.T.; Belda, C.; Ureña, A.; Salcedo, I.; Espinosa-Anke, L.; Saggion, H. Savana: Re-using electronic health records with artificial intelligence. Int. J. Interact. Multimed. Artif. Intell. 2018, 4, 8–12. [Google Scholar]
- Hao, C.; Jin, N.; Qiu, C.; Ba, K.; Wang, X.; Zhang, H.; Zhao, Q.; Huang, B. Balanced Convolutional Neural Networks for Pneumoconiosis Detection. Int. J. Environ. Res. Public Health. 2021, 18, 9091. [Google Scholar] [CrossRef] [PubMed]
- Silva, F.; Nguyen, T.; Fe, I.; Brito, C.; Min, D.; Lee, J. Performance Evaluation of an Internet of Healthcare Things for Medical Monitoring Using M/M/c/K Queuing Models. IEEE Access 2021, 9, 55271–55283. [Google Scholar] [CrossRef]
- Tutsoy, O. COVID-19 Epidemic and Opening of the Schools: Artificial Intelligence-Based Long-Term Adaptive Policy Making to Control the Pandemic Diseases. IEEE Access 2021, 9, 68461–68471. [Google Scholar] [CrossRef]
- Zhaoji, Y.; Wenjuan, W.; Lifeng, G. Influence Mechanism of Performance Evaluation of Public Policy Implementation in Local Government Based on System Dynamics. In Proceedings of the MSIE 2011, Harbin, China, 8–11 January 2011; pp. 664–668. [Google Scholar]
- Einzinger, P.; Popper, N.; Breitenecker, F.; Pfeffer, N.; Jung, R.; Endel, G. The GAP-DRG model: Simulation of outpatient care for comparison of different reimbursement schemes. In Proceedings of the Winter Simulations Conference, Washington, DC, USA, 8–11 December 2013; pp. 2299–2308. [Google Scholar]
- Rakhlin, A.; Shamir, O.; Sridharan, K. Making gradient descent optimal for strongly convex stochastic optimization. arXiv 2011, arXiv:1109.5647. [Google Scholar]
- Forrest, S. Genetic algorithms. ACM Comput. Surv. 1996, 28, 77–80. [Google Scholar] [CrossRef]
- Han, S. Superlinearly convergent variable metric algorithms for general nonlinear programming problems. Math. Program. 1976, 11, 263–282. [Google Scholar] [CrossRef]
- Kraft, D. A Software Package for Sequential Quadratic Programming: DFVLR-FB 88-28 DLR; German Aerospace Center–Institute for Flight Mechanics: Braunschweig, Germany, 1988. [Google Scholar]
Disclaimer/Publisher’s Note: The statements, opinions and data contained in all publications are solely those of the individual author(s) and contributor(s) and not of MDPI and/or the editor(s). MDPI and/or the editor(s) disclaim responsibility for any injury to people or property resulting from any ideas, methods, instructions or products referred to in the content. |
© 2025 by the authors. Licensee MDPI, Basel, Switzerland. This article is an open access article distributed under the terms and conditions of the Creative Commons Attribution (CC BY) license (https://creativecommons.org/licenses/by/4.0/).