


Rill Erosion and Drainage Development in Post-Landslide Settings Using UAV–LiDAR Data
 , , , , and
Abstract
1. Introduction
2. Materials and Methods
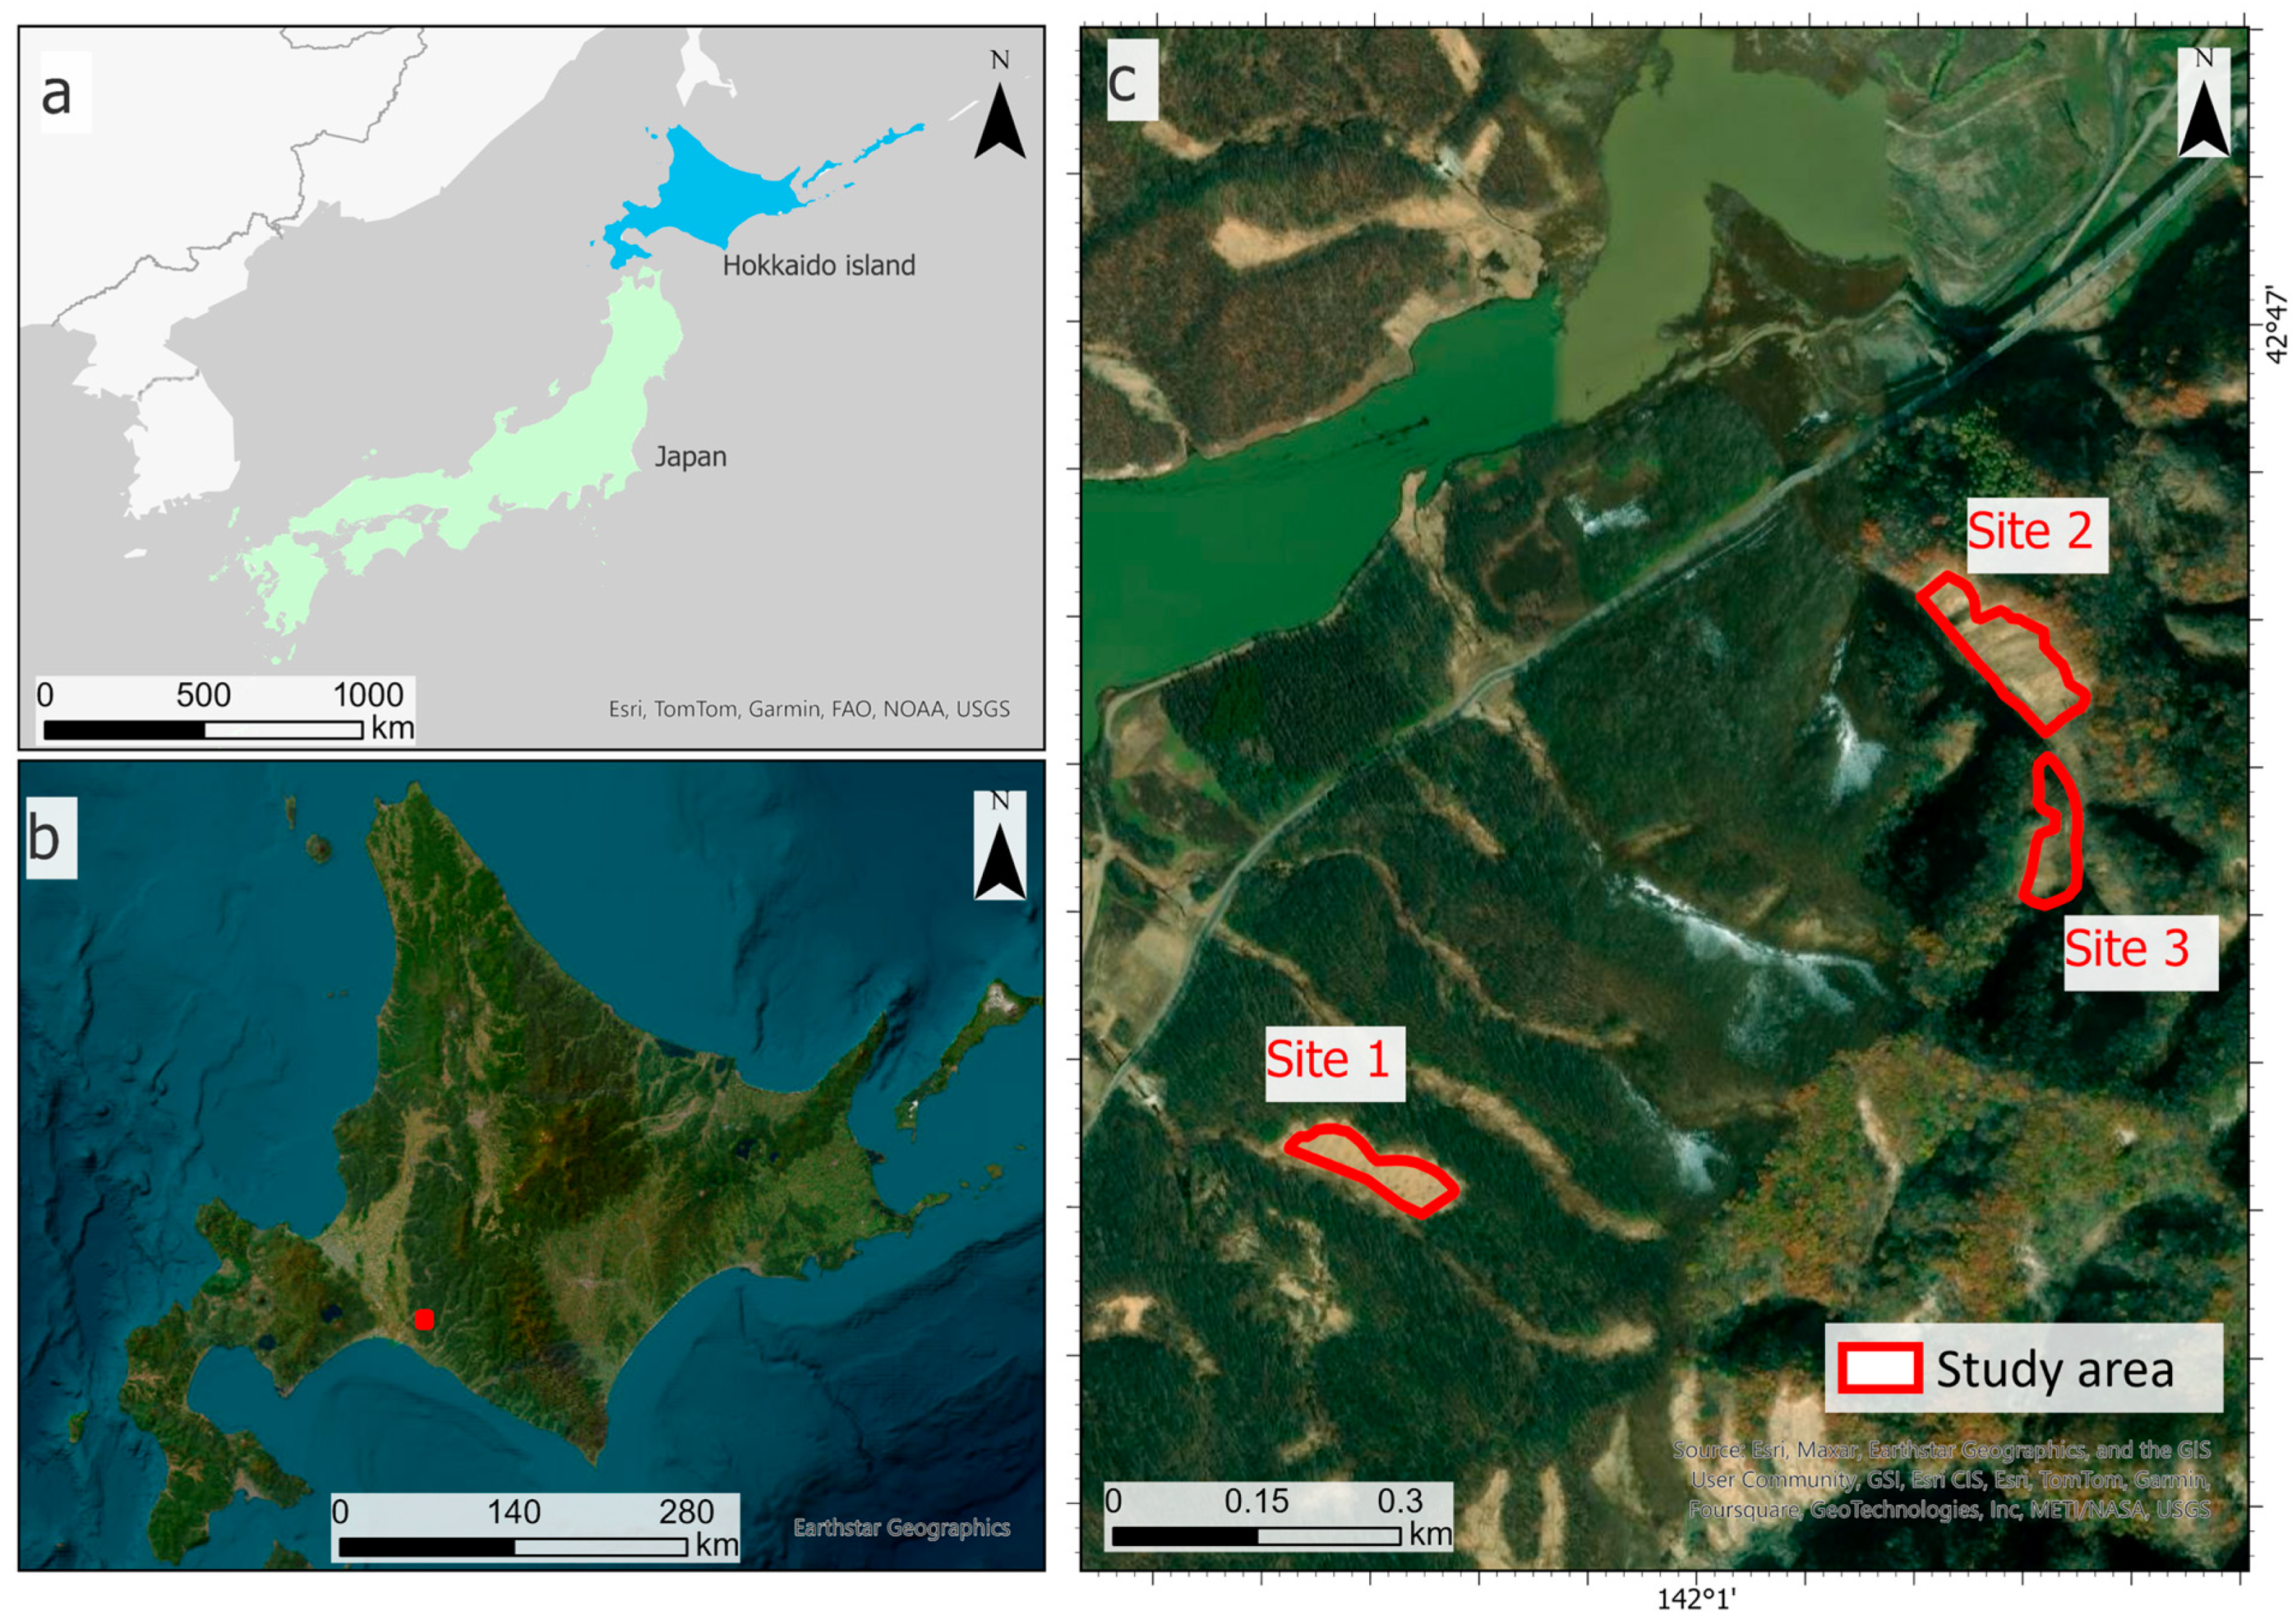
2.1. Study Area
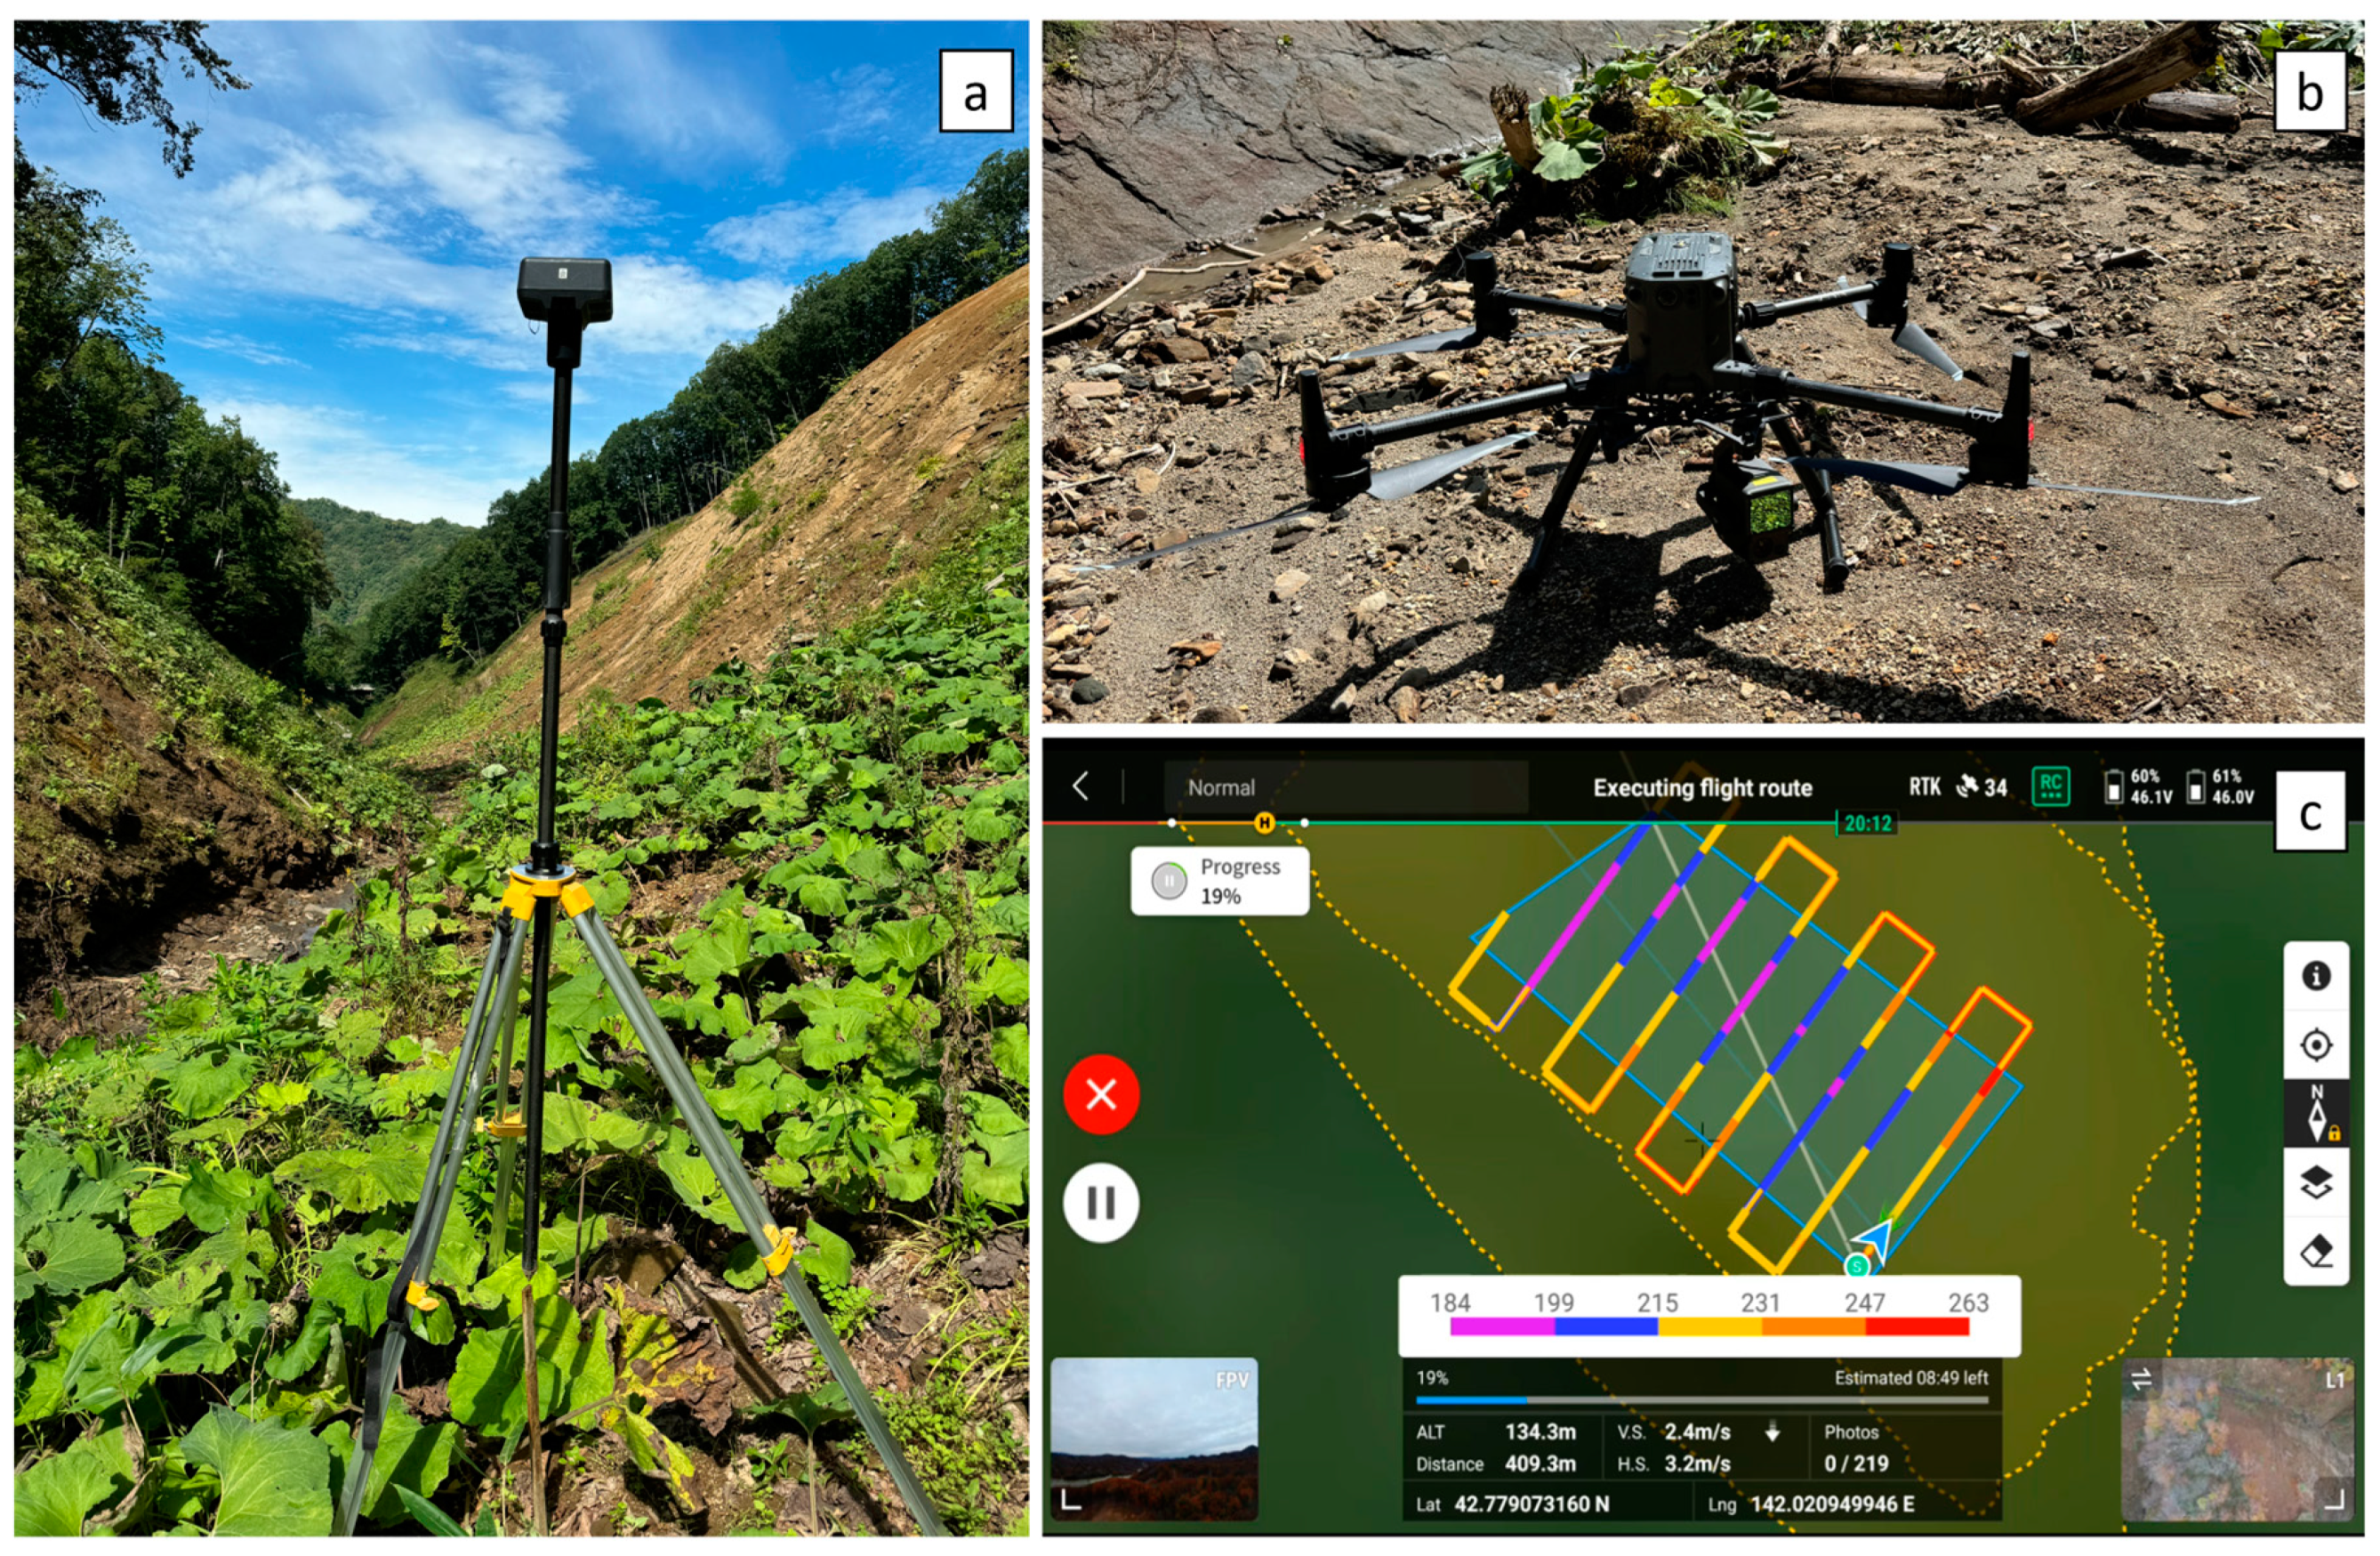
2.2. UAV System
2.3. Field Survey & Flight Parameters
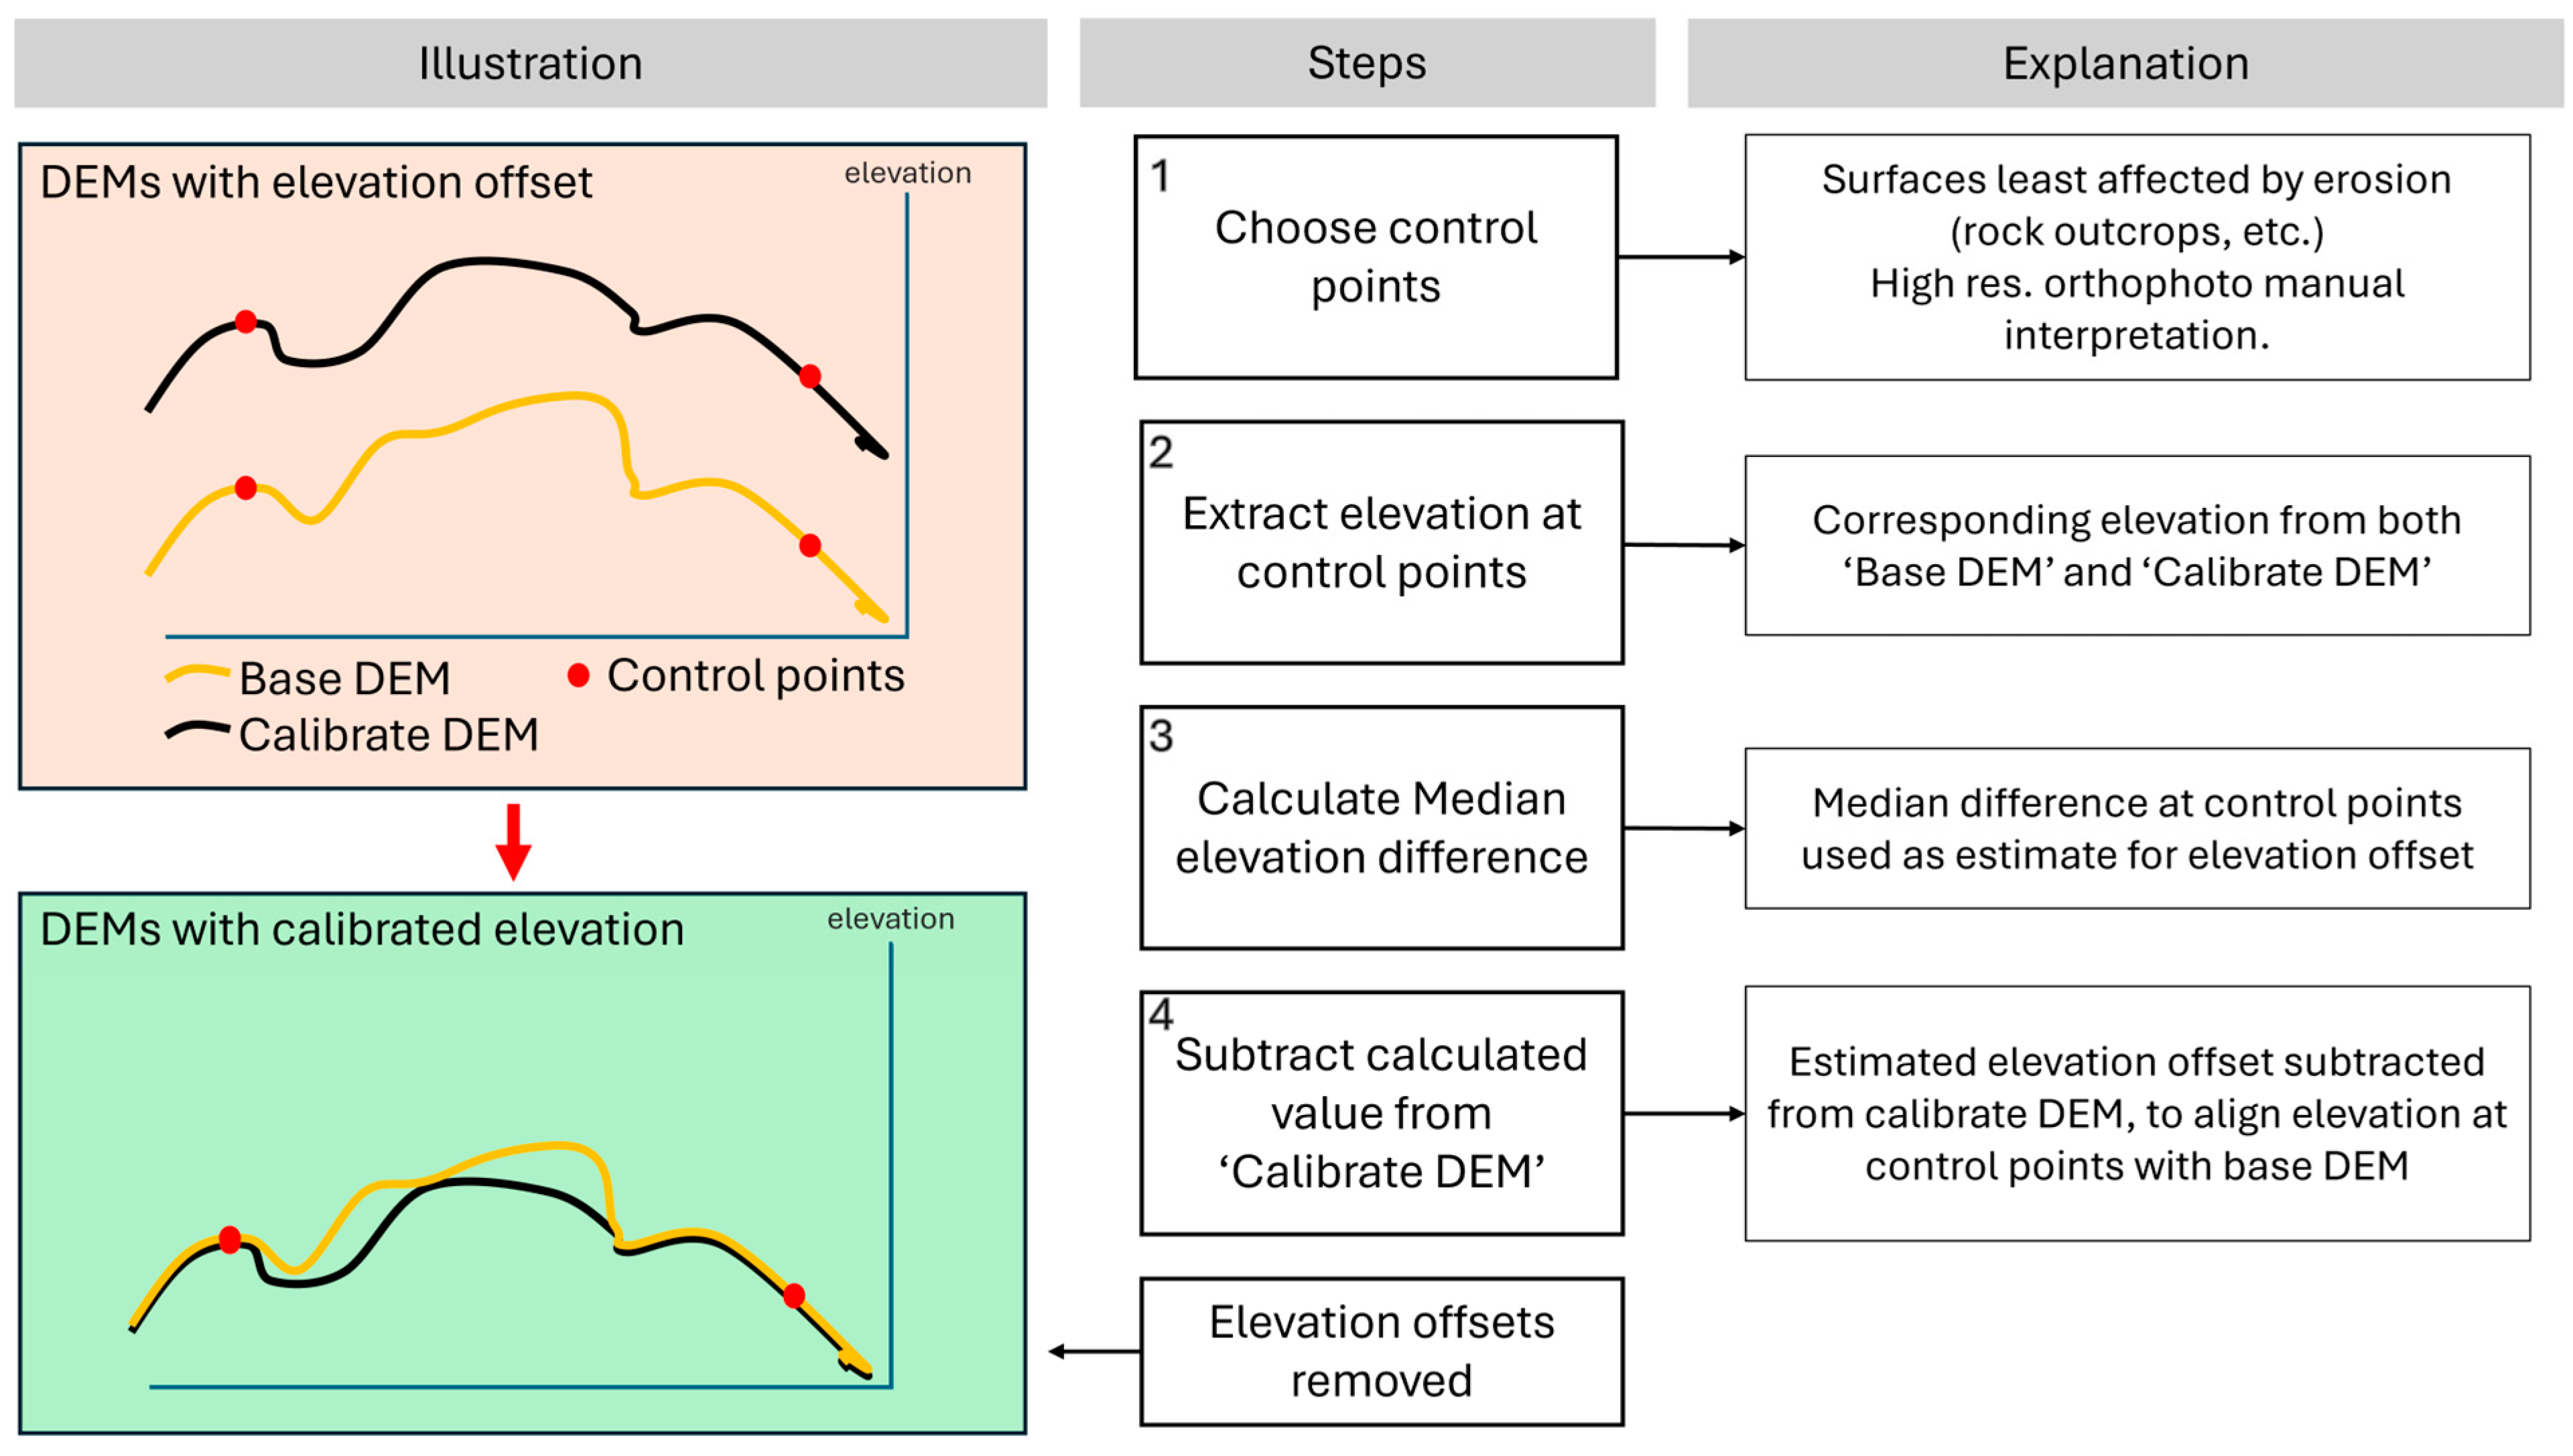
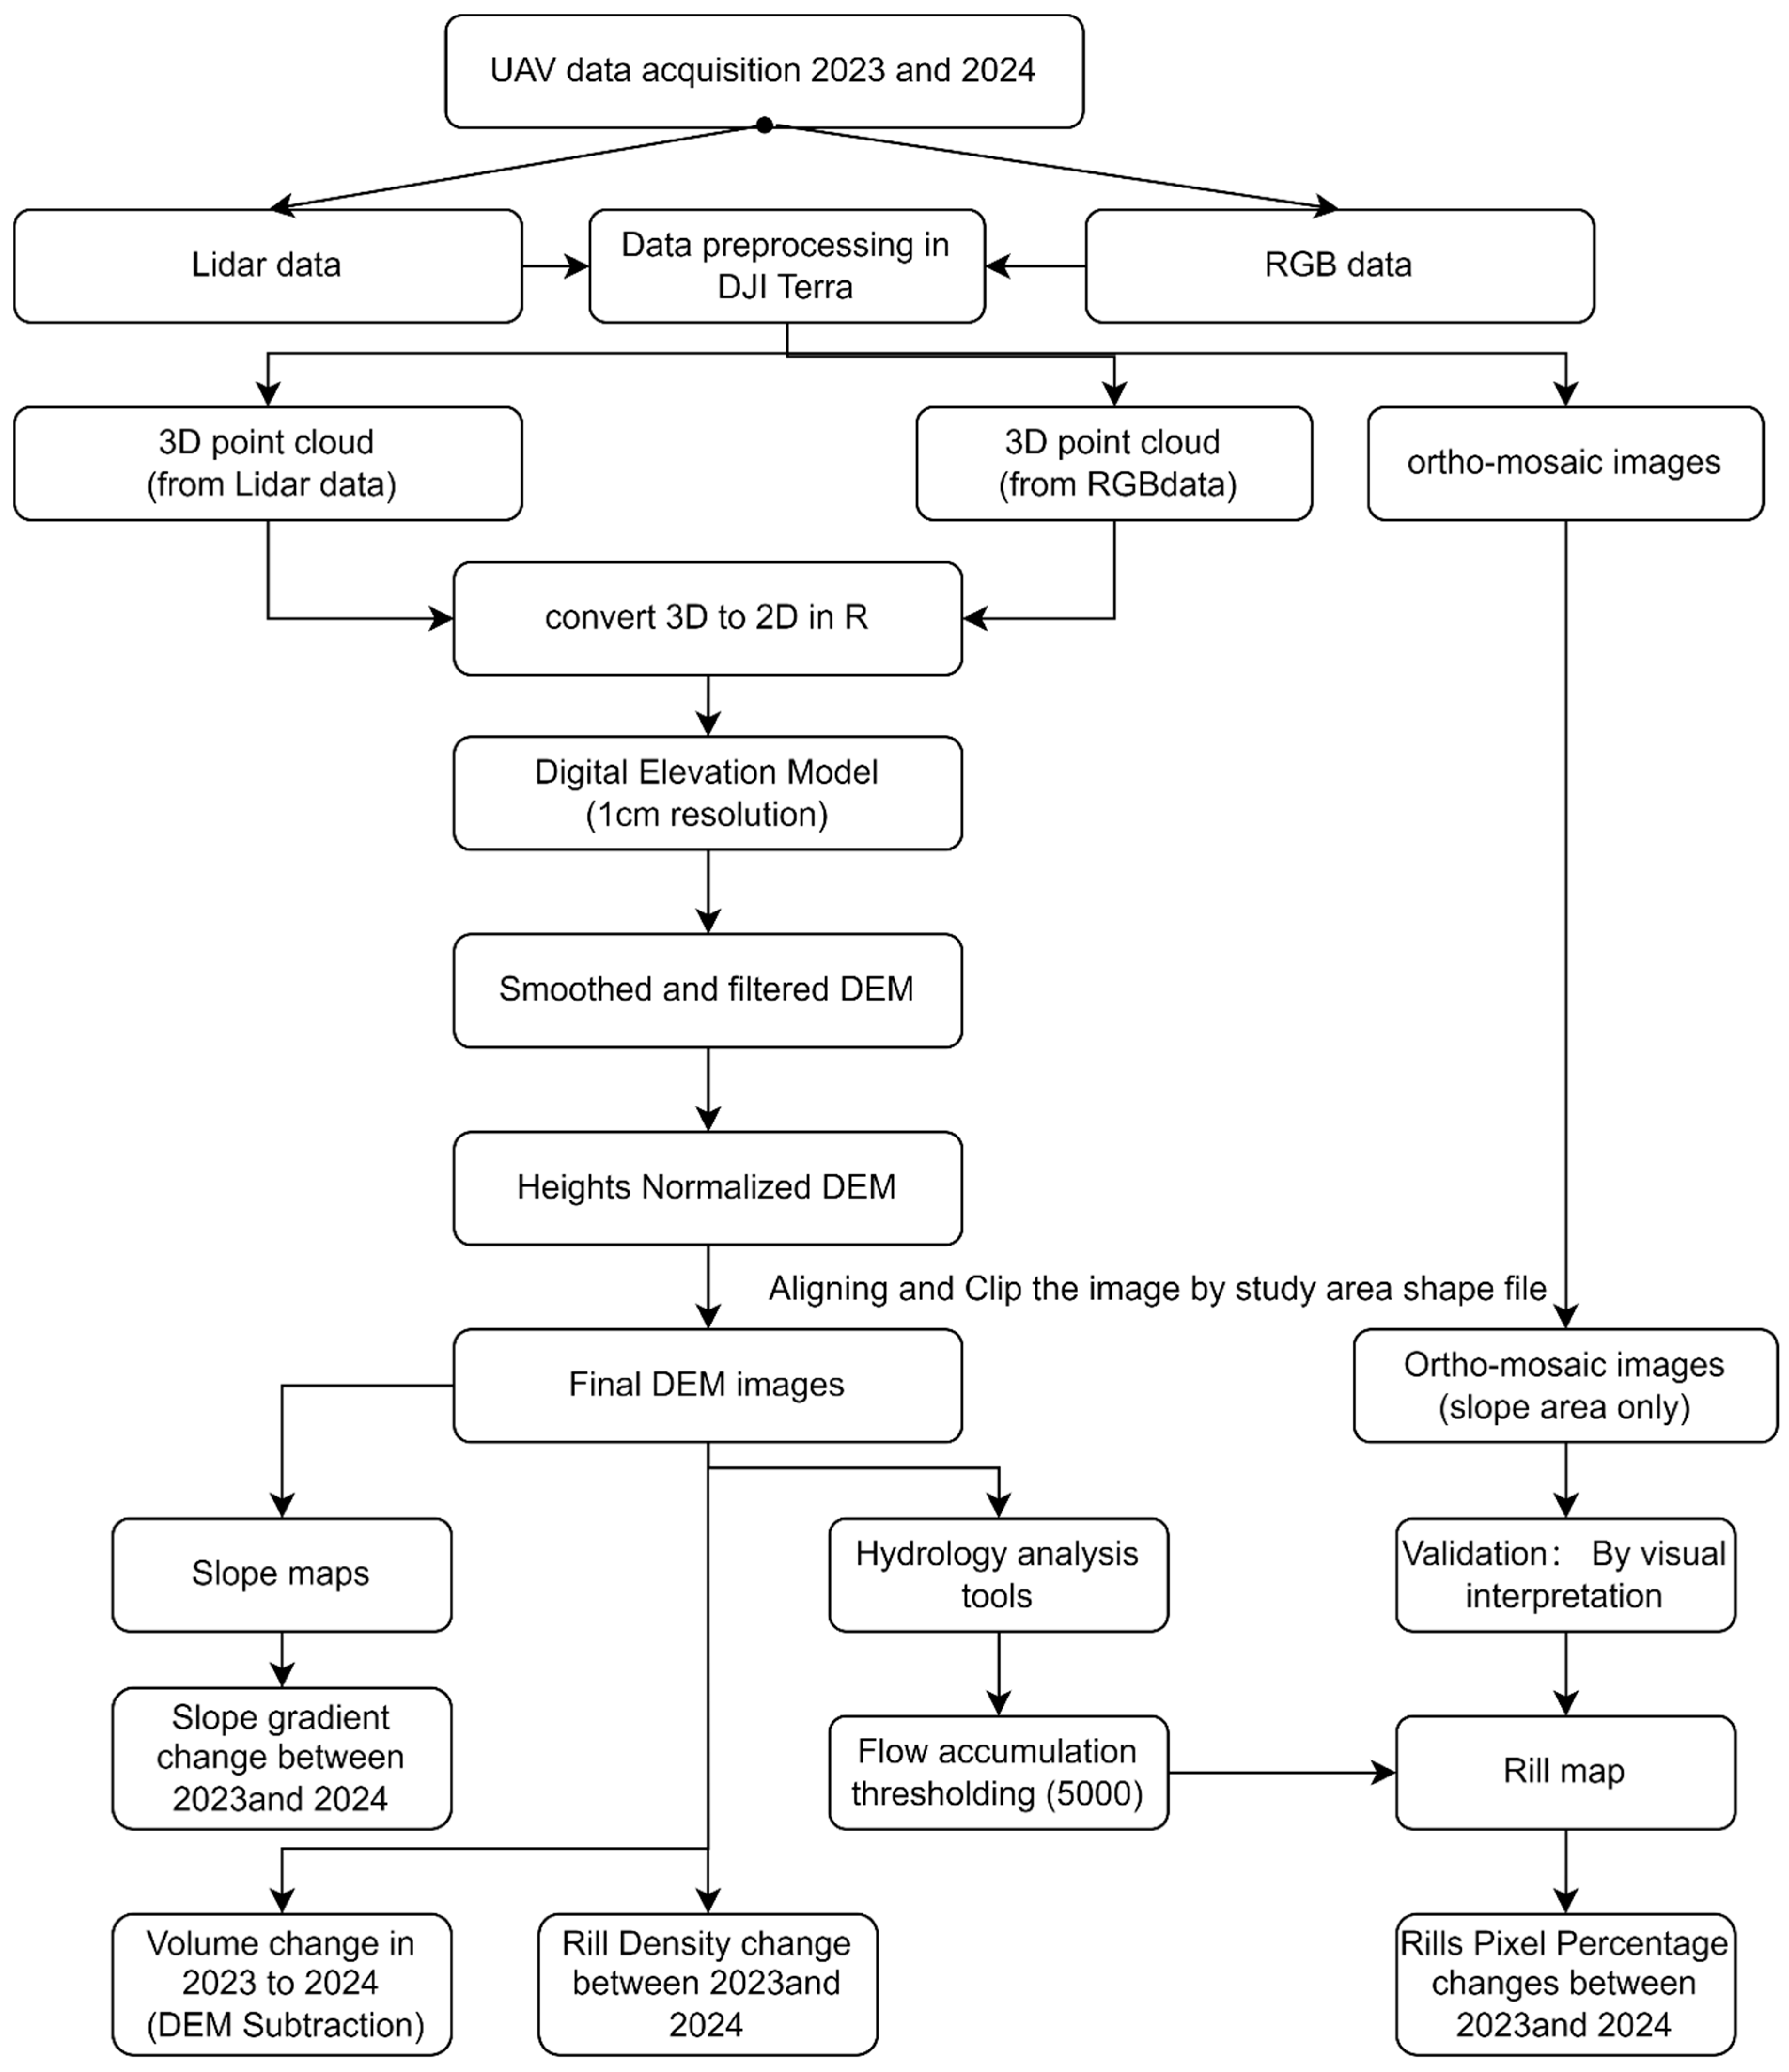
2.4. Digital Elevation Model Generation
2.5. Rill Extraction & Change Analysis
3. Results
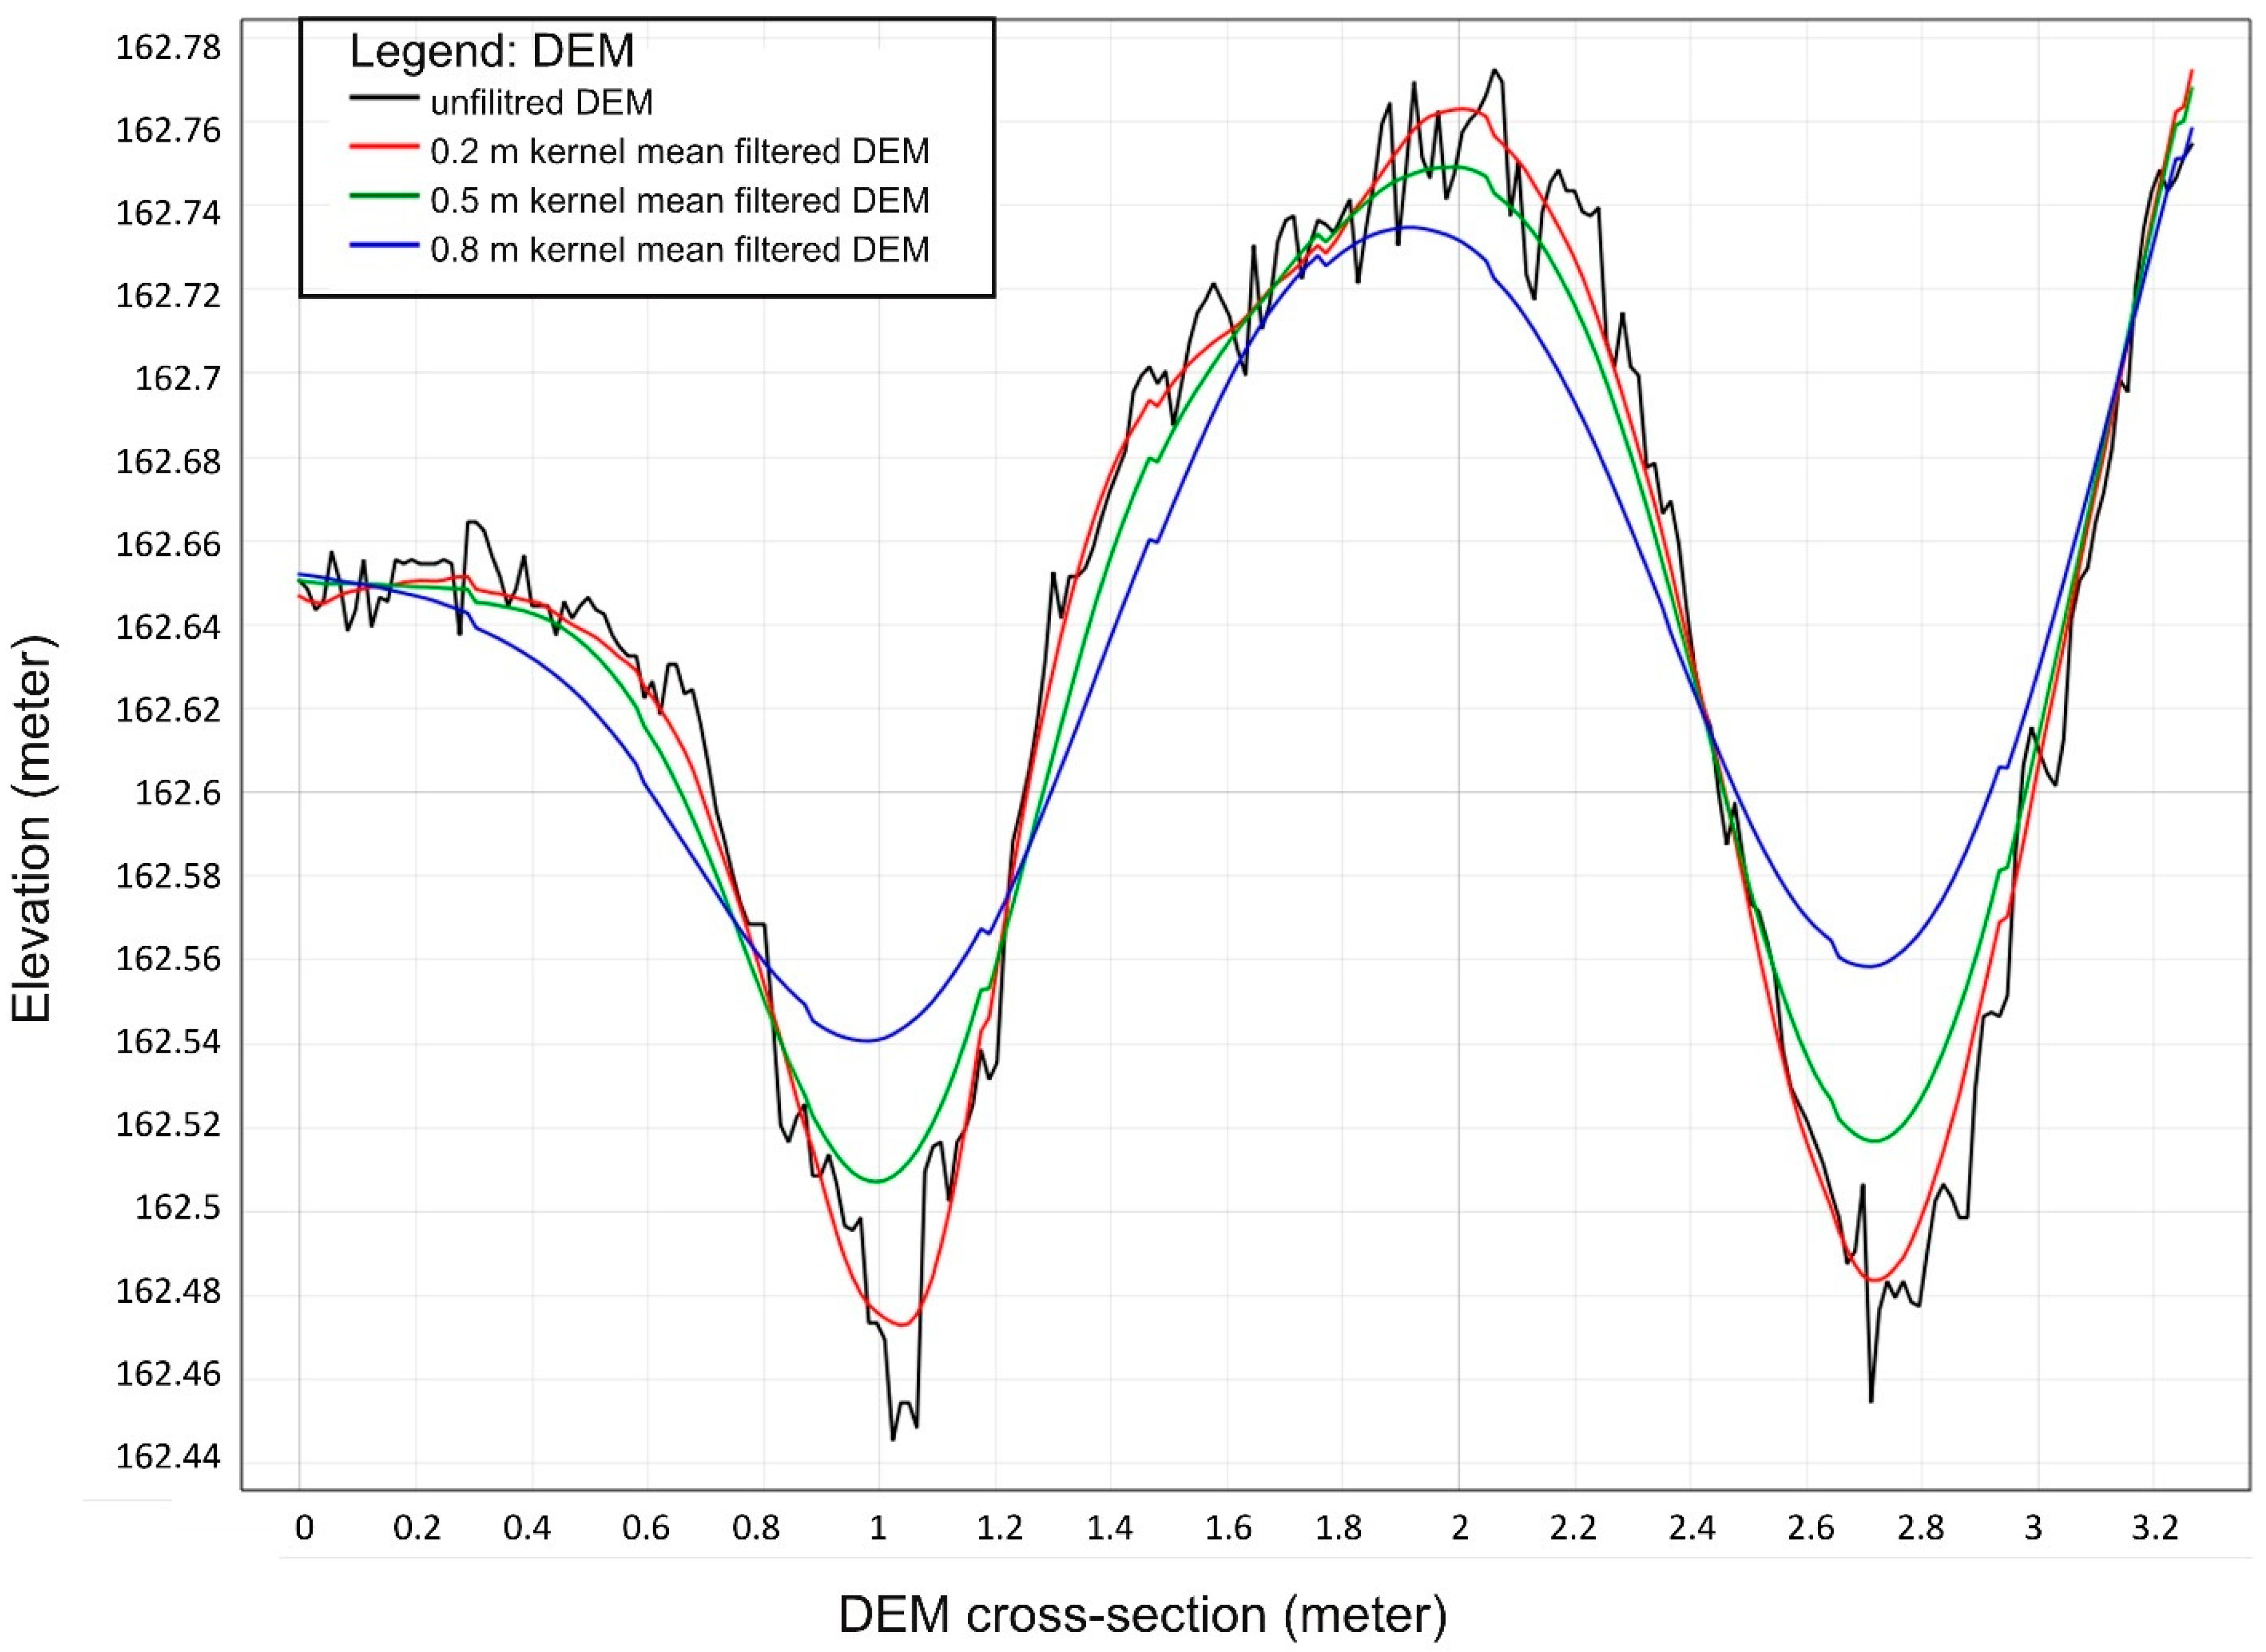
3.1. DEM Filtering Effect
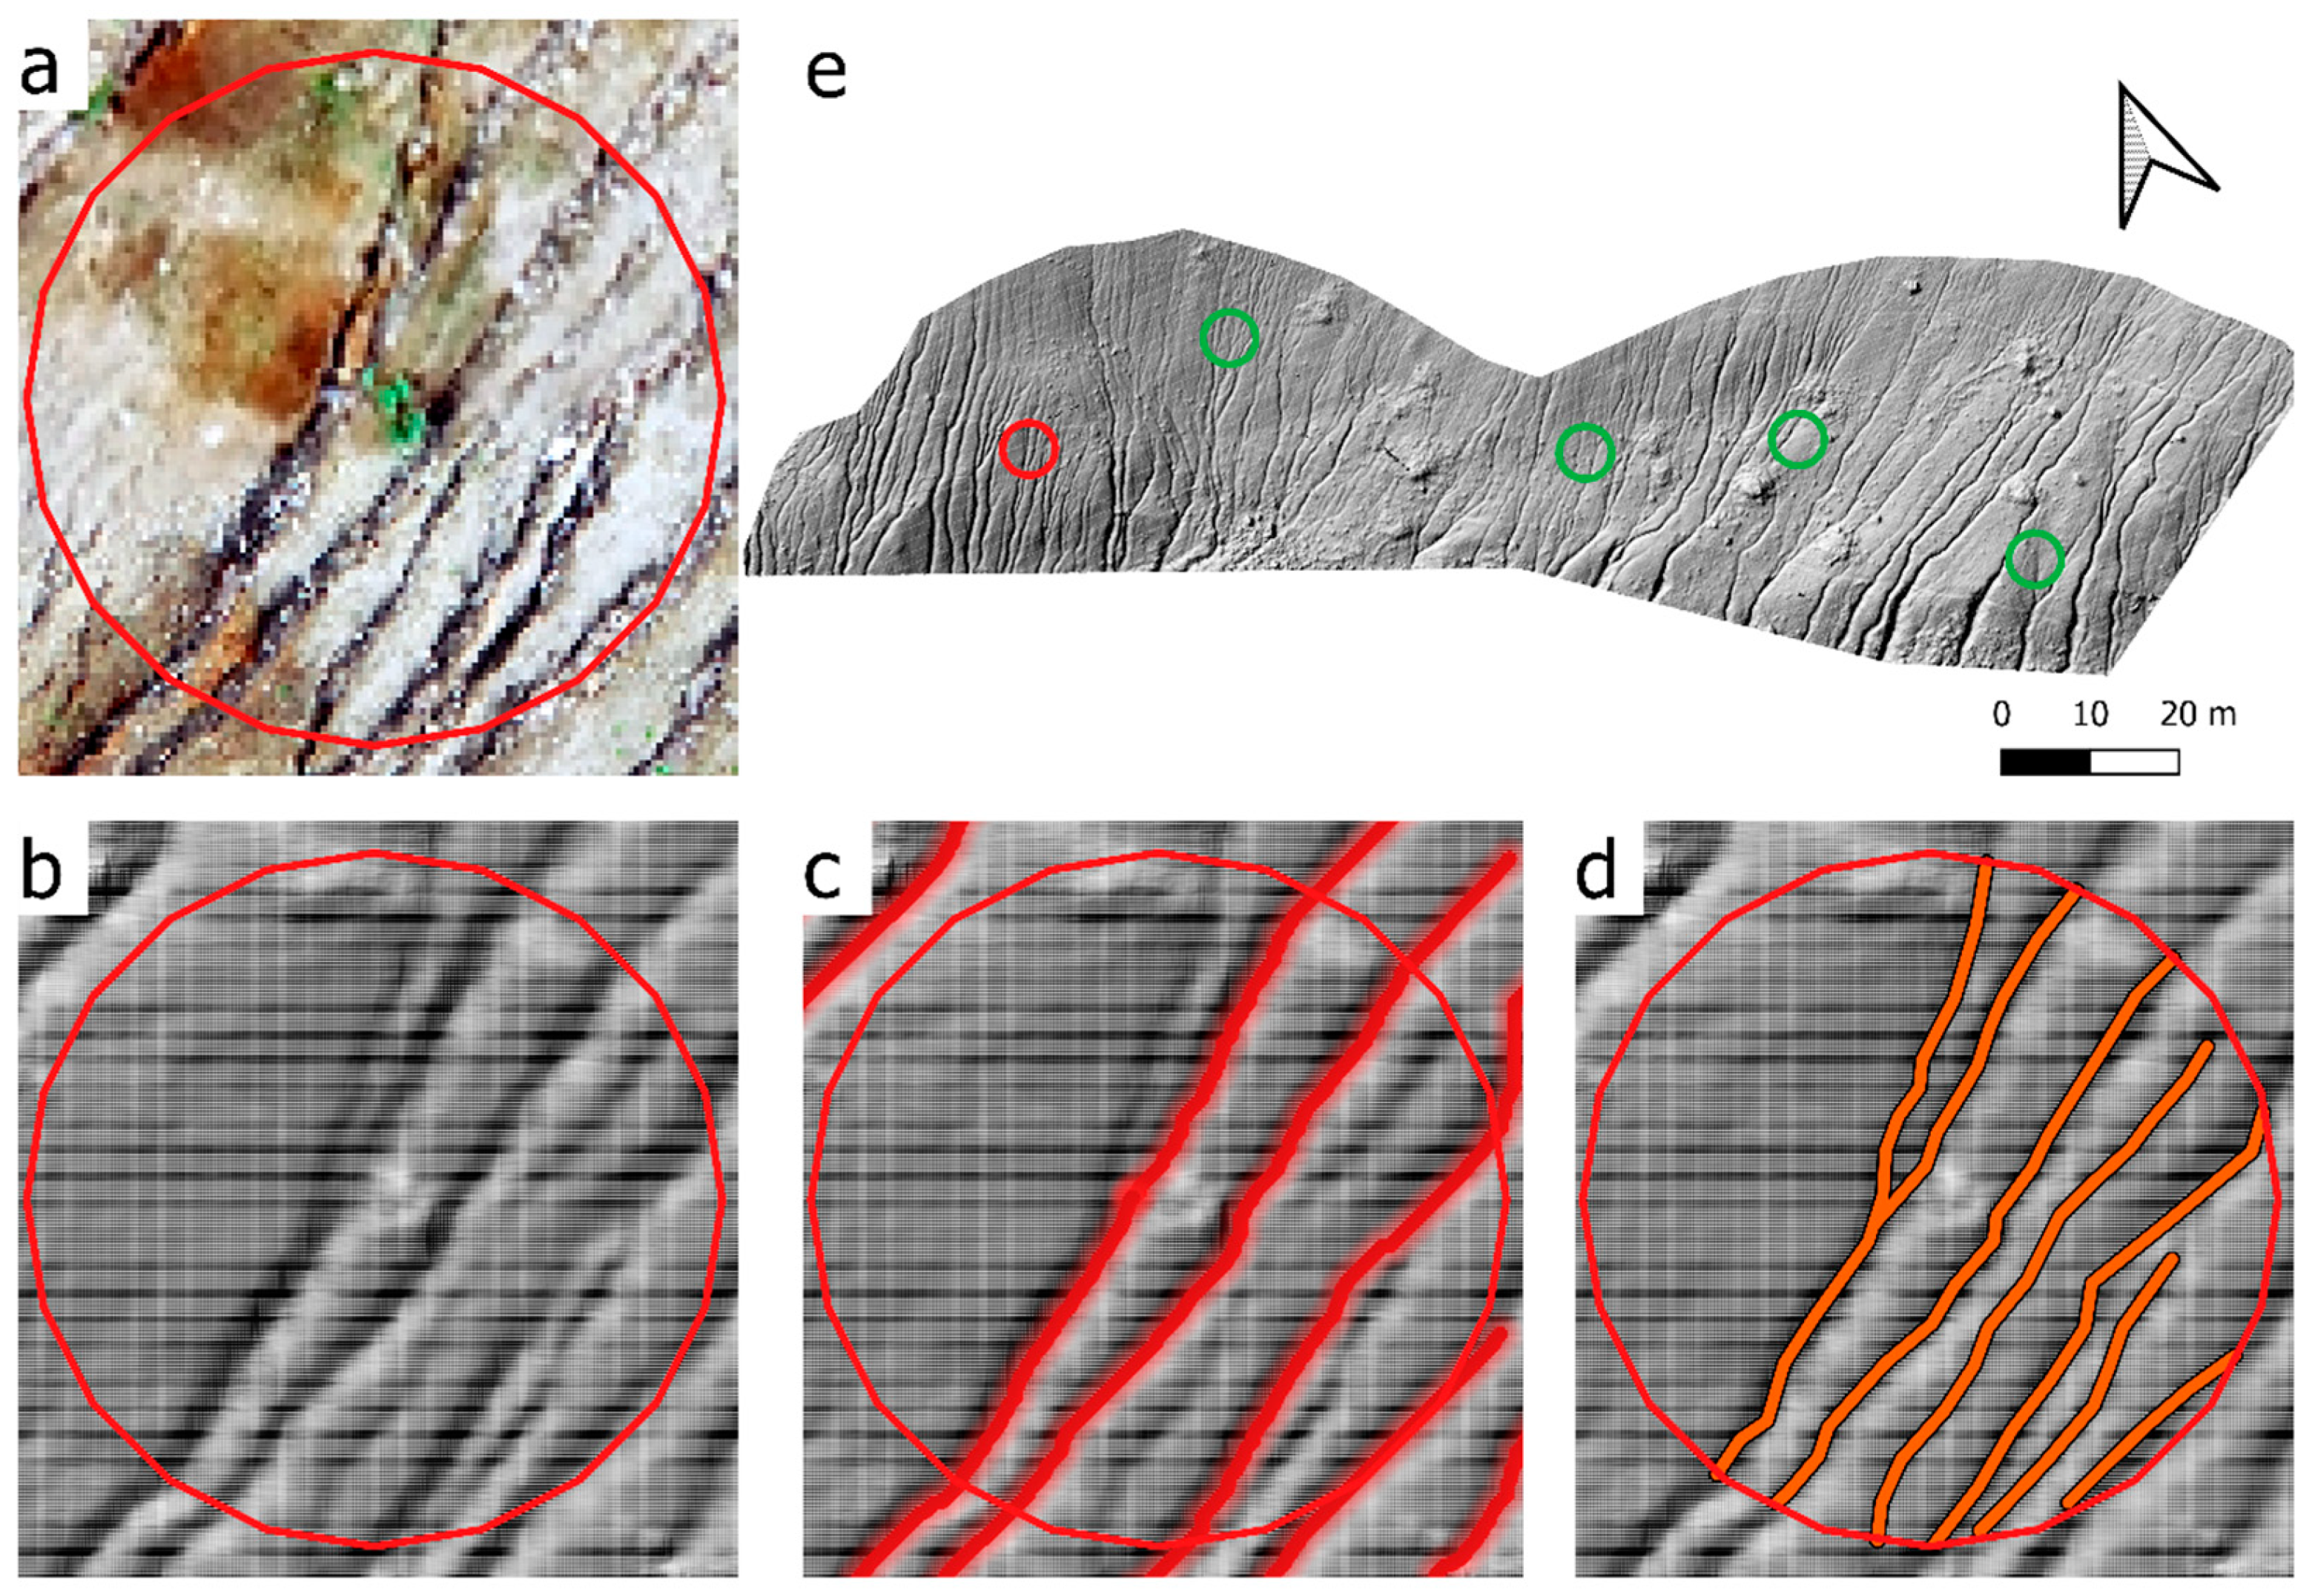
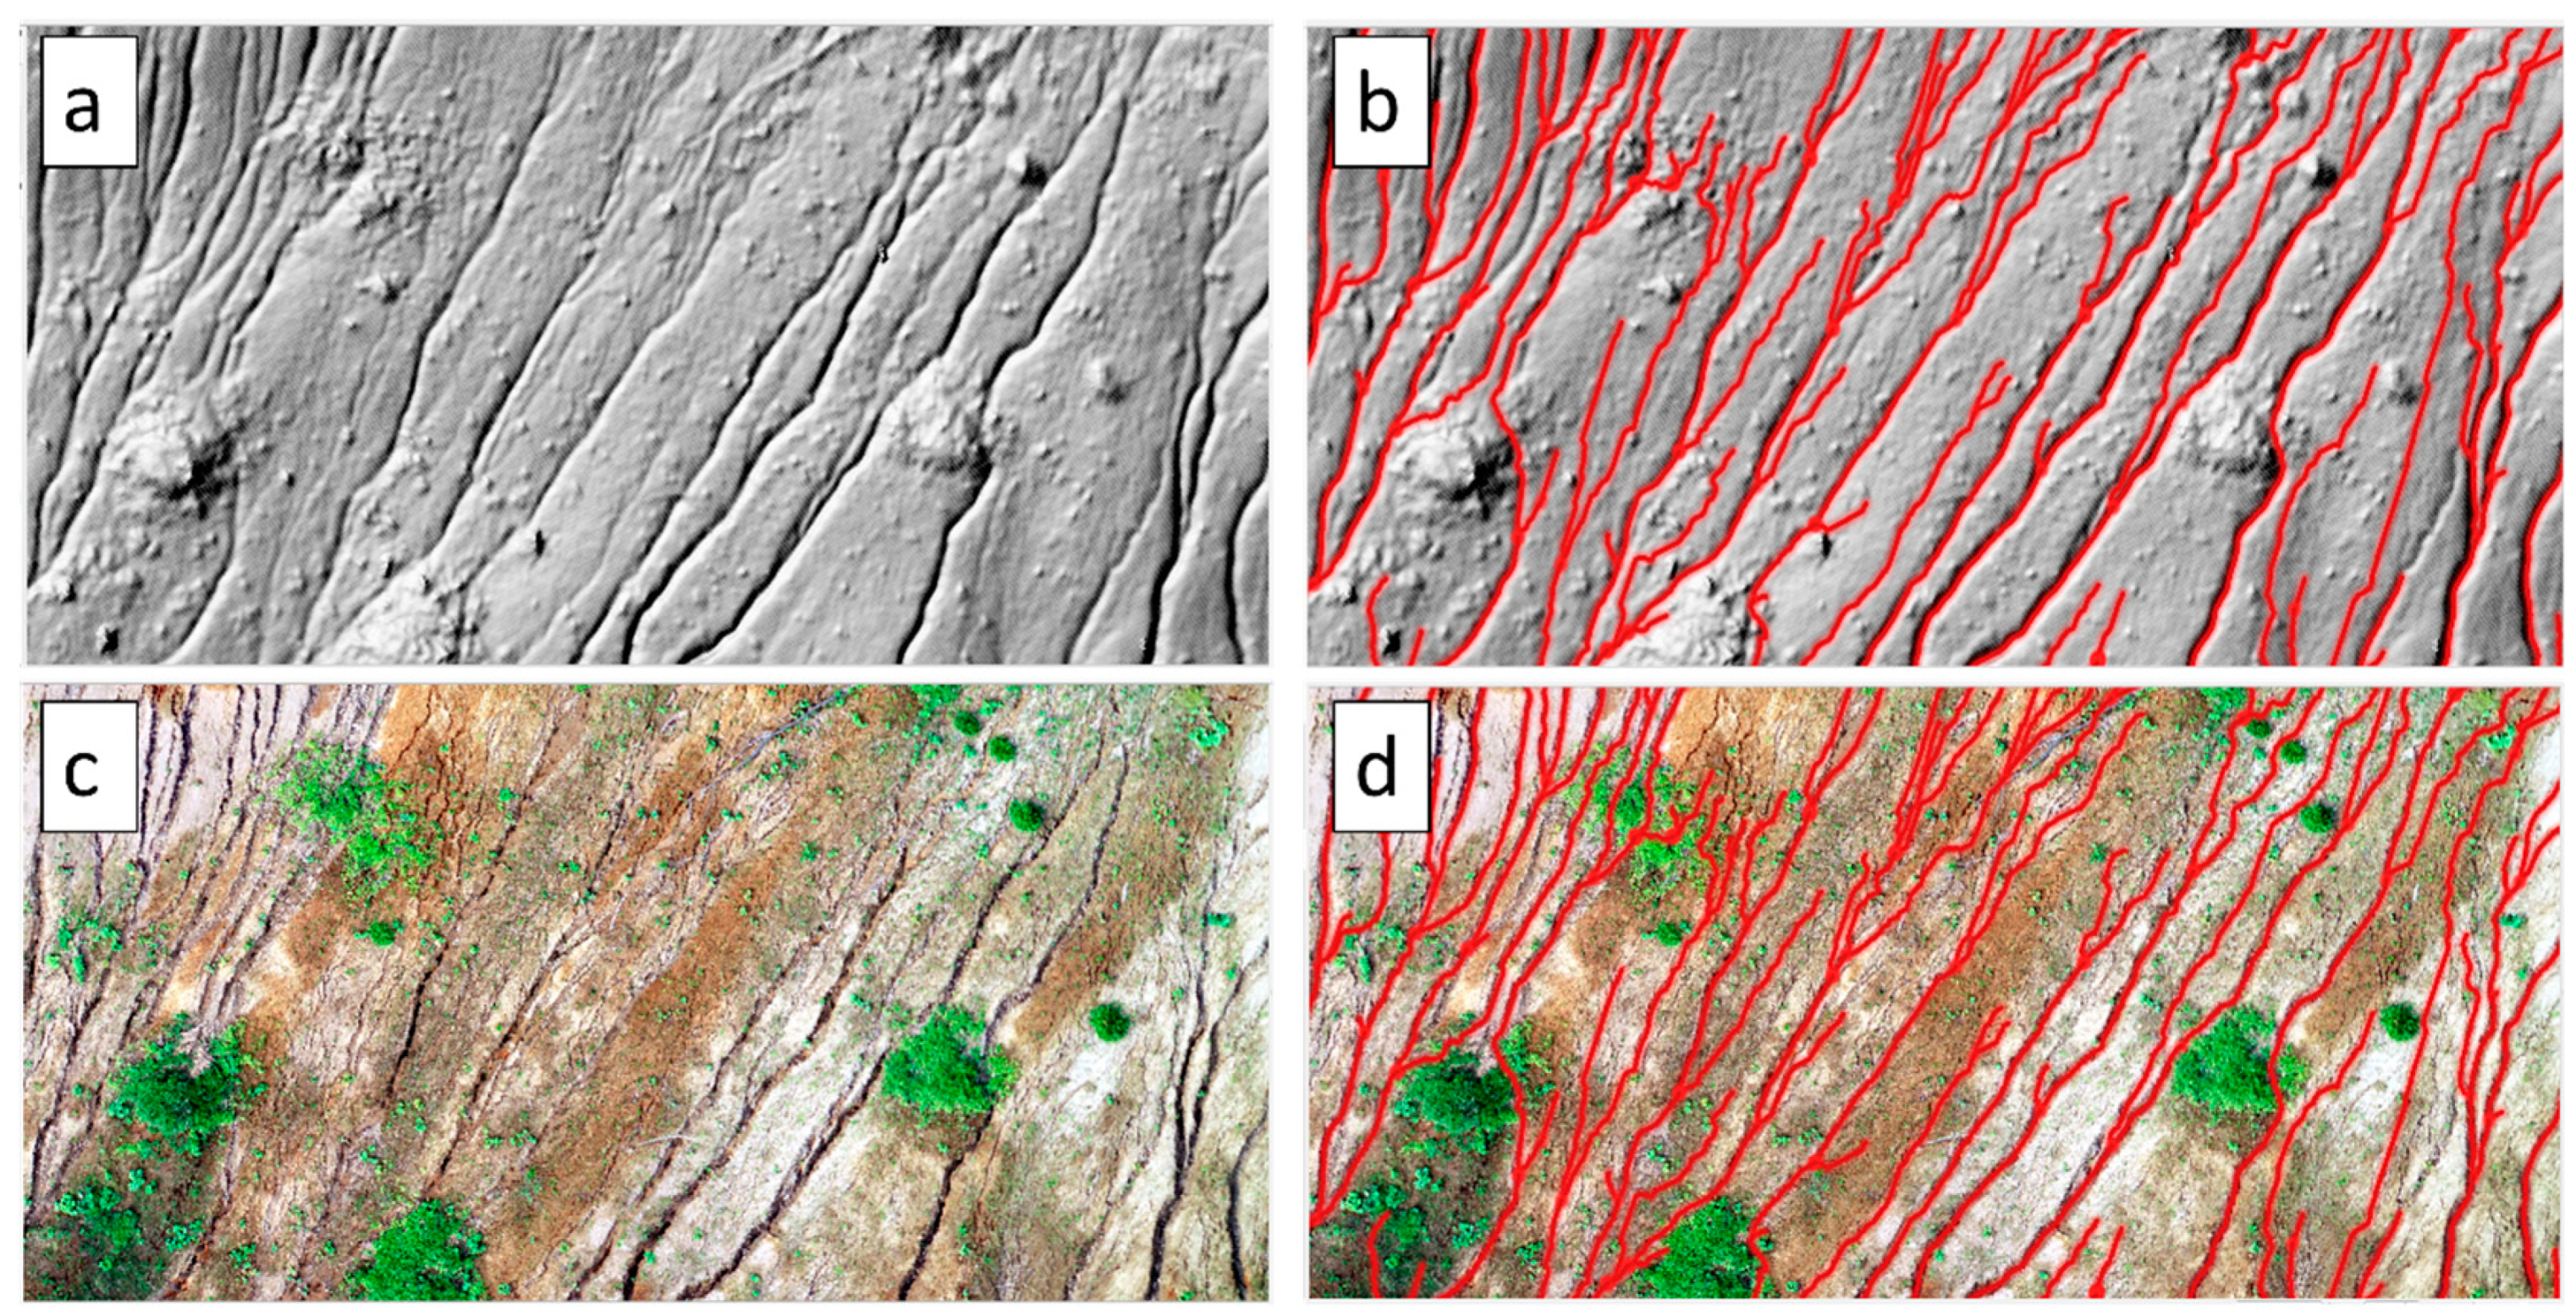
3.2. Rill Extraction Result and Validation
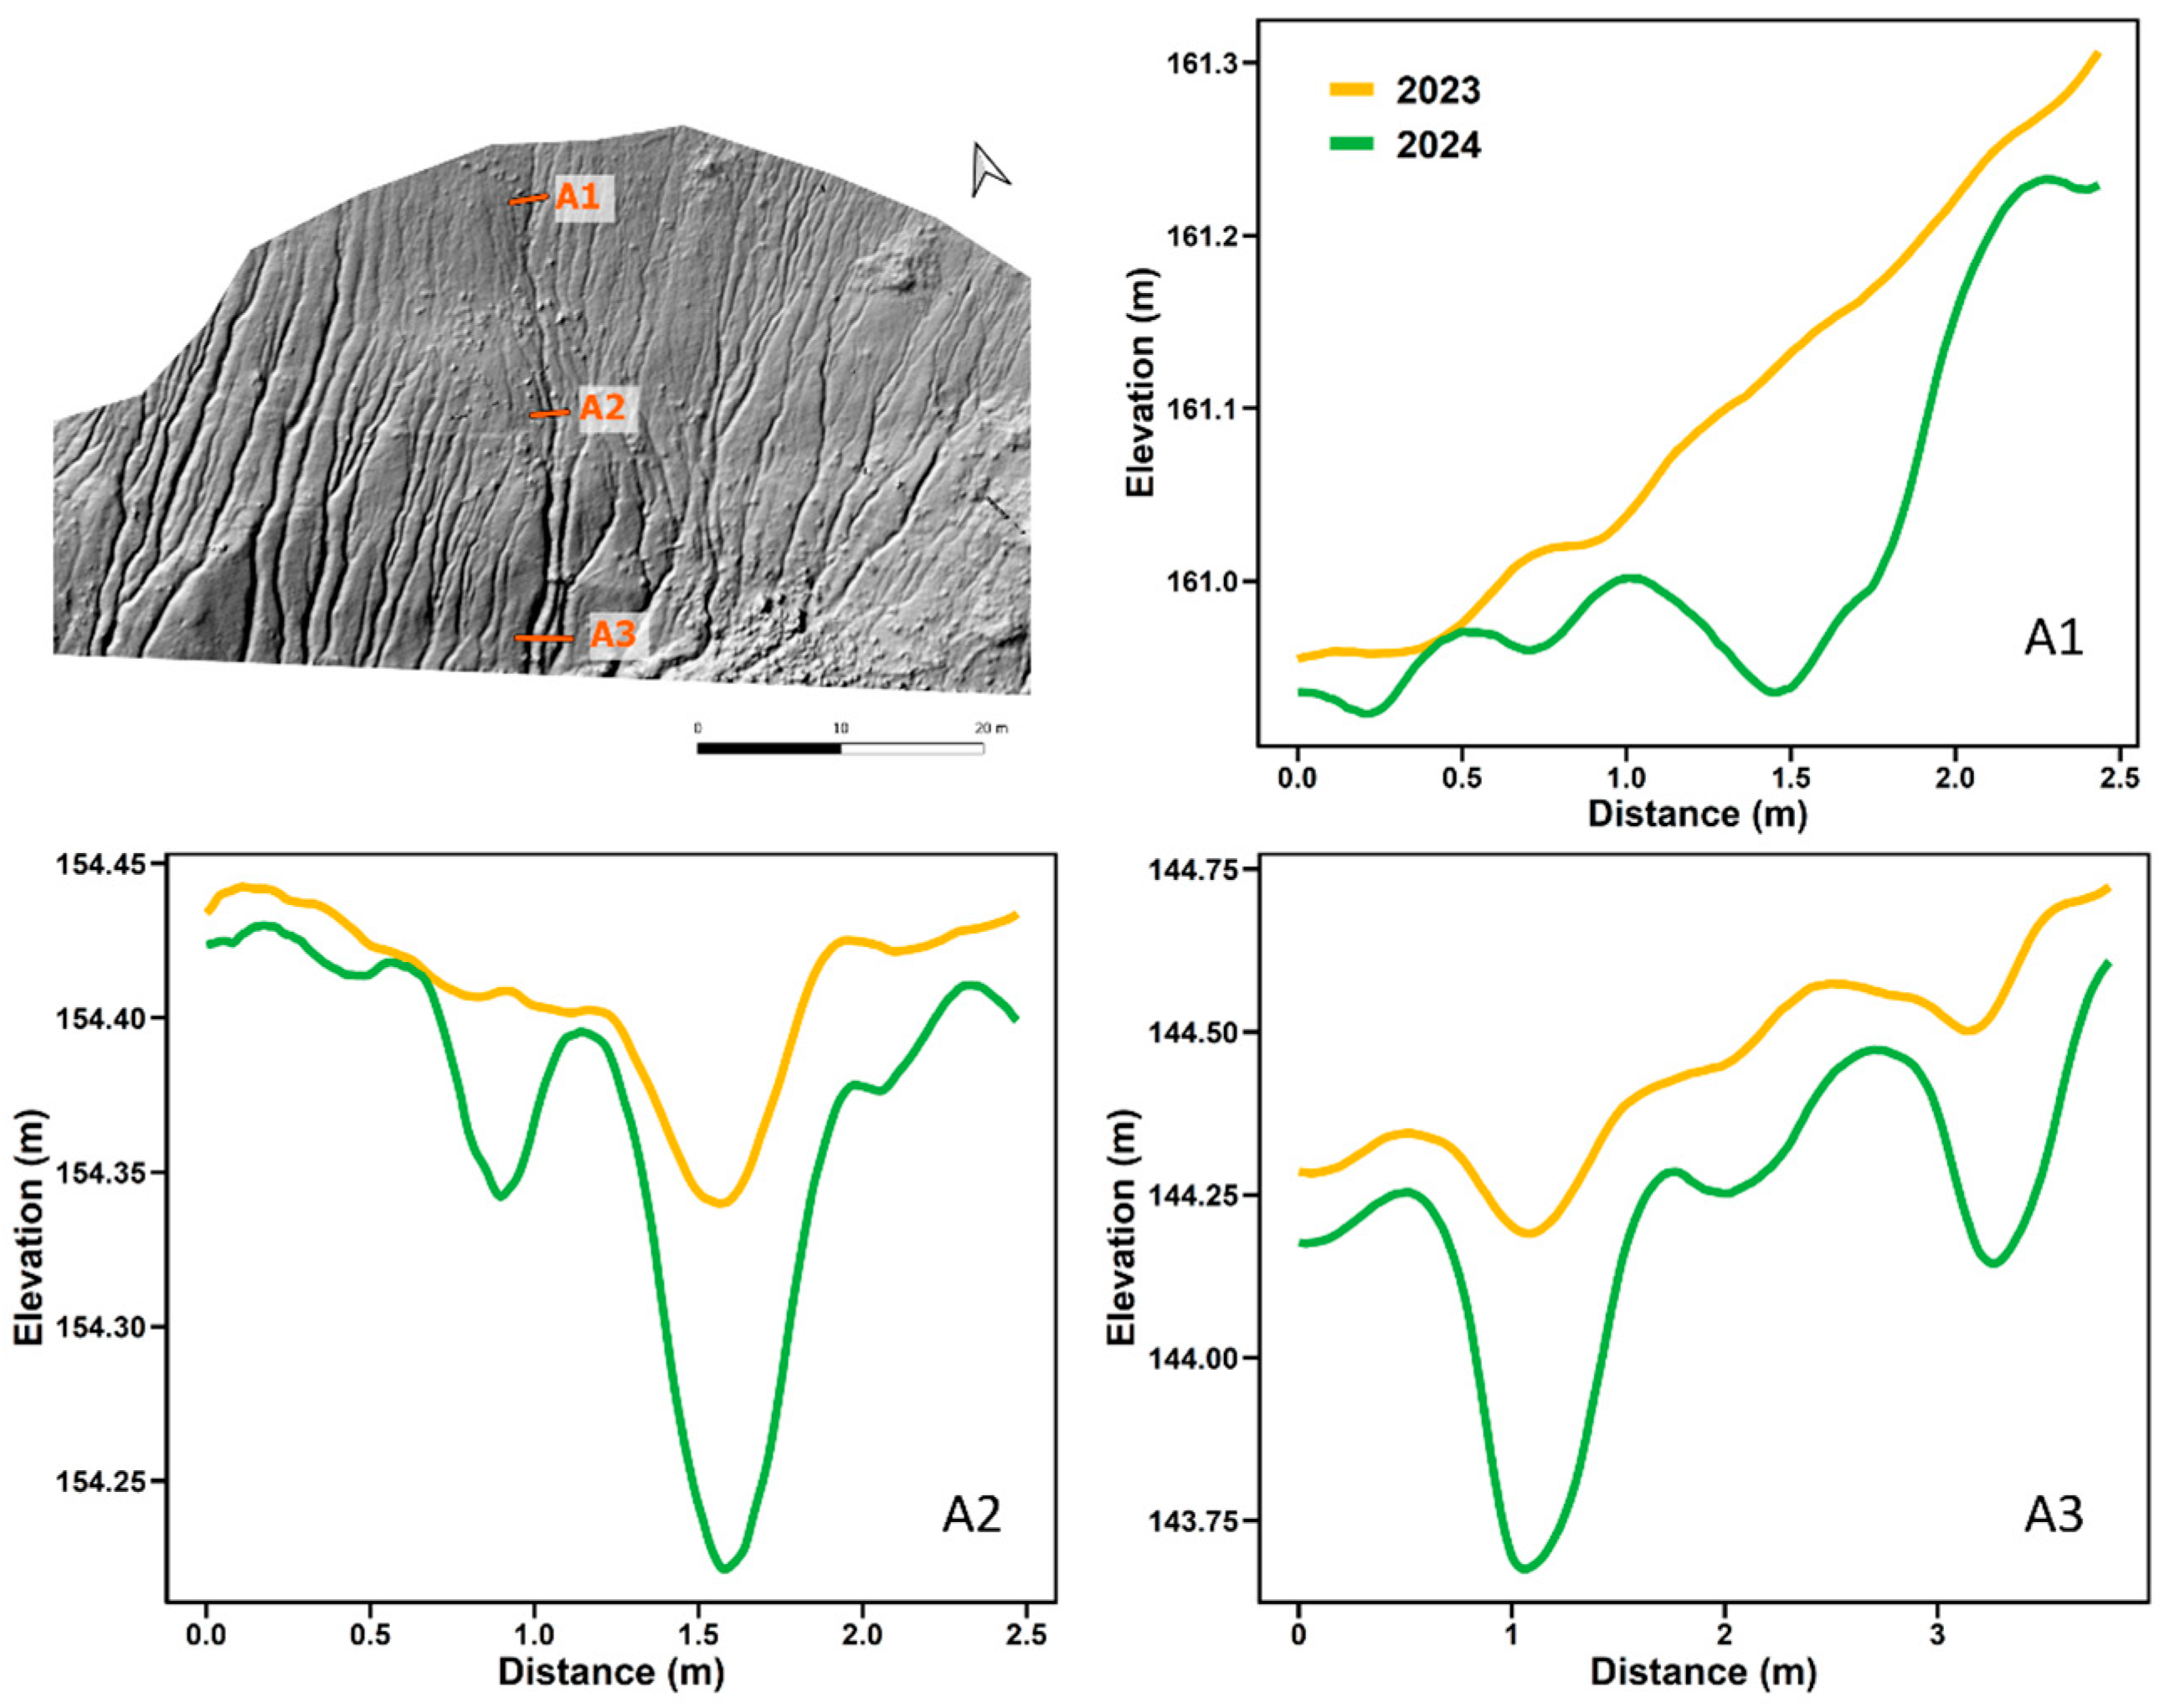
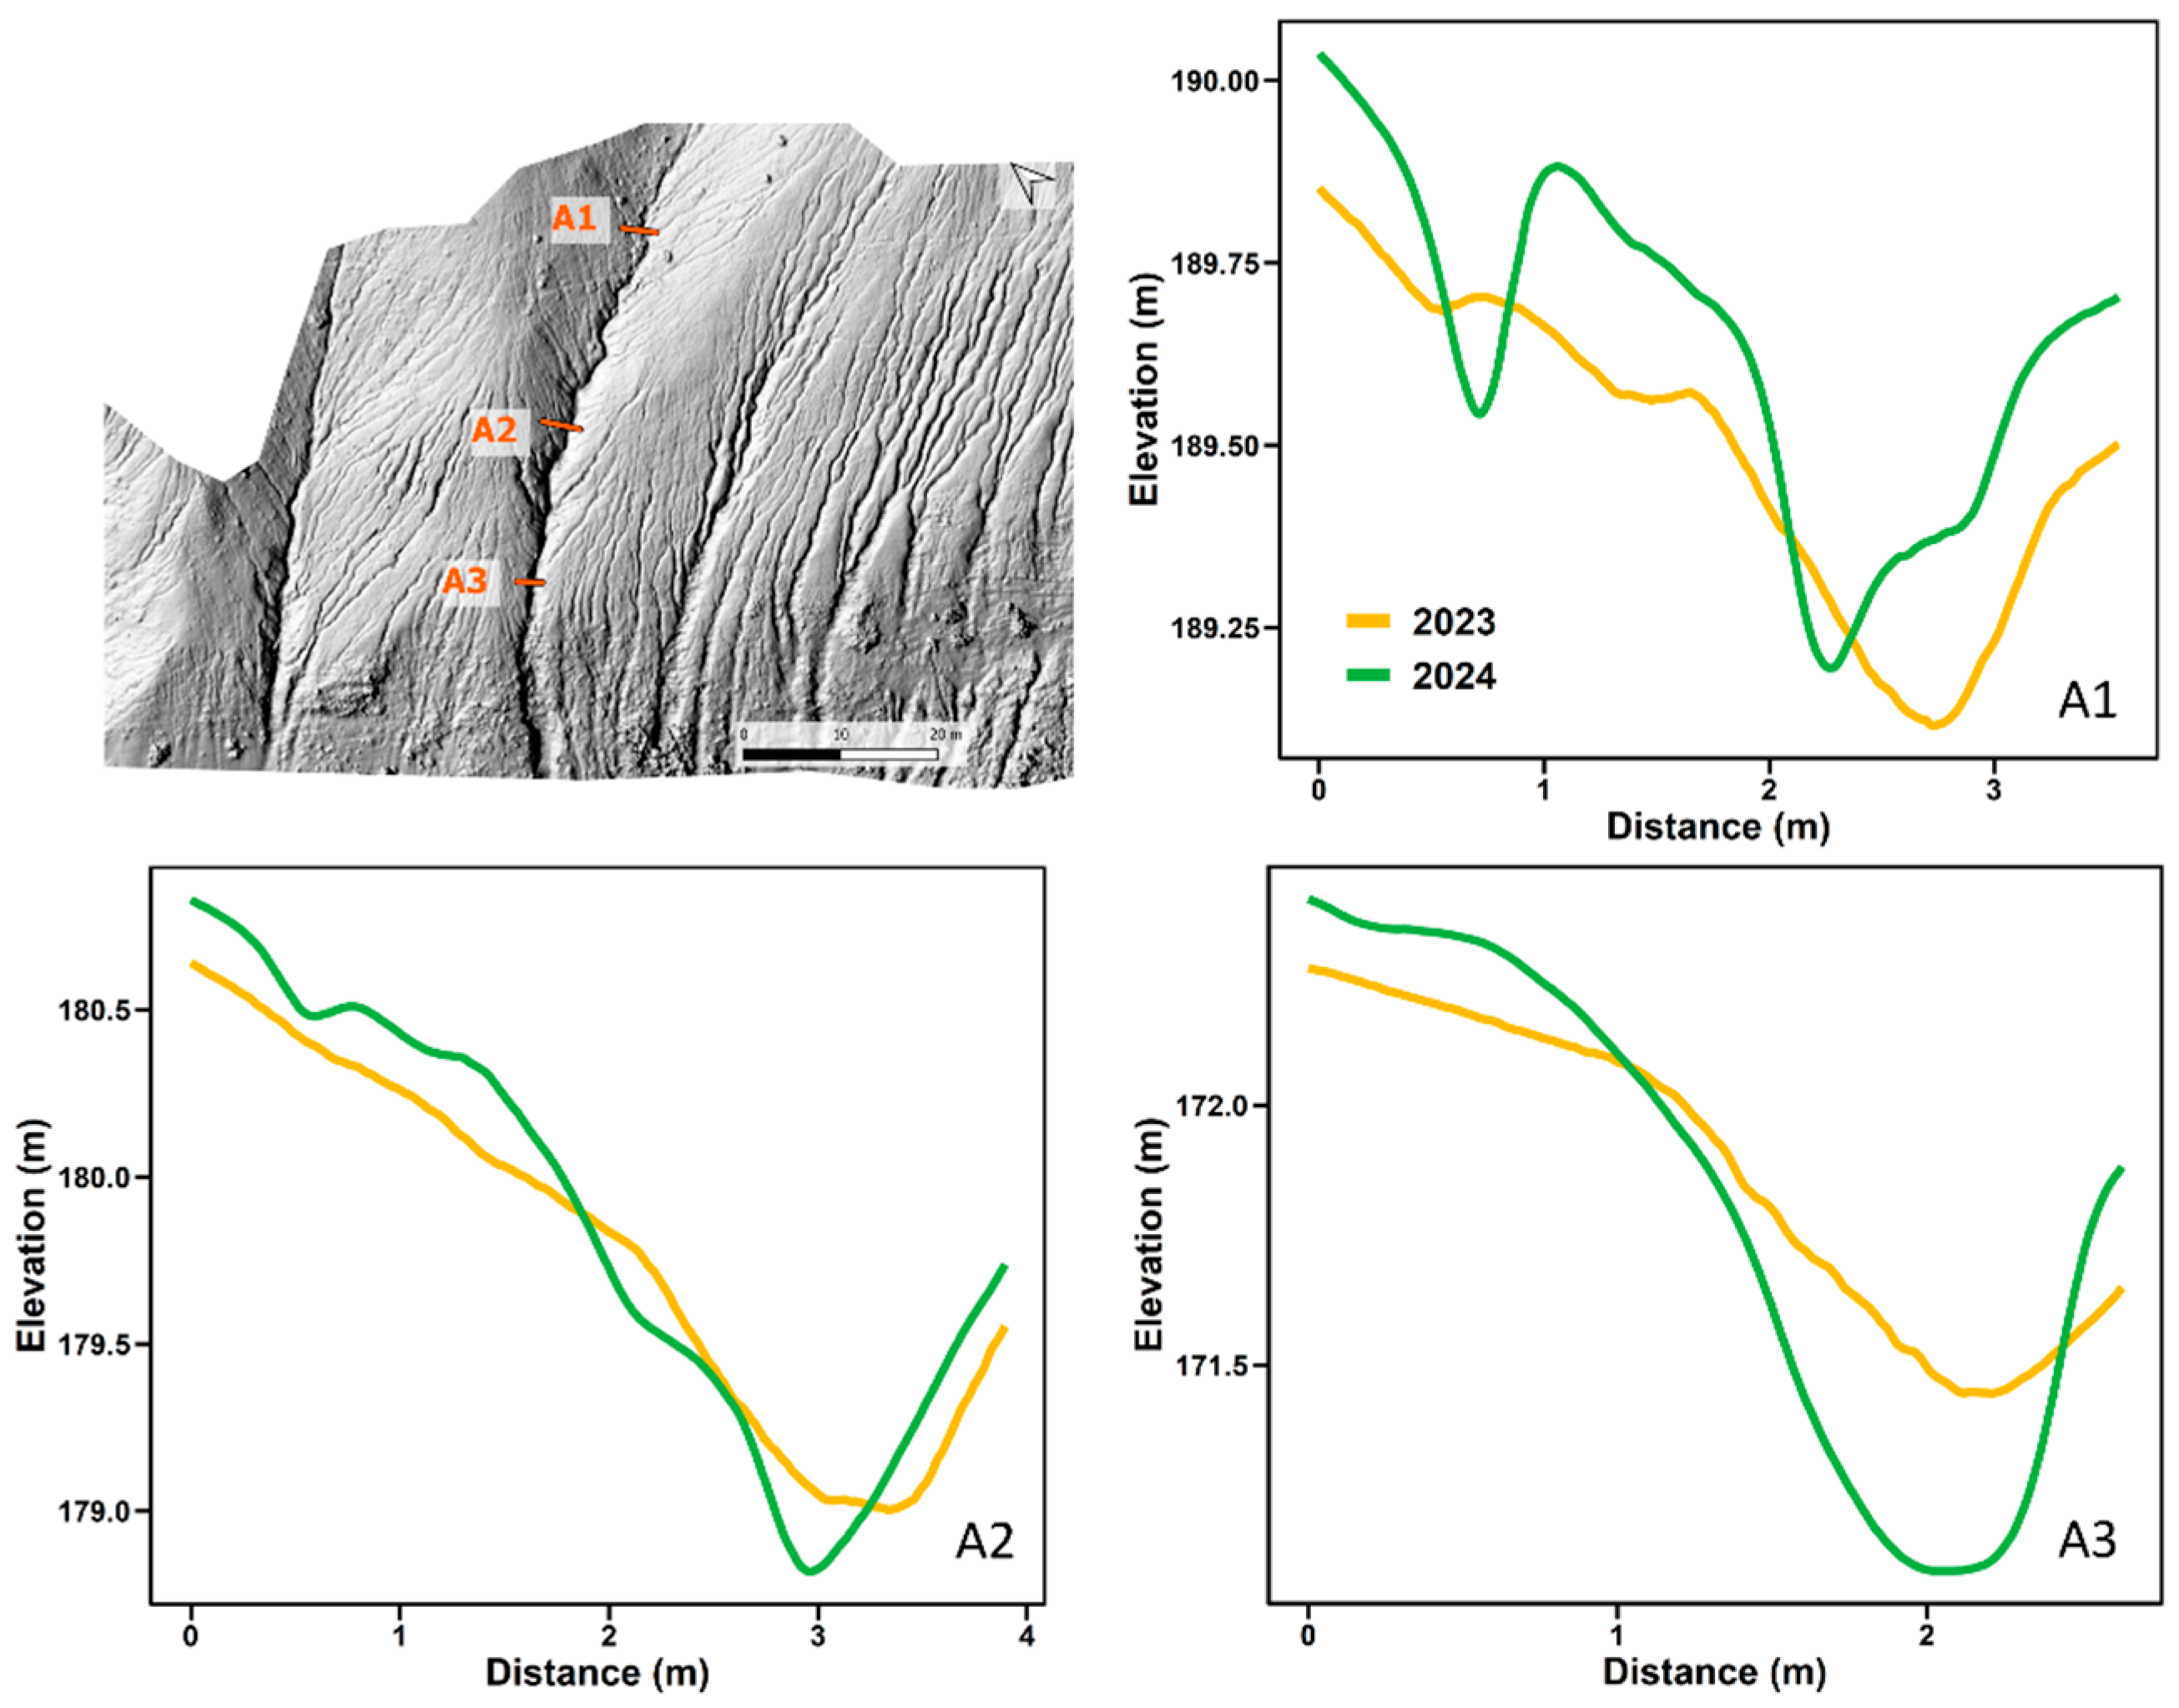
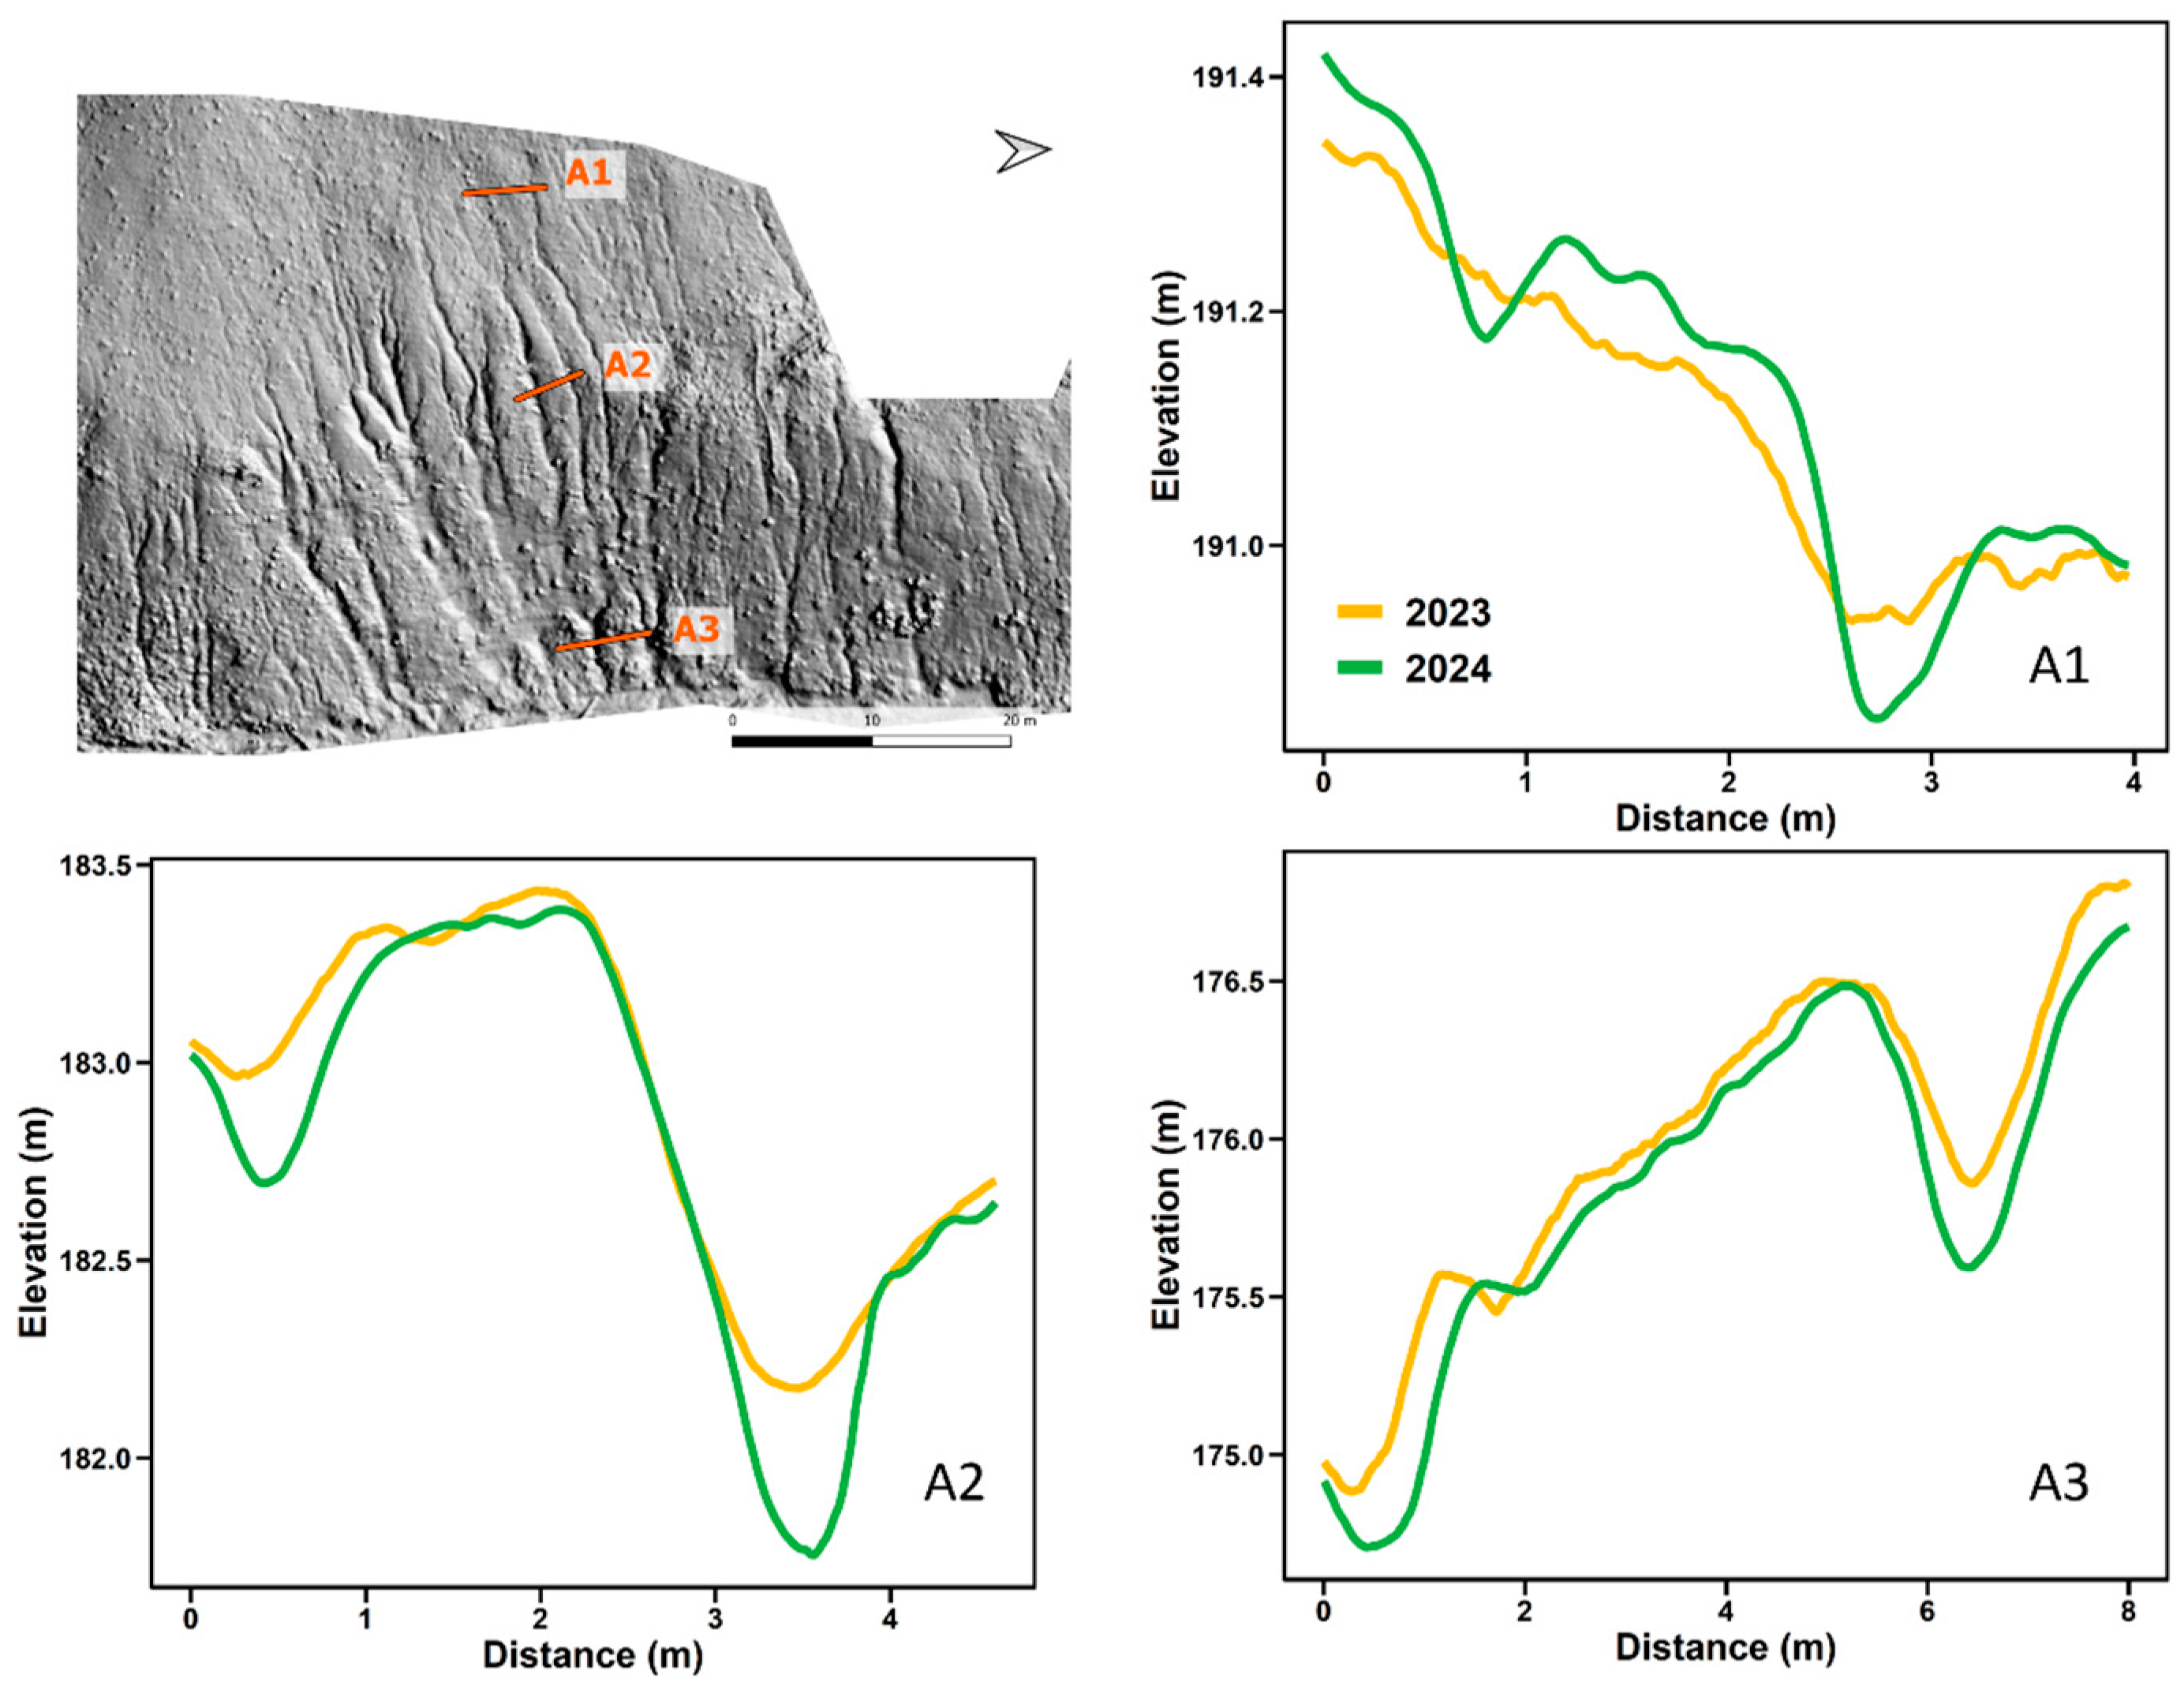
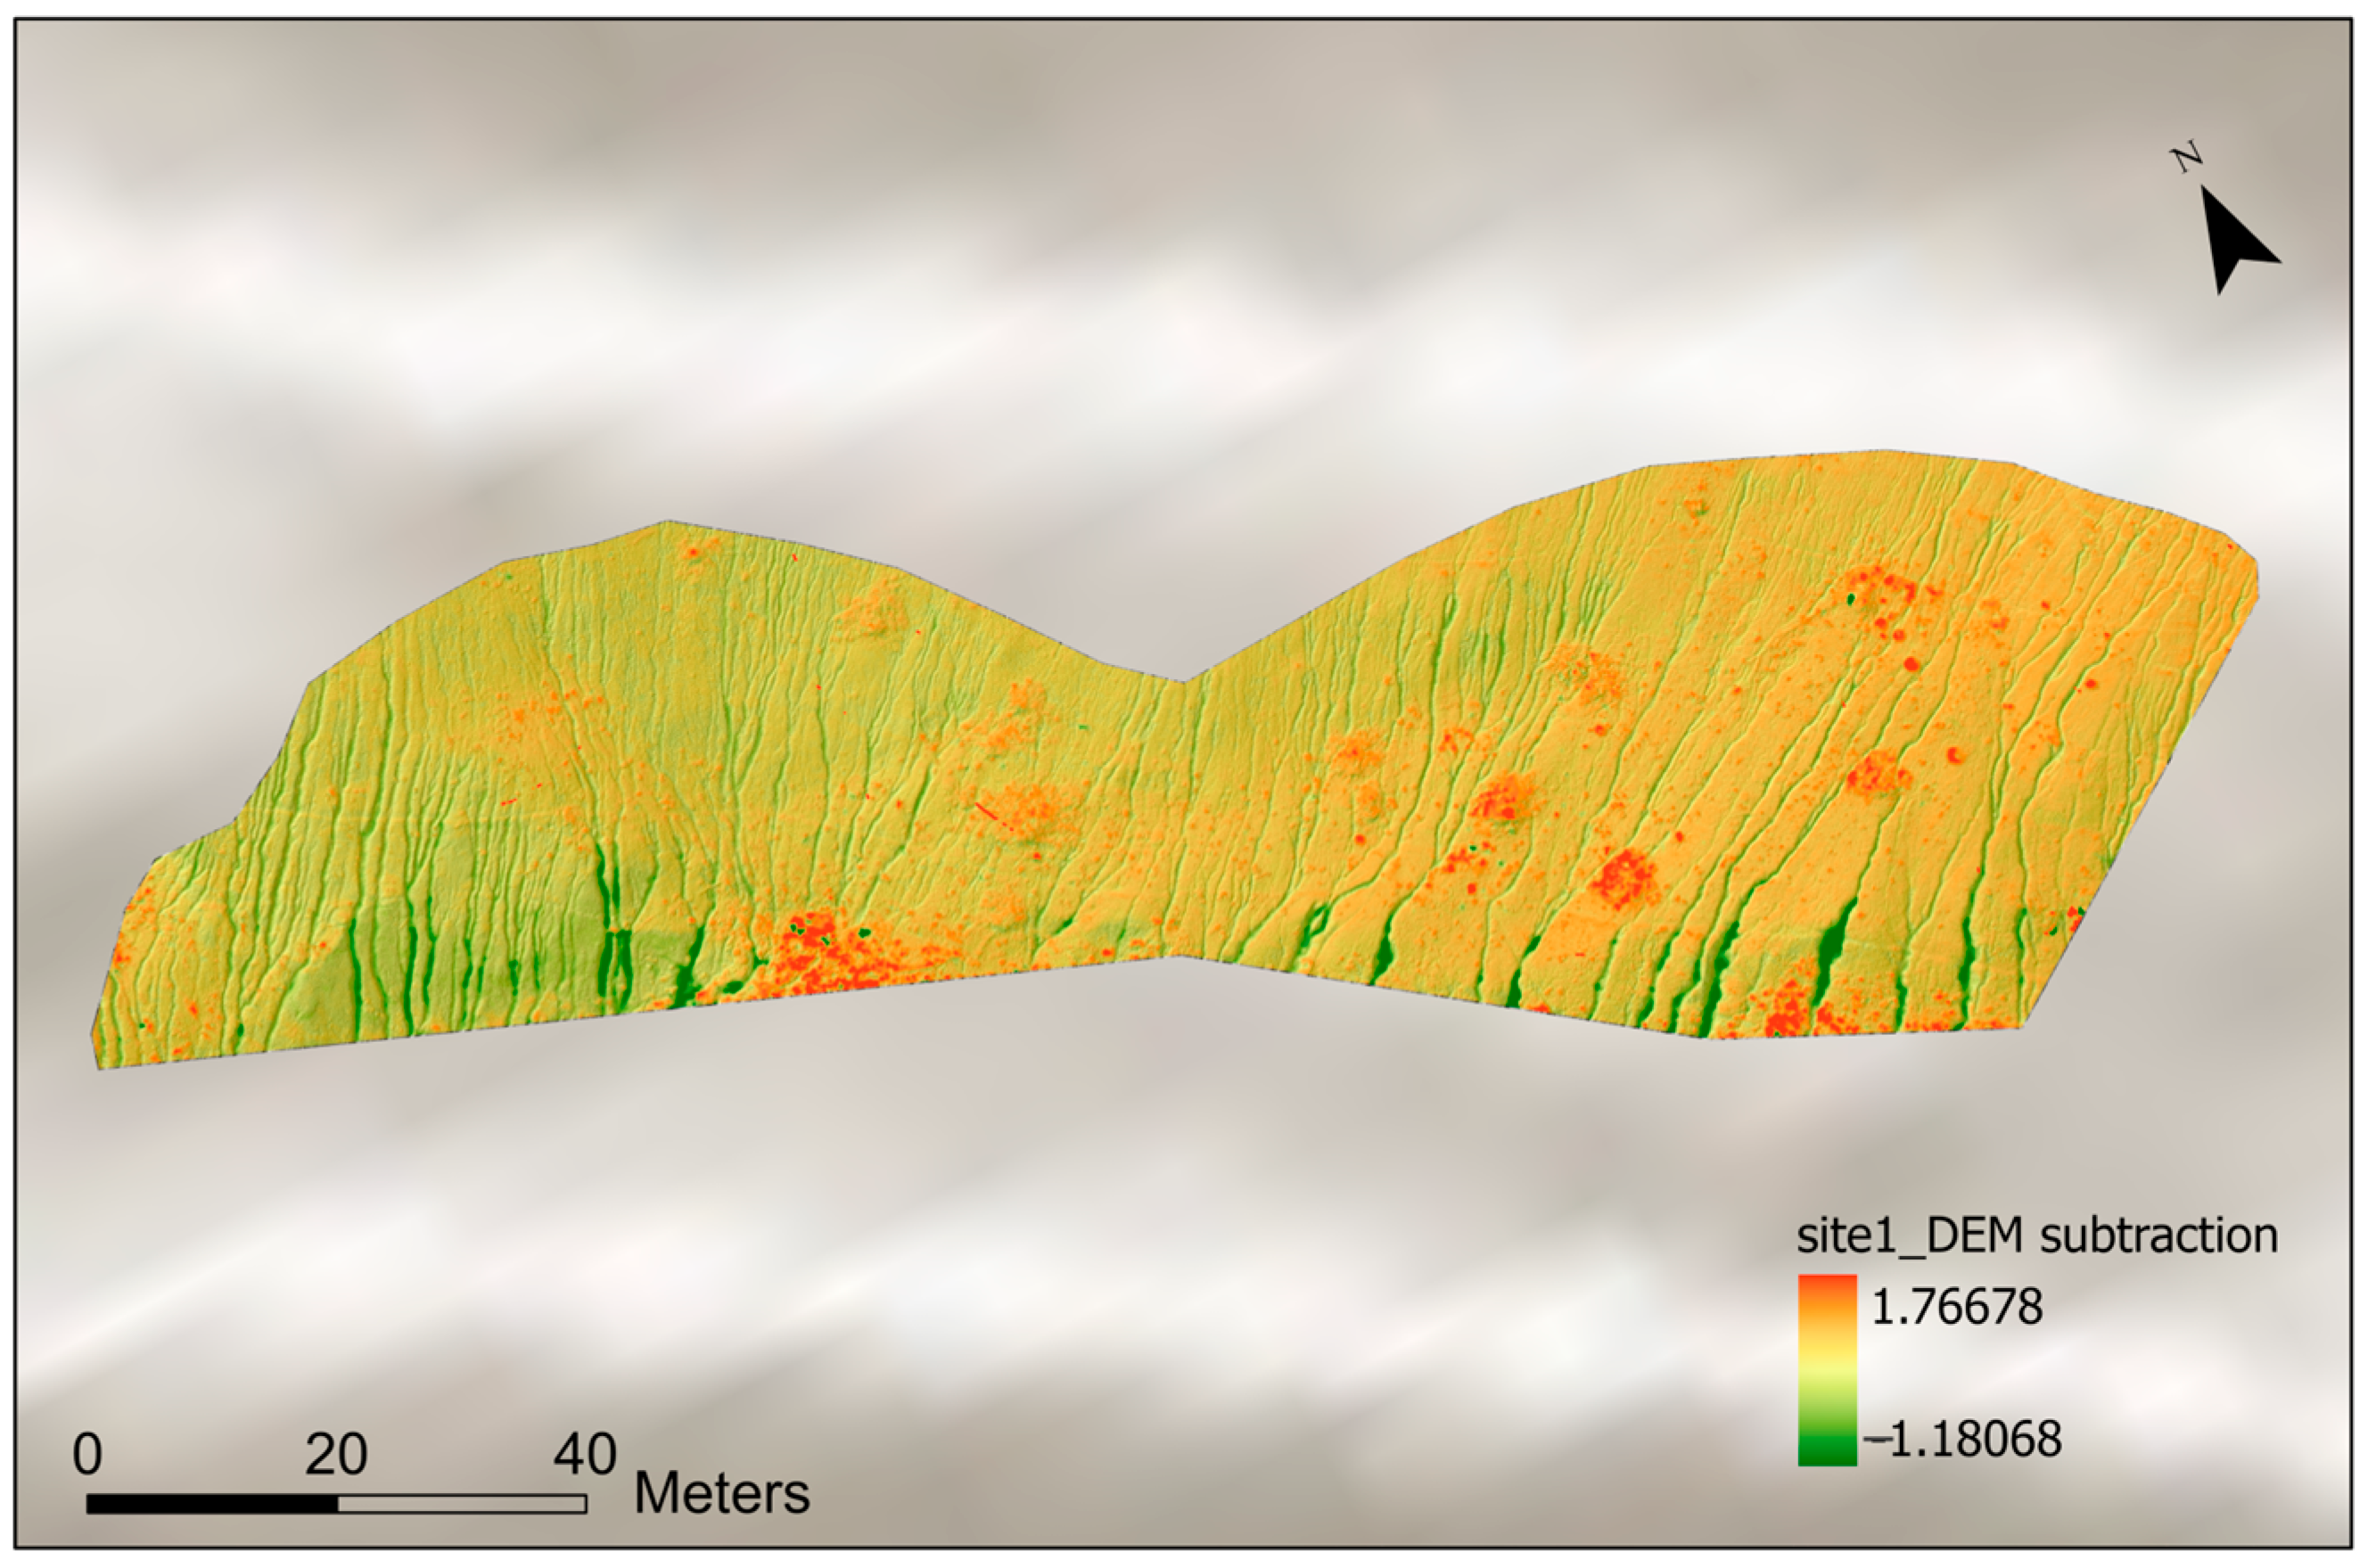
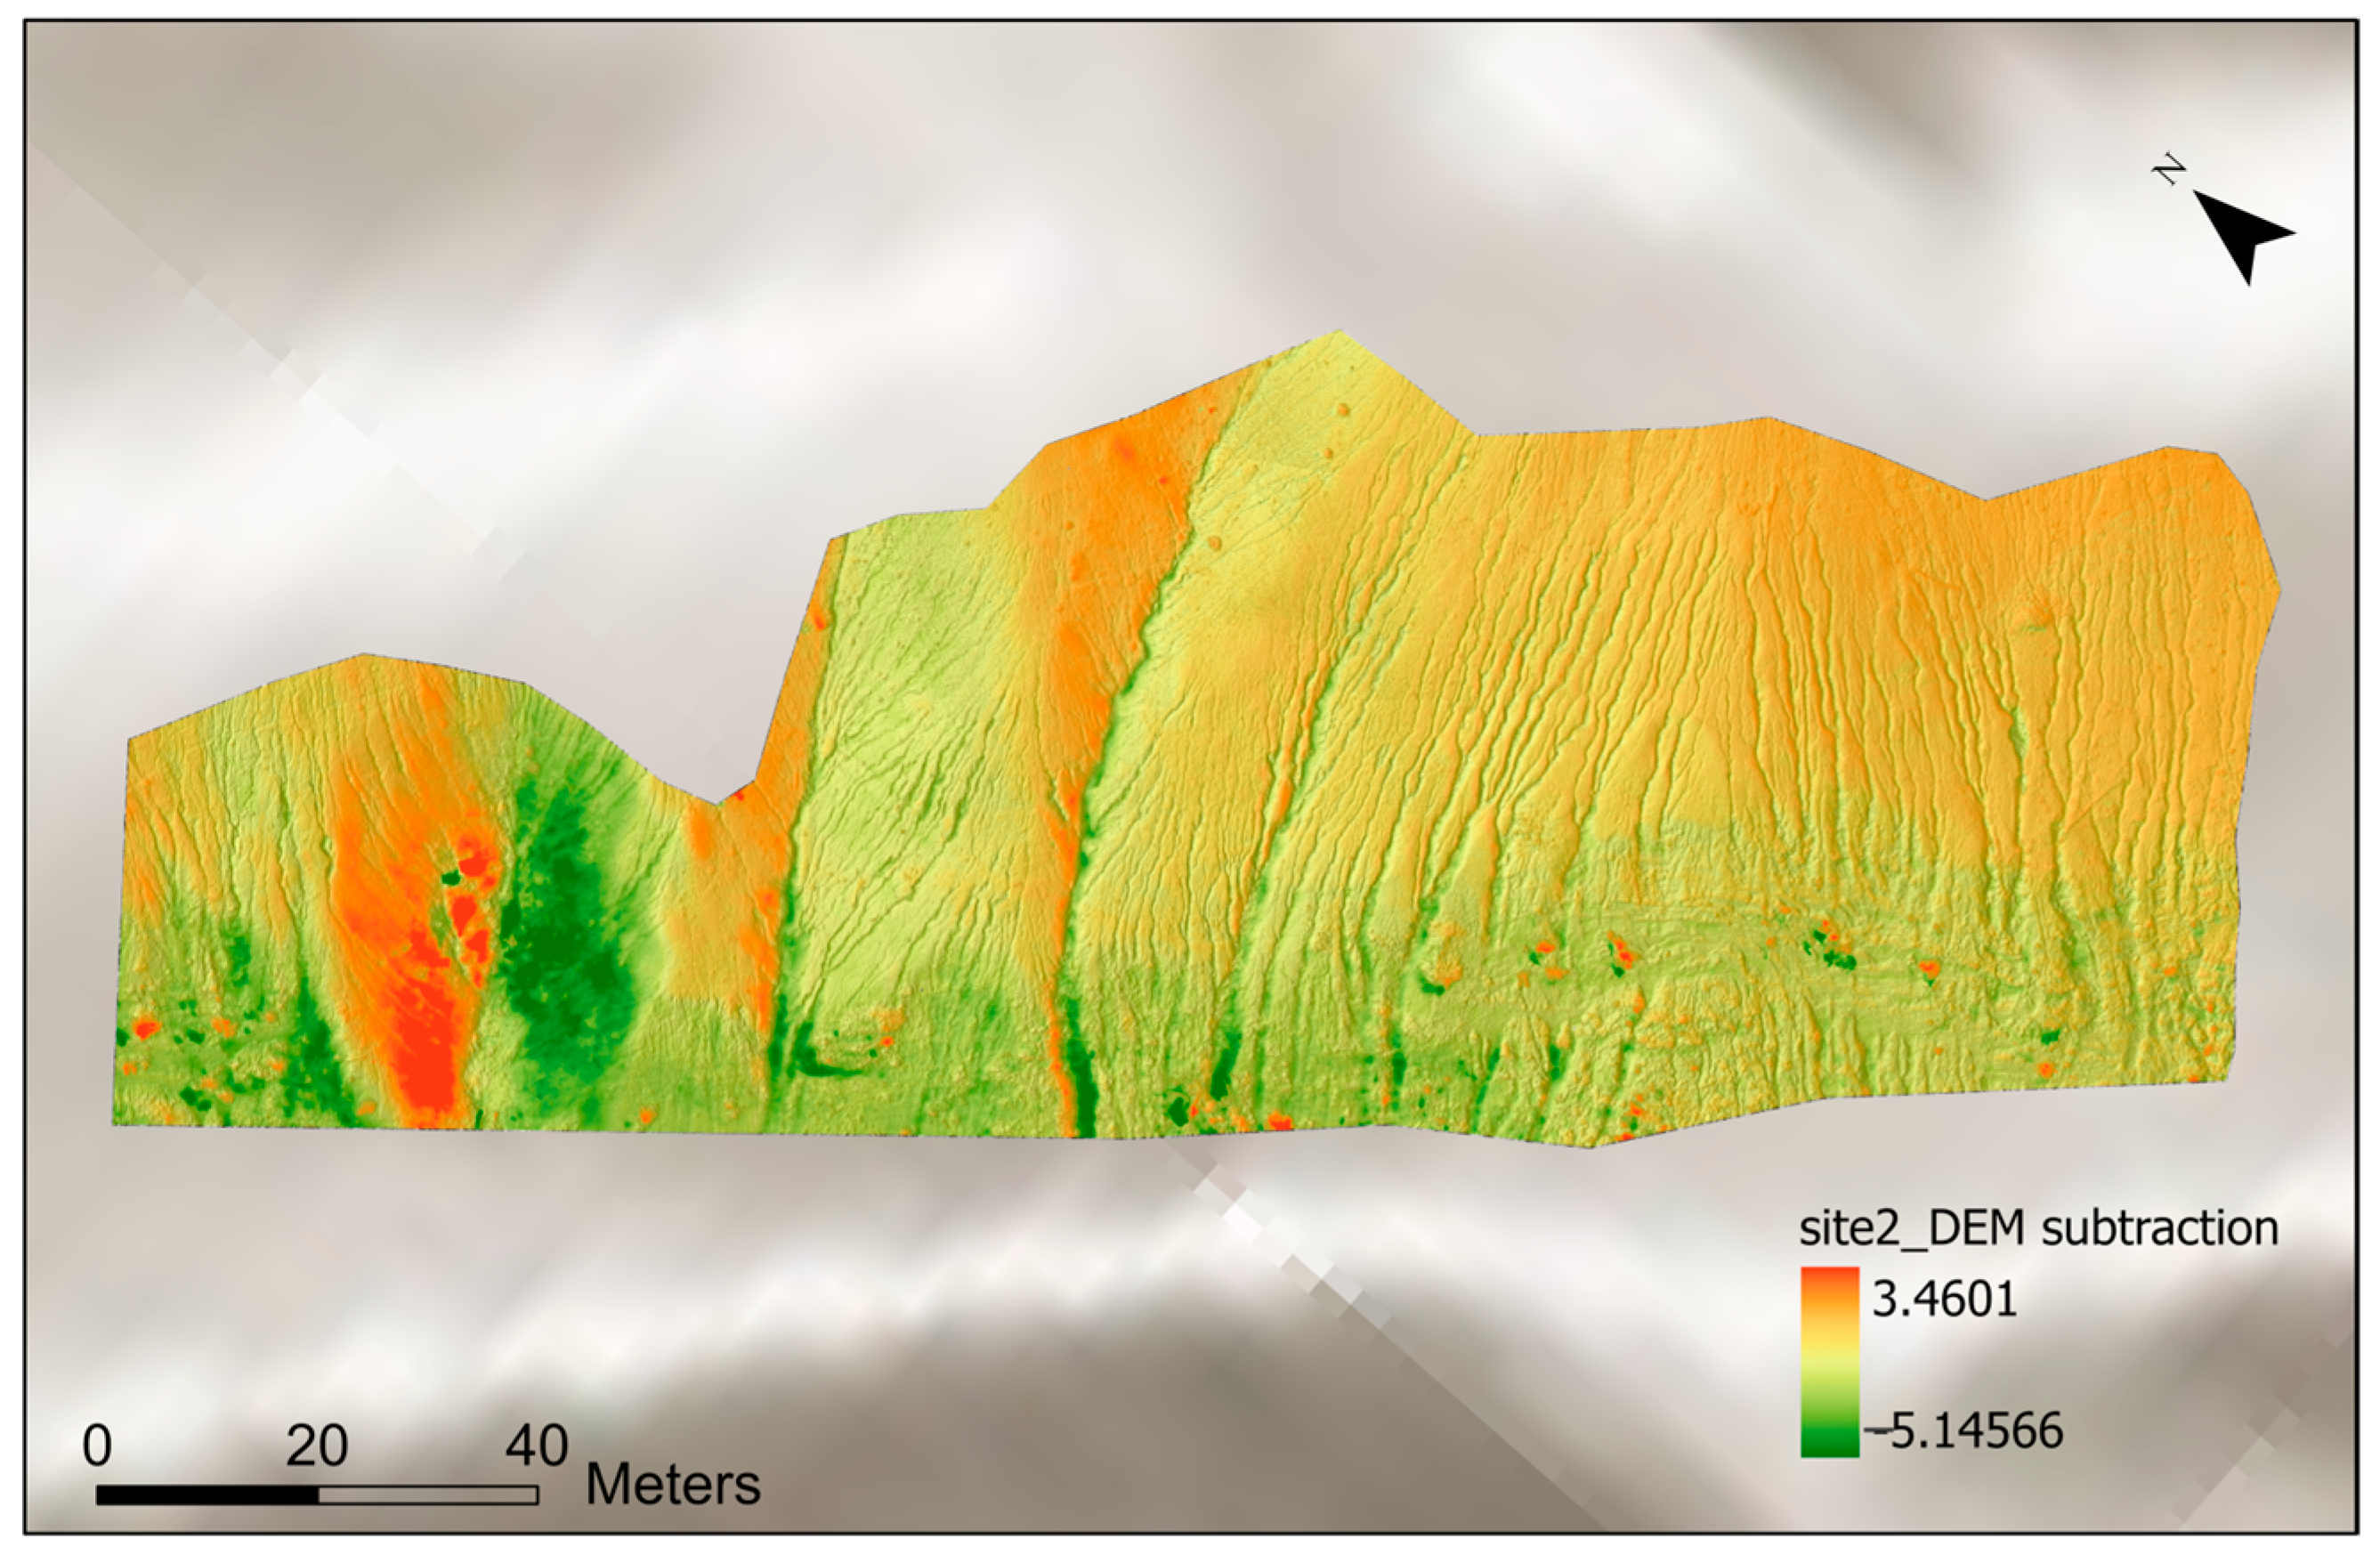
3.3. Rill Progression
4. Discussion
5. Conclusions
Author Contributions
Funding
Institutional Review Board Statement
Informed Consent Statement
Data Availability Statement
Acknowledgments
Conflicts of Interest
References
- Wang, J.; Howarth, J.D.; McClymont, E.L.; Densmore, A.L.; Fitzsimons, S.J.; Croissant, T.; Gröcke, D.R.; West, M.D.; Harvey, E.L.; Frith, N.V.; et al. Long-Term Patterns of Hillslope Erosion by Earthquake-Induced Landslides Shape Mountain Landscapes. Sci. Adv. 2020, 6, eaaz6446. [Google Scholar] [CrossRef] [PubMed]
- Lal, R. Soil Erosion Impact on Agronomic Productivity and Environment Quality. Crit. Rev. Plant Sci. 1998, 17, 319–464. [Google Scholar] [CrossRef]
- Milodowski, D.T.; Mudd, S.M.; Mitchard, E.T.A. Erosion Rates as a Potential Bottom-up Control of Forest Structural Characteristics in the Sierra Nevada Mountains. Ecology 2015, 96, 31–38. [Google Scholar] [CrossRef] [PubMed]
- Li, C.; Wang, M.; Liu, K.; Xie, J. Topographic Changes and Their Driving Factors after 2008 Wenchuan Earthquake. Geomorphology 2018, 311, 27–36. [Google Scholar] [CrossRef]
- Eltner, A.; Baumgart, P.; Maas, H.-G.; Faust, D. Multi-Temporal UAV Data for Automatic Measurement of Rill and Interrill Erosion on Loess Soil. Earth Surf. Process. Landf. 2015, 40, 741–755. [Google Scholar] [CrossRef]
- Kou, P.; Xu, Q.; Yunus, A.P.; Dong, X.; Pu, C.; Zhang, X.; Jin, Z. Micro-Topographic Assessment of Rill Morphology Highlights the Shortcomings of Current Protective Measures in Loess Landscapes. Sci. Total Environ. 2020, 737, 139721. [Google Scholar] [CrossRef]
- Ou, X.; Hu, Y.; Li, X.; Guo, S.; Liu, B. Advancements and Challenges in Rill Formation, Morphology, Measurement and Modeling. Catena 2021, 196, 104932. [Google Scholar] [CrossRef]
- Morgan, R.P.C.; Quinton, J.N.; Smith, R.E.; Govers, G.; Poesen, J.W.A.; Auerswald, K.; Chisci, G.; Torri, D.; Styczen, M.E. The European Soil Erosion Model (EUROSEM): A Dynamic Approach for Predicting Sediment Transport from Fields and Small Catchments. Earth Surf. Process. Landf. 1998, 23, 527–544. [Google Scholar] [CrossRef]
- Mahmoodabadi, M.; Ghadiri, H.; Rose, C.; Yu, B.; Rafahi, H.; Rouhipour, H. Evaluation of GUEST and WEPP with a New Approach for the Determination of Sediment Transport Capacity. J. Hydrol. 2014, 513, 413–421. [Google Scholar] [CrossRef]
- Kimaro, D.N.; Poesen, J.; Msanya, B.M.; Deckers, J.A. Magnitude of Soil Erosion on the Northern Slope of the Uluguru Mountains, Tanzania: Interrill and Rill Erosion. Catena 2008, 75, 38–44. [Google Scholar] [CrossRef]
- Vinci, A.; Brigante, R.; Todisco, F.; Mannocchi, F.; Radicioni, F. Measuring Rill Erosion by Laser Scanning. CATENA 2015, 124, 97–108. [Google Scholar] [CrossRef]
- Qin, C.; Wells, R.R.; Momm, H.G.; Xu, X.; Wilson, G.V.; Zheng, F. Photogrammetric Analysis Tools for Channel Widening Quantification under Laboratory Conditions. Soil Tillage Res. 2019, 191, 306–316. [Google Scholar] [CrossRef]
- Yunus, A.P.; Xinyu, C.; Catani, F.; Subramaniam, S.S.; Fan, X.; Jie, D.; Sajinkumar, K.S.; Gupta, A.; Avtar, R. Earthquake-induced soil landslides: Volume estimates and uncertainties with the existing scaling exponents. Sci. Rep. 2023, 13, 8151. [Google Scholar] [CrossRef] [PubMed]
- Di Stefano, C.; Nicosia, A.; Palmeri, V.; Pampalone, V.; Ferro, V. Rill Flow Velocity and Resistance Law: A Review. Earth-Sci. Rev. 2022, 231, 104092. [Google Scholar] [CrossRef]
- Avtar, R.; Watanabe, T. (Eds.) Unmanned Aerial Vehicle: Applications in Agriculture and Environment; Springer International Publishing: Cham, Switzerland, 2020. [Google Scholar]
- Elaksher, A.; Bhandari, S.; Carreon Limones, C.A.; Lauf, R. Potential of UAV Lidar Systems for Geospatial Mapping. In Proceedings of the Lidar Remote Sensing for Environmental Monitoring 2017, San Diego, CA, USA, 30 August 2017; Singh, U.N., Ed.; SPIE: Pune, India, 2017. [Google Scholar]
- Manfreda, S.; McCabe, M.F.; Miller, P.E.; Lucas, R.; Pajuelo Madrigal, V.; Mallinis, G.; Ben Dor, E.; Helman, D.; Estes, L.; Ciraolo, G.; et al. On the Use of Unmanned Aerial Systems for Environmental Monitoring. Remote Sens. 2018, 10, 641. [Google Scholar] [CrossRef]
- Hackney, C.; Clayton, A.I. Unmanned Aerial Vehicles (UAVs) and Their Application in Geomorphic Mapping; British Society for Geomorphology: London, UK, 2015. [Google Scholar]
- Pilarska, M.; Ostrowski, W.; Bakuła, K.; Górski, K.; Kurczyński, Z. The Potential of Light Laser Scanners Developed for Unmanned Aerial Vehicles—The Review and Accuracy. Int. Arch. Photogramm. Remote Sens. Spat. Inf. Sci. 2016, XLII-2-W2, 87–95. [Google Scholar] [CrossRef]
- Jeong, N.; Hwang, H.; Matson, E.T. Evaluation of Low-Cost LiDAR Sensor for Application in Indoor UAV Navigation. In Proceedings of the 2018 IEEE Sensors Applications Symposium (SAS), Seoul, Republic of Korea, 12–14 March 2018; pp. 1–5. [Google Scholar]
- Winsemius, H.; Mather, S.; Gayton, I.; Chazua, I. OpenDroneMap360, an Affordable DIY Open-Source Hardware and Software Workflow for 3D Point Clouds and Terrain Models. In Proceedings of the Copernicus Meetings, Online, 19–30 April 2021. [Google Scholar]
- Lu, Y.; Wang, Y.; Parikh, D.; Xin, Y.; Lu, G. Extending Single Beam Lidar To Full Resolution By Fusing with Single Image Depth Estimation. In Proceedings of the 2020 25th International Conference on Pattern Recognition (ICPR), Milan, Italy, 10–15 January 2021; pp. 6343–6350. [Google Scholar]
- Choi, S.-K.; Ramirez, R.A.; Kwon, T.-H. Acquisition of High-Resolution Topographic Information in Forest Environments Using Integrated UAV-LiDAR System: System Development and Field Demonstration. Heliyon 2023, 9, e20225. [Google Scholar] [CrossRef]
- Wallace, L.; Lucieer, A.; Watson, C.; Turner, D. Development of a UAV-LiDAR System with Application to Forest Inventory. Remote Sens. 2012, 4, 1519–1543. [Google Scholar] [CrossRef]
- Malinowski, R.; Heckrath, G.; Rybicki, M.; Eltner, A. Mapping Rill Soil Erosion in Agricultural Fields with UAVborne Remote Sensing Data. Earth Surf. Process. Landf. 2023, 48, 596–612. [Google Scholar] [CrossRef]
- Niculiță, M.; Mărgărint, M.C.; Tarolli, P. Using UAV and LiDAR Data for Gully Geomorphic Changes Monitoring. In Developments in Earth Surface Processes; Elsevier: Amsterdam, The Netherlands, 2020; Volume 23, pp. 271–315. ISBN 978-0-444-64177-9. [Google Scholar]
- Li, P.; Li, D.; Hu, J.; Fassnacht, F.E.; Latifi, H.; Yao, W.; Gao, J.; Chan, F.K.S.; Dang, T.; Tang, F. Improving the Application of UAV-LiDAR for Erosion Monitoring through Accounting for Uncertainty in DEM of Difference. Catena 2024, 234, 107534. [Google Scholar] [CrossRef]
- Wang, H.; Pang, G.; Yang, Q.; Long, Y.; Wang, L.; Wang, C.; Hu, S.; Wang, Z.; Yang, A. Effects of Slope Shape on Soil Erosion and Deposition Patterns Based on SfM-UAV Photogrammetry. Geoderma 2024, 451, 117076. [Google Scholar] [CrossRef]
- Borrelli, L.; Conforti, M.; Mercuri, M. LiDAR and UAV System Data to Analyse Recent Morphological Changes of a Small Drainage Basin. ISPRS Int. J. Geo-Inf. 2019, 8, 536. [Google Scholar] [CrossRef]
- Goodwin, N.R.; Armston, J.D.; Muir, J.; Stiller, I. Monitoring Gully Change: A Comparison of Airborne and Terrestrial Laser Scanning Using a Case Study from Aratula, Queensland. Geomorphology 2017, 282, 195–208. [Google Scholar] [CrossRef]
- Pelletier, J.D.; Orem, C.A. How Do Sediment Yields from Post-Wildfire Debris-Laden Flows Depend on Terrain Slope, Soil Burn Severity Class, and Drainage Basin Area? Insights from Airborne-LiDAR Change Detection. Earth Surf. Process. Landf. 2014, 39, 1822–1832. [Google Scholar] [CrossRef]
- Giménez, R.; Marzolff, I.; Campo, M.A.; Seeger, M.; Ries, J.B.; Casalí, J.; Álvarez-Mozos, J. Accuracy of High-Resolution Photogrammetric Measurements of Gullies with Contrasting Morphology. Earth Surf. Process. Landf. 2009, 34, 1915–1926. [Google Scholar] [CrossRef]
- Basher, L.; Betts, H.; Lynn, I.; Marden, M.; McNeill, S.; Page, M.; Rosser, B. A Preliminary Assessment of the Impact of Landslide, Earthflow, and Gully Erosion on Soil Carbon Stocks in New Zealand. Geomorphology 2018, 307, 93–106. [Google Scholar] [CrossRef]
- Cui, Y.; Bao, P.; Xu, C.; Ma, S.; Zheng, J.; Fu, G. Landslides Triggered by the 6 September 2018 Mw 6.6 Hokkaido, Japan: An Updated Inventory and Retrospective Hazard Assessment. Earth Sci Inf. 2021, 14, 247–258. [Google Scholar] [CrossRef]
- Kawamura, S.; Kawajiri, S.; Hirose, W.; Watanabe, T. Slope Failures/Landslides over a Wide Area in the 2018 Hokkaido Eastern Iburi Earthquake. Soils Found. 2019, 59, 2376–2395. [Google Scholar] [CrossRef]
- Wang, F.; Nam, K. Landslide Disasters Caused by the 2018 Eastern Iburi Earthquake in Hokkaido Japan and the Countermeasures to Completely Prevent the Similar Disasters in the Future. In Progress in Landslide Research and Technology, Volume 1 Issue 1, 2022; Sassa, K., Konagai, K., Tiwari, B., Arbanas, Ž., Sassa, S., Eds.; Progress in Landslide Research and Technology; Springer International Publishing: Cham, Switzerland, 2023; pp. 305–313. ISBN 978-3-031-16897-0. [Google Scholar]
- Fujiwara, S.; Nakano, T.; Morishita, Y.; Kobayashi, T.; Yarai, H.; Une, H.; Hayashi, K. Detection and Interpretation of Local Surface Deformation from the 2018 Hokkaido Eastern Iburi Earthquake Using ALOS-2 SAR Data. Earth Planets Space 2019, 71, 64. [Google Scholar] [CrossRef]
- Yamagishi, H.; Yamazaki, F. Landslides by the 2018 Hokkaido Iburi-Tobu Earthquake on September 6. Landslides 2018, 15, 2521–2524. [Google Scholar] [CrossRef]
- Zhao, B.; Wang, Y.; Feng, Q.; Guo, F.; Zhao, X.; Ji, F.; Liu, J.; Ming, W. Preliminary Analysis of Some Characteristics of Coseismic Landslides Induced by the Hokkaido Iburi-Tobu Earthquake (5 September 2018), Japan. Catena 2020, 189, 104502. [Google Scholar] [CrossRef]
- Diara, F.; Roggero, M. Quality Assessment of DJI Zenmuse L1 and P1 LiDAR and Photogrammetric Systems: Metric and Statistics Analysis with the Integration of Trimble SX10 Data. Geomatics 2022, 2, 254–281. [Google Scholar] [CrossRef]
- Štroner, M.; Urban, R.; Línková, L. A New Method for UAV Lidar Precision Testing Used for the Evaluation of an Affordable DJI ZENMUSE L1 Scanner. Remote Sens. 2021, 13, 4811. [Google Scholar] [CrossRef]
- Merwade, V. Watershed and Stream Network Delineation Using ArcHydro Tools. Sch. Civ. Eng. Purdue Univ. 2012, 1–7. Available online: https://d1wqtxts1xzle7.cloudfront.net/41084682/terrain_processing-libre.pdf?1452737007=&response-content-disposition=inline%3B+filename%3DTerrain_Processing.pdf&Expires=1746083758&Signature=RS11xVgQmE1IbDk8FSEcwB1SBhavDMamjaXokccRI0YIabO92rPnvFEQZsJaCl1TW9xFuvA1KuoJsF5ueTO8LNNG1y3~cRVB34iiVcg4dbxi92TjLYQgMdsk5AZhGqHTQFeFUUT628Sg8ac3yO7sAUytP~z1R3ZLE96A5vXI~-7RH3Nj~rPKsJl~mkzWwTBNBLQpCZgK3pj6cE2sn6kAFWCllj4sITfC8PMnYb~fm4spRstGreWH4nZ-idcCD4HOC4DQEiLR~dK0S70P~3OZromnKXpmdMbvefgshSKVHsfI-f-d10BxWzCkn9yL6lPFFilxB6puJmh-4EMehUtNqw__&Key-Pair-Id=APKAJLOHF5GGSLRBV4ZA (accessed on 10 April 2025).
- Azizian, A.; Shokoohi, A. DEM Resolution and Stream Delineation Threshold Effects on the Results of Geomorphologic-Based Rainfall Runoff Models. Turk. J. Eng. Environ. Sci. 2014, 1–15. Available online: https://d1wqtxts1xzle7.cloudfront.net/36680640/muh-38-1-5-1401-13-libre.pdf?1424288807=&response-content-disposition=inline%3B+filename%3DDEM_resolution_and_stream_delineation_th.pdf&Expires=1746083899&Signature=Qv8l2A7rWbJryv0NU2jXjD41mwqREZ~XP-tF-goDo4N7UHTR3XdZCqbqMvFWZ56kZdx7K2sHT-lt7P6O0RiKjvZsdonGvBx3uCPh3e5kQpQLUSO6y7nI1Pm3mW6mtwBN1~wet3EfIvSHMZBfKfuMb4HB0TZTKWVnWlaMVB7bGko5zWydCL4ql9P0arIU2VS~~cYGUnTwVMXGWqGNKb38KjTPkfixtzvJ6x6C9T6wKtilvKInikBQTQWTfoBvA6UcXZfeW~mCcFM0-ou1B6S90m0BQL9wodkVqPiKSszelDtaVNaNxr0gl6J1PS62LszuNkDMHWWXbg75Tdia9jTMJg__&Key-Pair-Id=APKAJLOHF5GGSLRBV4ZA (accessed on 10 April 2025). [CrossRef]
- Bazzoffi, P. Measurement of Rill Erosion through a New UAV-GIS Methodology. Ital. J. Agron. 2015, 10, 1–18. [Google Scholar] [CrossRef]
- Kou, P.; Xu, Q.; Yunus, A.P.; Ju, Y.; Guo, C.; Wang, C.; Zhao, K. Multi-Temporal UAV Data for Assessing Rapid Rill Erosion in Typical Gully Heads on the Largest Tableland of the Loess Plateau, China. Bull. Eng. Geol. Environ. 2020, 79, 1861–1877. [Google Scholar] [CrossRef]
- Brecheisen, Z.S.; Richter, D.d.B. Gully-Erosion Estimation and Terrain Reconstruction Using Analyses of Microtopographic Roughness and LiDAR. Catena 2021, 202, 105264. [Google Scholar] [CrossRef]
- Perroy, R.L.; Bookhagen, B.; Asner, G.P.; Chadwick, O.A. Comparison of Gully Erosion Estimates Using Airborne and Ground-Based LiDAR on Santa Cruz Island, California. Geomorphology 2010, 118, 288–300. [Google Scholar] [CrossRef]
- Gomez, J.A.; Kamran-Pishhesari, A.; Sattarvand, J. Automated Rill Erosion Detection in Tailing Dams Using UAV Imagery and Machine Learning. Arab. J. Sci. Eng. 2024, 1–16. [Google Scholar] [CrossRef]
- Dai, W.; Na, J.; Huang, N.; Hu, G.; Yang, X.; Tang, G.; Xiong, L.; Li, F. Integrated Edge Detection and Terrain Analysis for Agricultural Terrace Delineation from Remote Sensing Images. Int. J. Geogr. Inf. Sci. 2020, 34, 484–503. [Google Scholar] [CrossRef]
- Sivanandam, P.; Turner, D.; Lucieer, A.; Segaran, D.R.C.; Virtue, J.; Melville, B.; McCallum, K. Drone Data Collection Protocol Using DJI Matrice 300 RTK: Imagery and Lidar. 2022. Available online: https://www.tern.org.au/wp-content/uploads/20230829_drone_data_collection.pdf (accessed on 8 May 2023).
- Brodu, N.; Lague, D. 3D Terrestrial Lidar Data Classification of Complex Natural Scenes Using a Multi-Scale Dimensionality Criterion: Applications in Geomorphology. ISPRS J. Photogramm. Remote Sens. 2012, 68, 121–134. [Google Scholar] [CrossRef]

| Parameter | Value |
|---|---|
| LIDAR sensor | Zenmuse L1 |
| Altitude above terrain | 30 m |
| Flying speed | 3 m/s |
| LiDAR data overlap | 40% |
| Optical image overlap | 70% |
| Year | Detection Result | Count | Metrics (%) |
|---|---|---|---|
| 2023 | Detected rills (TPs) | 104 | Precision = 92.86 |
| Missed rills (FNs) | 6 | Recall = 94.55 | |
| False positives (FPs) | 8 | F1-score = 93.70 | |
| Total actual rills | 110 | Overall detection accuracy = 88.14 | |
| 2024 | Detected rills (TPs) | 107 | Precision = 98.17 |
| Missed rills (FNs) | 11 | Recall = 90.68 | |
| False positives (FPs) | 2 | F1-score = 94.28 | |
| Total actual rills | 118 | Overall detection accuracy = 89.17 |
| Study Site | Rill Density (m/m2) | |
|---|---|---|
| 2023 | 2024 | |
| 1 | 0.50 | 0.52 |
| 2 | 0.54 | 0.53 |
| 3 | 0.53 | 0.52 |
Disclaimer/Publisher’s Note: The statements, opinions and data contained in all publications are solely those of the individual author(s) and contributor(s) and not of MDPI and/or the editor(s). MDPI and/or the editor(s) disclaim responsibility for any injury to people or property resulting from any ideas, methods, instructions or products referred to in the content. |
© 2025 by the authors. Licensee MDPI, Basel, Switzerland. This article is an open access article distributed under the terms and conditions of the Creative Commons Attribution (CC BY) license (https://creativecommons.org/licenses/by/4.0/).
Share and Cite
Chen, X.; Louw, A.S.; Yunus, A.P.; Alsulamy, S.; Umarhadi, D.A.; Bhuiyan, M.A.H.; Avtar, R. Rill Erosion and Drainage Development in Post-Landslide Settings Using UAV–LiDAR Data. Soil Syst. 2025, 9, 42. https://doi.org/10.3390/soilsystems9020042
Chen X, Louw AS, Yunus AP, Alsulamy S, Umarhadi DA, Bhuiyan MAH, Avtar R. Rill Erosion and Drainage Development in Post-Landslide Settings Using UAV–LiDAR Data. Soil Systems. 2025; 9(2):42. https://doi.org/10.3390/soilsystems9020042
Chicago/Turabian StyleChen, Xinyu, Albertus Stephanus Louw, Ali P. Yunus, Saleh Alsulamy, Deha Agus Umarhadi, Md. Alamgir Hossen Bhuiyan, and Ram Avtar. 2025. "Rill Erosion and Drainage Development in Post-Landslide Settings Using UAV–LiDAR Data" Soil Systems 9, no. 2: 42. https://doi.org/10.3390/soilsystems9020042
APA StyleChen, X., Louw, A. S., Yunus, A. P., Alsulamy, S., Umarhadi, D. A., Bhuiyan, M. A. H., & Avtar, R. (2025). Rill Erosion and Drainage Development in Post-Landslide Settings Using UAV–LiDAR Data. Soil Systems, 9(2), 42. https://doi.org/10.3390/soilsystems9020042