Abstract
Our Sun is the closest X-ray astrophysical source to Earth. As such, it makes for a strong case study to better understand astrophysical processes. Solar flares are particularly interesting as they are linked to coronal mass ejections as well as magnetic field reconnection sites in the solar atmosphere. Flares can therefore provide insightful information on the physical processes at play on their production sites but also on the emission and acceleration of energetic charged particles towards our planet, making it an excellent forecasting tool for space weather. While solar flares are critical to understanding magnetic reconnection and particle acceleration, their hard X-ray polarization—key to distinguishing between competing theoretical models—remains poorly constrained by existing observations. To address this, we present the CUbesat Solar Polarimeter (CUSP), a mission under development to perform solar flare polarimetry in the 25–100 keV energy range. CUSP consists of a 6U-XL platform hosting a dual-phase Compton polarimeter. The polarimeter is made of a central assembly of four 4 × 4 arrays of plastic scintillators, each coupled to multi-anode photomultiplier tubes, surrounded by four strips of eight elongated GAGG scintillator bars coupled to avalanche photodiodes. Both types of sensors from Hamamatsu are, respectively, read out by the MAROC-3A and SKIROC-2A ASICs from Weeroc. In this manuscript, we present the preliminary spectral performances of single plastic and GAGG channels measured in a laboratory using development boards of the ASICs foreseen for the flight model.
1. Solar Flare Polarimetry with CUSP
1.1. The Physics of Solar Flares and the Need for Polarimetry
Solar flares are among the most energetic phenomena in our solar system, arising from the sudden release of magnetic energy stored in the Sun’s corona. These explosive events, often associated with coronal mass ejections (CMEs), accelerate charged particles to relativistic speeds, heat plasma to tens of millions of Kelvin, and emit radiation across the electromagnetic spectrum—from radio waves to gamma rays. The impulsive phase of solar flares, in particular, is dominated by hard X-ray (HXR) emissions (typically above 20 keV), produced primarily by non-thermal bremsstrahlung from accelerated electrons interacting with the dense chromosphere [1,2].
Despite decades of multi-wavelength observations, key questions about the geometry of the magnetic reconnection region, the particle acceleration process, and the pitch-angle distribution and beaming of energetic electrons remain unanswered.
Spectroscopic and imaging observations alone often fail to break degeneracies between competing theoretical models. X-ray polarimetry provides a powerful, complementary diagnostic by probing the anisotropy of electron beams and the magnetic field geometry in the flare region [3,4]. The degree and orientation of linear polarization in HXRs are sensitive to the directionality of accelerated electrons (beamed vs. isotropic distributions), the local magnetic field configuration (e.g., loop geometry, reconnection site orientation), and the viewing angle relative to the flare site.
Theoretical models predict that non-thermal bremsstrahlung from beamed electrons can reach polarization fractions of tens of percent, while thermal bremsstrahlung (from hot, isotropic plasma) is only weakly polarized (a few percent at most) [5,6]. Thus, polarimetric measurements in the 25–100 keV band can (i) distinguish thermal and non-thermal emission components in flares, (ii) constrain the geometry of the acceleration region (e.g., loop-top vs. footpoint dominance), and (iii) test predictions of electron beaming and pitch-angle distributions.
To date, solar flare HXR polarimetry remains an underexplored frontier. Past measurements (e.g., from OSO-8, RHESSI, INTEGRAL, or CORONAS-F) have been statistically limited, often yielding only upper limits or marginal detections [7,8,9,10,11,12,13], even though some of these missions used dedicated polarimeters. Dedicated instruments with high sensitivity and time resolution are required to capture the rapid, impulsive evolution of flares. The CUbesat Solar Polarimeter (CUSP) mission is designed to address this gap by providing the first high-significance, time-resolved measurements of solar flare HXR polarization.
1.2. Compton Polarimetry
Polarimetry in the hard X-ray regime is challenging due to the penetrating nature of high-energy photons. Traditional polarimeters (e.g., Bragg crystals, photoelectric polarimeters) lose efficiency above ∼10 keV. Instead, Compton scattering polarimetry exploits the azimuthal asymmetry in the scattering cross-section of polarized photons.
The differential cross-section for Compton scattering is given by the Klein–Nishina formula [14]:
where is the classical electron radius ( m), E and are the incident and scattered photon energies, is the polar scattering angle (angle between incident and scattered photon directions), and is the azimuthal scattering angle (angle between the scattering plane and the polarization vector of the incident photon).
The dependence in Equation (1) means that photons scatter preferentially perpendicular to their polarization vector. For an ensemble of photons, this results in an asymmetric azimuthal distribution of scattering angles (a.k.a. modulation curve) in the case of a polarized flux. The relative amplitude of this modulation is directly related to the polarization degree (PD) of the source, while the phase of the modulation gives the polarization angle (PA).
The modulation factor () quantifies the instrument’s sensitivity to polarization:
where and are the maximum and minimum counts in the azimuthal distribution. For keV (the electron rest-mass energy), the maximum modulation occurs at (orthogonal scattering), where (100% modulation for 100% polarized light).
A figure of merit of the sensitivity of polarimeters, the minimum detectable polarization (MDP) at 99% confidence, is given by [15]:
where R and B are the source and background count rates and T is the observation time.
A high modulation factor and efficient detection are thus critical for achieving low MDP values and being sensitive to lowly polarized signals.
1.3. The CUSP Polarimeter: Instrument Design and Principle of Operation
The CUbesat Solar Polarimeter (CUSP) is a 6U-XL CubeSat mission developed under the Italian Space Agency’s (ASI) Alcor program, designed to measure the linear polarization of solar flares in the 25–100 keV band using a dual-phase Compton polarimeter. The instrument, whose CAD design is shown in Figure 1 together with its detection working principle, consists of a scatterer array of 64 plastic scintillator bars (low-Z material to maximize Compton scattering) read out by four 16-channel multi-anode photomultiplier tubes (MAPMTs), surrounded by a ring of absorbers made of 32 cerium-doped GAGG (Gd3Al2Ga3O12:Ce) scintillator crystals (high-Z material to maximize photoelectric absorption) read out by avalanche photodiodes (APDs). The R7600-03-M16-Y002 Ultra Bialkali MAPMT and the S16554-55S APD, both from Hamamatsu (Hamamatsu City, Japan), are read out by the MAROC-3A and SKIROC-2A ASICs from Weeroc (Villebon-sur-Yvette, Frankrijk), respectively. The baseline for the scatterer is Eljen’s PVT-based EJ-204 scintillator (Sweetwater, TX, USA), although other materials from the same family are being investigated.
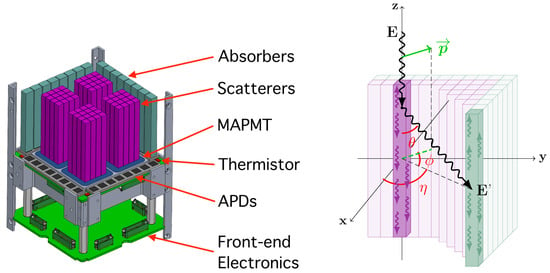
Figure 1.
Left: Partial CAD design of CUSP’s hard X-ray polarimeter showing its sensitive parts. Right: Schematic working principle of a Compton polarimeter. The incoming photon is Compton-scattered in a segment of the detector, depositing some energy which is converted into scintillation optical light and collected by a photosensor at the extremity of the scintillator bar. The scattered photon is then absorbed in a different segment of the instrument, which allows for determining the azimuthal scattering direction of the primary photon.
When an incoming HXR photon interacts in the scatterer, it Compton-scatters, depositing partial energy before being absorbed in a GAGG scintillator, as depicted in Figure 1. The azimuthal scattering angle () is reconstructed from the relative positions of the scatter and absorption events. By accumulating many such events, the modulation curve is built from which the polarization degree (PD) and angle (PA) are derived. A tungsten collimator reduces the field of view of the polarimeter to , and Al/Ti and Al/Ti/W filters are, respectively, used for the scatterers and absorbers to filter soft X-rays and electrons.
Simulations of benchmark solar flares from [6] have shown that CUSP will have a 3.9% MDP for an X1.2 flare with a duration of 240 s. The MDP requirement for CUSP is of 5% in the 25–100 keV range for an X1.2 solar flare with a observation time of 240 s. More details on CUSP’s scientific prospects and mission concept can be found in [16].
In order to validate the readout chain and spectral performance of both the scatterers and absorbers of CUSP’s polarimeter, single-channel setups based on both types of detectors read out by ASIC development boards were assembled. While preliminary results obtained with this setup were reported in [17], we describe here the detailed spectral performance as measured in a laboratory for both detection chains.
2. Single-Channel Spectral Performance
2.1. Scatterers
The setup for testing a single-channel scatterer was based on a plastic scintillator bar wrapped with several layers of 100 m thick polytetrafluoroethylene (PTFE; a.k.a. Teflon) tape and coupled to a channel of an R7600-03-M16-Y002 UBA MAPMT from Hamamatsu using a custom mechanical jig and optical grease. The assembly was placed in a light–tight box and the MAPMT channels were read by a MAROC-3A development board connected to a computer equipped with C# GUI software used for ASIC configuration and data acquisition. A schematic representation of the setup as well as a picture of the detector assembly inside the dark box are shown in Figure 2.
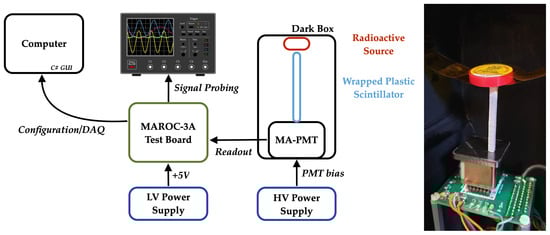
Figure 2.
Left: Diagram showing the laboratory setup used to characterize the CUSP scatterer. The MAROC-3A development board reads out the MA-PMT used to read out the plastic scatterer. Right: Plastic scintillator bar wrapped using PTFE tape and coupled to an MA-PMT channel. A source is placed on top of the scintillator and the assembly is placed in a dark box.
Spectra were acquired by placing various radioactive isotopes with characteristic features in the energy range of interest on top of the plastic scintillator. Three different signal shapers were available for triggering with the MAROC-3A, namely a unipolar fast shaper (fsu), a bipolar fast shaper (fsb1), and a half bipolar fast shaper (fsb2) [18]. The unipolar fast shaper allows for triggering on weak signals, with a charge down to 50 fC or lower, while the half bipolar fast shaper is suitable for very strong signals. Both the ‘fsu’ and ‘fsb1’ were investigated here, although the unipolar fast shaper was expected to be the most suitable for the scatterer signals as a small amount of optical light was expected from the scintillation in plastic scintillators. A slow shaper, with shaper peaking time in the range of 50–142 ns, was used to read the charge signal. The measured , , and spectra using both ‘fsu’ and ‘fsb1’ fast shapers for triggering are plotted in Figure 3. The 5.95 keV line of , a blend of lines around 18.0 keV from (as detailed in Section 2.2), and a blend of lines around 23.108 keV from can be observed in both cases. has a line at 22.984 keV with a 4.31% branching ratio and a line at 23.174 keV with a branching ratio of 8.12% [19], which gives a weighted energy of 23.108 keV.
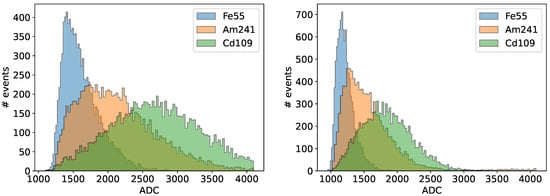
Figure 3.
Left: , , and spectra measured with an EJ-204 scintillator bar using the unipolar fast shaper, a preamplifier gain of 0.2, and a bias voltage of 840 V. Right: Same spectra measured using MAROC-3A’s bipolar fast shaper 1 at a bias of 820 V and with a preamplifier gain of 0.15.
Eljen’s EJ-204 plastic scintillator (Eljen EJ-204—https://eljentechnology.com/products/plastic-scintillators/ej-200-ej-204-ej-208-ej-212, accessed on 19 September 2025) was used as the baseline for the scattering material because of its high scintillation efficiency of 10,400 photons/MeV. Other scintillators such as EJ-228 or EJ-230 have a slightly lower scintillation efficiency but a better spectral compatibility with the quantum efficiency of the MAPMT. They were therefore also investigated as potential scattering materials. The spectral compatibility of scintillators with the sensor, i.e., between the emitted spectra from the scintillators and the quantum efficiency spectrum of the sensor, was computed by multiplying the scintillator and MAPMT spectra, resulting in a photon detection probability density spectrum, as shown in Figure 4. This figure also shows the spectra obtained for the three types of scintillators mentioned earlier with an source, where EJ-228 and EJ-230 appear to allow for a more efficient light collection despite their slightly lower scintillation efficiency.
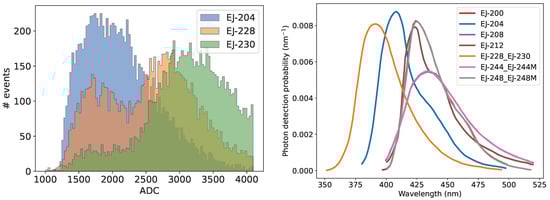
Figure 4.
Left: spectra measured using the unipolar fast shaper with a bias of 840 V with three kinds of plastic scintillators. Right: Scintillation spectra of various PVT-based scintillators convolved with the quantum efficiency of the R7600-03-M16-Y002 MAPMT from Hamamatsu.
Another crucial consideration for the selection of the plastic scintillator material, except for the scintillation efficiency and spectral compatibility with the MAPMT, is the light output fraction that one can determine from the scintillator bar. This is the fraction of scintillation light that actually reaches the entrance of the detector after interface losses. This fraction can be affected by the shape of the scintillators but more importantly by the roughness of the scintillator’s polished surfaces, which is directly linked to the softness of the material [20]. Table 1 gives the integrated spectral compatibility for various plastic scintillators from Eljen in detected photons (or photoelectrons) per scintillation photon, as well as the scintillation efficiency of the material and the light yield of the scintillator in detected photons per unit of deposited energy, assuming a light output fraction of 0.3 for all scintillators. This fraction varies depending on the scintillator surface roughness, which can change the photon losses between the scintillator and the sensor, causing a material with higher scintillation efficiency to lead to a lower light yield due to rougher surfaces [20]. Many of the plastic scintillator materials quoted in Table 1 will therefore be investigated in the future to determine which material offers an optimal light collection process for our design.

Table 1.
Comparison of the integrated spectral response of various PVT-based scintillators from Eljen. The light yield, i.e., the amount of optical light detected per unit of deposited energy in the scintillator, is computed assuming a scintillator light output fraction of 0.3, that is, only 30% of the optical light is collected by the sensor. This number varies depending on the surface roughness obtained via diamond polishing, which in turn depends on the material itself [20].
Another important quantity impacting the instrument’s response is the optical crosstalk, otherwise known as the amount of light that gets detected in channels neighboring the one where the actual event is occurring. An example of a spectrum collected with the single wrapped plastic bar coupled to channel 1 is shown together with the spectra of the other 15 channels in Figure 5. An excess in the spectrum above the dark noise peak can be observed for some channels that are neighbors of channel 1. From these spectra, one can extract the fraction of light leaking from channel 1 to its neighbors and compute an optical crosstalk map, also shown in Figure 5. Most of the channels show a negligible amount of crosstalk (within statistical fluctuations), except for their direct and diagonal neighbors, for which the optical crosstalk is respectively comprised in the ranges of 8–11% and 1–2%.
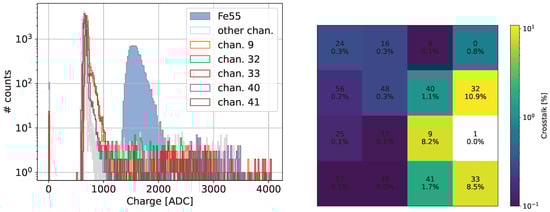
Figure 5.
Left: Spectra measured by the 16 MAPMT channels, with channel 1 coupled to a wrapped plastic scintillator with on top and all other channels covered by an opaque jig (see Figure 2, right). The effect of optical crosstalk through the MAPMT’s entrance window can be seen in the spectra of the channels neighboring channel 1. Right: Crosstalk map showing an optical crosstalk of up to 10.9 % in the direct neighbors and non-significant crosstalk to non-neighboring channels. The channel ID and crosstalk value are indicated on each bin.
A more accurate value of the crosstalk can be obtained using a complete array of plastic scintillators, more representative than a single plastic scintillator coupled to an MAPMT channel. However, the main contribution to the optical crosstalk is due to the 0.8 mm thick entrance ‘UV-glass’ of the MAPMT, and the crosstalk estimates given here are therefore a good approximation. The values obtained also match the optical crosstalk of POLAR, a GRB polarimeter using similar MAPMTs for which the crosstalk was in the range of 10 to 15% [20]. The crosstalk asymmetry in the vertical direction of the map is likely due to a small misalignment of the bar compared to the center of the MAPMT channel, which will be easily fixed in the future when using dedicated mechanics encapsulating the wrapped scintillator array. The optical crosstalk impacts the instrument’s energy threshold as part of the optical light from the channel in which the X-ray is interacting will leak to the neighbor channels and should therefore be minimized. The optical crosstalk should also be fully described by simulations combined with laboratory measurements in order to include the induced systematic effects in both spectral and polarization response matrices.
For a Compton scattering event for which the polar scattering angle is 90°, i.e., for which the Compton energy deposition is maximal, the energies deposited through Compton scattering by a 25 and 100 keV incoming photon are, respectively. 1.17 and 16.4 keV. The 25–100 keV energy range of CUSP therefore translates into a Compton deposition in the plastic scatterers in the range of 1.17–16.4 keV. The dynamic range of the scatterer can be estimated using the spectrum, fitted in Figure 6. One can rescale the 23.108 keV photopeak position (from the two lines mentioned earlier) in ADC for each bias voltage by the PMT gain ratio [21] between the different bias voltages applied to get an idea of the energy (keV) vs. charge (ADC) for all three high voltages, as plotted in Figure 6. The 23.108 keV peak position can be used to determine the energy dynamic range that can be achieved with the absorber’s acquisition chain based on development boards.
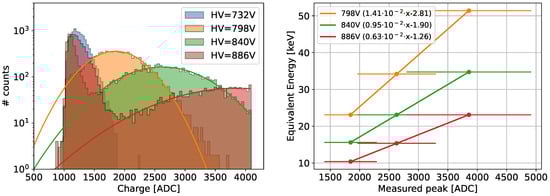
Figure 6.
Left: spectra acquired for various PMT bias voltages. Right: Equivalent energy of the 23.108 keV feature (two lines weighted, see explanations in the text) assuming a given voltage and applying a gain ratio based on the PMT’s gain dependence on the high voltage as a function of the photopeak position.
The conversion between the measured charge and threshold digital value is shown in Figure 7 together with the noise rate as a function of the threshold value. One should note that the threshold scale is inverted, meaning that a higher DAC value implies a lower voltage. From the noise rate measured at various bias voltages, the minimum threshold value that can be used with the development board setup is 733 DAC, for which the noise rate is still easily manageable (≪1 MHz) once applying a Compton coincidence window of the order of hundreds of nanoseconds. This threshold value is far from optimized, as the ASIC development board was designed by Weeroc for functional tests, thus not offering the best achievable performance. This setup is therefore quite noisy, and a much lower threshold value should easily be achieved using custom electronics in the future. The 733 DAC threshold corresponds to a charge of 762 ADC, which is considered hereafter as the energy threshold of the scatterer. The upper energy boundary is computed as the energy at 4096 ADC. Using this charge range and the photopeak position to convert the charge into energy, one can compute the energy range of the absorber as a function of the PMT bias voltage, as given in Table 2.
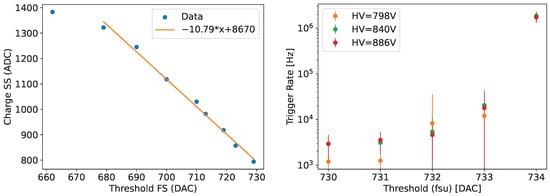
Figure 7.
Left: Conversion of the digital threshold value into digitized charge. It should be noted that the threshold scale is inverted, i.e., a lower DAC value corresponds to a higher threshold. Right: Noise trigger rate as a function of the threshold value for the unipolar fast shaper for different PMT bias voltages.
Table 2.
Determination of the energy dynamic range for three values of PMT bias voltages. The PMT gain values have been obtained through the fit of the gain versus high voltage plot from the Hamamatsu datasheet [21].
At a voltage of 886 V, the achieved dynamic range is 3.55–24.62 keV, neglecting ASIC saturation effects, which could affect the linearity at high energy as well as the upper energy bound. Although the targeted energy range for Compton depositions is 1.17–16.4 keV and is therefore not achieved with this setup, the use of custom electronics optimized for noise reduction will significantly improve the performance at low energies and allow for reducing the energy threshold. A prototype with dedicated electronics rather than development boards is currently under development as part of CUSP’s phase B, as described in Section 2.3.
2.2. Absorbers
A setup similar to that used for the scatterers has been developed to test the absorber acquisition chain. It is based on a GAGG scintillator bar wrapped in PTFE tape coupled to a single-channel S8664-55 APD from Hamamatsu [22]. This sensor has a ceramic package with pins and an epoxy resin, while the flight APD S16554-55S has an SMD package and a silicone resin. The sensor itself is, however, the same. The detector assembly is once again placed in a light–tight box, and a SKIROC-2A development board, this time controlled via LabVIEW 2021 software, is used to acquire the signal. Both the diagram of the setup and a picture of the single-channel detector assembly are shown in Figure 8. Only the analog part of the ASIC is used for limiting the power consumption of the system and because the digital part does not allow for a fast enough event readout for our application due to high dead-time [23].
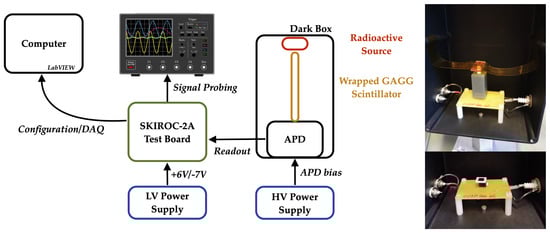
Figure 8.
Left: Diagram showing the laboratory setup used to characterize the CUSP absorber. The SKIROC-2A development board is reading out the APD coupled to a GAGG absorber. Right: APD mounted on its RC filter board (bottom) and coupled to a wrapped GAGG scintillator bar on which an source is placed (top).
The APD is first tested with no scintillator, directly placing an source on top of it, in which case the 5.95 keV from the iron source is absorbed in the depletion layer of the silicon in the APD, which directly acts as an X-ray detector. The 5.95 keV photopeak as a function of the APD gain is scanned by sweeping over the APD’s bias voltage, as shown in Figure 9. The energy resolution of the APD itself is computed from these spectra, as also plotted in Figure 9. With the energy resolution of the APD being much better than that of GAGG, one can safely assume that the main contribution to the energy resolution will come from the scintillator itself.
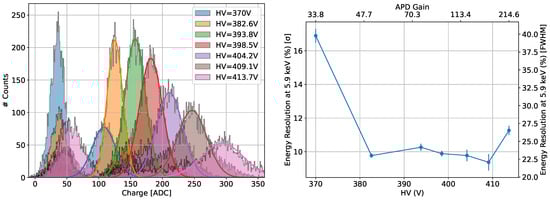
Figure 9.
Left: spectrum measured directly with the APD for various bias voltages Right: APD energy resolution as a function of its bias voltage and gain. The point at 370 V is artificially higher due to the fact that the peak is reaching the threshold level and is therefore distorted.
The absorber channel (with the APD coupled to a wrapped GAGG scintillator) is being tested using radioactive sources with characteristic emission lines in the 25–100 keV range. In addition to the that was used for the energy calibration of the scatterers, we make use of , , , and sources. Spectra acquired with the absorber for these five sources are shown in Figure 10 for APD bias voltages of 382 and 410 V. These spectra were subtracted for the noise pedestal of 702.41 ± 0.14 ADC. From the APD datasheet [22] and dedicated APD characterization measurements [24], we know that the APD gain values for these two voltages are, respectively, about 50 and 100.
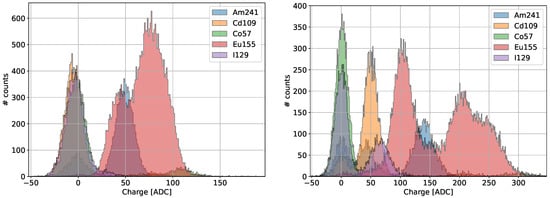
Figure 10.
Left: Measured , , , , and spectra for a bias voltage of 382 V. Right: Same spectra measured at 410 V.
Fitted spectra are shown in Figure 11 for a bias voltage of 410 V, for which the gain is high enough to disentangle all the peaks. The shows both the blend of lines around 23.108 keV like in the plastic as well as the 88.0 keV line. The source shows a blend of line (16.8 keV + 17.74 keV + 20.81 keV Lγ) with an average weighted energy of 18 keV, seen as a single line because the energy resolution does not allow for disentangling the lines. The 13.95 keV Np Lα is below the threshold and is therefore not contributing to the measured 18 keV peak. In addition to this, the 59.541 keV line from is also seen. has characteristic lines at 42.996, 86.546, and 105.309 keV, while a line at 29.621 keV is seen for and at 122.061 keV for . The values of these characteristic energies are taken from [19,25,26].
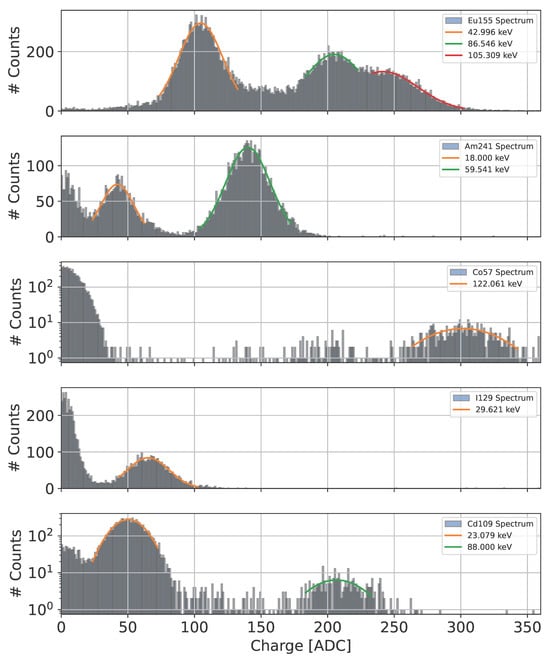
Figure 11.
Spectra of the five sources shown in Figure 10 fitted for characteristic lines, whose energies are summarized in the text.
These fitted characteristic energies allow for converting the digitized charge in ADC into deposited energy in keV over the entire absorber energy range. The linearity of the charge to energy conversion over the energy band is given in Figure 12 together with the energy resolution as a function of energy computed from the full-width at half-maximum (FWHM) for each measured photopeak. The energy resolution dependency in energy is well described by the square root of a second-order polynomial in 1/E, and it is comparable to the energy resolution at room temperature of GAGG crystals reported in the literature.
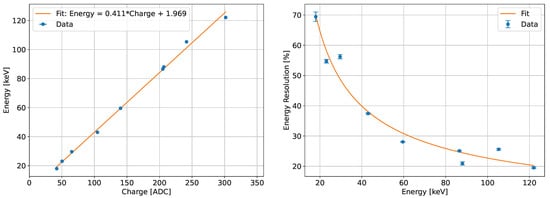
Figure 12.
Left: Energy (keV) obtained from the theoretical emission features of the various well-known radioactive isotopes as a function of the fitted line position (ADC). Right: Energy resolution (FWHM) of the GAGG absorber as a function of energy.
Pile-up effects due to a high data rate have been studied by placing an source on top of the GAGG crystal, for which the energy deposition in the scintillator from the 5.95 keV line is under the threshold. However, as shown in Figure 13, in the spectra acquired with both 382 and 410 V bias voltages, a high data rate emulated by a high-activity source can cause pile-up events over the threshold. Indeed, a triggered peak can be observed for a voltage of 382 V using a source with an activity of 168 MBq, as several 5.95 keV energy depositions happen in the GAGG in a time scale smaller than the electronics integration time (50–100 ns, with a crystal decay time of ∼90 ns), which ends up in a signal over the threshold due to the accumulation of scintillation light seen as a single event by the system. This effect is less prominent at 410 V, as the higher gain allows the system to trigger on single 5.95 keV photons, whose rate dominates over the pile-up event rate. This pile-up effect should not affect the instrument’s operation, since a maximum event rate of tens of kHz is expected for bright flares. It should, however, be further studied with the next prototype design to ensure it has no significant impact on the detector’s spectro-polarimetric response for bright solar flares.
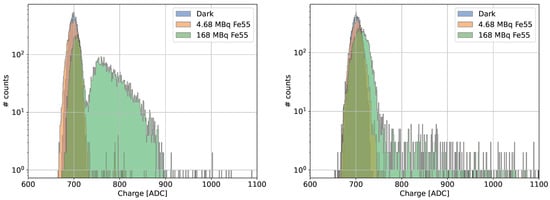
Figure 13.
Left: spectrum for two sources with different activities (4.68 and 168 MBq) compared to a dark spectrum at a bias voltage of 382 V. The ’s 5.95 keV line is below the threshold, but pile-up effects induce triggered events for a very high rate of events. Right: Same at a bias voltage of 410 V. The effect is less visible as the system starts to trigger on single 5.95 keV photons due to the higher gain, which dominates the spectrum.
2.3. Coincidence
The working principle of a Compton polarimeter implies reading in coincidence the scattering and absorption events. More specifically, polarization events, for which the azimuthal scattering direction can be determined, consist of a double event with, in the nominal topology of eventsone hit in a plastic bar and one in a GAGG scintillator (other topologies of events, such as plastic+plastic, i.e., a photon scattering in a plastic bar and then being absorbed in another plastic bar, can be considered to increase the instrument’s effective area for polarimetry. One should, however, note that double plastic events, as for a single-phase polarimeter, show a lower modulation factor and are therefore less sensitive to the polarization of the incoming photon. The possible use of these events will be assessed in future phases on the basis of measurements and simulations). The functionality of the coincidence logic using the two ASIC development boards was tested using NIM modules for signal conversion and applying the coincidence logic when receiving an event from both parallel acquisition chains. The diagram of this setup, which showed the correct functionality of the logic, is shown in Figure 14. The BNC BL-2 Analog pulse generator is used to inject a coincident signal in both evaluation boards. The trigger signals from both boards are converted to TTL through the ORTEC 551 and TENNELEC TC451 modules. Both TTL signals are then provided to the CANBERRA 2144A coincidence module, the output of which is fed to the MAROC-3A board as a HOLD signal to look for a scatterer signal when an absorber channel is triggered on the SKIROC-2A board.
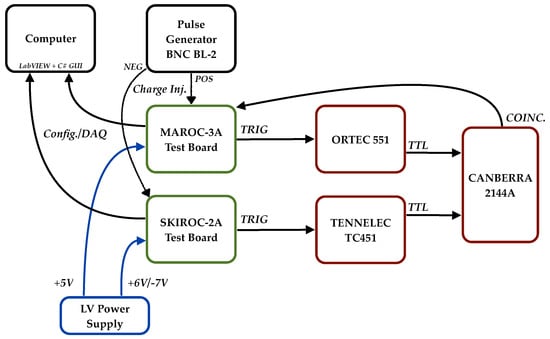
Figure 14.
Diagram of the setup used for testing the Compton coincidence logic through pulse injection with both ASIC’s development boards.
A custom front-end electronics (FEE) based on both MAROC-3A and SKIROC-2A ASICs controlled and read out by an Artix®-7 FPGA from Xilinx is currently under development by the Weeroc company as part of a polarimeter prototype, whose current design is shown in Figure 15. The prototype will contain four strips of eight GAGG bars, like in the flight design, surrounding a single MAPMT coupled to a 4 × 4 array of plastic scintillators. This prototype will offer better performance thanks to its dedicated electronics and will allow us to characterize more deeply the spectral performance of the instrument as well as its spurious polarization response, or in other words, the instrumental effects distorting the polarimetric response. This prototype is currently being built as part of phase B of the CUSP mission. Both the scatterer and absorber scintillator blocks will be assembled in an epoxy-based mechanical structure hosting strips of enhanced specular reflector (ESR) films for scintillator wrapping, which offers a higher reflectivity than Teflon [20].
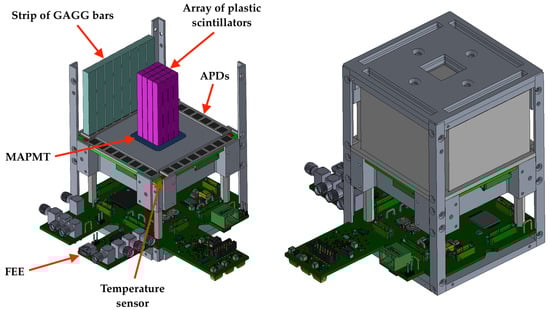
Figure 15.
Left: CAD design showing the sensitive parts of the polarimeter prototype being developed for CUSP’s phase B. Right: CAD design of the full assembly of the prototype.
3. Conclusions
The CUbesat Solar Polarimeter (CUSP) is a 6U-XL mission being developed by a collaboration led by the Italian National Institute for Astrophysics of Rome (INAF-IAPS). It will host a dual-phase Compton polarimeter sensitive in the 25–100 keV range with the aim of performing hard X-ray polarimetry of solar flares. In particular, CUSP will provide unprecedented constraints on the magnetic field geometry, particle acceleration, and energy release mechanisms in solar flares. With its high sensitivity, time resolution, and dedicated observing strategy, CUSP will bridge the gap between theoretical models and observational data, advancing both fundamental heliophysics and applied space weather research. Beyond solar physics, CUSP will also be able to perform spectro-polarimetric observations of bright X-ray sources that enter its field-of-view, widening its science impact to other fields of astrophysics. It will, for instance, be able to perform significant polarization measurements of bright sources such as gamma ray bursts, for which polarimetry stands as one of the key techniques for future studies to deepen our understanding of these sources [27,28].
Preliminary spectral performance results for both the scatterer and absorber detectors based on single-channel prototypes using ASIC development boards for data acquisition have been reported. Although the design of these single-channel prototypes was far from optimized, the results demonstrated the functionality of both acquisition chains as well as promising spectral sensitivity, with room for improvement at low energies with dedicated electronics in the future. Indeed, an energy threshold of 3.55 keV was reached using development boards, which are not optimized for performance measurements. The required 1.17 keV energy threshold for a 25 keV photon with a 90° angle polar scattering angle will require an improvement of the noise rejection and should be reasonably achieved with the custom electronics in development for CUSP. A careful characterization of the detector’s spectral and polarimetric responses will be performed on the prototype polarimeter to ensure that all systematic effects are understood and kept under control. No pile-up is expected as the electronics are fast-enough to acquire data from the brightest flares. The gain will be kept stable by correcting the bias voltage with the monitored temperature, and other contributions to the systematics such as optical crosstalk or residual threshold and gain non-uniformities will be accounted for in the polarimeter’s response to prevent false polarization detections.
With a launch currently targeted for late 2027/early 2028, depending on ASI approval, the CUSP mission is now in the prototyping phase (phase B). While spectral performance can only be studied with single-channel detectors, a representative prototype of the flight Compton polarimeter is under construction for performing a detailed characterization of the spectro-polarimetric response of the instrument through laboratory measurements and refining our sensitivity estimates to the polarization of solar flares and other bright sources of interest.
Author Contributions
N.D.A. performed the laboratory measurements, data analysis, and wrote this manuscript. A.K. helped with the laboratory measurements for the GAGG absorbers. S.F. and E.D.M. assisted with setting up the laboratory and provided guidance on laboratory measurements and data analysis. E.C. and P.S. provided advice on laboratory measurements and data analysis. G.L. and A.R. helped with setting up the laboratory. A.K., S.F., E.C. and R.C. helped with reviewing the manuscript. All other authors are CUSP team members responsible for payload development and simulations (INAF), the satellite platform (IMT s.r.l.), the payload electronics (DEDA Connect s.r.l.), mission analysis (University of Bologna), the ground segment (University of “La Tuscia”), or project control (ASI). All authors have read and agreed to the published version of the manuscript.
Funding
This study is funded by the Italian Space Agency (ASI) within the Alcor Program, as part of the development of the CUbesat Solar Polarimeter (CUSP) mission under ASI-INAF contract no. 2023-2-R.0.
Data Availability Statement
Data is contained within the article.
Conflicts of Interest
The activities reported in this paper are funded by ASI, which also approved its publication. Authors Davide Albanesi, Valerio Campomaggiore, Giulia de Iulis, Andrea Del Re, Paolo Leonetti, Francesca Sbop and Alessandro Zambardi were employed by the company DEDA Connect s.r.l. Authors Giovanni Cucinella, Simone Di Filippo, Andrea Negri and Massimo Perelli were employed by the company IMT s.r.l. The remaining authors declare that the research was conducted in the absence of any commercial or financial relationships that could be construed as a potential conflict of interest.
Abbreviations
The following abbreviations are used in this manuscript:
| APD | Avalanche PhotoDiode |
| ASI | Agenzia Spaziale Italiana (Italian Space Agency) |
| ASIC | Application Specific Integrated Circuit |
| CAD | Computer-Aided Design |
| CME | Coronal Mass Ejection |
| CUSP | CUbesat Solar Polarimeter |
| ESR | Enhanced Specular Reflector |
| FEE | Front-End Electronics |
| GAGG | Gadolinium Aluminum Gallium Garnet |
| GUI | Graphical User Interface |
| HXR | Hard X-Ray |
| MAPMT | Multi-Anode PhotoMultiplier Tube |
| MDP | Minimum Detectable Polarization |
| PMT | PhotoMultiplier Tube |
| PTFE | PolyTetraFluoroEthylene |
| PVT | PolyVinylToluene |
| SMD | Surface-Mount Device |
| UBA | Ultra Bi-Alkali |
References
- Temmer, M. Kinematical properties of coronal mass ejections. Astron. Nachrichten 2016, 337, 1010–1015. [Google Scholar] [CrossRef]
- Nagasawa, S.; Kawate, T.; Narukage, N.; Takahashi, T.; Caspi, A.; Woods, T.N. Study of Time Evolution of Thermal and Nonthermal Emission from an M-class Solar Flare. Astrophys. J. 2022, 933, 173. [Google Scholar] [CrossRef]
- Zharkova, V.V.; Kuznetsov, A.A.; Siversky, T.V. Diagnostics of energetic electrons with anisotropic distributions in solar flares. I. Hard X-rays bremsstrahlung emission. Astron. Astrophys. 2010, 512, A8. [Google Scholar] [CrossRef]
- Jeffrey, N.L.S.; Saint-Hilaire, P.; Kontar, E.P. Probing solar flare accelerated electron distributions with prospective X-ray polarimetry missions. Astron. Astrophys. 2020, 642, A79. [Google Scholar] [CrossRef]
- Emslie, A.G.; Brown, J.C. The polarization and directivity of solar-flare hard X-ray bremsstrahlung from a thermal source. Astrophys. J. 1980, 237, 1015–1023. [Google Scholar] [CrossRef]
- Saint-Hilaire, P.; Krucker, S.; Lin, R.P. A Statistical Survey of Hard X-ray Spectral Characteristics of Solar Flares with Two Footpoints. Sol. Phys. 2008, 250, 53–73. [Google Scholar] [CrossRef]
- Tindo, I.P.; Ivanov, V.D.; Mandel’stam, S.L.; Shuryghin, A.I. On the polarization of the emission of X-ray solar flares. Sol. Phys. 1970, 14, 204–207. [Google Scholar] [CrossRef]
- Tindo, I.P.; Ivanov, V.D.; Mandel’stam, S.L.; Shuryghin, A.I. New measurements of the polarization of X-ray solar flares. Sol. Phys. 1972, 24, 429–433. [Google Scholar] [CrossRef]
- Tindo, I.; Ivanov, V.; Valníček, B.; Livshits, M. Preliminary interpretation of the polarization measurements performed on ‘Intercosmos-4’during three X-ray solar flares. Sol. Phys. 1972, 27, 426–435. [Google Scholar] [CrossRef]
- Tramiel, L.J.; Novick, R.; Chanan, G. Polarization evidence for the isotropy of electrons responsible for the production of 5–20 keV X-rays in solar flares. Astrophys. J. 1984, 280, 440–447. [Google Scholar] [CrossRef]
- Boggs, S.E.; Coburn, W.; Kalemci, E. Gamma-Ray Polarimetry of Two X-Class Solar Flares. Astrophys. J. 2006, 638, 1129. [Google Scholar] [CrossRef]
- Suarez-Garcia, E.; Hajdas, W.; Wigger, C.; Arzner, K.; Güdel, M.; Zehnder, A.; Grigis, P. X-ray polarization of solar flares measured with RHESSI. Sol. Phys. 2006, 239, 149–172. [Google Scholar] [CrossRef]
- Zhitnik, I.A.; Logachev, Y.I.; Bogomolov, A.V.; Denisov, Y.I.; Kavanosyan, S.S.; Kuznetsov, S.N.; Morozov, O.V.; Myagkova, I.N.; Svertilov, S.I.; Ignat’ev, A.P.; et al. Polarization, temporal, and spectral parameters of solar flare hard X-rays as measured by the SPR-N instrument onboard the CORONAS-F satellite. Sol. Syst. Res. 2006, 40, 93–103. [Google Scholar] [CrossRef]
- Klein, O.; Nishina, Y. Über die Streuung von Strahlung durch freie Elektronen nach der neuen relativistischen Quantendynamik von Dirac. Z. Für Phys. 1929, 52, 853–868. [Google Scholar] [CrossRef]
- Weisskopf, M.C.; Elsner, R.F.; O’Dell, S.L. On understanding the figures of merit for detection and measurement of X-ray polarization. Int. Soc. Opt. Photonics SPIE 2010, 7732, 77320E. [Google Scholar] [CrossRef]
- Fabiani, S.; Monte, E.D.; Alimenti, A.; Campana, R.; Centrone, M.; Costa, E.; Angelis, N.D.; Cesare, G.D.; Cosimo, S.D.; Persio, G.D.; et al. The CubeSat solar polarimeter (CUSP): Mission overview II. In Proceedings of the UV, X-Ray, and Gamma-Ray Space Instrumentation for Astronomy XXIV, San Diego, CA, USA, 5–7 August 2025; Siegmund, O.H., Hoadley, K., Eds.; International Society for Optics and Photonics, SPIE: Bellingham, WA, USA, 2025; Volume 13625, p. 136250F. [Google Scholar] [CrossRef]
- Angelis, N.D.; Kumar, A.; Fabiani, S.; Monte, E.D.; Costa, E.; Lombardi, G.; Soffitta, P.; Alimenti, A.; Campana, R.; Centrone, M.; et al. Prototype development and calibration of the CUbesat solar polarimeter (CUSP). In Proceedings of the Hard X-Ray, Gamma-Ray, and Neutron Detector Physics XXVII, San Diego, CA, USA, 4–6 August 2025; Cherepy, N.J., Fiederle, M., James, R.B., Eds.; International Society for Optics and Photonics, SPIE: Bellingham, WA, USA, 2025; Volume 13621, p. 1362108. [Google Scholar] [CrossRef]
- MAROC-3A ASIC Datasheet v1.1-2. Available online: https://www.weeroc.com/read_out_chips/maroc-3a/ (accessed on 12 July 2025).
- Nuclear Database (NuDat) from the Brookhaven National Laboratory. Available online: https://www.nndc.bnl.gov/nudat3/indx_dec.jsp (accessed on 12 July 2025).
- De Angelis, N.; Cadoux, F.; Husi, C.; Kole, M.; Mianowski, S. Optimizing the light output of a plastic scintillator and SiPM based detector through optical characterization and simulation: A case study for POLAR-2. J. Instrum. 2025, 20, P02010. [Google Scholar] [CrossRef]
- Hamamatsu PhotoMultiplier Tubes R7600U Series datasheet.
- Hamamatsu Si APD S8664 series datasheet.
- SKIROC-2A ASIC Datasheet v0.2. Available online: https://www.weeroc.com/read_out_chips/skiroc-2a/ (accessed on 30 December 2025).
- Alimenti, A.; Cologgi, F.; Fabiani, S.; Torokhtii, K.; Silva, E.; Del Monte, E.; Baffo, I.; Bonomo, S.; Brienza, D.; Campana, R.; et al. Design and Test of a Calibration System for Avalanche Photodiodes Used in X-Ray Compton Polarimeters for Space. Sensors 2024, 24, 8016. [Google Scholar] [CrossRef] [PubMed]
- Thompson, A.; Lindau, I.; Attwood, D.; Liu, Y.; Gullikson, E.; Pianetta, P.; Howells, M.; Robinson, A.; Kim, K.J.; Scofield, J.; et al. X-Ray Data Booklet; Center for X-Ray Optics and Advanced Light Source, Lawrence Berkeley National Laboratory, University of California: Berkeley, CA, USA, 2009. [Google Scholar]
- Abbene, L.; Iniewski, K.K. High-Z Materials for X-Ray Detection: Material Properties and Characterization Techniques; Springer Nature: Berlin/Heidelberg, Germany, 2023. [Google Scholar]
- Bozzo, E.; Amati, L.; Baumgartner, W.; Chang, T.C.; Cordier, B.; De Angelis, N.; Doi, A.; Feroci, M.; Froning, C.; Gaskin, J.; et al. Future Perspectives for Gamma-ray Burst Detection from Space. Universe 2024, 10, 187. [Google Scholar] [CrossRef]
- De Angelis, N. Addressing Selected Gamma-Ray Burst Science Topics with Future Space Instruments. arXiv 2025, arXiv:2510.00707. [Google Scholar] [CrossRef]
Disclaimer/Publisher’s Note: The statements, opinions and data contained in all publications are solely those of the individual author(s) and contributor(s) and not of MDPI and/or the editor(s). MDPI and/or the editor(s) disclaim responsibility for any injury to people or property resulting from any ideas, methods, instructions or products referred to in the content. |
© 2026 by the authors. Licensee MDPI, Basel, Switzerland. This article is an open access article distributed under the terms and conditions of the Creative Commons Attribution (CC BY) license.