Article

Fire Assessment of a Subway Train Fire: A Study Based on Full-Scale Experiments and Numerical Simulations

1
CRRC Qingdao Sifang Co., Ltd., Qingdao 266111, China
2
JRCC Changzhou Co., Ltd., Changzhou 213017, China
3
School of Fire Protection Engineering, China People’s Police University, Langfang 065000, China
*
Author to whom correspondence should be addressed.
Fire 2025, 8(7), 259; https://doi.org/10.3390/fire8070259
Submission received: 16 May 2025 / Revised: 13 June 2025 / Accepted: 23 June 2025 / Published: 30 June 2025
(This article belongs to the Special Issue Modeling, Experiment and Simulation of Tunnel Fire)

Abstract

Assessments of subway train fires were conducted based on full-scale experiments and numerical simulations. The experimental platform and simulation model were established according to a real subway train in China. The results show that there was no obvious flame spread, and all the electrical circuitry maintained its integrity during a standard luggage fire. The maximum HRR (heat release rate) of the luggage fire obtained through the full-scale experiment was 155.5 kW, which was almost the same as the standard HRR curve provided in EN 45545-1. However, the fire only lasted approximately 180 s, which was much shorter than a standard fire (600 s). Through numerical simulations of an entire subway train, the side wall and roof ignited quickly, and the fire continually spread to the adjacent compartment under the extreme scenario with a gasoline pool fire and exposed winterproof material. The maximum HRRs of the luggage and gasoline pool fires were 179.7 and 17,800.0 kW, respectively. According to the experimental and simulation results, the Duggan method, which assumes that all combustibles inside a train compartment burn at the same time, was not appropriate for assessing the fires in the subway train, and a simple revised frame was proposed instead.

1. Introduction

With the rapid development of transportation infrastructure construction, subway fire safety has received significant attention [1,2,3,4]. For subway train fire hazards, many studies have focused on the fire safety of the subway station and tunnel. Pan et al. [5] explored the effect of water mist on smoke movement from the subway tunnel to the platform using full-scale experiments. Zhang et al. [6] conducted a series of small-scale experiments to explore the blockage effect of a train on the smoke back-layering in a subway tunnel. Cong et al. [7] investigated the smoke propagation characteristics of smoke flow at carriage doors and the smoke temperature under the ceiling of a longitudinally ventilated tunnel during a carriage fire. Using Fire Dynamics Simulator (FDS), Song et al. [8] explored the influences of the thickness and jet velocity of the air curtains in a subway station on the fire parameters, including the temperature, visibility, and CO concentration. Dong et al. [9] explored the fire smoke control effect for the top and tunnel smoke exhausts when a train stopped at a subway station. Sajid et al. [10] established a methodology for assessing the risks of fire and human fatalities in a subway station using fault tree analysis and numerical simulations.
Regarding the safe evacuation of subway trains, stations, and tunnels during fires, there have also been many relevant studies. Xu et al. [11] conducted a review of the studies of personnel evacuation from a subway station during a fire. They claimed that the relevant research was mainly divided into experimental and simulation research. Among the simulation studies, most focused on the bottlenecks and optimization studies of evacuation routes. Chen et al. [4] proposed a new strategy for metro tunnel evacuation during a fire named the “internal wind evacuation strategy”. By comparing this new evacuation strategy with the traditional station evacuation strategy through numerical simulations, they claimed that the new evacuation strategy is the best one available. He et al. [12] investigated the influences of the interior design on passenger evacuation in a subway train compartment through simulations. They indicated that the seat layout and door width were the key factors, which had obvious effects on the passengers’ movements. Jiang et al. [13] explored the influences of pedestrian heterogeneity (pedestrians with different evacuation speeds and body sizes) on the safe evacuation of passengers in a subway station through numerical simulations. The results show that the evacuation speed and body size of the passengers had positive and negative effects on the evacuation efficiency, respectively.
In summary, most of the relevant studies focused on fire hazards, fire control, and safe evacuations in subway stations and tunnels. Studies on fires and evacuations inside a subway train compartment have been relatively scarce. Chen et al. [14] calculated the safe evacuation time from a metro compartment and explored the influence of longitudinal and transverse arrangements of seats on the evacuation process. The results show that the required safe evacuation time is positively correlated with the passenger load, and a longitudinal seat arrangement has a greater advantage in terms of safe evacuation compared with the transverse arrangement. Li and Ingason [15] proposed a new methodology for predicting the HRR of train fires, which showed that the HRR ranged from 7 to 77 MW, and the time to reach the maximum HRR varied from 7 to 118 min. Shi et al. [16] conducted a full-scale experiment on a metro train carriage fire to investigate combustion behavior. The results show that the total heat release increased to 1009.49 kJ in 180 s. Fire development and passenger evacuation in a subway train compartment were investigated by Xi et al. [17]. The maximum HRR of the subway train compartment was 5.28 MW at 702 s. Based on the temperature, visibility, and CO concentration, the available safe egress time of the subway train was discussed.
Based on numerous studies [18,19,20,21], subway train fire hazards can be deeply understood and the fireproof performance of subway trains has been gradually improved accordingly. For example, almost all materials that are used in subway trains are non-combustible. Therefore, subway train fire hazards should be reassessed accordingly.
In this study, subway carriage fire hazards were assessed using full-scale experiments and numerical simulations. Two hypothetical standard fires, namely, luggage and gasoline pool fires, were adopted in the present study. For the experiments, there were two main objectives: the first one was to investigate the fire development and flame spread under a standard ignition source; the second one was to check the status of the electrical circuit in the train compartment during a fire. The numerical simulations served as an effective complement to the experimental analysis to explore entire-subway and extreme fire scenarios.

2. Experimental Setup

2.1. Experimental Platform

A full-scale experimental platform of a subway train compartment, including a set of seats, the side wall behind the seats (with a window), half of the roof, and various types of cables above the roof, was established, as shown in Figure 1. The dimensions of the whole platform were 2.0 (L) × 1.0 (W) × 2.2 m (H). The main frame of the platform, the side wall, the roof, and the cable trough were constructed using aluminum plates with surface painting. The window glass was protected using non-combustible aluminum foil paper. The seat in the experimental model was made of fiberglass. The experimental platform was installed in a large-volume compartment so that the ventilation during the experiments was adequate and the environmental parameters (temperature, humidity, etc.) remained relatively stable. There was a smoke collection hood above the experimental platform to collect the smoke and calculate the fire’s HRR.
The experimental measurement equipment included a video camera, ten thermocouples, the HRR-measuring system based on the oxygen consumption method, and the measuring system for the electrical circuit status. The video camera (30 frames per second) was placed in front of the experimental region, as shown in Figure 2a, and was used to record the whole experimental process. The temperature-measuring system included ten K-type thermocouples, and the locations of these thermocouples are shown in Figure 2b. The thermocouples labeled T-1-1 to T-1-5 were used to measure the gas temperatures near the side wall of the train compartment, and the thermocouples labeled T-2-1 to T-2-5 were used to measure the gas temperatures in the cable trough (above the roof). The fire’s HRR was measured using the ISO 9705 platform [22].
The electrical circuit status was measured according to Section 8.1 of IEC 60331-1/2 [23,24], where the characteristics for providing circuit integrity include two aspects: the voltage is maintained, i.e., no fuse fails or circuit-breaker is interrupted, and a conductor does not rupture, i.e., the lamp is not extinguished. During the experiment, the circuit meeting either criterion meant failure of the cable. Based on the above requirements, the criterion regarding whether the state of the cables was normal included the following two aspects for the power supply and control cables used in our experiments: if the light bulb in the circuit was off, it indicated that the corresponding cable had burned out and the function lost integrity; if the circuit breaker tripped, it indicated that the corresponding cable had short-circuited and lost its function integrity. The loop structure for testing the integrity of the power supply and control cables is shown in Figure 3. The state of the network communication line in the experiment was measured using the network cable tester.

2.2. Fire Source and Materials

The fire scenario in the experiment assumed that the passenger’s luggage placed on the seat was ignited because of arson, which corresponded to model 5 in EN 45545-1 [25]. The ignition source was a standard paper pad in UIC 564-2 [26], which was made of standard paper (dimensions: 600 × 420 mm; state: dry at 70 °C for 3 h) that was folded in half, and there were six paper fillers inside the paper pad. The mass of the entire paper pad was 100 (±10) g. The luggage was assumed to be polyurethane foam with a density of 25–35 kg/m3, according to ARGE Part2 [27]. Two stacked standard polyurethane foam blocks with dimensions of 400 × 400 × 100 mm were placed on the seat, and the standard paper was put on the polyurethane foam, as shown in Figure 1.
Except for the ignition source (paper pad) and initial combustible (polyurethane foam), the main fire load in the train compartment included fiberglass seats, the surface paint on the wall and roof, and the insulation sheath and bushing of cables.

3. Experimental Results and Discussions

3.1. Heat Release Rate and Burning Processes

The experimental HRR curve over time is illustrated in Figure 4. Based on the HRR curve and experimental video, there were four stages in the train fire burning process, as shown in Figure 4 and Figure 5. In stage 1, the paper pad was ignited, and the flame quickly spread to the upper polyurethane foam until the whole top surface of the polyurethane foam was ignited. In this stage, the HRR rapidly increased with time. In stage 2, the flame spread downward after 40 s since the upper polyurethane foam had burned out gradually. Compared with the upward flame, the spreading speed of the downward flame was slower; this was because the unburned area could not be preheated when the flame spread downward. Therefore, the HRR curve decreased slowly after 40 s. At about 60 s, the HRR curve increased again since the lower polyurethane foam had ignited. In stage 3, the lower polyurethane foam burned out gradually, so the HRR curve began to decrease. In stage 4, all the paper pad and the polyurethane foam had burned out, and the fiberglass seat back was partially ignited. However, there was no obvious flame spread on the fiberglass seat surface, and the HRR remained at a low level at this stage. During the whole experiment, the flame did not spread to the adjacent seats, and the seat loaded with the fire source did not burn out. This was because the combustion was confined to the simulated fire source during the prolonged initial phase without direct flame impingement on the fiberglass seat. At this stage, the low-power fire source provided insufficient radiant heat flux to reach the fiberglass’s ignition threshold. During the later stages when the flames reached the seat base, the heat release rate had decreased to a low level, as shown in Figure 4, which was below the critical value required for sustained ignition.
Based on Figure 4b, the maximum HRR of the luggage fire obtained through the full-scale experiment was 155.5 kW, which was almost the same as the standard HRR curve provided in EN 45545-1. However, the fire only lasted approximately 180 s, after which the HRR stabilized at a very small value. The fire duration in this experiment was much shorter than a standard fire.

3.2. Gas Temperature

The gas temperatures measured by the ten thermocouples are illustrated in Figure 6. According to the experimental arrangement, the thermocouples labeled T-1-1 to T-1-5 were placed near the side wall, and the thermocouples labeled T-2-1 to T-2-5 were located at the sandwich construction for the cables. Since the experimental platform was in an ambient environment and almost no smoke accumulated in the experimental area, the temperature data measured by the thermocouples were relatively low. Figure 6a shows that the overall variation trend of the temperature curves was almost in accord with the HRR curve shown in Figure 4. Among the five thermocouples, the temperature measured by T-1-3, which was near the side wall right above the fire source, was the highest. At about 60 s, the gas temperature measured by T-1-3 reached 70 °C and remained stable until about 120 s; then, it decreased slowly. At about 180 s, the gas temperature decreased quickly since the main flame had been extinguished. The temperature curve variation trends measured by the four other thermocouples were similar to those measured by T-1-3. The maximum temperature measured by T-1-4 was about 50 °C, and the maximum temperatures measured by the other three thermocouples were below 40 °C.
Based on Figure 6b, the temperature measured by T-2-1 was obviously higher than those measured by the other four thermocouples since T-2-1 was located just above the air hole that connected the fire area and the sandwich construction for the cables. The maximum value of the temperature curve measured by T-2-1 was about 50 °C. The temperature curves measured by the other four thermocouples were all below 30 °C.

3.3. Status of Electrical Circuit

According to the experimental setup instructions, the fire’s influence on the power supply and control cables was determined by the statuses of the bulb and breaker. All the light bulbs remained on, and none of the breakers tripped during the whole experiment. This means that the fire had no obvious effects on the power supply and control cables inside the train, and all of the electrical circuits maintained their integrity during the fire experiment. The proper functioning of the network communication lines was also not affected during the fire experiment, based on the network cable tester.

4. Numerical Simulations of the Fire Development in the Entire Train

4.1. Simulation Model and Scenarios

To obtain an overall assessment of the fire hazard of the entire train, the numerical simulations were conducted using PyroSim [28], which was designed to complement the Fire Dynamics Simulator developed by the National Institute of Standards and Technology [29] and has been widely used in fire-related studies [8,30,31]. The entire subway train model included six compartments with dimensions of 19.3 (L) × 3.0 (W) × 2.5 m (H), as shown in Figure 7a. In the simulations, the subway train was placed in the tunnel with a section diameter of 5.3 m, as shown in Figure 7d. The wind speed inside the tunnel that was formed by the longitudinal ventilation system was set to 2 m/s according to the Standard for Fire Protection Design of Metro [32]. To simulate the personnel evacuation process in the tunnel during fires, the subway train door opened at 120 s, and the smoke control airflow of 2 m/s maintained within the tunnel would affect the smoke movement in the subway carriage after that. The interior structures of the train compartment were set up according to a real subway train. The partial model of the interior structures inside the subway train is shown in Figure 7b. The basic information of the simulations is listed in Table 1. The mesh size for each simulation was calculated and tested according to the method recommended in the FDS User’s Guide [29]. The main combustible materials inside the subway train compartment and their key parameters are listed in Table 2, which were the input data for the simulation model.
In the validation simulation and the simulations of the entire subway train with luggage fires, the main combustible was polyurethane foam. Therefore, the polyurethane model was adopted as the chemical reaction model in these simulations. For the simulations of the entire subway train with a gasoline pool fire, the combustible was gasoline, and the model of n-octane, which is one of the principal components of gasoline, was adopted with an adjustment for the CO and soot yields.
Before the simulations of the entire train, the accuracy of the simulation method was validated first by comparing the simulation result with the experimental result. Therefore, the simulation model that corresponded to the experimental area was also established, as shown in Figure 7c.
Five sets of simulations were conducted, and the details of each scenario are illustrated in Table 3. Experiment S-0 was used to validate the accuracy of the simulation method, and experiments S-1 to S-4 were used to explore the fire development and flame spread in the entire train during different fire types and locations. In experiments S-1 and S-2, the fire source was set as a luggage fire, which was regarded as the standard ignition source on the subway, and the HRR was set according to model 5 in EN 45545-1 [15], as shown in Figure 8a. In experiments S-1 and S-2, the fire sources were located on the seat and floor, respectively. In experiments S-3 and S-4, the fire sources were set as a gasoline pool fire, which was regarded as an extreme fire source on the subway, and the HRR was set according to the scale of the Daegu subway fire, as shown in Figure 8b. To simulate the extreme conditions, the winterproof material in the wall and roof of the subway train was directly exposed to the fire, and the aluminum sheet, which should be attached outside the winterproof material, was assumed to be damaged at the initial stage of the fire.

4.2. Validation of the Simulation Method

In the validation simulation scenario, the input HRR curve was set according to the experimental result, as shown in Figure 9. Based on the simulation result, the burning process and flame spread were consistent with those derived from the experiment. Before 600 s, the fire source burned gradually, and the main flame extinguished, but the fiberglass seat back was partially ignited after 600 s, as shown in Figure 9. The temperature measurement points set in the simulation model had the same locations as those in the experimental platform and were labeled T-1-1 to T-2-5. The temperature curve simulation results are shown in Figure 10. The variation trends of the temperature curves were similar to those derived from the experiment.
The simulation method’s accuracy was validated by comparing the maximum temperatures measured by the ten thermocouples in the experiments with those derived from the corresponding simulation. The comparison results are listed in Table 4. The relative error, ER, listed in Table 4, was calculated using
ER = |TETS|/TE
where TE and TS are the experimental and simulation temperature results, respectively. From Table 4, the relative errors of the experimental and simulation temperatures measured in the ten locations labeled T-1-1 to T-2-5 ranged from 2.6 to 30.0%. The relative error between the experimental and simulation results primarily came from the fire source simplification in the simulation calculations, the approximate treatment of the spatial environment, and the inherent computational errors of PyroSim itself. Since all the relative errors were no more than 30%, this meant that the simulation method selected could be used to investigate the fire development and flame spread of the entire-train fires.

4.3. Discussions on the Simulation Results of Entire-Subway-Train Fires

There were four simulations conducted for the entire-subway-train fires. The fire sources were defined as a luggage fire in scenarios 1 and 2, and a gasoline pool fire in scenarios 3 and 4. The simulated input standard HRR curves in the four scenarios are shown in Figure 11. The simulated HRR curves were all higher than the input standard HRR curves during the middle and later periods, which meant that the combustible materials inside the subway train were ignited to different extents.
The smoke- and flame-spreading processes inside the entire train compartment were similar in fire scenarios 1 and 2; therefore, only the smoke- and flame-spreading processes in fire scenario 2 are illustrated in Figure 12. Based on Figure 11a and Figure 12, the flame was restricted to the initial fire area, and the HRR curves overlapped with the standard luggage HRR curve before 120 s. There were no other combustibles ignited since the fire’s HRR at this stage was small, and the heat exerted on other combustibles was limited. At 120 s, the HRR increased to 150 kW, and the flame tilted due to the influence of wind when the doors opened. Therefore, the combustibles that the flame tilted to were preheated and then ignited when they were heated to their ignition temperatures. In fire scenario 1, the luggage fire was placed on the seat, which had an ignition temperature of 508 °C according to Table 1. The seat, on which the luggage fire was placed, was ignited at about 160 s, and the HRR increased correspondingly, as shown in Figure 11a. However, the flame was confined in a small area. Therefore, the HRR curve stabilized at 178 kW at about 350 s. In fire scenario 2, the luggage fire started on the floor, which had an ignition temperature of 216 °C according to Table 1. Since the ignition temperature of the floor cloth was much lower than that of the seat material, the ignition time of the floor in fire scenario 2 was obviously earlier than that of the seat in fire scenario 1, as shown in Figure 11a. Similar to the fire scenario 1, the flame was also confined in a small area. The HRR increased slowly and reached about 175 kW at about 350 s. In both fire scenarios 1 and 2, the HRR dropped quickly at 600 s since the luggage had burned out.
Since the smoke and flame spread inside the entire train compartment were similar in fire scenarios 3 and 4, only the smoke- and flame-spreading processes of fire scenario 4 are illustrated in Figure 13. Based on Figure 11b and Figure 13, the flame was restricted to the initial fire area, and the HRR curves overlapped with the standard pool fire HRR curve before 20 s. At this stage, there were no other combustibles ignited since the fire’s HRR was relatively small and the heating time was short. At 20 s, the pool fire’s HRR reached 2000 kW, which transmitted a large amount of heat to the surrounding combustibles. Since the doors were not open at 20 s, the flame was vertical under the effect of buoyancy. Therefore, the materials of the wall and roof, which had an ignition temperature of 400 °C (as shown in Table 1), were ignited first. In fire scenario 3, the pool fire was set on a seat that was located in the left part of the train compartment. The wall and roof surface area that was directly influenced by the flame was smaller than that in fire scenario 4. Therefore, the HRR curve in fire scenario 3 increased more slowly than that in fire scenario 4 after 20 s. In fire scenario 3, the HRR remained at about 5500 kW after 30 s, and then increased again at 60 s since the roof of the adjacent compartment was ignited, as shown in Figure 13. In fire scenario 4, the fire-spreading process was similar to fire scenario 3. The simulations were terminated after 100 s since the gasoline pool fire had burned out at 90 s according to the standard HRR curve. Based on the simulation result, it was predicted that the fire in the subway train would not extinguish but gradually spread to the adjacent train compartment, and the HRR would continually increase.
The temperature distributions inside the subway compartment in fire scenarios 2 and 4 are shown in Figure 14 and Figure 15, respectively. For fire scenario 2, the temperature rise was relatively small since the HRR was small. At 20 s, only the smoke under the roof reached 60 °C, and the temperature rise of the rest of the train compartment was not significant. After 120 s, the door opened and the smoke spread downstream with the wind, where the smoke in the downstream area was about 60 °C. At 400 °C, the downstream smoke temperature increased further.
For fire scenario 4, the temperature rise inside the train compartment was much more dramatic compared with fire scenario 2. After only 10 s of burning, the temperature rise under the roof increased to 200 °C. At 25 s, the highest temperature inside the train compartment was above 600 °C. At 65 s, the temperature of the fire train compartment’s top half reached 600 °C, and the temperature of the adjacent train compartment obviously increased. At 95 s, the high-temperature area extended further.

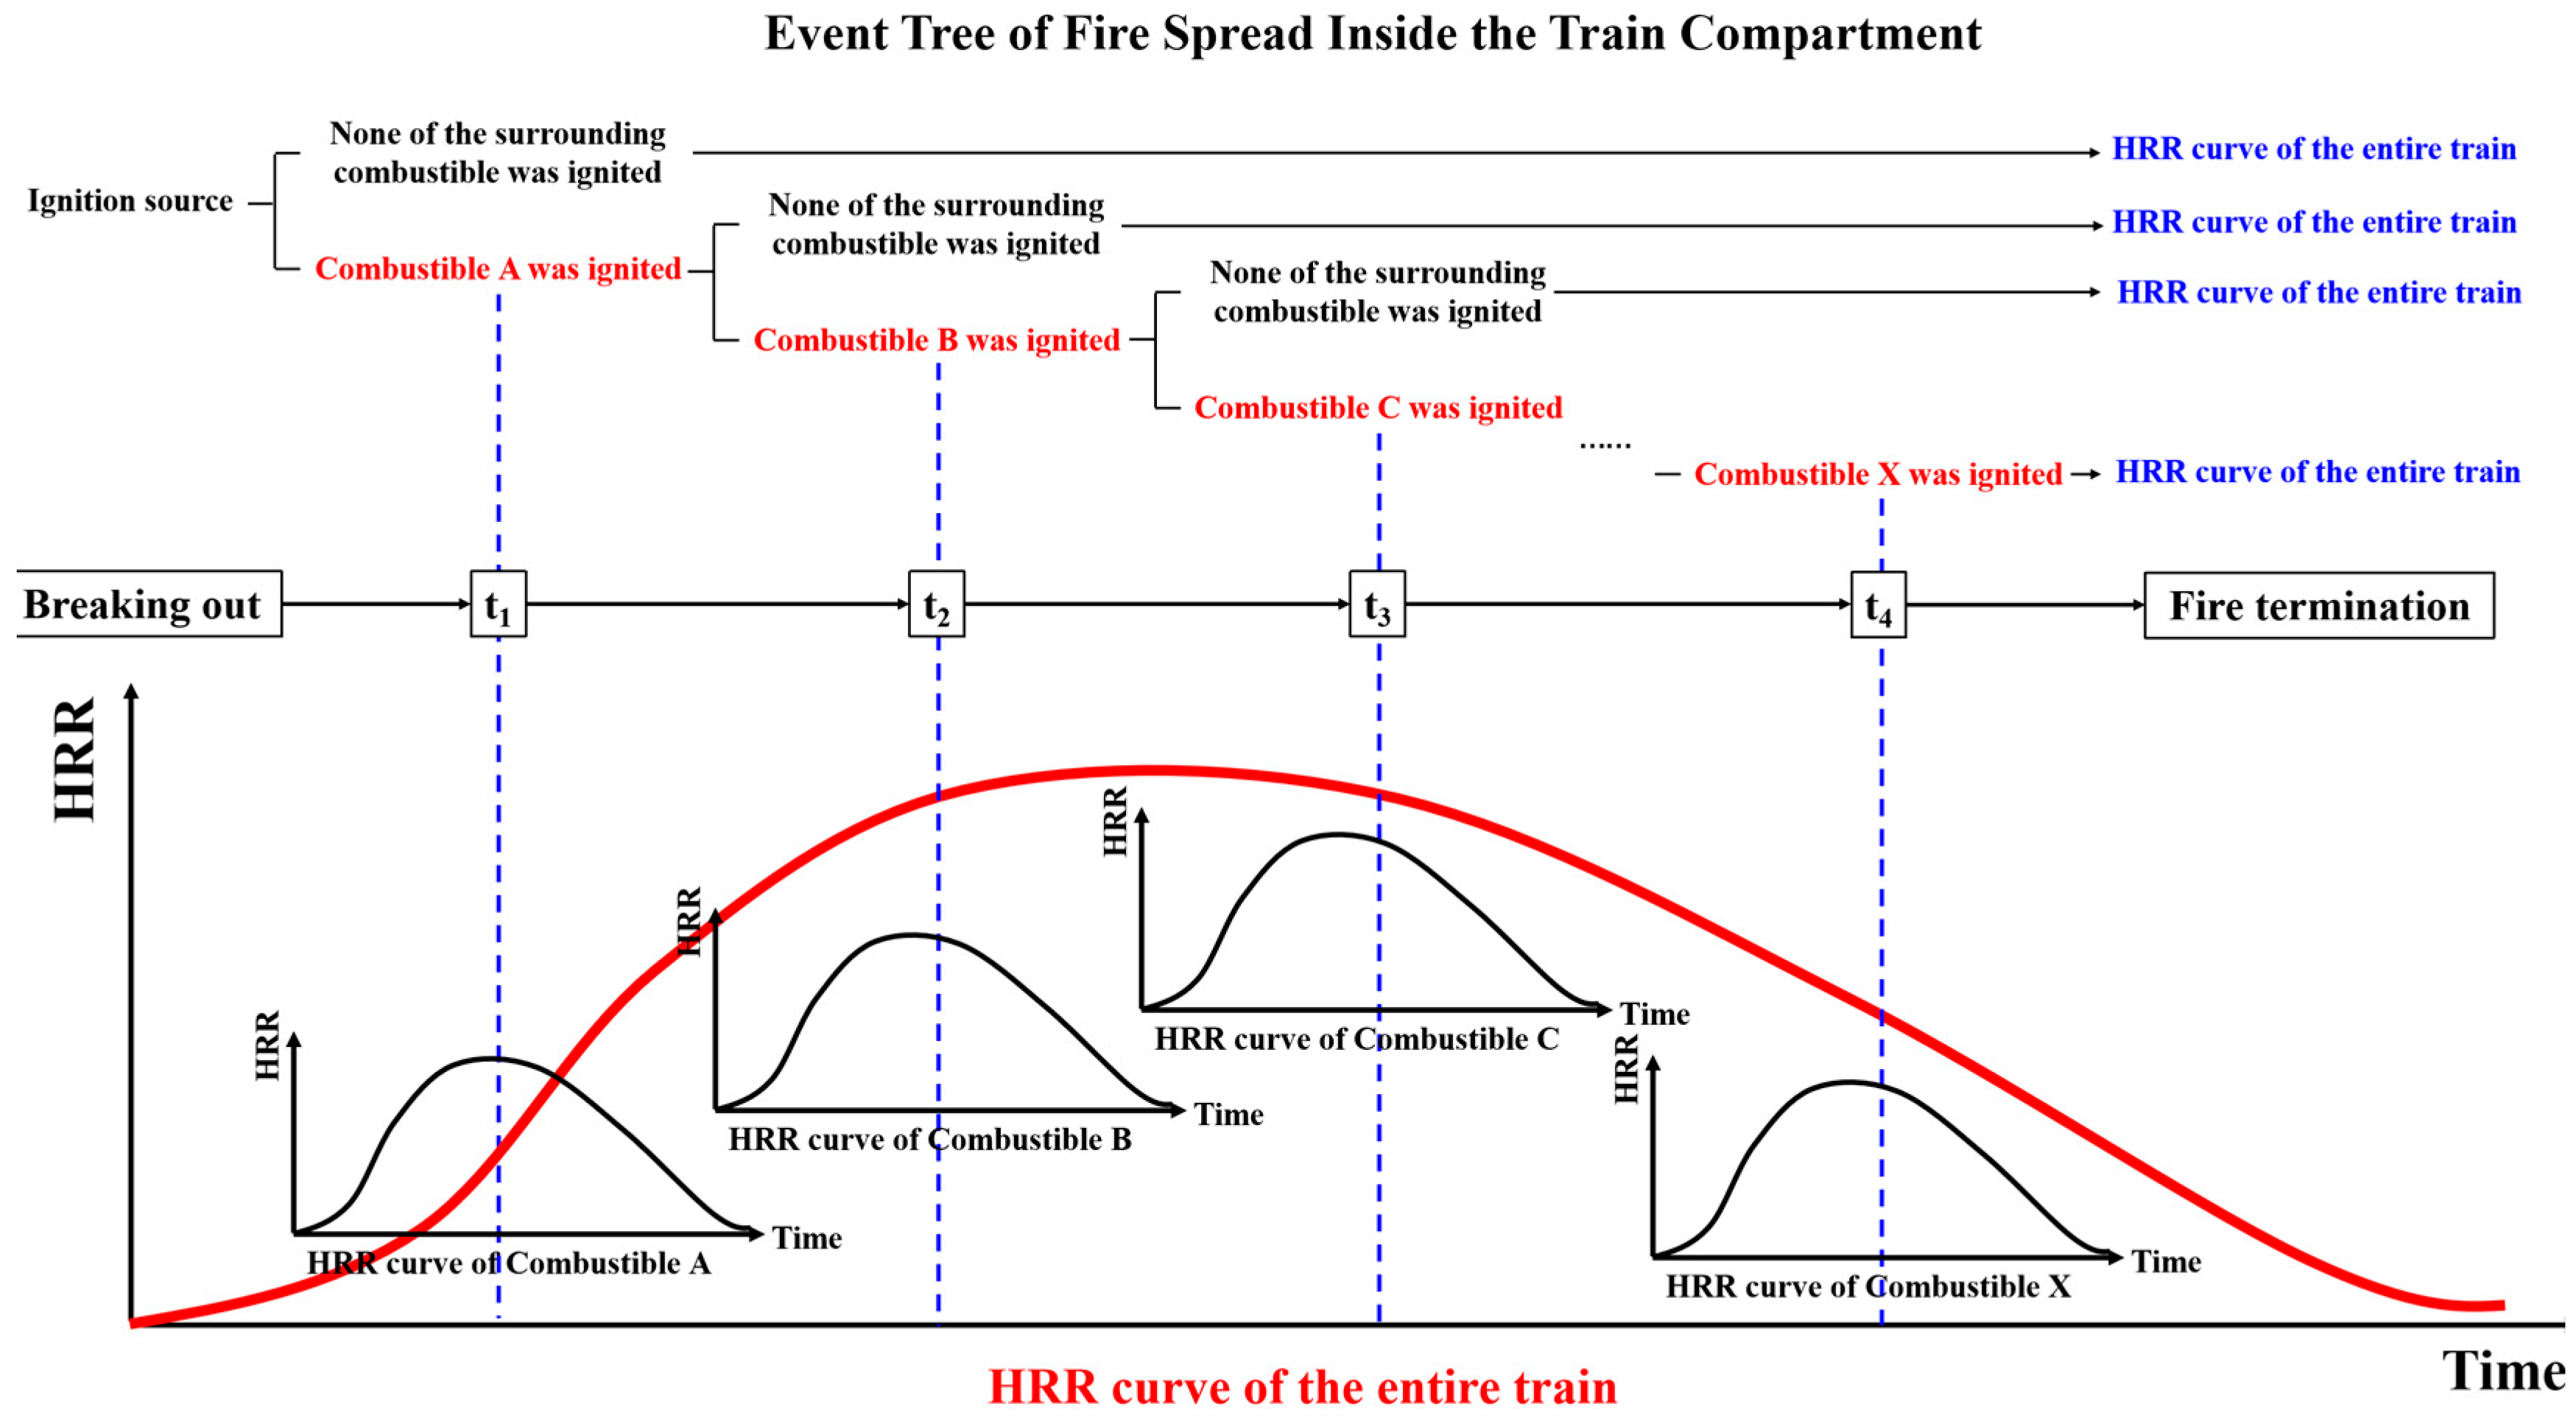
5. Discussions and Improvement of the Duggan Method

With the application of flame-retardant materials in subway trains, the applicability and rationality of the Duggan method, which is commonly adopted to determine the HRR of an entire-train fire, should be reexamined. In the Duggan method [33], to calculate the HRR of an entire-train fire, the fundamental assumption is that all combustibles inside the train compartment burn at the same time. The calculation procedure for HRR is as follows: first, the curve of the heat release rate per unit area (HRRPUA) of each non-metallic material inside the train compartment is measured using a furniture cone calorimeter; then, the total HRR curve of the train fire is calculated using the superposition method with all the HRR curves for all non-metallic materials. However, based on the research presented herein, this method is evidently not suitable for calculating the HRR of subway train fires.
Based on the experimental and simulation results discussed above, the fire was controllable under the standard fire scale (the luggage fire). In scenarios 1 and 2, the flame was confined in a small area and did not spread quickly to the surrounding combustibles. Even under the extreme fire scenario (gasoline pool fire with exposed winterproof material), the combustibles inside the train compartment were ignited gradually rather than burned at the same time. Therefore, the fundamental assumption in the Duggan method mentioned above did not conform to the fire development process in the subway carriage. To estimate the total HRR curve of the entire subway train, the ignition sequence of the combustibles inside the subway train is required. A simple revised model is shown in Figure 16. First, the event tree of the fire spread inside the train compartment is established according to the combustible ignition sequence. If the fire cannot ignite any combustibles or no more combustibles are left, then the HRR curve for the entire subway train is output. The combustible ignition sequence could be determined using the fire and ignition models. Similar to the traditional Duggan method, the HRR curve of each combustible is obtained using a cone calorimeter or furniture cone calorimeter. Then, accumulate all the HRR curves successively according to their ignition time derived from the event tree.

6. Conclusions

Fire assessments of a subway train were conducted using a full-scale experiment and numerical simulations. The main conclusions are summarized as follows:
(1)
Through the full-scale experiment, the seat that the fire source was placed on was barely ignited, and the power supply and control cables, as well as the network communication lines, worked normally during the standard luggage fire. The HRR curves of the standard luggage fire in the subway train were measured, and the maximum HRR was consistent with the standard HRR curve provided in EN 45545-1, but the fire duration was obviously shorter.
(2)
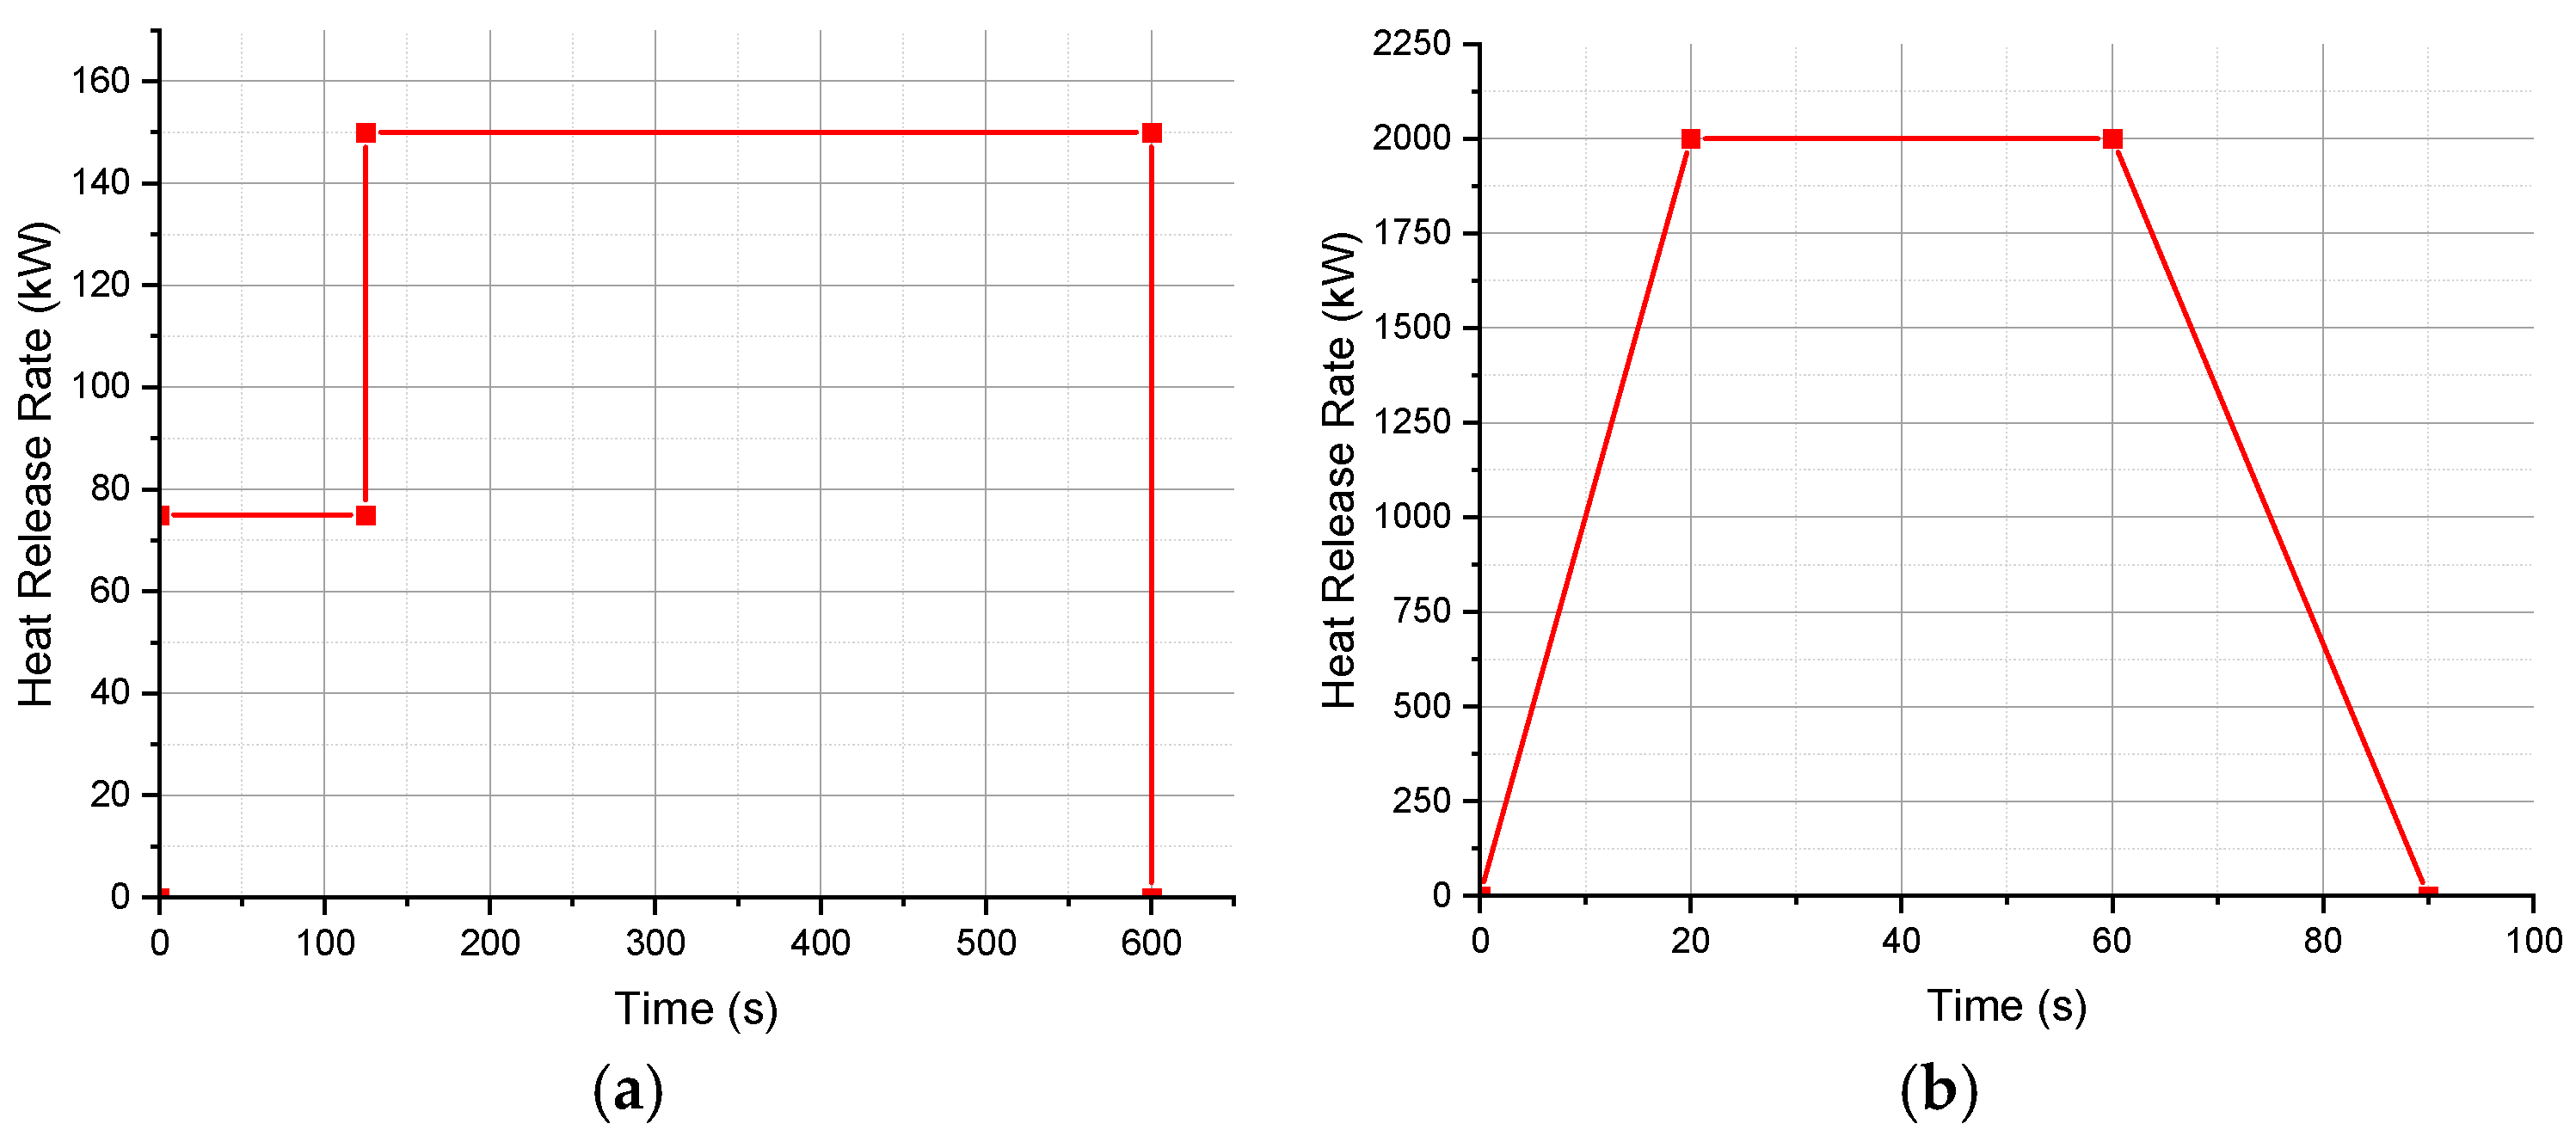
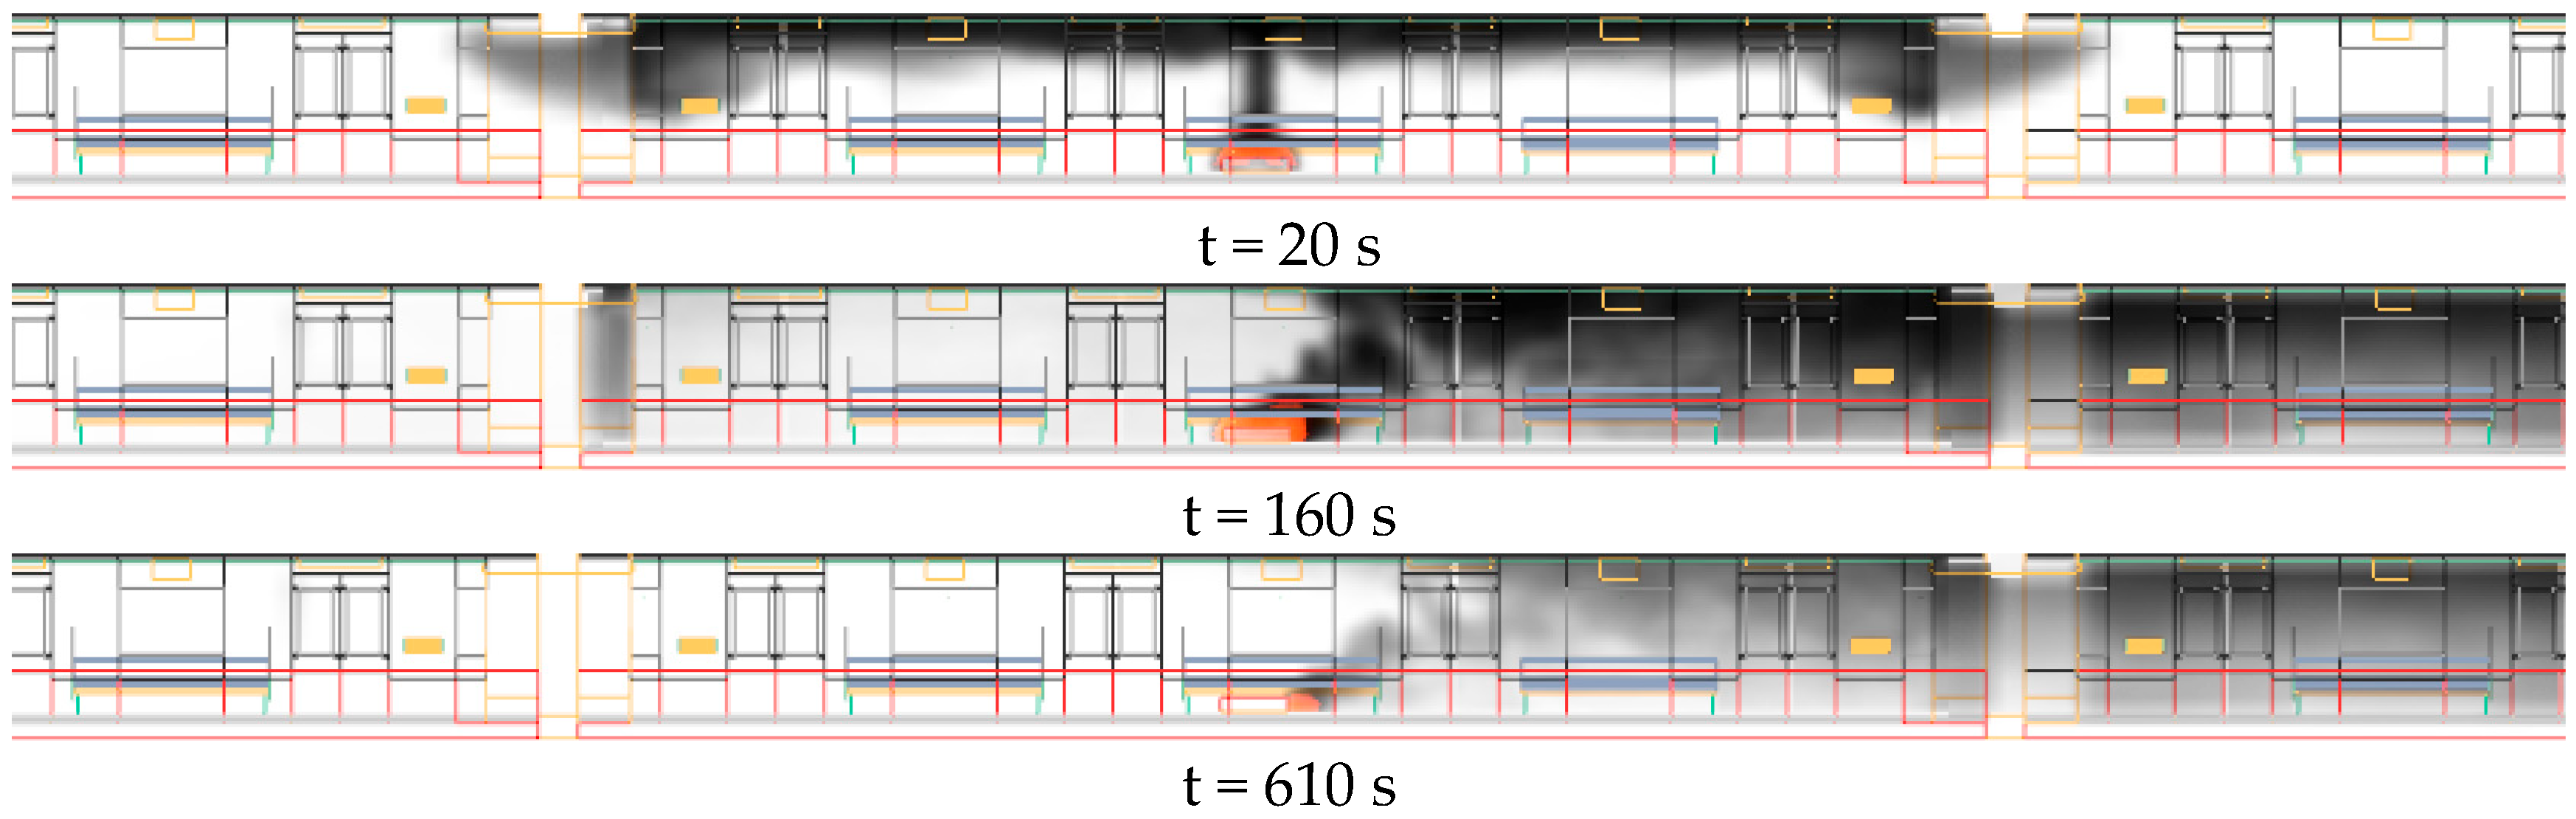
Two typical entire-train fire scenarios, namely luggage and gasoline pool fires, were investigated through numerical simulations. Under the luggage fire condition, only a small area of the combustible that directly contacted the tilted flame was ignited (without flame spread) when the subway train doors opened. Under the extreme fire scenario with a gasoline pool fire and exposed winterproof material, the side wall and the roof were ignited at about 20 s and continually spread to the adjacent compartment. The HRR reached 12 to 18 MW at about 80 s in these scenarios.
(3)
The Duggan method, which assumes that all combustibles inside the train compartment burn at the same time, did not conform to the current subway train fires based on the experimental and numerical simulation results. A simple revised frame is proposed herein.
The research results were obtained under specific test conditions and simulation parameters, and potential uncertainties may have arisen from the thermocouples’ positions, measurement tolerances, and data acquisition system errors. The reported heat release rates were derived through the oxygen consumption method using the smoke collection hood, where incomplete smoke collection may have affected the calculation result. It should be noted that all tests were conducted in winter with low environmental temperatures, which had a significant influence on the fire development and smoke spread in the subway carriage. The fire behavior of subway train compartments under elevated ambient temperature conditions warrants further systematic investigation.

Author Contributions

Conceptualization, X.W. and K.Z.; methodology, X.W. and B.Z.; software, Q.S. and D.L.; validation, X.W. and Q.L.; investigation, Q.S. and Q.L.; data curation, Q.L.; writing—original draft preparation, X.W. and K.Z.; writing—review and editing, X.W. and Q.L.; project administration, X.W.; All authors have read and agreed to the published version of the manuscript.

Funding

This research received no external funding.

Data Availability Statement

No new data were created in this study.

Conflicts of Interest

Authors Keshu Zhang and Qilong Shi were employed by the company CRRC Qingdao Sifang Co., Ltd. Author Bin Zeng was employed by the company JRCC Changzhou Co., Ltd. The authors declare no conflicts of interest.

References

  1. Meng, N.; Wang, Q.; Liu, Z.; Li, X.; Yang, H. Smoke flow temperature beneath tunnel ceiling for train fire at subway station: Reduced-scale experiments and correlations. Appl. Therm. Eng. 2017, 115, 995–1003. [Google Scholar] [CrossRef]
  2. Wang, J.; Yan, W.; Xu, H.; Zhi, Y.; Wang, Z.; Jiang, J. Investigation of the probability of a safe evacuation to succeed in subway fire emergencies based on Bayesian theory. KSCE J. Civ. Eng. 2018, 22, 877–886. [Google Scholar] [CrossRef]
  3. Liu, C.; Zhong, M.; Tian, X.; Zhang, P.; Xiao, Y.; Mei, Q. Experimental and numerical study on fire-induced smoke temperature in connected area of metro tunnel under natural ventilation. Int. J. Therm. Sci. 2019, 138, 84–97. [Google Scholar] [CrossRef]
  4. Chen, J.; Long, Z.; Wang, L.; Xu, B.; Bai, Q.; Zhang, Y.; Liu, C.; Zhong, M. Fire evacuation strategy analysis in long metro tunnels. Saf. Sci. 2022, 147, 105603. [Google Scholar] [CrossRef]
  5. Pan, L.W.; Lo, S.M.; Liao, G.X. Experimental study of smoke control in subway station for tunnel area fire by water mist system. Procedia Eng. 2011, 11, 335–342. [Google Scholar]
  6. Zhang, S.; Cheng, X.; Yao, Y.; Zhu, K.; Li, K.; Lu, S.; Zhang, R.; Zhang, H. An experimental investigation on blockage effect of metro train on the smoke back-layering in subway tunnel fires. Appl. Therm. Eng. 2016, 99, 214–223. [Google Scholar] [CrossRef]
  7. Cong, W.; Cheng, X.; Shi, L.; He, K. Study on smoke propagation characteristics of a carriage fire in longitudinally ventilated tunnel. Fire Technol. 2024, 60, 2231–2247. [Google Scholar] [CrossRef]
  8. Song, H.; Chen, Q.; Wu, Z.; Yao, H.; Lou, Z.; Bai, Z.; Li, J.; Yu, Y. Sensitivity Analysis of Influencing Factors of Fire SmokeTransport on Subway Station Platforms. Fire 2023, 6, 448. [Google Scholar] [CrossRef]
  9. Dong, S.; Wang, K.; Jia, C. A study on the influence of rail top smoke exhaust and tunnel smoke exhaust on subway fire smoke control. Sustainability 2022, 14, 4049. [Google Scholar] [CrossRef]
  10. Sajid, Z.; Yang, Y.; You, P.; Deng, H.; Cheng, X.; Danial, S.N. An Explorative Methodology to Assess the Risk of Fire and Human Fatalities in a Subway Station Using Fire Dynamics Simulator (FDS). Fire 2022, 5, 69. [Google Scholar] [CrossRef]
  11. Xu, W.W.; Zheng, J.H.; Yu, D.L. Review on Study of Personnel Evacuation in Subway Station Fires. Ind. Saf. Environ. Prot. 2015, 41, 65–69. (In Chinese) [Google Scholar]
  12. He, S.-J.; Li, J.; Chen, W.-W.; Ding, T.-C.; Zhi, J.-Y. The impact of subway car interior design on passenger evacuation and boarding/alighting efficiency. Sci. Rep. 2023, 13, 19682. [Google Scholar] [CrossRef] [PubMed]
  13. Jiang, H.; Yang, X.; Yang, Y.; Li, Y.; Pan, F.; Kang, Y.; Ding, J. Simulation-based heterogeneous pedestrian evacuation in subway stations. Int. J. Mod. Phys. C 2022, 34, 2350066. [Google Scholar] [CrossRef]
  14. Chen, S.; Tao, T.; Zhou, X.Y. Evacuation Study of Metro Compartment FireTypical Scenarios Based on Numerical Simulation. Urban Mass Tranist 2023, 26, 147–154. (In Chinese) [Google Scholar]
  15. Li, Z.Y.; Ingason, H. A new methodology of design fires for train carriages based on exponential curve method. Fire Technol. 2016, 52, 1449–1464. [Google Scholar] [CrossRef]
  16. Shi, C.; Zhong, M.; Chen, C.; Jiao, W.; Li, J.; Zhang, Y.; Zhang, L.; Li, Y.; He, L. Metro train carriage combustion behaviors—Full-scale experiment study. Tunn. Undergr. Space Technol. 2020, 104, 103544. [Google Scholar] [CrossRef]
  17. Xi, Y.J.; Lin, J.H.; Su, Y.C.; Tian, X.; Li, D. Subway car fire spreading rules and evacuation safety studies. J. Railw. Sci. Eng. 2017, 14, 619–625. (In Chinese) [Google Scholar]
  18. Zhang, L.; Wu, X.; Liu, M.; Liu, W.; Ashuri, B. Discovering worst fire scenarios in subway stations: A simulation approach. Autom. Constr. 2019, 99, 183–196. [Google Scholar] [CrossRef]
  19. Ju, W.; Wu, J.; Kang, Q.; Jiang, J.; Xing, Z. Fire Risk Assessment of Subway Stations Based on Combination Weighting of Game Theory and TOPSIS Method. Sustainability 2022, 14, 7275. [Google Scholar] [CrossRef]
  20. Peng, M.; Cheng, X.; Cong, W.; Yang, H.; Shi, L.; Yuen, R.; Zhang, H. Experimental investigation on the characteristics and propagation of fire inside subway train. Tunn. Undergr. Space Technol. 2021, 107, 103632. [Google Scholar] [CrossRef]
  21. Zhang, B.S.; Lu, S.X. Numerical Simulation and Analysis of Compartment Fire in Subway Train. Appl. Mech. Mater. 2012, 166–169, 2726–2730. [Google Scholar] [CrossRef]
  22. ISO 9705-1:2016; Reaction to Fire Tests–Room Corner Test for Wall and Ceiling Lining Products—Part 1: Test Method for a Small Room Configuration. ISO: Geneva, Switzerland, 2016.
  23. IEC 60331-1; (Edition 2.0), Tests for Electric Cables Under Fire Conditions–Circuit Integrity-Part 1: Test Method for Fire with Shock at a Temperature of at Least 830 °C for Cables of Rated Voltage up to and Including 0.6/1.0 kV and with an Overall Diameter Exceeding 20 mm. International Electrotechnical Commission: Geneva, Switzerland, 2018.
  24. IEC 60331-2; (Edition 2.0), Tests for Electric Cables Under Fire Conditions–Circuit Integrity-Part 1: Test Method for Fire with Shock at a Temperature of at Least 830 °C for Cables of Rated Voltage up to and Including 0.6/1.0 kV and with an Overall Diameter Not Exceeding 20 mm. International Electrotechnical Commission: Geneva, Switzerland, 2018.
  25. EN 45545-1:2013; Railway Applications-Fire Protection on Railway Vehicles-Part 1: General. BSI: London, UK, 2013.
  26. UIC 564-2:1991; Regulations Relating to Fire Protection and Firefighting Measures in Passenger Carrying Railway Vehicles or Assimilated Vehicles Used on International Services. BSI: London, UK, 1991.
  27. ARGE. ARGE Guideline–Part 2 “Firefighting in Railway Vehicles” Functional Assessment for the Efficiency of Fire Suppression and Extinguishing Systems in Passenger and Staff Areas, Electric Cabinets and in Areas with Combustion Engines; ARGE: Istanbul, Turkey, 2013. [Google Scholar]
  28. PyroSim User Manual. Available online: https://support.thunderheadeng.com/docs/pyrosim/2024-2/user-manual (accessed on 15 May 2025).
  29. McGrattan, K.; Hostikka, S.; McDermott, R.; Floyd, J.; Weinschenk, C.; Overholt, K. Fire Dynamics Simulator User’s Guide; NIST Special Publication 1019: Gaithersburg, MD, USA, 2013. [Google Scholar]
  30. Yang, Y.; Zhang, Q. Numerical Study on the Effect of Tunnel Slope on Smoke Exhaust Performance in Metro Tunnels. Fire 2025, 8, 28. [Google Scholar] [CrossRef]
  31. Jiang, H.L.; Teng, J.; Wang, D.; Zhou, L.; Chen, Y.R. Numerical Investigation of the Wan’an Bridge Fire and the Protection Effect of Intumescent Flame-Retardant Coatings. Fire 2025, 8, 184. [Google Scholar] [CrossRef]
  32. GB 51298-2018; Standard for Fire Protection Design of Metro. China Construction Industry Press: Beijing, China, 2013.
  33. Duggan, G.J. Usage of ISO 5660 data in UK railway standards and fire safety cases. In Fire Hazards, Testing, Materials and Products, Proceedings of A One Day Conference, Shropshire, UK, 13 March 1997; Rapra Technology Ltd.: Shrewsbury, UK, 1997; p. 3. [Google Scholar]
Figure 1. Schematic diagram of the experimental setup.
Fire 08 00259 g001
Figure 2. Arrangement of the experimental area: (a) arrangement of the subway carriage model; (b) locations of the thermocouples.
Fire 08 00259 g002
Figure 3. Loop structure for testing the integrity of the power supply and control cables.
Fire 08 00259 g003
Figure 4. HRR curves over time of the full-scale train fire experiment and EN 45545-1: (a) HRR in the experiment and typical stages; (b) comparison between the experiment result and a standard fire.
Fire 08 00259 g004
Figure 5. Burning images for the four typical stages: (a) stage 1; (b) stage 2; (c) stage 3; (d) stage 4.
Fire 08 00259 g005
Figure 6. Gas temperature curves over time measured throughout the experiment: (a) thermocouples near the side wall; (b) thermocouples in the sandwich construction for the cables.
Fire 08 00259 g006
Figure 7. Simulation model of the entire train and the tunnel: (a) model of the entire train; (b) details inside the train compartment; (c) model in the validation test; (d) cross-section of the tunnel.
Fire 08 00259 g007
Figure 8. HRR curves of the luggage and the gasoline pool fires [15]: (a) luggage fire; (b) gasoline pool fire.
Fire 08 00259 g008
Figure 9. HRR curves over time of the full-scale train fire.
Fire 08 00259 g009
Figure 10. Gas temperature curves over time derived through the simulation: (a) thermocouples in the fire area; (b) thermocouples in the sandwich construction for cables.
Fire 08 00259 g010
Figure 11. HRR in fire simulation scenario 1–4. (a) Fire scenarios 1 and 2; (b) Fire scenarios 3 and 4.
Fire 08 00259 g011
Figure 12. Smoke and flame spread inside the entire train compartment in fire scenario 2.
Fire 08 00259 g012
Figure 13. Smoke and flame spread inside the train compartment in fire scenario 4.
Fire 08 00259 g013
Figure 14. Temperature distribution inside the train compartment in fire scenario 2 (Unit: °C).
Fire 08 00259 g014
Figure 15. Temperature distribution inside the train compartment in fire scenario 4 (Unit: °C).
Fire 08 00259 g015
Figure 16. Calculation principle of the revised Duggan method of calculating entire train’s HRR curve.
Fire 08 00259 g016
Table 1. Basic information about the simulations.
Basic InformationValidation SimulationSimulations of Entire Subway Train
Turbulence solverSmagorinsky large eddy model
Ambient temperature16 °C20 °C
Ambient pressure1.01325 × 105 Pa1.01325 × 105 Pa
Mesh size0.05 × 0.05 × 0.05 m0.10 × 0.10 × 0.10 m
Table 2. Main combustible materials and their key parameters in the simulation.
StructureMaterial and ThicknessDensity/kg·m−3Specific Heat/kJ·kg−1·K−1Heat Conductivity/W·m−1·K−1EmissivityIgnition Temperature/°C
Driver’s cageCountertopFiberglass (4 mm) + paint (240 μm)32430.780.180.74294
Wall and roofPrepreg (4 mm) + paint (240 μm)10241.450.170.89599
WindowGlass (6 mm) + PVB (5.32 mm) + glass (4 mm)24800.700.870.90400
Passengers’ compartmentFloor clothRubber (3 mm)35031.470.080.46216
SeatFiberglass19501.180.510.74508
LampshadePolycarbonate sheet (4 mm)55610.970.200.59237
WindowGlass (6 mm) + hollow layer (21 mm) + glass (5 mm)24800.700.870.90400
Wall and roofAluminum plate (3 mm) + paint (240 μm)27000.90235.000.80400
Table 3. Details of each fire scenario for simulations.
Experiment No.Simulation AreaType of the Fire SourceLocation of the Fire Source
S-0Experimental areaLuggage fireOn the seat
S-1Entire trainLuggage fireOn the seat
S-2Entire trainLuggage fireOn the floor
S-3Entire trainGasoline pool fireOn the seat
S-4Entire trainGasoline pool fireOn the floor
Table 4. Comparisons of the maximum temperatures in the experiment and simulation.
Measure Point1-11-21-31-41-52-12-22-32-42-5
Tp (°C)E 134.5032.2070.8049.4037.6051.2020.9026.9019.9019.00
S 227.3041.8586.5450.6644.7249.5418.6624.0016.0316.07
Relative error (%)20.930.022.22.618.93.210.710.819.415.4
1 Temperature value measured in the experiment. 2 Temperature value obtained through the simulation.
Disclaimer/Publisher’s Note: The statements, opinions and data contained in all publications are solely those of the individual author(s) and contributor(s) and not of MDPI and/or the editor(s). MDPI and/or the editor(s) disclaim responsibility for any injury to people or property resulting from any ideas, methods, instructions or products referred to in the content.

