Abstract
Fire safety is one of the critical concerns for the design and construction of modular structures. The lack of understanding of cavity fire spread in modular construction could create variations in the fire performance of structural members. This study aimed to assess the impact of cavity fire spread in modular buildings initiated by a room fire using validated fire dynamics and structural numerical models. A comprehensive parametric study was conducted to identify critical thermal conditions affecting adjacent structural members under plausible cavity fire scenarios. The identified critical cavity fire thermal conditions were used to examine the structural performance of cold-formed steel intermediate column specimens while varying geometric configurations, material properties, and boundary conditions. The results highlighted two distinct phases of restrained thermal expansion and lateral deformations under material yielding and buckling, resulting in the loss of structural integrity. The restrained thermal expansion significantly increased axial/restraint forces, reaching up to 155% of the initial load. This behavior decreased axial load capacity by 2.4% to 35% of the ambient capacity. Further, the study identifies a requirement for designing the intermediate columns and the connected intermodular connections for increased design action equivalent to 56% of the service load.
1. Introduction
Modular buildings constructed by assembling prefabricated volumetric units (modular units) have become a sustainable solution [1,2] for the escalating demand for human settlement. These modular buildings often use cold-formed steel hollow members for the structural system (Figure A1 in Appendix A), including corner or intermediate columns, beams, and intermodular connections [3,4]. Despite these buildings’ structural and sustainability performance, their fire performance has certain uncertainties. Recent fires [5,6] have shown that intermodular cavities (Figure A2 in Appendix A), which accommodate structural connections, service lines, and assembly tolerances, can allow fire and smoke to spread. Therefore, these cavities must be sealed with fire stops and cavity barriers [7]. However, limited inspection accessibility, poor workmanship, and alignment issues [8] can undermine their effectiveness, leading to fire ingress to intermodular cavities (Figure A3 in Appendix A).
The thermal conditions of a cavity fire have been identified to be critical compared to an open fire [9]. Therefore, the structural integrity of the directly exposed structural components (Figure A2 in Appendix A) is critical. Fire incidents at Luleå, Klintbacken, Sweden in 2013 [9] and on Shetland Island, Scotland in 2019 and 2020 [10,11] solidify this hypothesis. Moreover, a review of temperature variations within a combustible ventilated facade cavity has revealed that they can surpass the standard fire curve during the first five minutes of the fire [12]. However, the fire conditions in modular buildings’ non-combustible and unventilated cavity spaces can vary from those in ventilated cavities. Several other researchers have studied cavity fires considering fire within two vertical parallel planes [9,13,14,15]. Such experimental studies up to 40 kW cavity fire demonstrated significant heat exposure on the cavity boundaries. However, these studies do not consider the realistic fire/heat spreading into the cavity. These variations limit the usage of existing cavity fire thermal condition data to identify the performance of members exposed to intermodular cavity fires.
Paneni [16] and Shan and Pan [17] have used numerical modelling approaches for the structural fire interaction of modular steel structures. Under compartment fire scenarios, it has been shown that modular steel structural elements undergo thermal expansion and bowing, resulting in structural failure [16,17]. Moreover, the study by Paneni [16] highlighted that due to the restraining effect of intermodular and intramodular connections, these connections and members can undergo different stress conditions, causing local failures. These two studies considered compartment fire scenarios, assuming that structural elements would be fully exposed to the fire. However, under the cavity fire, the fire exposure is limited to one face of a structural component, especially a column. Therefore, the variations in response to localized heating are not captured. Similarly, most existing experimental and numerical research on the fire performance of cold-formed steel column elements [18,19,20,21] also studies the behavior under a uniform temperature field throughout the column height, which is limited to a compartment fire scenario. The study results by Zhang et al. [22], which consider localized fire, verify the variation in failure shapes compared to uniformly heated columns [18,19,20,21]. Under a localized fire, the failure initiates closer to the bottom support of the column. However, with uniformly heated columns, failure occurs at the center of the column. However, in the study by Zhang et al. [22], the localized fire is exposed to the four sides of the column, which is not the case under a cavity fire scenario. Studies on hot-rolled “I” and “H” steel sections with nonuniform heating conditions [23,24] have shown variations compared to the structural fire response under uniform heating conditions. Thus, cold-formed steel sections, having lower steel thicknesses, can be critical under nonuniform heating conditions. Studies [25,26] on cold-formed steel elements under a thermal gradient provide indications for this hypothesis. These findings have demonstrated that thermal bowing, material degradation, and additional moment generation can significantly impact column behaviors. However, these studies have only been limited to open sections, and the thermal gradient has only been across the cross-section. Maraveas [27] reviewed studies on the fire performance of cold-formed steel elements and highlighted the lack of studies on fire performance of cold-formed closed sections and the effect of a thermal gradient, as a thermal gradient can lead to local buckling. Therefore, a knowledge gap exists in identifying the realistic fire response of cold-formed hollow steel sections used in modular buildings as columns under localized cavity fire exposure.
To fill this gap, this study aimed to assess the impact of cavity fire spread in modular buildings initiated by a room fire on the structural performance of intermediate columns of modular buildings made of hollow, cold-formed steel sections. The innovation of this study has focused on addressing realistic structural fire interactions specific to cavity fire scenarios by integrating fire dynamics simulations with structural analysis. Such a coupled approach allows for a more realistic representation of the mechanical response of columns under nonuniform heating conditions, which are not captured in traditional compartment fire evaluations. Therefore, the novel assessment of column behavior under realistic cavity fire exposure in this study provides critical insights into the structural response of modular structures under cavity fire. Such assessments are essential to understand robustness requirements and fire-resilient design approaches in modular steel structures. To support this, an experimental investigation was conducted on a scaled prototype of a modular building to observe fire ingress into an intermodular cavity. Based on the experiment, a validated numerical model was developed using the Fire Dynamics Simulator (FDS) [28]. This validated model was expanded to conduct a comprehensive case study on fire entering an intermodular cavity. The resulting thermal data were utilized to evaluate the structural fire performance of intermediate columns in modular buildings using a structural fire numerical model validated against data available in the literature.
2. Materials and Methods
2.1. Fire Dynamics Simulation
2.1.1. Experimental Program
The experimental setup used to observe fire ingress and spread through an intermodular cavity is illustrated in Figure 1. This experiment was specifically designed to observe fire ingress behavior in the intermodular cavity, serving as a benchmark for validating fire dynamics modelling techniques. Therefore, structural loading conditions were excluded, and deformations of the test frame were not monitored during the fire test to maintain a focused investigation of fire behavior’s thermal and fluid dynamics aspects.
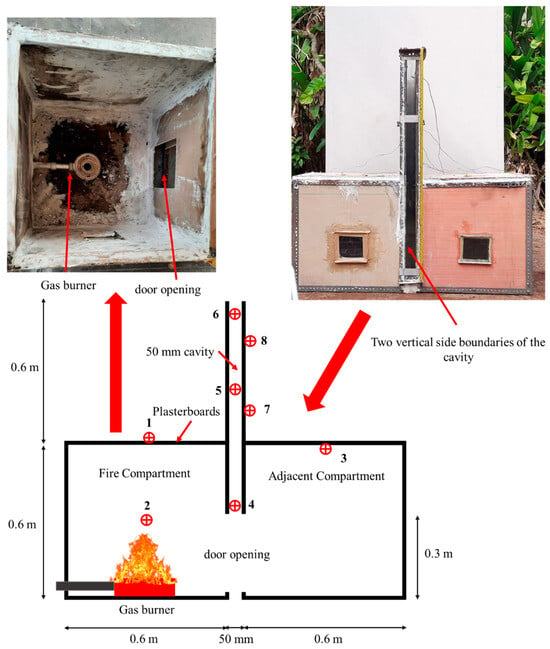
Figure 1.
Test setup used to simulate the cavity fire scenario (red circles show the positioning of thermocouples).
The experiment replicates a fire scenario in which a vertical intermodular cavity is exposed to fire due to the failure of cavity barriers, and fire stops around an opening between adjacent modular units. The most common module compartment dimensions used in the industry are 3 m × 3 m × 6 m [29,30]. This experiment used a 1:5 scale model of a modular unit (0.6 m × 0.6 m × 0.6 m), with its length halved to overcome safety and resources constraints. The cavity width between the two modules was maintained at 50 mm. The side boundaries of the cavity were left open to allow airflow, representing a case of improperly sealed cavity boundaries. The two compartments represented modular units with closed windows and a 0.2 m × 0.3 m door opening. The walls, floor, and ceiling of the modular unit were constructed from 10 mm thick plasterboard. The fire within the compartment in Figure 1 was set up using a circular gas burner, 125 mm in diameter, placed at the center of the fire compartment. This burner was fueled with a domestic-grade liquid petroleum gas mixture (propane:butane = 30:70). During the test, eight type-K thermocouples were used to monitor gas and surface temperature variations. The positioning of these thermocouples is shown in Figure 1, with additional details provided in Table 1.

Table 1.
Thermocouple details and locations used in the experiment.
During the fire test, under negligible wind conditions, an ambient temperature of 28.75 °C, relative humidity of 83%, and an atmospheric pressure of 1.008 × 10⁵ Pa were measured. The fire source’s heat release rate (HRR) was determined using gas flow measurements obtained from a diaphragm gas flow meter and a pressure gauge adjusted for the observed ambient pressure and temperature. In this calculation, the heats of combustion for propane and butane were considered as 46.3 MJ/kg and 45.7 MJ/kg, respectively [31]. Based on these parameters, the calculated heat release rate of the fire source was determined to be 16 kW.
The key stages of the experiment are illustrated in Figure 2a. Flames briefly entered the intermodular cavity at approximately 2 min (120 s) after ignition. By 7 min (420 s), the flame ingress into the cavity became more consistent. Around 10 min (600 s) into the experiment, flames within the cavity extended to its upper regions, indicating intensified flame spread. Between 10 min (600 s) and 13 min (780 s), visible cracks appeared on the plasterboard above the opening (Figure 2b), attributed to direct exposure to flames. By 14.45 min (895 s), flames were observed to exceed the top of the cavity, accompanied by signs of plasterboard detachment within the fire compartment. The experiment concluded at 18 min (1100 s) due to the significant degradation of the plasterboard in the fire compartment.
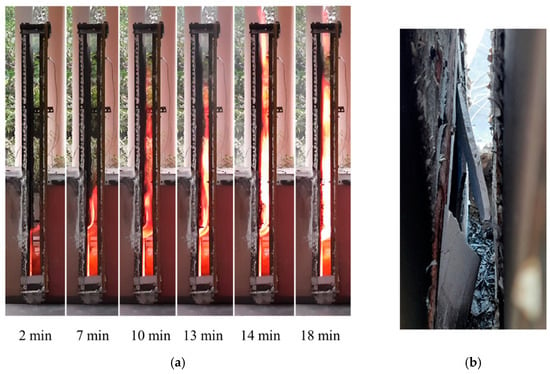
Figure 2.
Observations from the experiment: (a) evolution of the flame penetration; (b) the view of the plasterboard cracks at the end of the experiment.
The temporal variation in gas (gt) and surface (wt) temperatures recorded during the test is presented in Figure 3. Gas temperatures within the fire compartment and the adjacent compartment gradually increased, reaching 555 °C and 225 °C, respectively. Within the intermodular cavity, the maximum gas temperature was 732 °C at a height of 350 mm, while the maximum temperatures at 900 mm and 1200 mm heights were approximately 300 °C. The temporal profiles of gas temperatures at 900 mm and 1200 mm heights exhibited similar trends, attributable to the relatively small vertical separation between these thermocouple positions.
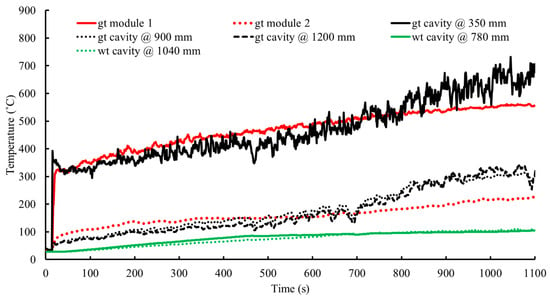
Figure 3.
Gas temperature (gt) and wall/surface temperature (wt) variation during the experiment.
During the experiment’s initial phase, the cavity’s gas temperatures increased gradually until the 7th minute (420 s). Subsequently, as flame ingress became consistent, the rate of temperature increase within the cavity accelerated by approximately 9%. By the experiment’s conclusion, the unexposed surface temperatures of the cavity boundary at heights of 780 mm and 1040 mm reached 100 °C, underscoring the progressive thermal impact on the cavity boundary during the fire exposure.
2.1.2. Numerical Model Development and Validation
The Fire Dynamics Simulator (FDS) version 6.8.0 [28], supported by PyroSim preprocessing software (version 2024.2) [32], was utilized to simulate the cavity fire scenario observed in the experimental test. This FDS software (version 6.8.0) models smoke and heat transport from fires as low-speed, thermally driven flows with numerical solutions based on mass, momentum, energy, and state conservation principles. Livkiss et al. [33] also successfully used the same theory and principles to model a fire within a narrow vertical cavity.
The geometry of the numerical model developed to simulate the experiment is illustrated in Figure 4. The domain was sized at 1.29 m × 0.64 m × 1.28 m to match the setup’s dimensions. Solid obstruction elements were used to model the walls, floors, ceilings (thin element), and the gas burner. To enable heat transfer, these walls, floors, and ceilings were modelled with a “layered” surface type with “exposed” backing [32,33]. The combustion of gas species emitted by the burner was simulated using the complex stoichiometry approach [34]. The thermal behavior of materials was incorporated using temperature-dependent material properties, including conductivity, specific heat capacity data, and emissivity data, sourced from the literature [35], along with a material density of 850 kg/m3. All numerical domain boundaries, except the bottom, were left open to ambient environmental conditions. Gas and wall temperatures at corresponding positions in the experiment were determined using gas-phase and solid-phase temperature measuring devices.
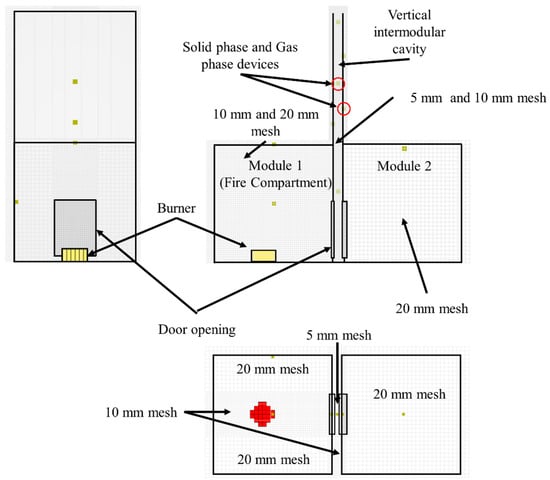
Figure 4.
Numerical model representation of the experimental setup.
Based on Livkiss et al.’s [33] recommendation of a mesh size approximating one-tenth of the cavity width, a uniform cell size of 5 mm (aspect ratio = 1) was adopted for the central cavity portion. A coarser uniform cell size of 10 mm was applied to the remainder of the cavity. The fire compartment utilized a 10 mm mesh near the door opening and a 20 mm mesh elsewhere, while the second module was modelled with a uniform 20 mm mesh size.
This numerical model accounted for conduction, convection, and radiation heat transfer. Convective heat transfer between the cavity walls and air was simulated using the logarithmic model as recommended by Livkiss et al. [33], while radiative heat transfer was computed using the radiation transport equation [36]. For the solving method, the large eddy simulation method was adopted, coupled with the Van Driest near-wall turbulence model [33,36].
The results from this developed numerical model are compared with the experimental data to validate the cavity fire modelling technique (Figure 5). In this numerical model, plasterboard failures (cracking and falling off) are not considered due to the complexity of simulating that behavior. Moreover, even though smoke and hot gas leakage at the edges of the wall and ceiling boundaries were observed during the experiment, for simplicity, the numerical model considers the compartments as fully sealed throughout the duration, except for the door openings. Therefore, as the fuel is released from the burner, the pressure within the compartment increased gradually, pushing flames toward the adjacent fire compartment. However, in the experiment, due to the smoke and leakage of hot gases from the fire compartment and the plasterboard cracking and falling off, the pressure within the fire compartment was released without pushing the flames too much toward the second compartment. Therefore, the gas temperature within the fire compartment in Figure 5a matches the experimental data up to 600 s until the flame is significantly pushed toward the cavity. Later, the flame shifted toward the second compartment, which is reflected in Figure 5b as the temperature rises after 800 s. Despite this limitation, the numerical model effectively captured the gas temperature variation within the cavity at different heights and surface temperatures of the unexposed wall, which is the focus of the study. This is because the thermal condition within the cavity relies on whether the flame within the cavity exists or not. In the model, the flame was within the cavity until around 1000 s. Therefore, unlike the temperature inside the compartment, the temperature results within the cavity showed agreement (Figure 5c–g) with the experiment until around 1000 s. Thereafter, the reduction in gas temperature (Figure 5c–e) and the gradient reduction in wall temperatures (Figure 5f,g) reflect the reduction in flaming within the cavity due to the flame being further pushed toward the second compartment. Regarding the thermal properties of plasterboard, the usage of the literature data in the absence of actual testing data of the plasterboard samples is the reason for the variations in the gradients of the surface temperature curves. Therefore, the results underscore the reasonable efficacy of the FDS modelling technique in simulating fire dynamics within intermodular cavity spaces, particularly during fire ingress scenarios. However, there are limitations in incorporating plasterboard cracking and falling off as well as realistic hot gas leakages from the fire compartment.
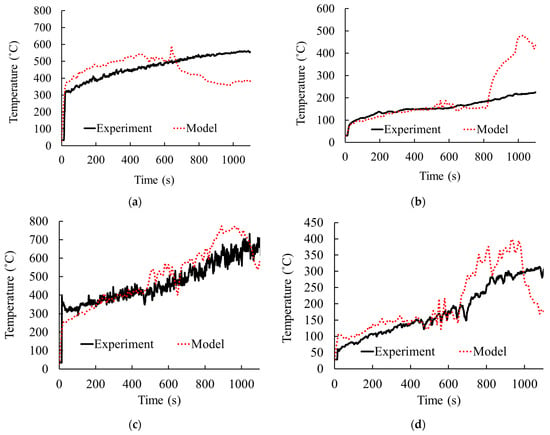
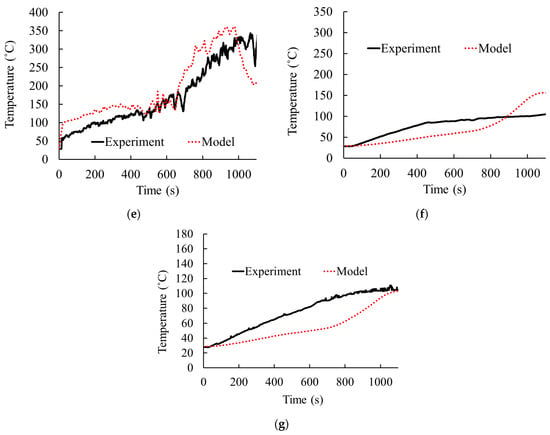
Figure 5.
Comparison of gas temperature (gt) and wall temperature (wt) variations between the experiment and numerical model: (a) gt fire compartment; (b) gt adjacent compartment; (c) gt cavity at 350 mm; (d) gt cavity at 900 mm; (e) gt cavity at 1200 mm; (f) wt cavity at 780 mm; (g) wt cavity at 1040 mm.
2.2. CFS Column Structural Fire Simulation
2.2.1. Sequentially Coupled Thermo-Mechanical Simulation
The parametric study on structural response (Section 2.3.2) in this research employed advanced finite element software (Abaqus version 2023) [37] to perform a sequentially coupled thermo-mechanical analysis, simulating the structural response of steel hollow section (SHS) columns under cavity fire conditions. This modelling approach was initially validated against experimental data from Balarupan [18]. This section discusses the details of the modelling technique. Under this sequentially coupled thermo-mechanical analysis, three types of simulations were conducted. Those included a heat transfer analysis, elastic buckling analysis, and a nonlinear static analysis.
The SHS column, with a length of 3 m, was generated by extruding its cross-section based on centerline dimensions. The column geometry was assigned appropriate section thickness and material properties. The material properties incorporated for the heat transfer analysis were density (7850 kg/m3) and temperature-dependent thermal conductivity, specific heat capacity, and thermal expansion coefficients [38]. Elastic and plastic material behavior was defined using stress-strain curves for G350 and G450 steels up to 900 °C, based on the model proposed by Imran et al. [39]. This model, derived from experimental data, has demonstrated better accuracy than design standards, which are either overly conservative or potentially unsafe.
For the mesh of the model, a global mesh size of 5 mm × 10 mm, with refinement up to 2 mm × 10 mm at the curved edges, was considered based on the sensitivity analysis conducted by Balarupan [18]. The four-node heat transfer quadrilateral shell (DS4) elements were used to define the element behavior in the heat transfer analysis. Similarly, the four-node doubly curved thin or shell S4R elements [18] were used in the buckling and nonlinear static analyses.
Depending on the analysis type, different boundary conditions were enforced. In the heat transfer analysis, the heat transfer into the column at the fireside (hot flange) and the heat dissipation at the unexposed side (cold flange) were defined using data obtained from the FDS simulation (Section 2.3.1). The data were taken at 750 mm intervals, and the averaged data were assigned to the column’s four regions (750 mm length segments). Figure 6 illustrates the assignment of boundary conditions. The incident radiative heat flux data, gas temperature, and heat transfer coefficients obtained from the FDS simulation defined the radiative and convective heat transfer on the hot flange. Conservatively, the heat transfer of the cold flange, exposed to the modular compartment (non-fire compartment above the fire compartment), was modelled with an ambient temperature of 20 °C, an emissivity of 0.8, and a heat transfer coefficient of 5 Wm−2K−1 [31]. The other two sides were considered insulated surfaces due to the usage of non-load-bearing panels.
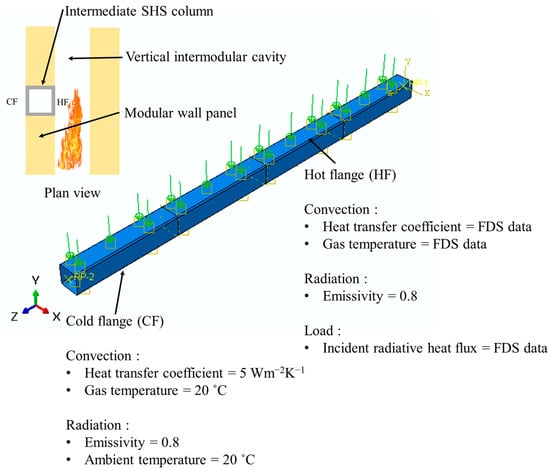
Figure 6.
Boundary conditions used in heat transfer analysis under the parametric study (Section 2.3.2).
In the buckling and nonlinear static analyses, support boundary conditions were added to the column’s top and bottom (Figure 7). These were applied to two reference points at the centre of the cross-section, which was constrained with the edge nodes of the bottom and top cross-sections using constraint type MPC (multi-point constraint). To account for the realistic restrained thermal expansion, the vertical displacements were restricted at the top boundary condition for both pinned and fixed support fixity conditions. This was done by applying a constant downward top displacement, accounting for the load ratios selected for the column load in the static analysis. Rotational and translational degrees of freedom at these top and bottom supports were restrained or released depending on the pinned or fixed support condition. To account for the fire condition, the temperature distribution within the column was defined as a predefined field at nodal points. This was assigned using the nodal temperature output from the heat transfer analysis. Separate elastic buckling analysis was conducted to obtain the mode shapes. Then, the initial geometric global imperfections of the column were modelled using the first buckling mode shape with a scale factor of length/1000. In addition to these loading and boundary conditions, the closed cold-formed sections can have residual stresses as membrane and flexural residual stresses [40]. However, the membrane residual stresses were neglected, as suggested by Rokilan and Mahendran [40], due to their low impact on buckling behaviour. The flexural residual stresses were already included in the material model proposed by Imran et al. [39] study.
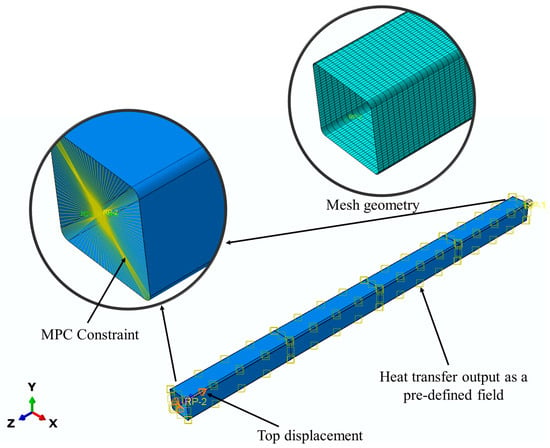
Figure 7.
Boundary conditions used in the parametric study’s structural (sequentially coupled thermo-mechanical) analysis (Section 2.3.2).
2.2.2. Validation of Modelling Techniques
To validate the modelling approach of sequentially coupled thermo-mechanical analysis, the experimental data of Balarupan [18] were used. Balarupan [18] conducted buckling tests for fixed supported 1.8 m long cold-formed SHS columns (G450 Steel) up to 700 °C (20, 200, 400, 500, 600, and 700 °C) with a uniform temperature distribution. SHS sections of 65 × 65 × 3 and 65 × 65 × 6 were used in that experiments. Since the columns were heated to a uniform temperature, a separate heat transfer analysis was unnecessary, and the uniform temperature boundary condition was applied. A nonlinear analysis was performed using the modified Riks method [37] to determine the ultimate buckling load. Ultimate buckling load and load vs. displacement plots were obtained to validate the numerical simulation with the experimental results. The summary of the ultimate buckling capacity is given in Table 2. The comparison of some load vs. displacement plots is presented in Figure 8. The plots of the modelled behavior closely predicted the experimental behavior. However, a change in slope was observed toward the ultimate load in the load versus axial shortening curves from the experiments. This variation is due to the inelastic deformation of the cement-fiber insulation sheets at elevated temperatures used in the experiment between the loading jack and the column supports. Figure 8c presents the deformation of the 65 × 65 × 3 section at 600 °C obtained from the numerical simulation in this study. This deformation shape is consistent with the experimental observations found in the research done by Balarupan [18]. Based on these comparisons, it was decided that the numerical modelling approach can be used to extend the study on the response of the columns under the cavity fire thermal conditions.

Table 2.
Comparison of global buckling capacity under fire.
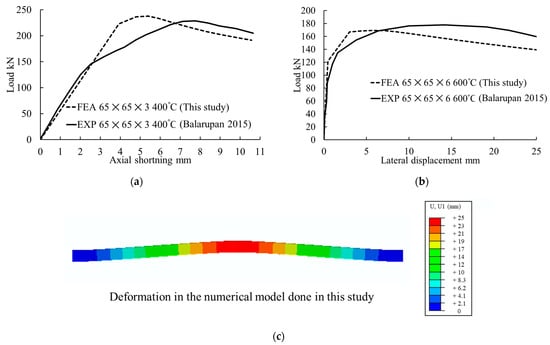
Figure 8.
Comparison of the results of the numerical model with the experimental results of Balarupan [18]: (a) load vs. axial shortening of a 65 × 65 × 3 section at 400 °C; (b) load vs. lateral deflection of a 65 × 65 × 6 section at 600 °C; and (c) failure mode of 65 × 65 × 3 section at 600 °C.
2.3. Parametric Analysis
Two detailed parametric analyses were conducted to determine the effects of fire spread characteristics on strength performance and structural integrity of boundary members near the cavity, as described in Section 2.3.1 and Section 2.3.2.
2.3.1. Fire Scenario Analysis
After validating the FDS modelling technique (Section 2.1.2), it was extended to conduct a case study involving various fire scenarios. These scenarios aimed to examine the infiltration of fire/heat into the vertical intermodular cavity and its impact on the intermediate column. Based on the typical dimensions of general modular units, a module size of 3 × 3 × 6 m [29] was considered. A design fire curve (Figure 9a) was derived from a 466 kW/m2 heating power and a 560 MJ/m2 combustible load corresponding to an office occupancy level [41]. This fire curve considers up to the onset of the decaying phase, and the maximum heat release rate can be justified with real fire scenario data [42]. Under this fire curve, the gas temperature at the mid-height of the fire compartment is shown in Figure 9b.

Figure 9.
Design fire curve used for the fire simulation: (a) heat release rate of the fire source; (b) gas temperature at the mid-height of the fire compartment.
This study analysed three fire entry scenarios into a 50 mm vertical intermodular cavity caused by missing or defective firestops or cavity barriers. These scenarios and their respective configurations are summarized in Table 3 and illustrated in Figure 10. In Figure 10, the path of fire/heat entering the cavity is shown in red-colored arrows. In these configurations, exterior boundaries of the intermodular cavities opening to the outer environment were closed with obstructions to represent the usage of cavity barriers and fire stops.

Table 3.
Simulated fire scenarios.
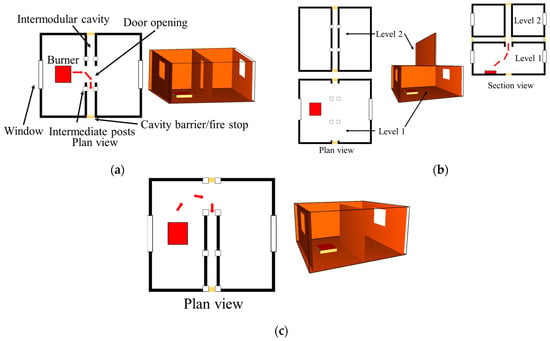
Figure 10.
Model geometries for the three cases selected: (a) Case 1; (b) Case 2; (c) Case 3.
All walls, floors, and ceilings were assumed to be non-combustible and were assigned inert surfaces. At the locations of steel columns, a 100 mm × 3000 mm layered surface was incorporated along the cavity’s boundary to represent the column’s exposed surface. These surfaces were defined with cold-formed steel material properties as described in [38]. Temperature profiles of the steel surface and the cavity air medium were monitored near these steel column element locations. These columns are positioned at 2 m intervals along the long edge of the modular units. These data were taken at 750 mm intervals along the column height. The most critical case was identified based on these temperature profiles. Subsequently, for this critical case, the number of windows for each module varied, including scenarios with one window, two windows on adjacent sides, two on opposite sides, and three windows. These configurations were evaluated to understand how varying ventilation conditions influenced the thermal behavior within the cavity and adjacent steel elements.
2.3.2. Structural Response Analysis
The validated structural modelling technique (Section 2.2) was used to identify the structural response of an intermediate column under the identified critical cavity fire exposure conditions from fire scenario analysis. The columns were considered directly exposed to cavity fire without plasterboard protection, which is the worst case in general practice [43]. The parametric variations made to assess the 3 m length SHS intermediate column’s structural response under critical cavity fire exposure (Case 2 with one window) are given in Table 4. The size of the SHS column varied from 65 × 65 mm to 150 × 150 mm to suit the typical applications in cold-formed steel modular buildings considering low-rise to mid-rise structures [16,30,44,45]. For the steel grade, G450 (yield strength = 450 MPa, tensile strength = 500 MPa) and G350 (yield strength = 350 MPa, tensile strength = 430 MPa) steel are considered. In steel modular buildings, intermodular connections may exhibit varying degrees of fixity, ranging from ideally pinned to ideally fixed conditions [46]. The column specimens’ fixity varied between these two extremes to reflect these conditions. The applied loading on the column was expressed as a fraction of its ambient axial load-carrying capacity, referred to as the load ratio.

Table 4.
Parametric variations made to assess the structural response of the intermediate column under cavity fire exposure.
3. Results and Discussion
3.1. Critical Cavity Fire Scenario
The variations in cavity gas temperature near the critical intermediate column element for the examined fire scenarios (Section 2.3.1) are presented in Figure 11. In Cases 1 and 3, the gas temperature profiles near the columns indicate substantial heat exposure in the 1.5 m to 3.0 m region. Conversely, due to geometric variations in Case 2, the critical heat exposure shifts to the lower area, specifically from 0 m to 0.75 m. As illustrated in the vertical gas temperature distribution along the intermodular cavity in Figure A4 (Appendix A), gas temperatures within the cavity are most critical near the ceiling level of the fire compartment. The severity of these profiles diminishes with distance from the ceiling level. However, the temperature reduction is more pronounced in the downward direction than the upward direction.
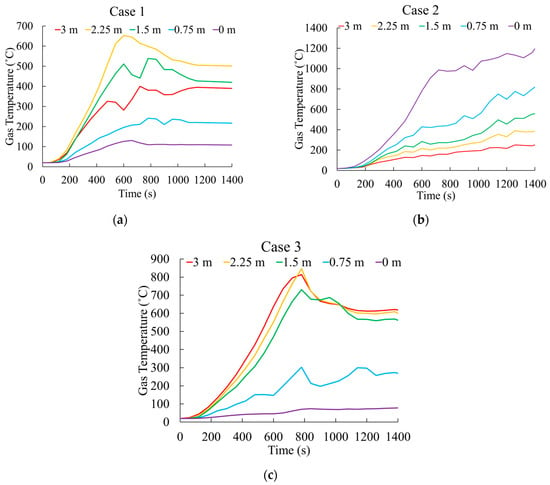
Figure 11.
The gas temperature variations near the intermediate column exposed to the intermodular cavity: (a) Case 1 fire scenario; (b) Case 2 fire scenario; (c) Case 3 fire scenario.
Analysis of the gas temperature variations suggests that Case 2 poses the most significant risk to the intermediate column. At 1400 s, the averages of gas temperatures along the cavity height were 327 °C, 642 °C, and 425 °C for Cases 1, 2, and 3, respectively. Therefore, the Case 2 scenario exhibited 49% and 34% higher average gas temperatures than Cases 1 and 3, respectively. These results highlight the significance of careful geometry planning for the fire safety of modular buildings. The increased fire safety risks associated with geometries like Case 2 require special attention in structural fire safety. Thus, Case 2 was selected for further analysis, including the effect of varying ventilation conditions by altering the positioning of window openings.
3.2. Effect of Ventilation Conditions on Column Temperature
The ventilation conditions within modular units significantly influenced the fire growth and the temperature development within intermodular cavities. For the fire scenario in Case 2, the temperature distribution along the height of the column surface exposed to the intermodular cavity was monitored under varying ventilation conditions. Temporal temperature variations at the bottom and top of the column surface are shown in Figure 12.
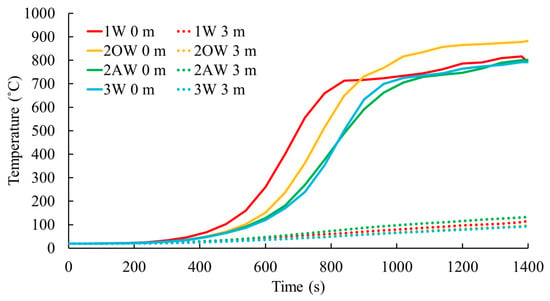
Figure 12.
The column temperature variations under different ventilation scenarios (1W—one window, 2OW—two windows on the opposite faces per module, 2AW—two windows on the adjacent sides per module, 3W—three windows per module).
The surface temperature at the bottom of the column displayed a sensitivity to ventilation conditions. The temperature profile exhibited two distinct phases corresponding to the design fire stages: the fire growth phase (0–800 s) and the steady-state phase (800–1400 s). Among the configurations, the one window per module scenario (1W) caused the column to heat up more rapidly than others. The time to reach a surface temperature of 550 °C was 720 s, 790 s, 875 s, and 860 s for the 1W, two windows on opposite faces per module (2OW), two windows on adjacent sides per module (2AW), and three windows per module (3W) scenarios, respectively. Thus, the 1W configuration reduced the time to reach 550 °C by 18% compared to the 2AW scenario.
This variation is attributed to differences in flame behavior within/near the cavity. The 1W configuration resulted in lower air entrainment into the fire, causing the flame to stretch as it sought oxygen, increasing penetration into the cavity. However, the 1W scenario did not achieve the maximum column temperature due to limited ventilation conditions. The highest observed steel surface temperature, 883 °C, occurred in the 2OW configuration. Maximum temperatures for the 1W, 2AW, and 3W scenarios were 816 °C, 802 °C, and 793 °C, respectively. Compared to the lowest maximum temperature in the 3W scenario, the 2OW configuration resulted in an 11.3% higher surface temperature.
This variation in maximum steel surface temperature is sensitive to air entrainment, which depends on the number and positioning of windows. An increase in window count, resulting in higher air entrainment to fire, enhanced the fire’s heat release rate and gas temperature within the compartment. However, as flames stretched toward the windows, penetration into the cavity was reduced, leading to reduced heat transfer to the exposed column. The 2OW scenario, with windows positioned on opposite faces, maintained a higher flame presence near the cavity due to greater distances from the fire source, resulting in higher heat transfer to the column. However, the surface temperature at the top of the column showed minimal sensitivity to the air entrainment.
Based on the observed surface temperatures of the intermediate columns, it can be concluded that, as the surface temperatures exceeded the general critical steel temperature of 550 °C, the columns are at significant risk when directly exposed to the cavity fire. As the fire scenario with two opposite windows (2OW) resulted in the most critical thermal conditions, those thermal conditions are used to evaluate the impact on the structural fire response of SHS column specimens.
3.3. Heat Transfer in the Column
The surface temperature distribution in the intermediate column posts under the identified critical heat exposure is illustrated in Figure 13. The localized heating from the cavity fire scenario explains the non-uniform temperature distribution along the height and through the section. The critical hot flange (HF) and cold flange (CF) temperatures were sensitive to the column section properties (Figure 14).
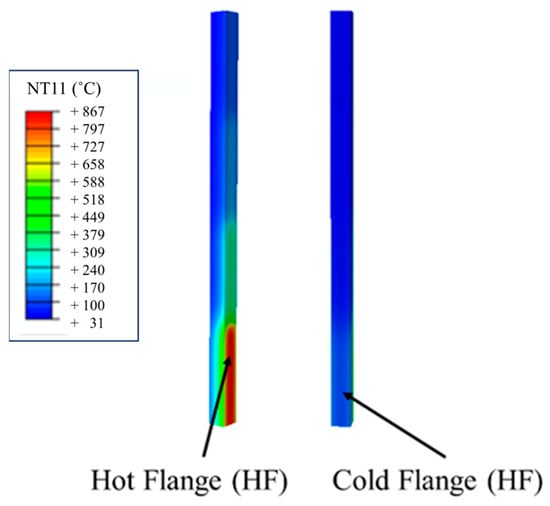
Figure 13.
The surface temperature contours obtained for the thermal conditions of the cavity.
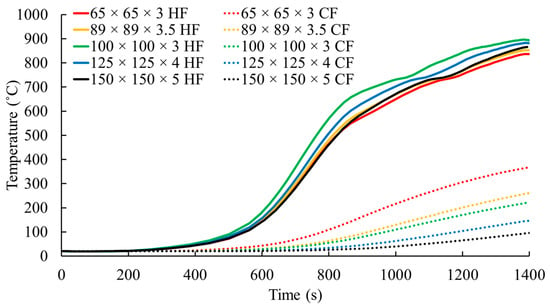
Figure 14.
The maximum surface temperature at the cold flange (CF) side and hot flange (HF) side over time.
The temperature of the HF was influenced by the ratio of the fire-exposed face width to its thickness (w/t). For the column with the most significant w/t ratio of 33.3 (100 × 100 × 3 section), the HF temperature reached 896 °C at the end of the 1400 s fire scenario. The column with the lowest w/t ratio of 21.7 (65 × 65 × 3 section) resulted in an HF temperature of 837 °C. This 53% increase in the w/t ratio led to a 7% increase in the HF temperature. Moreover, on average, a 1% increase in w/t ratio can increase HF temperature from 0.08% to 0.46%.
In contrast, the CF heating was inversely proportional to the overall size of the column section. The smallest section (65 × 65 × 3) and the largest section (150 × 150 × 5) recorded maximum CF temperatures of 368 °C and 97 °C, respectively. During the fully developed fire phase (800–1400 s), the CF temperature increment rate ranged between 0.12 and 0.43 °C/s, with smaller sections exhibiting higher heating rates. The thermal gradient across the column section varied significantly depending on the section size, with gradients of 468 °C, 591 °C, 671 °C, 736 °C, and 771 °C for progressively larger column sections. These results indicate that the column can be subjected to differential thermal expansion, leading to thermal bowing and additional bending moments.
3.4. Structural Response
3.4.1. Phases of Structural Response
To investigate the structural response of SHS columns under cavity fire conditions, the variation in the relative restraining force (P/) throughout the fire scenario (Figure 15) is discussed in this section. The relative restraining force (P/) can be defined as the ratio of the column axial force to the initial axial force. Figure 15a illustrates the typical relative restraining force (P/) variation over time observed in this study. Accordingly, two distinct phases of structural response to the fire scenario can be identified. Similar phases have been reported in other research that examined the restrained thermal expansion of steel columns with uniform temperature distribution [47,48] as well as temperature gradient across the hot rolled steel section (uniform temperature along the length) [23].
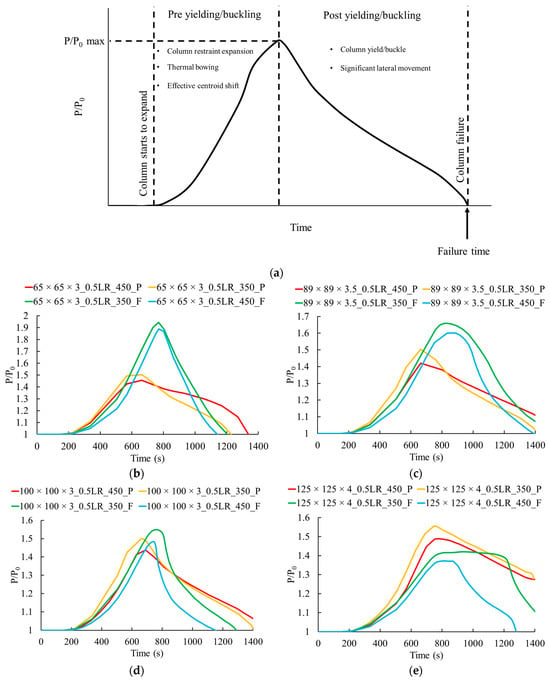
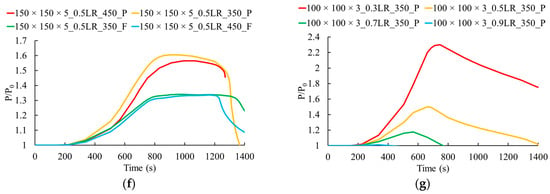
Figure 15.
Relative restraining forces (P/) vs. time plots: (a) typical relative restraining force (P/) variation over time; (b) 65 × 65 × 3; (c) 89 × 89 × 3.5; (d) 100 × 100 × 3; (e) 125 × 125 × 4; (f) 150 × 150 × 5; (g) effect of load ratio (LR = load ratio, P = pinned, F = fixed, 0.5LR_450_P = pinned column with G450 steel grade under a 0.5 initial load ratio).
Initially, the column is subjected to thermal expansion under the temperature increase. However, this expansion is restrained by the support conditions at the column’s top and bottom. These support conditions correspond to the constraints imposed by intermodular connections and adjacent structural members. These restraints lead to a rise in the axial force within the column. Concurrently, the temperature gradient across the section induces thermal bowing [23,25], resulting in lateral displacements and thermal stresses. Simultaneously, steel experiences a reduction in its Young’s modulus and yield strength under elevated temperatures. However, due to the uneven temperature distribution across the column section, Young’s modulus and yield strength vary between the hot flange (HF) and the cold flange (CF). This variation causes the effective centroid to shift toward the CF, introducing additional bending moments. The combined effects of restrained thermal expansion, thermal bowing, material degradation, and shifting of the centroid result in a combination of yielding and buckling. This mechanism is reflected in the gradual reduction of the axial force/restraint. Unlike columns subjected to uniform heating, where axial force reduction is sudden due to buckling [47,48], the axial force drop observed in this study is gradual. This is attributable to the combined participation of yielding and buckling. This yielding and buckling marks the onset of the second phase of the structural response.
In the second phase, the column undergoes significant lateral deformation under the yielding and buckling until it reaches equilibrium. To maintain stability, as the lateral deflection increases, the bending moment increases. A conservative criterion for column failure is defined when the relative restraint force (P/) drops to 1.0, as suggested in prior studies [47,48].
Notably, this two-phase response is independent of the column’s section size, support fixity conditions, load ratio, or the steel grade. This indicates that the fundamental mechanisms governing the structural behavior of steel columns under cavity fire conditions are consistent, regardless of these parameters. However, column size variations and fixity conditions influence the post-buckling/yielding phase (Phase 2). The gradient of (P/) reduction during this phase decreases significantly for thicker and larger sections. This is explained by the greater resistance to yielding and buckling offered by thicker and larger sections. For this reason, Figure 15f represents a plateau region prior to the axial load reduction. In this stage, the axial load increases due to the restrained thermal expansion and is counterbalanced by the lateral deflection governed by material strength reduction, yielding, and buckling. When strength degradation, yielding, and buckling dominate, the axial load reduction starts. This phenomenon is also observed for the 125 × 125 column (Figure 15e). However, the trend is only seen for fixed support cases and is not observed for the pinned case. This is attributable to the pin-supported condition case having less buckling resistance. Notably, the length of the plateau region is shorter for the higher strength steel case than for the lower steel strength. The initial stress levels of the columns can explain this. Under the same load ratio, the higher strength case is subjected to a higher initial load, resulting in higher initial stress. Thus, the buckling strength and yielding are reached earlier in the higher strength case. Thus, the plateau is shorter in the high-strength case. According to these observations, thicker and larger columns can enhance the fire resistance by delaying the time to reduce the (P/) ratio. Thus, thicker cross-sections can enhance fire resistance under cavity fire conditions. Moreover, fixity conditions show sensitivity to the post-yielding/buckling behavior, particularly in smaller, thin cross-sections. Fixed support conditions with rotational restraints increase stress levels by resisting thermal bowing and lateral deflections. This results in a steeper gradient in the post-buckling/yielding phase for smaller, thin cross-sections. However, for larger, thicker sections (e.g., 100 × 100 × 3, 125 × 125 × 4 and 150 × 150 × 5), this effect is negligible due to their higher resistance to buckling/yielding. These findings indicate that smaller, thinner sections combined with fixed supports, applicable to low-rise and mid-rise modular structures, have the risk of sudden failure under cavity fire exposure. Therefore, the influence of SHS section properties and support conditions must be considered in the design of modular steel structures to ensure structural integrity under cavity fire conditions.
Figure 15g represents the dependency of the load ratio on the structural response. According to Figure 15g, the load ratio does not alter the overall shape of the curve. Instead, it shifts the curves, influencing the maximum P/ value and the time to failure. In addition to these factors, the level of axial restraints can impact the structural behaviour. This study considers the axial restraints to be infinite when considering pin-supported or fixed-supported idealization. Additional cases were considered and presented in Appendix B to highlight the impact of the variation of this axial stiffness.
3.4.2. Increment of Restraint Forces
Due to the restrained thermal expansion, significant increases in the restraint forces/axial forces are observed, as summarized in Table A1. This highlights the potential for catastrophic structural failures if intermodular connections are not adequately designed to accommodate such force increments. The sensitivity of restraint force increments to variations in steel grade, support fixity, section size, and load ratio necessitates the identification of vulnerable design configurations.
The fixed support conditions yield significantly high restraint/axial forces. For a load ratio of 0.5, transitioning from pinned to fixed supports increased maximum reaction forces from 10% to 239%, averaging 78%. The inclusion of additional rotational restraints under fixed support conditions substantially limits lateral deformation (thermal bowing), leading to significantly elevated internal forces within the column.
The variability in steel strength from G350 to G450 led to an increase in the maximum restraint force, ranging from 4% to 36%. The average increase was quantified to be 24%. This increase is attributed to the variation in the initial force acting on the column at the onset of heating. Although both steel grades exhibit similar thermal expansion coefficients, their initial loads differ due to differences in yield strength. The higher initial load in G450 sections imposes additional restraint on thermal expansion, thereby generating greater internal forces within the column.
Transitioning from smaller to larger dimensions also influenced the column’s maximum restraint/axial force. For example, an increase in section size from 65 × 65 × 3 mm to 89 × 89 × 3.5 mm led to a 141% rise in maximum restraint/axial forces. Similarly, the section dimensions of 100 × 100 × 3 mm, 125 × 125 × 4 mm, and 150 × 150 × 5 mm resulted in increases in the restraint/axial forces by 172%, 442%, and 808%, respectively. This trend is due to the higher initial axial forces in larger sections, which intensify the constraints against thermal expansion.
Furthermore, for a given column size, steel grade, and support condition, varying the load ratio from 0.3 to 0.5, 0.7, and 0.9 increased the maximum restraint forces due to the increased restraint imposed on thermal expansion given the increased load. The variation ranged from 4.6% to 42%, with average increases of 8%, 19%, and 34% when altering the load ratio from 0.3 to 0.5, 0.7, and 0.9, respectively. Notably, lower load ratios exhibited the highest percentage increase in maximum restraint forces relative to the initial load, with increases reaching up to 155%. Compared to lower load ratios, the higher load ratios result in earlier material yielding and buckling. Therefore, this limits the prolonged axial force increment, resulting in a lesser increment in the axial restraints with respect to the initial load.
3.4.3. Capacity Reduction
The reduction in axial load capacity under the cavity fire scenario was evaluated by comparing the maximum axial force in a column to its ambient buckling capacity. The results are summarized in Table A1. Overall, cavity fire exposure caused a capacity reduction ranging from 2.4% to 35%.
The absolute variation in capacity reduction percentages, attributed to changing steel strength from G350 to G450, spans from 0% to 4.3%, with an average value of 2%. These higher capacity reductions for the steel grade of G450 result from the increased restraints from the comparatively high initial loads.
The effect of section size on capacity reduction exhibited a distinct behavior based on the support condition. Under pinned connections, changing the column section from 65 × 65 × 3 mm did not significantly change the capacity reduction percentage. The absolute variation in the capacity reduction percentages showed only up to 7%. However, for fixed support conditions, the absolute variation ranged from 15% to 31%. This is due to larger sections having higher initial loads and the increased restraints under fixed support conditions. When analyzing the effect of support conditions on the capacity reduction for section sizes of 65 × 65 × 3 mm, 89 × 89 × 3.5 mm, and 100 × 100 × 3 mm under fixed support conditions, the observed capacity reduction is less pronounced than that under pinned support conditions, exhibiting a variation span from -2% to -23%. Contrarily, sections measured at 125 × 125 × 4 mm and 150 × 150 × 5 mm under fixed support conditions exhibit a more significant capacity reduction, with variations ranging from 7% to 25%.
Moreover, as the load ratio increases, the capacity reduction decreases. On average, at load ratios of 0.3, 0.5, 0.7, and 0.9, the resultant capacity reductions were 30%, 23%, 18%, and 9%, respectively. This is because the increase in the maximum axial force is less with higher loads.
3.4.4. Lateral Deformations
The lateral deformations of the columns at the location of maximum lateral displacements under a 0.5 load ratio are presented in Figure 16. Columns that failed within the 1400 s fire scenario are represented with continuous lines, while the columns that did not meet the failure criteria are shown with dotted lines. In contrast to uniformly heated columns, the maximum lateral deformation was observed at a ratio of 0.19 to 0.49 of the column height due to the localized heating from cavity fire. The steel grade G450 showed slightly higher deformations than the G350 cases due to the higher forces generated within the column under restrained expansion. The fixed supported columns demonstrated 42% to 80% lower lateral displacements at the failure (or end of fire scenario) compared to pinned supports as a result of the rotational restraints, which also influenced the expected failure mode. A notable distinction in lateral deformation is the direction of displacement. Under pinned support conditions, the combined effect of restrained thermal expansion and thermal bowing due to the differential expansion between the hot flange (HF) and cold flange (CF) has caused the column to deflect toward the fire-exposed side. However, lateral deformation behavior is more complex under fixed support conditions. Initially, as the column is heated, the HF experiences compression, and the CF undergoes tension due to the thermal gradient and the restrained rotation at supports [23]. This induces an initial bending moment that deflects the column slightly toward the CF side. However, when the column gets heated enough to reduce its strength, the effective centroid shifts toward the CF due to the uneven material property degradation between the flanges. This shift generates a bending in the opposite direction to that created by thermal bowing. This causes the column to deflect toward the fire exposed side. This reversal of lateral displacement is highlighted with red circles in Figure 16.
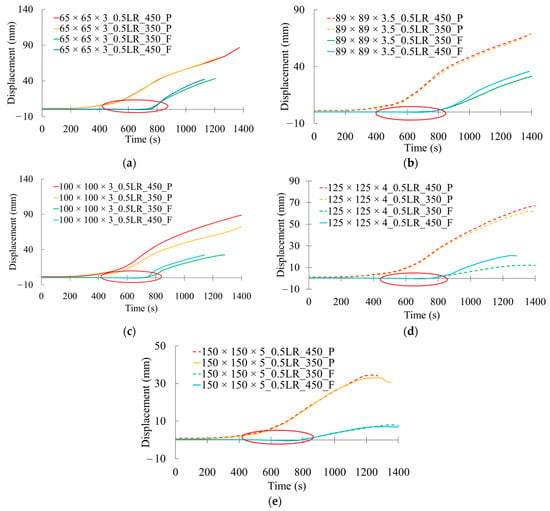
Figure 16.
Maximum lateral displacement over time: (a) 65 × 65 × 3; (b) 89 × 89 × 3.5; (c) 100 × 100 × 3; (d) 125 × 125 × 4; (e) 150 × 150 × 5 (LR = load ratio, P = pinned, F = fixed, 0.5LR_450_P = pinned column with G450 steel grade under a 0.5 initial load ratio, red circle = reversal of lateral displacement).
3.4.5. Failure Modes
The maximum principal plastic strain distributions across various column configurations are explored to understand the possible failure modes under cavity fire exposure. Figure 17 presents these distributions at a load ratio of 0.5. The plastic strain distributions are taken at the time of failure for cases meeting the failure criteria. For columns that did not fail during the fire scenario, the distributions are shown at 1400 s. A comprehensive review [27] on failure modes of cold-formed steel elements under fire has demonstrated three kinds of failure modes: global buckling, local buckling, and distortional buckling. The w/t ratio, slenderness, and section shape of the elements can be identified as governing parameters [27] when deciding on the critical failure mode. Accordingly, high w/t ratios (thin sections) lead to failure under local buckling, whereas high slenderness columns are susceptible to global buckling. The distortional buckling is dominant in open sections (ex, channel sections) and not observed in closed sections (SHS sections). In addition, it has been suggested that the columns under a temperature gradient (similar to the cases in this study) can result in local buckling. The cold forming process in cold-formed steel sections attracts residual stresses (bending and membrane), which can also influence local buckling failures. However, Gunalan et al. [49] found that the impact of residual stresses on local buckling of cold-formed steel elements is minimal under elevated temperatures, as the residual stresses diminish with elevated temperature.
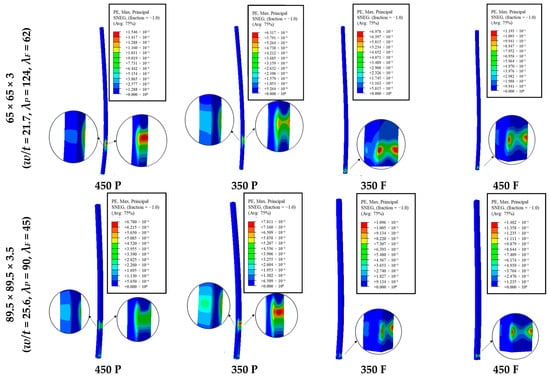
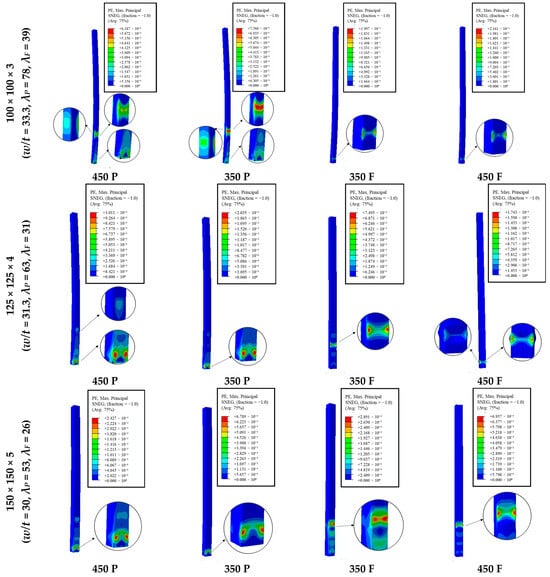
Figure 17.
Plastic strain distribution (for clarity, enlarged images capture the critical areas).
These plastic strain distributions demonstrate two distinct failure modes, and they are consistent with the existing research on failure modes of cold-formed elements under fire [27]. The first identified mode is a combination of global buckling and localized yielding. This is predominantly observed in columns with a high slenderness ratio (λ), specifically in column specimens of 65 × 65 × 3 mm (λp = 124 (pinned)) and 89 × 89 × 3.5 mm (λp = 90 (pinned)). Conversely, columns with a considerably low slenderness ratio (λ) and a w/t ratio greater than 30, such as 125 × 125 × 4 mm (λp = 63 (pinned), w/t = 31.3) and 150 × 150 × 5 mm (λp = 53 (pinned), w/t = 30), demonstrated local buckling close to the bottom support at the hot flange (HF). The 100 × 100 × 3 mm column (λp = 78 (pinned), w/t = 33.3), with an intermediate slenderness ratio (λ), exhibited plastic deformations indicative of both failure modes. Nevertheless, the dominant plastic strains at the maximum lateral displacement height indicate that the failure mode is more toward global buckling and material yielding.
However, under fixed support conditions, the failure mode is the local buckling failure mode. These failure modes are significantly influenced by the slenderness ratio (λ) and thus the lateral deformations. Columns permitted to undergo lateral deformations (high slenderness) showed global buckling coupled with material yielding at points of maximum lateral deformation. This is the case for columns with higher slenderness ratios and pinned connections, which are more likely to experience lateral displacement. When columns had a low slenderness ratio (λF = 26 to 62 (fixed)) and exhibited minimal lateral deformations, the failure mode was the local buckling type. Therefore, under the fixed support condition, given the material degradation from heat exposure and the stress concentration due to the rotational restraint, local buckling occurred on a hot flange close to the column’s base.
3.4.6. Failure Time
The time required for columns to reach predetermined failure criteria is summarized in Table A2. These results underscore the potential for cavity fire scenarios to induce structural failure in intermediate columns. It is noteworthy, however, that not all instances led to a column failure within the 1400-s duration of fire exposure. For cases meeting the failure criteria, failure times ranged from 149 s to 1400 s. Figure 15 shows that the timing of failure depends on how quickly the axial force within a column reaches its highest point and returns to its initial level. This process is strongly influenced by the deformations and stresses resulting from restrained expansion, thermal bowing, and centroid shift, leading to material yielding and buckling. To highlight the significance of considering cavity fire scenarios, a situation where the cavity is fully sealed and only the compartment fire resulting in heat transfer to the column through a 16 mm thick plasterboard protection inside the room is considered and presented in Appendix C. In this case, a 100 × 100 × 3 column with G350 steel under pinned support conditions was considered. The initial load ratio was 0.5. For the compartment fire, the gas temperature in Figure 9b is assumed to be uniformly acting along the full height of the plasterboard protection. This resulted in the HF and CF of the column reaching 117 °C and 50 °C, respectively, at the end of a 1400 s duration. Failure was not observed for this compartment fire-only case, and the column failed at 1400 s in the cavity fire scenario. The capacity reduction in the compartment fire case was only 6%; however, for the cavity fire case, it is 25%. This further highlights the risk of columns directly exposed to cavity fire in intermodular cavity spaces and the importance of additional fire protection at the column face exposed to the cavity.
The results for the cavity fire cases show that changing steel strength from G350 to G450 in cases with fixed support reduced the failure time by up to 12.3%. This can be explained by the fact that under the same load ratio, higher-grade steel columns loaded with higher axial forces accelerate material yielding and buckling deformation compared to lower-grade steel cases. In cases with pinned supports, the change in failure time varied between −33.5% and 11.8%. The reduction in failure time for these conditions follows the same logic as that for fixed supports. However, three exceptions were noted, which resulted in higher steel grades to increase failure time.
On the other hand, smaller sections showed a reduction in failure times, making cavity fire scenarios particularly challenging for low-rise and mid-rise buildings. The effect of the support condition is that the fixed support condition reduced the failure time. The increasing load ratios increase axial loads during thermal expansion, thus speeding up material yielding and buckling under heat exposure. Therefore, the load ratio and failure time show an inverse proportionality.
3.4.7. Design Recommendations
Based on the parametric analysis results, some design recommendations for the intermediate columns are presented to reduce the impact of a cavity fire spread on structural integrity.
- Intermodular connections with pinned idealization or semi-rigid connections characterized by a fixity factor nearing zero can enhance the fire performance of intermediate columns affected by cavity fire, generating lesser axial/restraint forces under comparable load ratios.
- The relationship between the maximum restraint/axial force increment percentage and the load ratio was quadratic, as illustrated in Figure 18. This serves as a reference for the structural robustness design of intermodular connections and intermediate columns, allowing for verification based on the load ratio of columns at the serviceability limit state. Accordingly, the corresponding restraint/axial force increment can be determined to assess if the structural capacity of the intermediate column and the connected intermodular connections are sufficient to accommodate the anticipated loads during the cavity fire exposure. Thus, under serviceability conditions corresponding to a 0.5 load ratio, the supporting connections and the intermediate columns are identified to be designed to withstand an additional load corresponding to 56% of the service load of the column.
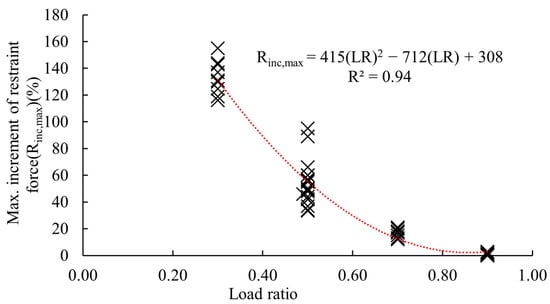 Figure 18. Load ratio vs. maximum increment of restraint forces during the exposure to cavity fire heat (“×” symbols represent the data points, and the red dotted line is the curve fitted for the data).
4. Conclusions
Modular constructions have been popular as a sustainable and efficient technique for increased infrastructure demand. Even though these constructions satisfy strength, stability, and serviceability requirements, fire endurance should be further explored for probable fire scenarios to ensure occupants’ safety. Several incidents involving cavity fires in modular buildings have highlighted the potential hazards of the continuous cavity system between modular units during fire events. Evaluation of the effects of cavities on fire propagation characteristics and the response of adjacent structural members for such critical events will contribute to designing and detailing modular buildings to ensure required fire ratings. Therefore, this study aimed to assess the impact of cavity fire spread in modular buildings initiated by a room fire using validated fire dynamics and structural numerical models. A comprehensive parametric study was conducted to identify critical thermal conditions on adjacent structural members under plausible cavity fire scenarios. The identified critical cavity fire thermal conditions were used to examine the structural performance of cold-formed steel intermediate column specimens. The following conclusions can be drawn from the findings:
- Across all three fire scenarios examined, structural fire safety vulnerabilities were evident. Case 2 (fire entering the intermodular cavity through the boundary of the two open-sided modular units) highlighted the risk of impacting intermediate column posts exposed to the cavity fire by showing 49% and 34% higher average gas temperatures than Cases 1 and 3.
- Under cavity fire conditions, restrained SHS column sections revealed two distinct phases of behavior: an initial phase dominated by thermal bowing, restrained expansion, and additional moments due to centroid shift, followed by significant lateral deformations under material yielding and buckling. Restrained thermal expansion in the initial phase significantly increased maximum restraint/axial forces, up to 155% of the initial load, which subsequently participated in reducing axial load capacity by 2.4% to 35%.
- The plastic strain distribution demonstrates two distinct failure modalities. Global buckling accompanied by localized yielding is predominant in cases with a high slenderness ratio (>90). The stiffer cases with a low slenderness ratio (<63) demonstrated the second failure mode of local buckling near the column base.
- The study’s failure times, ranging from 149 s to 1400 s, underscore the intermediate columns’ susceptibility to failure under cavity fire heat exposure conditions.
- Intermodular connections with pinned idealization are recommended to enhance the fire performance of intermediate columns affected by cavity fire, and those connections and the intermediate columns are identified to be designed to withstand an additional load corresponding to 56% of the service load of the column.
While this study provides valuable insights into the dangers of fire and heat spread through vertical intermodular cavities, limitations of the study are highlighted for future research. In this study, the failure of the fire stop/fire seal resulting in fire/heat penetration into the cavity was assumed to have occurred prior to the fire scenario. Further, the study considered a complete failure of the fire stop. Therefore, further investigation is needed into the failure of fire stops under fire impact and the consequences of localized fire stop failures on cavity fire spread and structural performance. Despite the study focusing on a single cavity width of 50 mm, in practice, cavity widths can vary between 20 mm and 50 mm. Since fire or heat penetration into the cavity and thermal conditions within the cavity depend on the cavity width, the risk of failure of the column may differ for different cavity widths. Moreover, infinite stiffness was considered for both axial and rotational restraints in the parametric analysis. Further investigations considering varying levels of restraint stiffnesses would be beneficial for developing further design guidelines.
Author Contributions
Conceptualization, R.G., K.G., P.W., S.N. and K.T.Q.N.; methodology, R.G.; software, R.G.; validation, R.G.; formal analysis, R.G.; investigation, R.G.; resources, P.W., S.N., K.G. and K.T.Q.N.; data curation, R.G.; writing—original draft preparation, R.G.; writing—review and editing, P.W., S.N., K.G. and K.T.Q.N.; visualization, R.G.; supervision, P.W., S.N., K.G. and K.T.Q.N.; project administration, K.T.Q.N.; funding acquisition, K.T.Q.N. All authors have read and agreed to the published version of the manuscript.
Funding
This research was supported by the School of Engineering—RMIT University, Faculty of Engineering—University of Moratuwa and the Australian Research Council (FT240100348, IH200100010 and IH220100002), which are gratefully acknowledged.
Institutional Review Board Statement
Not applicable.
Informed Consent Statement
Not applicable.
Data Availability Statement
Some or all data, models, or codes that support the findings of this study are available from the corresponding author upon reasonable request.
Acknowledgments
The computational facilities provided by the ARDC Nectar Research Cloud are gratefully acknowledged.
Conflicts of Interest
The authors declare no conflicts of interest.
Abbreviations
The following abbreviations are used in this manuscript:
| CF | Cold flange |
| FDS | Fire Dynamics Simulator |
| HF | Hot flange |
| HRR | Heat release rate |
| SHS | Square hollow section |
Appendix A
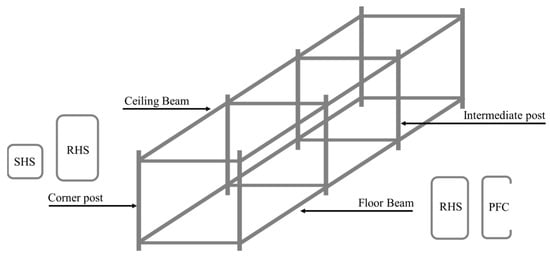
Figure A1.
Structural system of the modular unit.
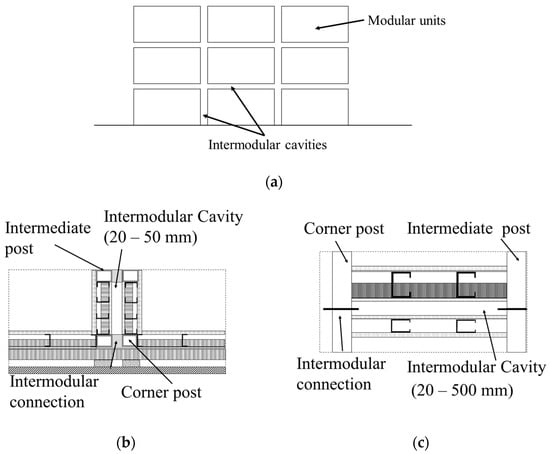
Figure A2.
Cavities in modular construction units: (a) intermodular cavity system; (b) vertical intermodular cavity (plan view); and (c) horizontal intermodular cavity (elevation).
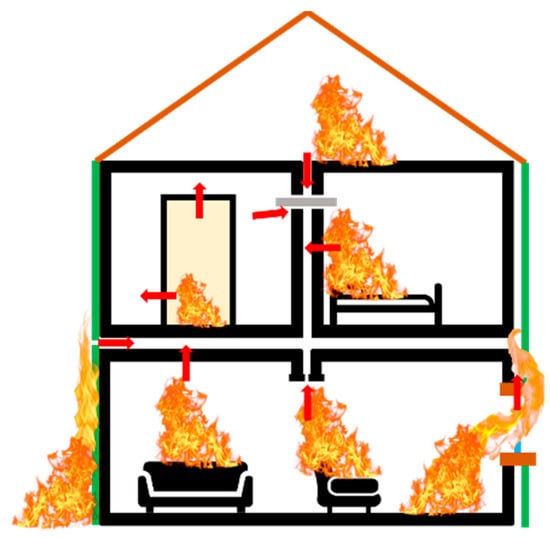
Figure A3.
Fire penetration into intermodular cavity spaces.
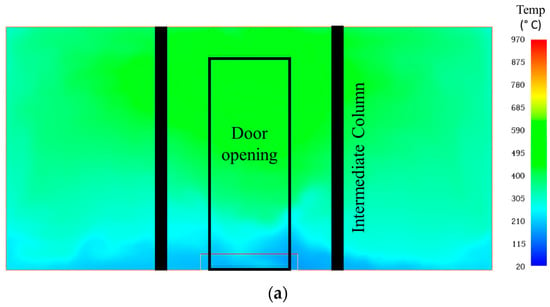
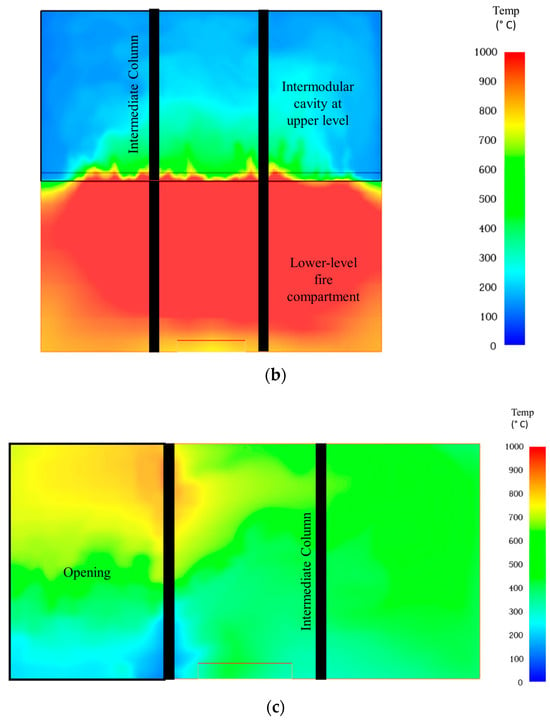
Figure A4.
The gas temperature variations along the center of the intermodular cavity: (a) Case 1; (b) Case 2; (c) Case 3.

Table A1.
Restraining forces and the capacity reduction results.
Table A1.
Restraining forces and the capacity reduction results.
| Column | Steel Grade | Fixity | Buckling Capacity Ambient State (kN) | Load P0 (kN) | LR | Max. Reaction (kN) | Max. Increment of Restraint Force (%) | Capacity Reduction (%) |
|---|---|---|---|---|---|---|---|---|
| 65 × 65 × 3 | G450 | Pinned | 91 | 27.3 | 0.3 | 61.4 | 124.83 | 33 |
| 65 × 65 × 3 | G450 | Pinned | 91 | 44.73 | 0.5 | 65.3 | 46 | 28 |
| 65 × 65 × 3 | G450 | Pinned | 91 | 63.7 | 0.7 | 71.3 | 12 | 22 |
| 65 × 65 × 3 | G450 | Pinned | 91 | 81.9 | 0.9 | 81.9 | 0.01 | 10 |
| 89 × 89 × 3.5 | G450 | Pinned | 251 | 75.29 | 0.3 | 165 | 119 | 34 |
| 89 × 89 × 3.5 | G450 | Pinned | 251 | 125.5 | 0.5 | 178 | 42 | 29 |
| 89 × 89 × 3.5 | G450 | Pinned | 251 | 175.7 | 0.7 | 199 | 13 | 21 |
| 89 × 89 × 3.5 | G450 | Pinned | 251 | 225.9 | 0.9 | 227 | 0.5 | 10 |
| 100 × 100 × 3 | G450 | Pinned | 294 | 88.09 | 0.3 | 190 | 116 | 35 |
| 100 × 100 × 3 | G450 | Pinned | 294 | 147 | 0.5 | 212 | 44 | 28 |
| 100 × 100 × 3 | G450 | Pinned | 294 | 205.8 | 0.7 | 237 | 15 | 20 |
| 100 × 100 × 3 | G450 | Pinned | 294 | 264.6 | 0.9 | 270 | 2 | 8 |
| 125 × 125 × 4 | G450 | Pinned | 594 | 178.2 | 0.3 | 412 | 131 | 31 |
| 125 × 125 × 4 | G450 | Pinned | 594 | 297 | 0.5 | 443 | 49 | 26 |
| 125 × 125 × 4 | G450 | Pinned | 594 | 415.8 | 0.7 | 491 | 18 | 17 |
| 125 × 125 × 4 | G450 | Pinned | 594 | 534.6 | 0.9 | 545 | 2 | 8 |
| 150 × 150 × 5 | G450 | Pinned | 990 | 297 | 0.3 | 722 | 143 | 27 |
| 150 × 150 × 5 | G450 | Pinned | 990 | 495 | 0.5 | 777 | 57 | 22 |
| 150 × 150 × 5 | G450 | Pinned | 990 | 693 | 0.7 | 832 | 20 | 16 |
| 150 × 150 × 5 | G450 | Pinned | 990 | 891 | 0.9 | 909 | 2 | 8 |
| 65 × 65 × 3 | G350 | Pinned | 83 | 24.9 | 0.3 | 59 | 137 | 29 |
| 65 × 65 × 3 | G350 | Pinned | 83 | 41.5 | 0.5 | 62.3 | 50 | 25 |
| 65 × 65 × 3 | G350 | Pinned | 83 | 58.1 | 0.7 | 68 | 17 | 18 |
| 65 × 65 × 3 | G350 | Pinned | 83 | 74.7 | 0.9 | 74.7 | 0.0001 | 10 |
| 89 × 89 × 3.5 | G350 | Pinned | 206.5 | 61.95 | 0.3 | 142 | 130 | 31 |
| 89 × 89 × 3.5 | G350 | Pinned | 206.5 | 103.3 | 0.5 | 155 | 50 | 25 |
| 89 × 89 × 3.5 | G350 | Pinned | 206.5 | 144.6 | 0.7 | 171 | 18 | 17 |
| 89 × 89 × 3.5 | G350 | Pinned | 206.5 | 185.9 | 0.9 | 188 | 1.1 | 9 |
| 100 × 100 × 3 | G350 | Pinned | 232 | 69.6 | 0.3 | 160 | 130 | 31 |
| 100 × 100 × 3 | G350 | Pinned | 232 | 116 | 0.5 | 174 | 50 | 25 |
| 100 × 100 × 3 | G350 | Pinned | 232 | 162.4 | 0.7 | 192 | 18 | 17 |
| 100 × 100 × 3 | G350 | Pinned | 232 | 208.8 | 0.9 | 211 | 1 | 9 |
| 125 × 125 × 4 | G350 | Pinned | 444 | 133.2 | 0.3 | 325 | 144 | 27 |
| 125 × 125 × 4 | G350 | Pinned | 444 | 222 | 0.5 | 346 | 56 | 22 |
| 125 × 125 × 4 | G350 | Pinned | 444 | 310.8 | 0.7 | 373 | 20 | 16 |
| 125 × 125 × 4 | G350 | Pinned | 444 | 399.6 | 0.9 | 408 | 2 | 8 |
| 150 × 150 × 5 | G350 | Pinned | 724 | 217.2 | 0.3 | 554 | 155 | 23 |
| 150 × 150 × 5 | G350 | Pinned | 724 | 362 | 0.5 | 579 | 60 | 20 |
| 150 × 150 × 5 | G350 | Pinned | 724 | 506.8 | 0.7 | 613 | 21 | 15 |
| 150 × 150 × 5 | G350 | Pinned | 724 | 651.6 | 0.9 | 671 | 3 | 7 |
| 65 × 65 × 3 | G350 | Fixed | 174 | 87 | 0.5 | 170 | 95 | 2 |
| 65 × 65 × 3 | G450 | Fixed | 234 | 117 | 0.5 | 221 | 89 | 5 |
| 89 × 89 × 3.5 | G350 | Fixed | 327 | 163.3 | 0.5 | 271 | 66 | 17 |
| 89 × 89 × 3.5 | G450 | Fixed | 449 | 224.4 | 0.5 | 359 | 60 | 20 |
| 100 × 100 × 3 | G350 | Fixed | 340 | 170 | 0.5 | 264 | 55 | 23 |
| 100 × 100 × 3 | G450 | Fixed | 469 | 234.5 | 0.5 | 347 | 48 | 26 |
| 125 × 125 × 4 | G350 | Fixed | 604 | 302 | 0.5 | 429 | 42 | 29 |
| 125 × 125 × 4 | G450 | Fixed | 837 | 418.5 | 0.5 | 573 | 37 | 32 |
| 150 × 150 × 5 | G350 | Fixed | 951 | 475.5 | 0.5 | 637 | 34 | 33 |
| 150 × 150 × 5 | G450 | Fixed | 1290 | 645 | 0.5 | 861 | 33.5 | 33 |

Table A2.
Failure time.
Table A2.
Failure time.
| Column | Steel Grade | Support Condition | LR | Failure Time | |
|---|---|---|---|---|---|
| (s) | (min) | ||||
| 65 × 65 × 3 | G450 | Pinned | 0.3 | - | - |
| 65 × 65 × 3 | G450 | Pinned | 0.5 | 1372 | 23 |
| 65 × 65 × 3 | G450 | Pinned | 0.7 | 805 | 13 |
| 65 × 65 × 3 | G450 | Pinned | 0.9 | 149 | 2 |
| 89 × 89 × 3.5 | G450 | Pinned | 0.3 | - | - |
| 89 × 89 × 3.5 | G450 | Pinned | 0.5 | - | - |
| 89 × 89 × 3.5 | G450 | Pinned | 0.7 | 805 | 13 |
| 89 × 89 × 3.5 | G450 | Pinned | 0.9 | 505 | 8 |
| 100 × 100 × 3 | G450 | Pinned | 0.3 | - | - |
| 100 × 100 × 3 | G450 | Pinned | 0.5 | 1400 | 23 |
| 100 × 100 × 3 | G450 | Pinned | 0.7 | 750 | 13 |
| 100 × 100 × 3 | G450 | Pinned | 0.9 | 337 | 6 |
| 125 × 125 × 4 | G450 | Pinned | 0.3 | - | - |
| 125 × 125 × 4 | G450 | Pinned | 0.5 | - | - |
| 125 × 125 × 4 | G450 | Pinned | 0.7 | 1029 | 17 |
| 125 × 125 × 4 | G450 | Pinned | 0.9 | 568 | 9 |
| 150 × 150 × 5 | G450 | Pinned | 0.3 | - | - |
| 150 × 150 × 5 | G450 | Pinned | 0.5 | - | - |
| 150 × 150 × 5 | G450 | Pinned | 0.7 | 1279 | 21 |
| 150 × 150 × 5 | G450 | Pinned | 0.9 | 662 | 11 |
| 65 × 65 × 3 | G350 | Pinned | 0.3 | - | - |
| 65 × 65 × 3 | G350 | Pinned | 0.5 | 1227 | 20 |
| 65 × 65 × 3 | G350 | Pinned | 0.7 | 832 | 14 |
| 65 × 65 × 3 | G350 | Pinned | 0.9 | 224 | 4 |
| 89 × 89 × 3.5 | G350 | Pinned | 0.3 | - | - |
| 89 × 89 × 3.5 | G350 | Pinned | 0.5 | - | - |
| 89 × 89 × 3.5 | G350 | Pinned | 0.7 | 752 | 13 |
| 89 × 89 × 3.5 | G350 | Pinned | 0.9 | 505 | 8 |
| 100 × 100 × 3 | G350 | Pinned | 0.3 | - | - |
| 100 × 100 × 3 | G350 | Pinned | 0.5 | 1400 | 23 |
| 100 × 100 × 3 | G350 | Pinned | 0.7 | 757 | 13 |
| 100 × 100 × 3 | G350 | Pinned | 0.9 | 393 | 7 |
| 125 × 125 × 4 | G350 | Pinned | 0.3 | - | - |
| 125 × 125 × 4 | G350 | Pinned | 0.5 | - | - |
| 125 × 125 × 4 | G350 | Pinned | 0.7 | 1110 | 19 |
| 125 × 125 × 4 | G350 | Pinned | 0.9 | 550 | 9 |
| 150 × 150 × 5 | G350 | Pinned | 0.3 | - | - |
| 150 × 150 × 5 | G350 | Pinned | 0.5 | 1355 | 23 |
| 150 × 150 × 5 | G350 | Pinned | 0.7 | 1294 | 22 |
| 150 × 150 × 5 | G350 | Pinned | 0.9 | 677 | 11 |
| 65 × 65 × 3 | G350 | Fixed | 0.5 | 1205 | 20 |
| 65 × 65 × 3 | G450 | Fixed | 0.5 | 1128 | 19 |
| 89 × 89 × 3.5 | G350 | Fixed | 0.5 | 1400 | 23 |
| 89 × 89 × 3.5 | G450 | Fixed | 0.5 | 1385 | 23 |
| 100 × 100 × 3 | G350 | Fixed | 0.5 | 1282 | 21 |
| 100 × 100 × 3 | G450 | Fixed | 0.5 | 1144 | 19 |
| 125 × 125 × 4 | G350 | Fixed | 0.5 | - | - |
| 125 × 125 × 4 | G450 | Fixed | 0.5 | 1283 | 21 |
| 150 × 150 × 5 | G350 | Fixed | 0.5 | - | - |
| 150 × 150 × 5 | G450 | Fixed | 0.5 | 1400 | 23 |
Appendix B
Additional cases were considered with a 100 × 100 × 3 column with G350 steel, initial load ratio of 0.5and pinned support conditions to highlight the effect of the axial restraints on the structural and fire performance of the columns. The level of axial restraints at the top of the column was modelled using an axial connector with a spring stiffness. A fraction of the column element’s axial stiffness (EA/L) was assigned as the spring stiffness to simulate different levels of axial restraints. For this ratio, values of infinity (a large value), 1, 0.5, 0.25, 0.1, 0.075, and 0.05 were considered. The obtained axial load development curves are shown in Figure A5, summarizing the results in Table A3. The variation in axial restraint level mainly impacts the buckling/yielding onset time, maximum axial load in the column, failure time, and the capacity reduction. The reduction of axial restraint resulted in a delayed buckling/yielding onset up to 85% compared to the infinite axial restraint condition. This delay is an effect of lower restraints resulting in lower axial force increments. Varying the axial restraints from infinity to a ratio of 0.05, the maximum restraint force increment (based on initial column load) is reduced from 50% to 10%. This results in delaying the buckling/yielding. Therefore, the chances of column failure are also reduced with the reduction in axial restraints. In this analysis, only the case with infinite axial stiffness failed within the 1400 s fire duration (failure at 1400 s), and the plots clearly show that there is a trend of higher failure time for lower axial restraint levels. However, with the reduction in axial restraints, the capacity reduction has increased from 25% to 45% when the axial stiffness ratio is reduced from infinity to 0.05. This is due to the effect of strength reduction being governed by the temperature. Therefore, the fewer the axial restraints there are, the more the failure is governed by the temperature distribution in the column. For higher levels of axial restraints, higher axial force increments due to restrained thermal expansion, thermal bowing, and additional bending moments govern the buckling/yielding.
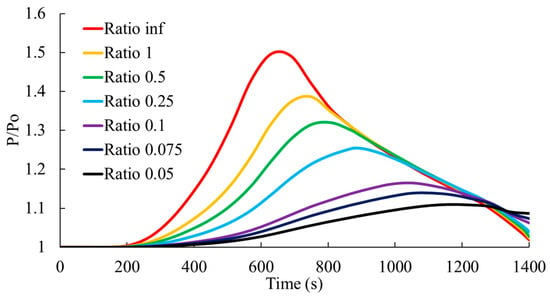
Figure A5.
Axial load development under different levels of axial restraints (as a ratio of the column’s axial stiffness).

Table A3.
Summary of results for the variation in axial restraints.
Table A3.
Summary of results for the variation in axial restraints.
| Axial Stiffness Ratio | Initial Load (kN) | Amb Capacity (kN) | Buckling Onset (s) | Buckling Onset Increment (%) | Max Axial Force (kN) | Capacity Reduction (%) |
|---|---|---|---|---|---|---|
| Infinity | 116 | 232 | 630 | - | 174 | 25 |
| 1 | 116 | 232 | 750 | 19 | 160 | 31 |
| 0.5 | 116 | 232 | 810 | 29 | 153 | 34 |
| 0.25 | 116 | 232 | 885 | 40 | 145 | 38 |
| 0.1 | 116 | 232 | 1050 | 67 | 135 | 42 |
| 0.075 | 116 | 232 | 1110 | 76 | 132 | 43 |
| 0.05 | 116 | 232 | 1163 | 85 | 128 | 45 |
Appendix C
This appendix summarizes the results of comparing the compartment fire-only case with the critical fire scenario case used in this study’s structural fire parametric analysis. The heat transfer results of the column under the compartment fire-only case are shown in Figure A6. The axial load development and the structural results are compared in Figure A7.
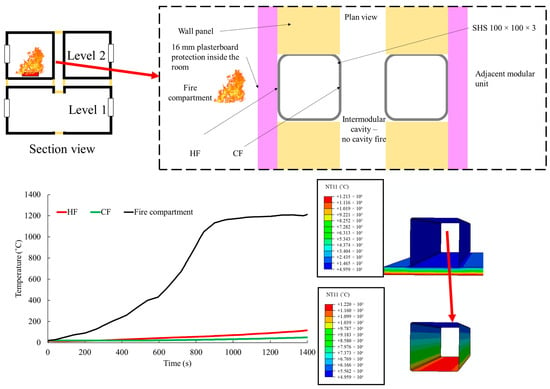
Figure A6.
Heat transfer results for the compartment fire-only case.
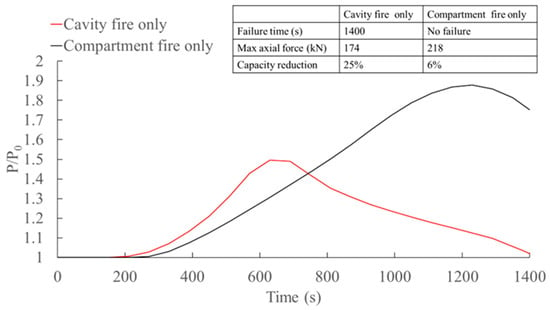
Figure A7.
Comparison of structural results for the compartment fire-only case and the cavity fire-only case.
References
- Bertram, N.; Fuchs, S.; Mischke, J.; Palter, R.; Strube, G.; Woetzel, J. Modular Construction: From Projects to Products; McKinsey & Company: New York, NY, USA, 2019. [Google Scholar]
- Ferdous, W.; Bai, Y.; Ngo, T.D.; Manalo, A.; Mendis, P. New advancements, challenges and opportunities of multi-storey modular buildings—A state-of-the-art review. Eng. Struct. 2019, 183, 883–893. [Google Scholar] [CrossRef]
- Lacey, A.W.; Chen, W.; Hao, H.; Bi, K. Structural response of modular buildings—An overview. J. Build. Eng. 2018, 16, 45–56. [Google Scholar] [CrossRef]
- Thai, H.T.; Ngo, T.; Uy, B. A review on modular construction for high-rise buildings. Structures 2020, 28, 1265–1290. [Google Scholar] [CrossRef]
- Just, A.; Brandon, D. Fire Stops in Buildings; Brandforsk: Stockholm, Sweden, 2017. [Google Scholar]
- Stout, J. Shetland fires ‘should act as warning to modular building industry’. BBC News, 27 July 2021. [Google Scholar]
- Meacham, B.J. Fire performance and regulatory considerations with modern methods of construction. Build. Cities 2022, 3, 464–487. [Google Scholar] [CrossRef]
- Nguyen, K.T.Q.; Navaratnam, S.; Mendis, P.; Zhang, K.; Barnett, J.; Wang, H. Fire safety of composites in prefabricated buildings: From fibre reinforced polymer to textile reinforced concrete. Compos. Part B Eng. 2020, 187, 107815. [Google Scholar] [CrossRef]
- Godakandage, R.; Weerasinghe, P.; Gamage, K.; Adnan, H.; Nguyen, K. A Systematic Review on Cavity Fires in Buildings: Flame Spread Characteristics, Fire Risks, and Safety Measures. Fire 2023, 7, 12. [Google Scholar] [CrossRef]
- Apps, P. Are two fires on the Shetland Islands a canary in the coal mine for modular construction? Inside Housing, 16 October 2020. [Google Scholar]
- Modular building fire risks ‘need more investigation’. BBC News, 25 August 2021.
- Jensen, G. Fire spread modes and performance of fire stops in vented façade constructions—Overview and standardization of test methods. In Proceedings of the MATEC Web of Conferences, Paris, France, 25–27 September 2013. [Google Scholar]
- Livkiss, K.; Svensson, S.; Husted, B.; van Hees, P. Flame Heights and Heat Transfer in Façade System Ventilation Cavities. Fire Technol. 2018, 54, 689–713. [Google Scholar] [CrossRef]
- Mendez, J.E.; Lange, D.; Hidalgo, J.P.; McLaggan, M.S. Effect of cavity parameters on the fire dynamics of ventilated façades. Fire Saf. J. 2022, 133, 103671. [Google Scholar] [CrossRef]
- Sharma, A.; Mishra, K.B. Experimental investigations on the influence of ‘chimney-effect’ on fire response of rainscreen façades in high-rise buildings. J. Build. Eng. 2021, 44, 103257. [Google Scholar] [CrossRef]
- Paneni, C. Development of Fire Engineering Solutions for Modular Construction. Master’s Thesis, School of Civil Engineering, The University of Queensland, Brisbane, Australia, 2018; pp. 17–78. [Google Scholar] [CrossRef]
- Shan, S.; Pan, W. Collapse mechanisms of multi-story steel-framed modular structures under fire scenarios. J. Constr. Steel Res. 2022, 196, 107419. [Google Scholar] [CrossRef]
- Balarupan, M. Structural Behaviour and Design of Cold-Formed Steel Hollow Section Columns Under Simulated Fire Conditions. Ph.D. Thesis, Queensland University of Technology, Brisbane, Australia, 2015. [Google Scholar]
- Pires, T.A.C.; do Rêgo Silva, J.J.; dos Santos, M.M.L.; Costa, L.M. Fire resistance of built-up cold-formed steel columns. J. Constr. Steel Res. 2021, 177, 106456. [Google Scholar] [CrossRef]
- Yang, J.; Shi, Y.; Wang, W.; Xu, L.; Al-azzani, H. Experimental and numerical studies on axially restrained cold-formed steel built-up box columns at elevated temperatures. J. Constr. Steel Res. 2020, 171, 106143. [Google Scholar] [CrossRef]
- Craveiro, H.D.; Rodrigues, J.P.C.; Laím, L. Experimental analysis of built-up closed cold-formed steel columns with restrained thermal elongation under fire conditions. Thin-Walled Struct. 2016, 107, 564–579. [Google Scholar] [CrossRef]
- Zhang, C.; Zhang, Z.; Li, G.-Q. Simple vs. sophisticated fire models to predict performance of SHS column in localized fire. J. Constr. Steel Res. 2016, 120, 62–69. [Google Scholar] [CrossRef]
- Moura Correia, A.J.P.; Rodrigues, J.P.C.; Real, P.V. Thermal bowing on steel columns embedded on walls under fire conditions. Fire Saf. J. 2014, 67, 53–69. [Google Scholar] [CrossRef]
- Yuan, W.-B.; Ge, P.-J.; Shen, Y.-T.; Cheng, S.-S.; Yu, N.-T. Buckling Analysis of Steel H Column with Thermal Gradient Along the Flanges. Int. J. Steel Struct. 2020, 20, 677–691. [Google Scholar] [CrossRef]
- Mahenthirarasa, R. Cold-Formed Steel Compression Members Exposed to Extreme Temperature Environments. Ph.D. Thesis, Queensland University of Technology, Brisbane, Australia, 2021. [Google Scholar]
- Kesawan, S.; Mahendran, M. Fire design rules for LSF walls made of hollow flange channel sections. Thin-Walled Struct. 2016, 107, 300–314. [Google Scholar] [CrossRef]
- Maraveas, C. Local buckling of steel members under fire conditions: A review. Fire Technol. 2019, 55, 51–80. [Google Scholar] [CrossRef]
- McGrattan, K.; Hostikka, S.; Floyd, J.; McDermott, R.; Vanella, M. Fire Dynamics Simulator—User’s Guide; National Institute of Standards and Technology: Gaithersburg, MD, USA, 2021.
- Lawson, M.; Ogden, R.; Goodier, C. Design in Modular Construction; CRC Press: Boca Raton, FL, USA, 2014. [Google Scholar]
- Munmulla, T.; Navaratnam, S.; Thamboo, J.; Ponnampalam, T.; Damruwan, H.-G.H.; Tsavdaridis, K.D.; Zhang, G. Analyses of Structural Robustness of Prefabricated Modular Buildings: A Case Study on Mid-Rise Building Configurations. Buildings 2022, 12, 1289. [Google Scholar] [CrossRef]
- Hurley, M.J. (Ed.) SFPE Handbook of Fire Protection Engineering, 5th ed.; Society of Fire Protection Engineers: Gaithersburg, MD, USA, 2016. [Google Scholar]
- PyroSim User Manual; Thunderhead Engineering: Manhattan, KS, USA, 2019.
- Livkiss, K.; Husted, B.P.; Beji, T.; van Hees, P. Numerical study of a fire-driven flow in a narrow cavity. Fire Saf. J. 2019, 108, 102834. [Google Scholar] [CrossRef]
- Complex Stoichiometry in Pyrosim; Thunderhead Engineering: Manhattan, KS, USA, 2024.
- Keerthan, P.; Mahendran, M. Numerical studies of gypsum plasterboard panels under standard fire conditions. Fire Saf. J. 2012, 53, 105–119. [Google Scholar] [CrossRef][Green Version]
- McGrattan, K.B. Fire Dynamics Simulator (Version 4): Technical Reference Guide; National Institute of Standards and Technology: Gaithersburg, MD, USA, 2006.
- Abaqus/CAE. 2023. Available online: https://help.3ds.com/2023/English/DSSIMULIA_Established/SIMACAERNGRefMap/simarng-c-ov.htm?contextscope=all&id=b72e43e71e4c41189ba5fb37f9550322 (accessed on 30 September 2024).
- AS/NZS 4600:2018; Cold-Formed Steel Structures. Standards New Zealand: Wellington, New Zealand, 2018.
- Imran, M.; Mahendran, M.; Keerthan, P. Mechanical properties of cold-formed steel tubular sections at elevated temperatures. J. Constr. Steel Res. 2018, 143, 131–147. [Google Scholar] [CrossRef]
- Rokilan, M.; Mahendran, M. Design of cold-formed steel columns subject to local buckling at elevated temperatures. J. Constr. Steel Res. 2021, 179, 106539. [Google Scholar] [CrossRef]
- Zha, X.; Zuo, Y. Finite Element Study of Container Structure under Normal and High Temperature. Math. Probl. Eng. 2016, 2016, 2652149. [Google Scholar] [CrossRef]
- Zammarano, M.; Hoehler, M.S.; Shields, J.R.; Thompson, A.L.; Kim, I.; Leventon, I.T.; Bundy, M.F. Full-Scale Experiments to Demonstrate Flammability Risk of Residential Upholstered Furniture and Mitigation Using Barrier Fabric; NIST Technical Note 2129; National Institute of Standards and Technology: Gaithersburg, MD, USA, 2020.
- Godakandage, R.L.P.; Nguyen, K.T.Q.; Weerasinghe, T.G.P.L.; Gamage, J.C.P.H. Hidden Dangers of Fire Safety in Modular Constructions. In Proceedings of the 14th International Conference on Sustainable Built Environment; Springer Nature: Singapore, 2024; pp. 517–536. [Google Scholar]
- Andy Prabowo, P. Multi-storey Modular Cold-Formed Steel Building in Hong Kong: Challenges & Opportunities. IOP Conf. Ser. Mater. Sci. Eng. 2019, 650, 012033. [Google Scholar] [CrossRef]
- Simões da Silva, L.; Silva, L.C.; Tankova, T.; Craveiro, H.D.; Simões, R.; Costa, R.; D’Aniello, M.; Landolfo, R. Performance of modular hybrid cold-formed/tubular structural system. Structures 2021, 30, 1006–1019. [Google Scholar] [CrossRef]
- Farajian, M.; Sharafi, P.; Eslamnia, H.; Kildashti, K.; Bai, Y. Classification of inter-modular connections for stiffness and strength in sway corner-supported steel modular frames. J. Constr. Steel Res. 2022, 197, 107458. [Google Scholar] [CrossRef]
- Craveiro, H.D.d.S. Fire Resistance of Cold Formed Steel Columns. Ph.D. Thesis, University of Coimbra, Coimbra, Portugal, 2015. [Google Scholar]
- Sun, J.; Meng, F.; Andisheh, K.; Clifton, G.C. Numerical Analysis of Restrained Continuous Steel Columns under Standard Fire. Fire 2023, 6, 330. [Google Scholar] [CrossRef]
- Gunalan, S.; Heva, Y.B.; Mahendran, M. Local buckling studies of cold-formed steel compression members at elevated temperatures. J. Constr. Steel Res. 2015, 108, 31–45. [Google Scholar] [CrossRef]
Disclaimer/Publisher’s Note: The statements, opinions and data contained in all publications are solely those of the individual author(s) and contributor(s) and not of MDPI and/or the editor(s). MDPI and/or the editor(s) disclaim responsibility for any injury to people or property resulting from any ideas, methods, instructions or products referred to in the content. |
© 2025 by the authors. Licensee MDPI, Basel, Switzerland. This article is an open access article distributed under the terms and conditions of the Creative Commons Attribution (CC BY) license (https://creativecommons.org/licenses/by/4.0/).