
The Effect of Toxicity, Physical and Thermal Properties of Fire Blanket Made of Glass Fiber on Its Quality as Small Fire Suppression Tool

 ,
,  ,
,
Abstract
1. Introduction
2. Materials and Testing Methods
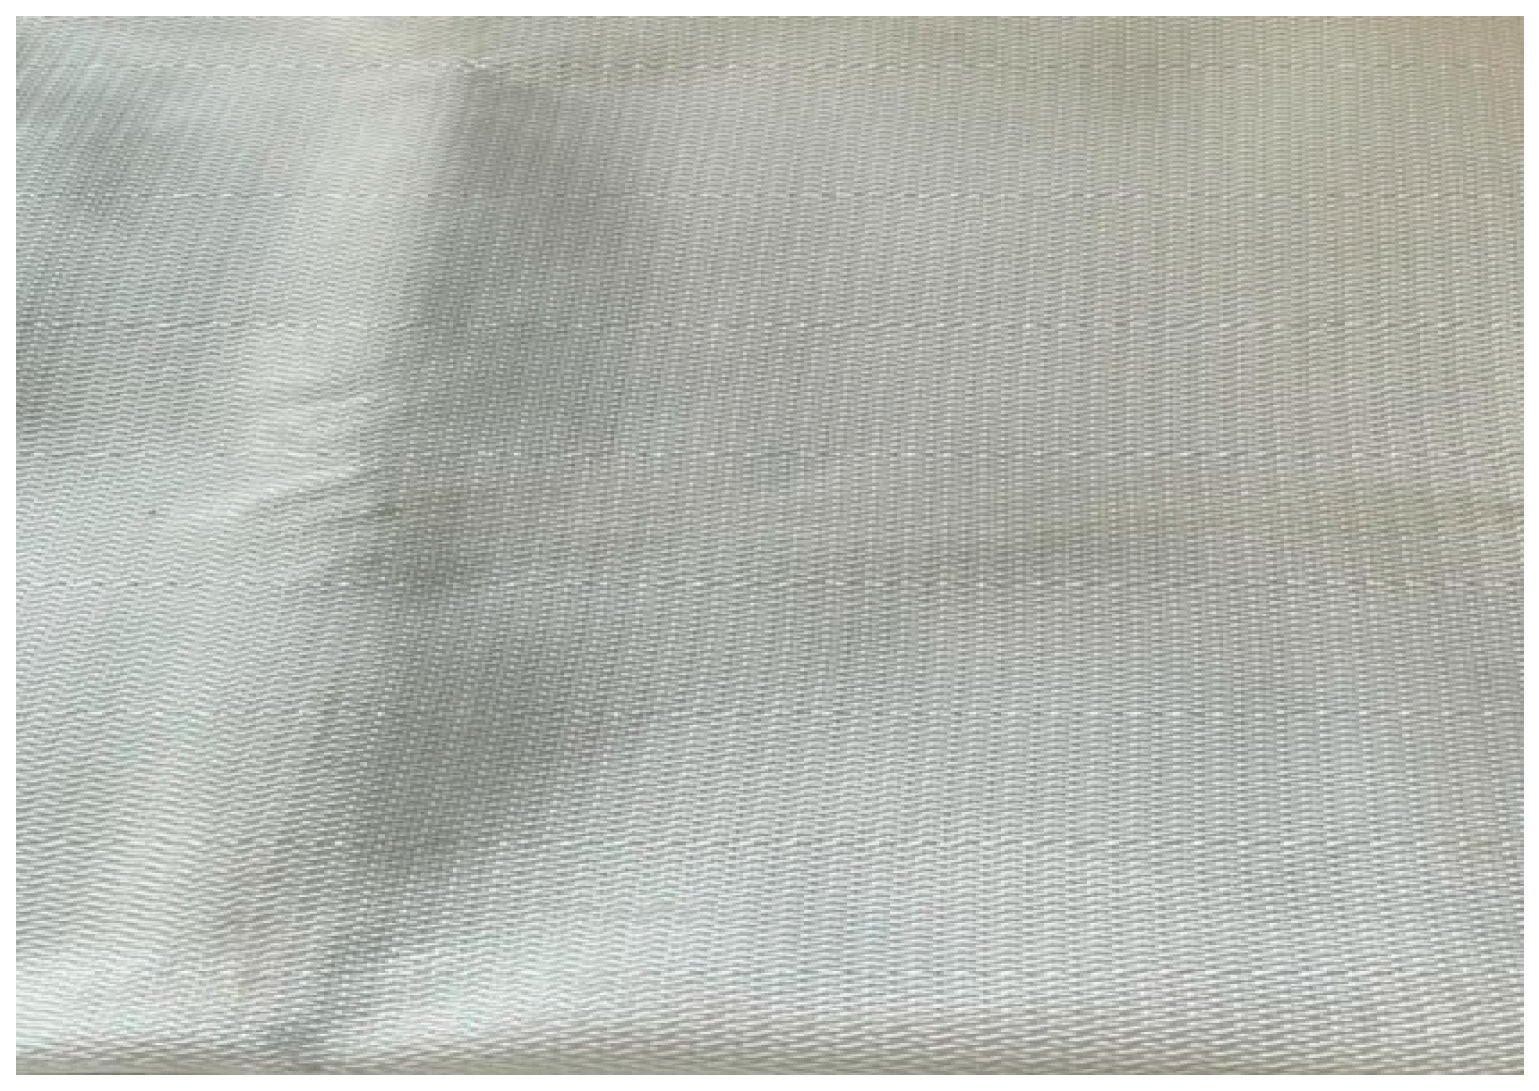
2.1. Materials
2.2. Physical Properties Testing Methods
2.2.1. Determination of Yarns per Unit Length
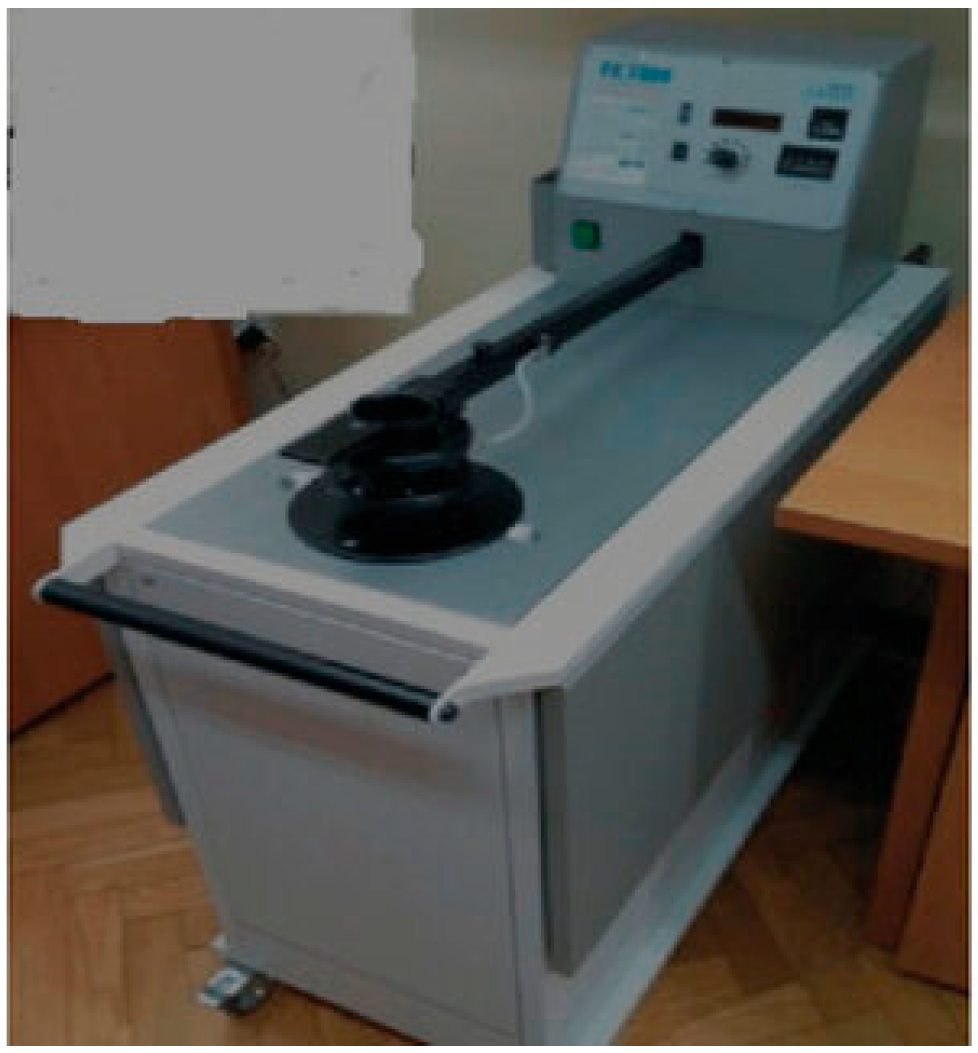
2.2.2. Air Permeability of Blankets
2.2.3. Fabric Weight and Thickness
2.2.4. Electrical Resistance Test
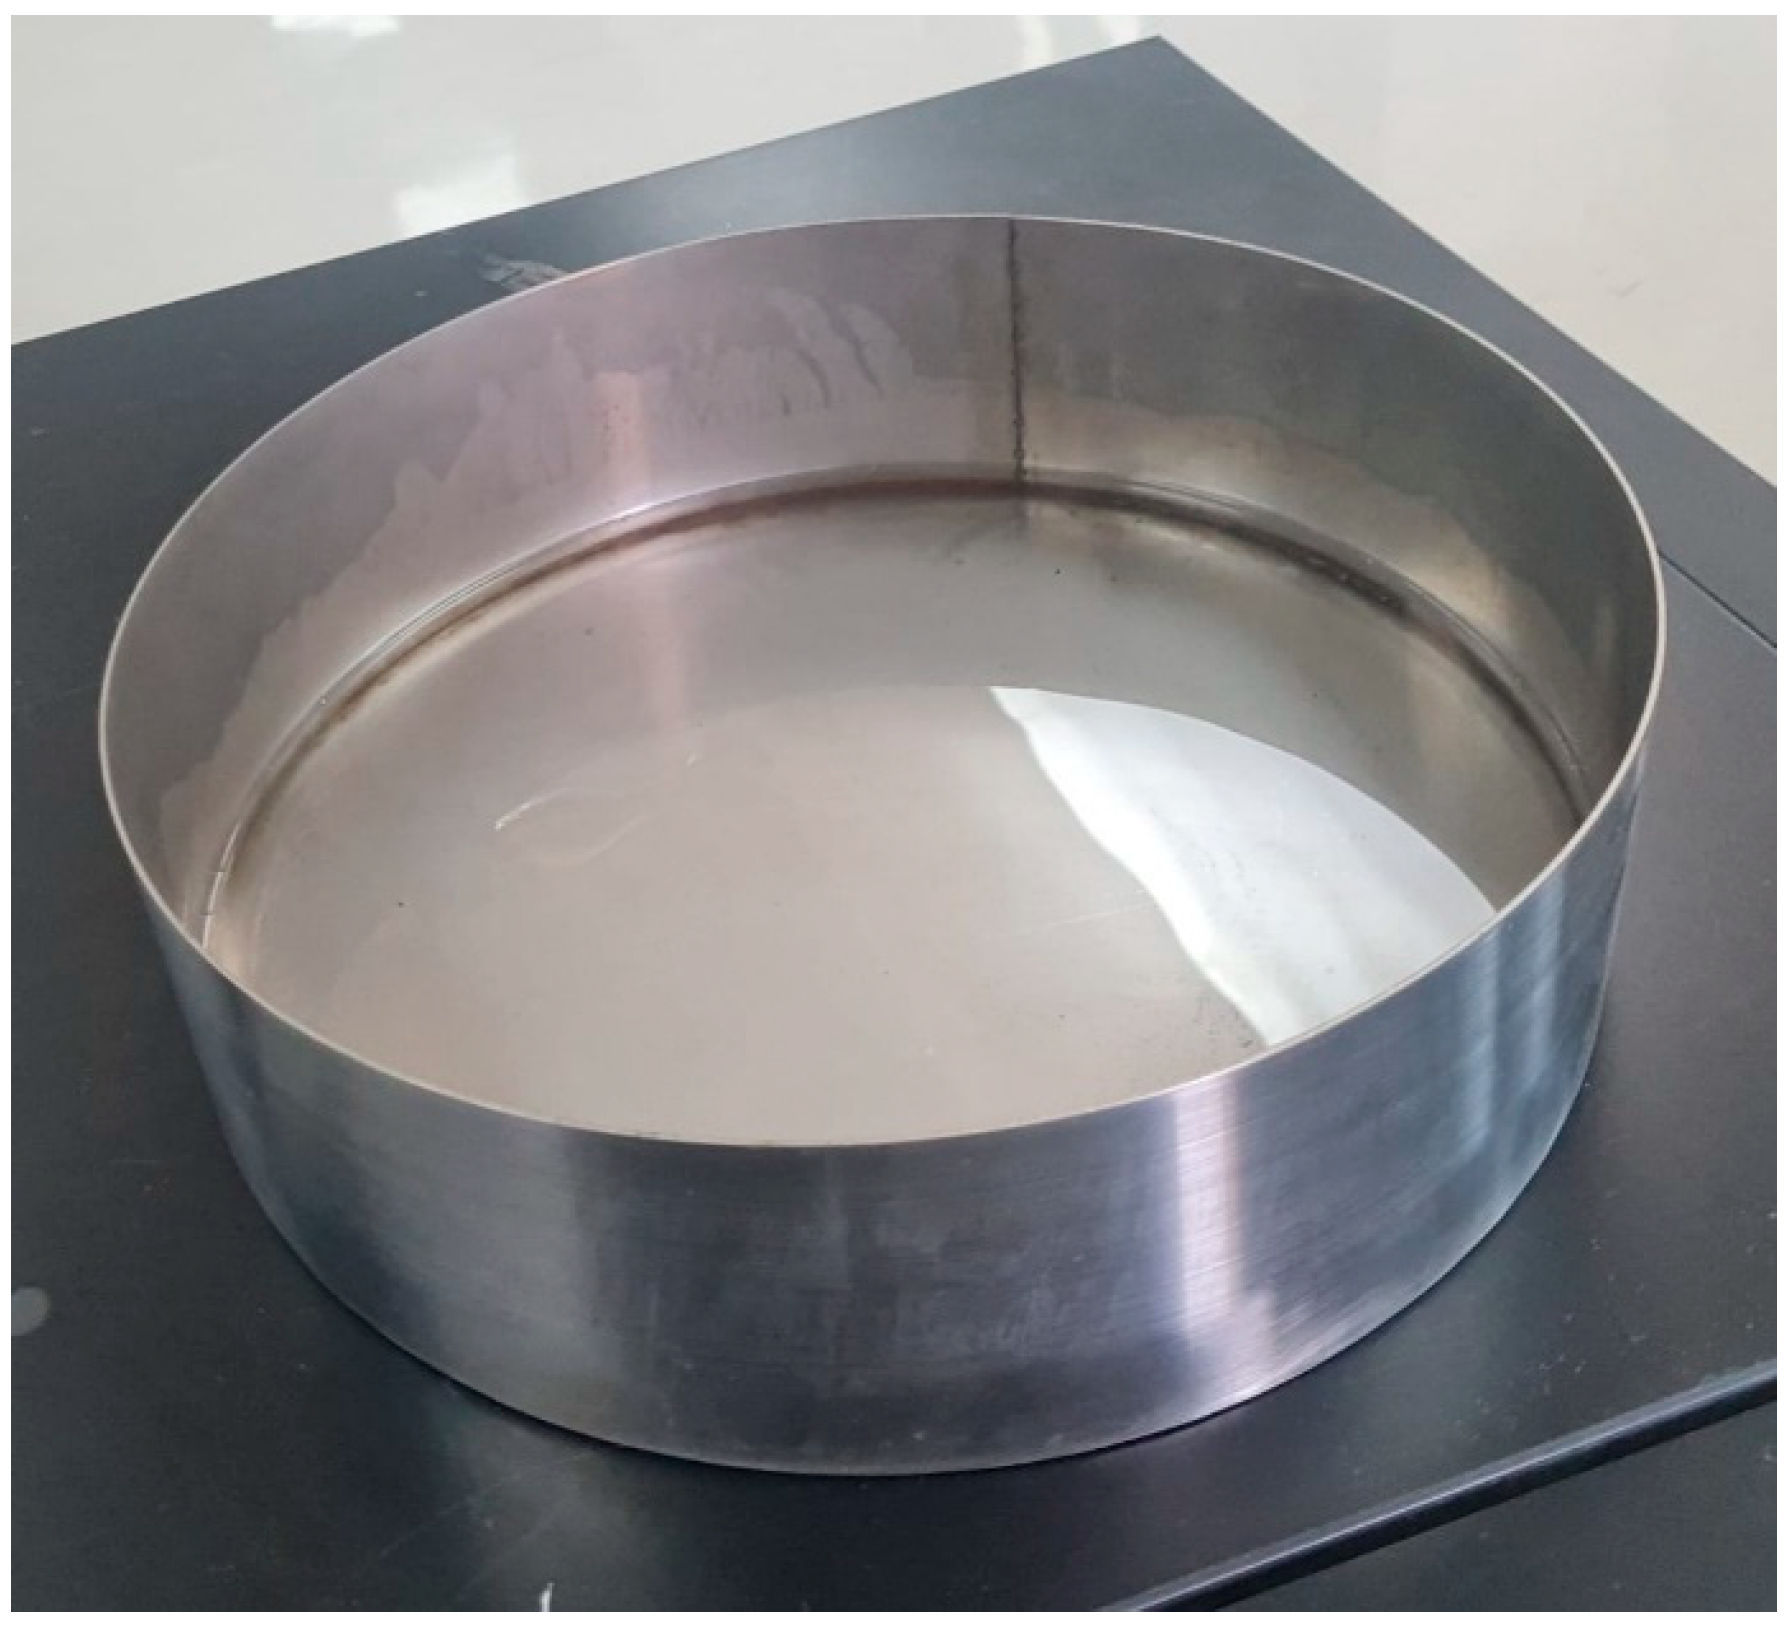
2.3. Blankets Fire Suppression Testing
Fire Performance Tests (Volatile Liquid Test Fires)
2.4. Thermal Response Characteristics
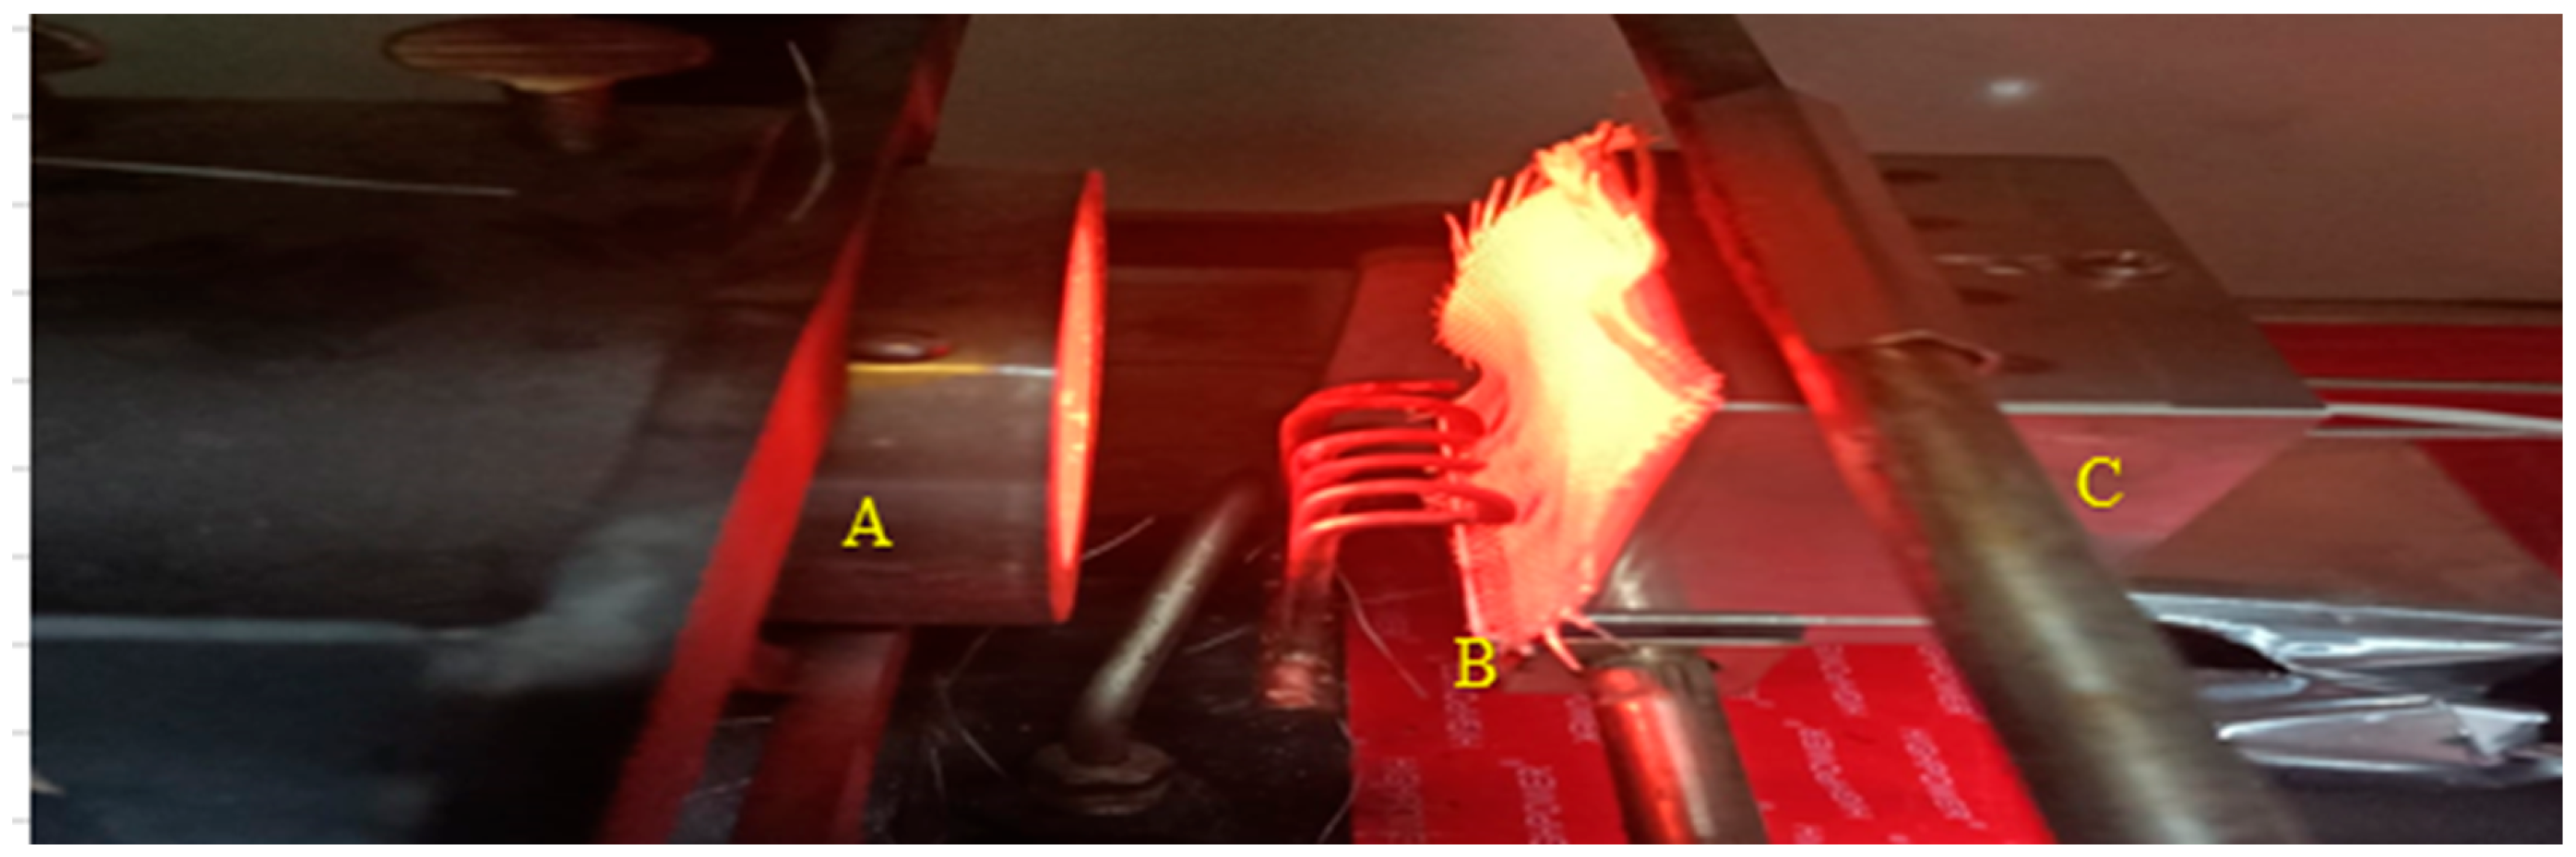
2.4.1. Exposure to Heat Flux
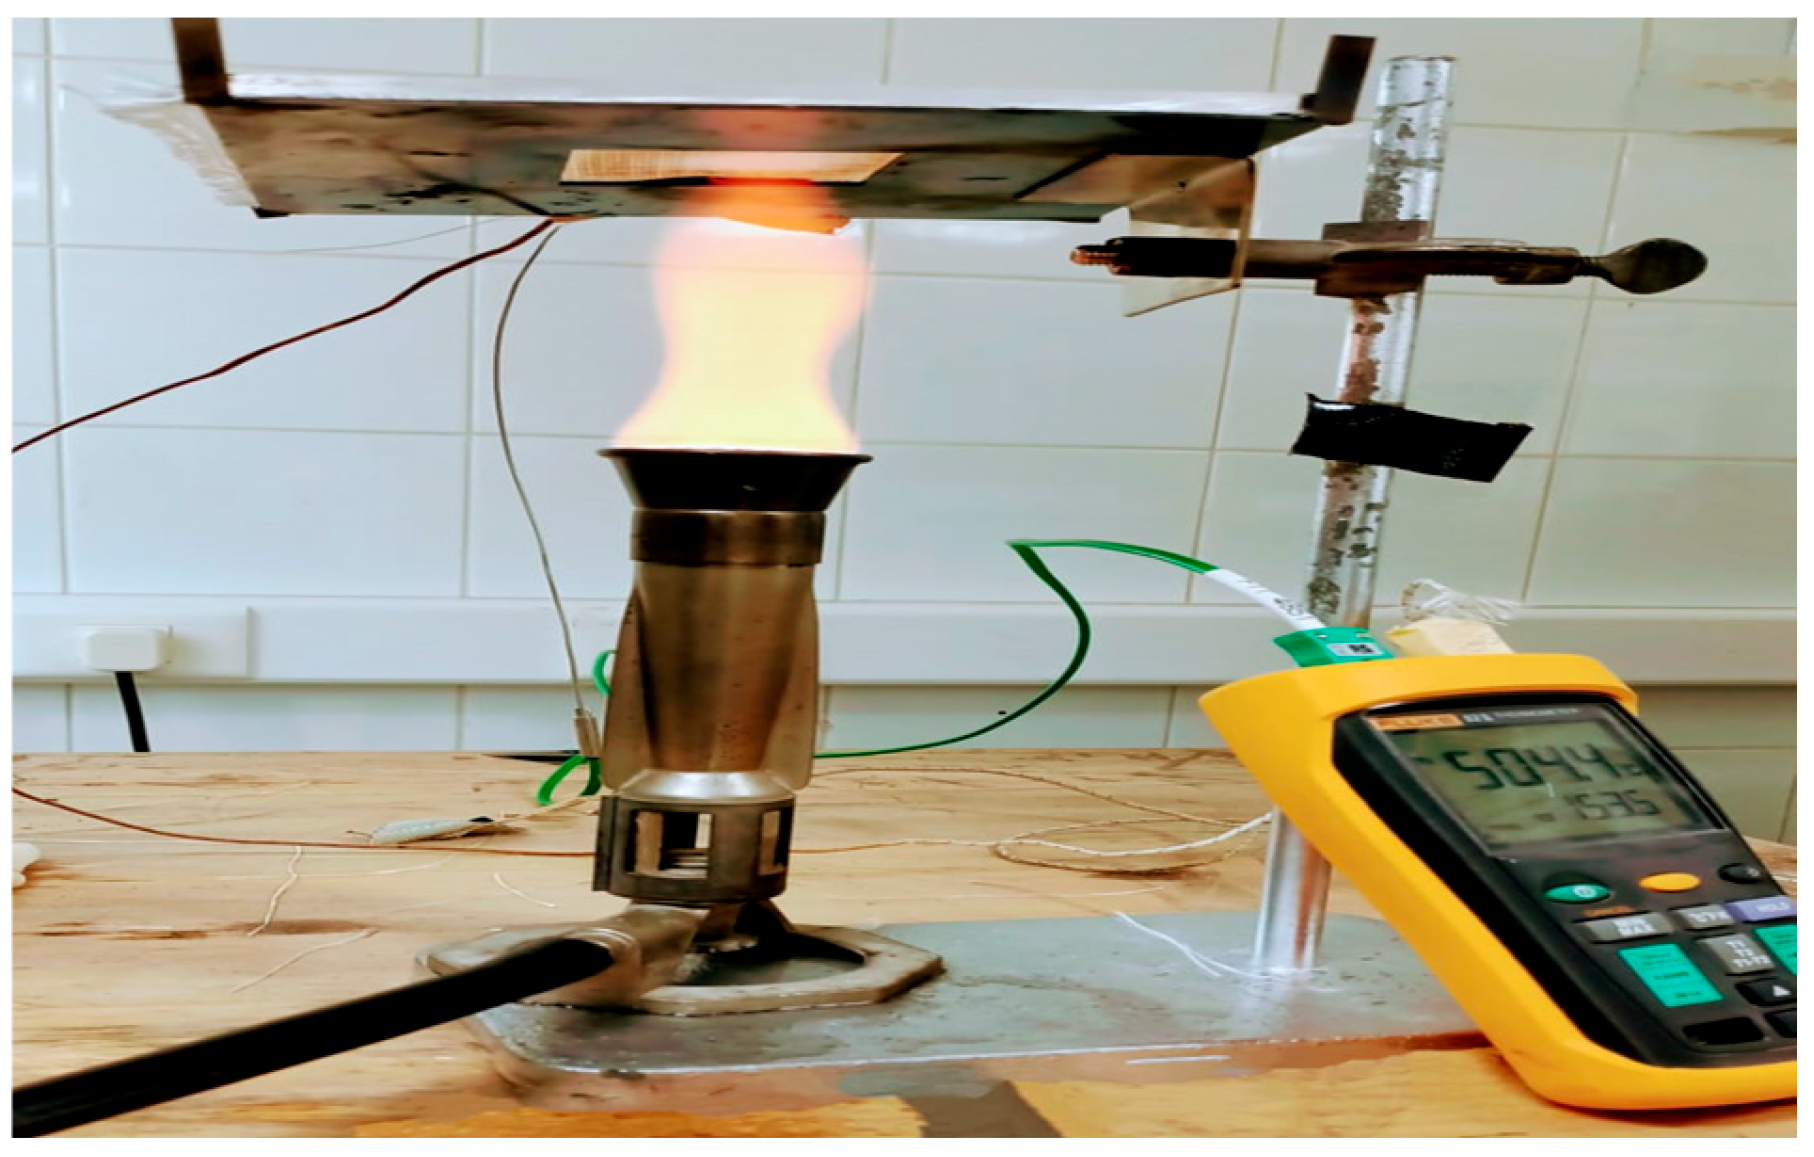
2.4.2. Temperature Profile Measurement of Blanket Samples
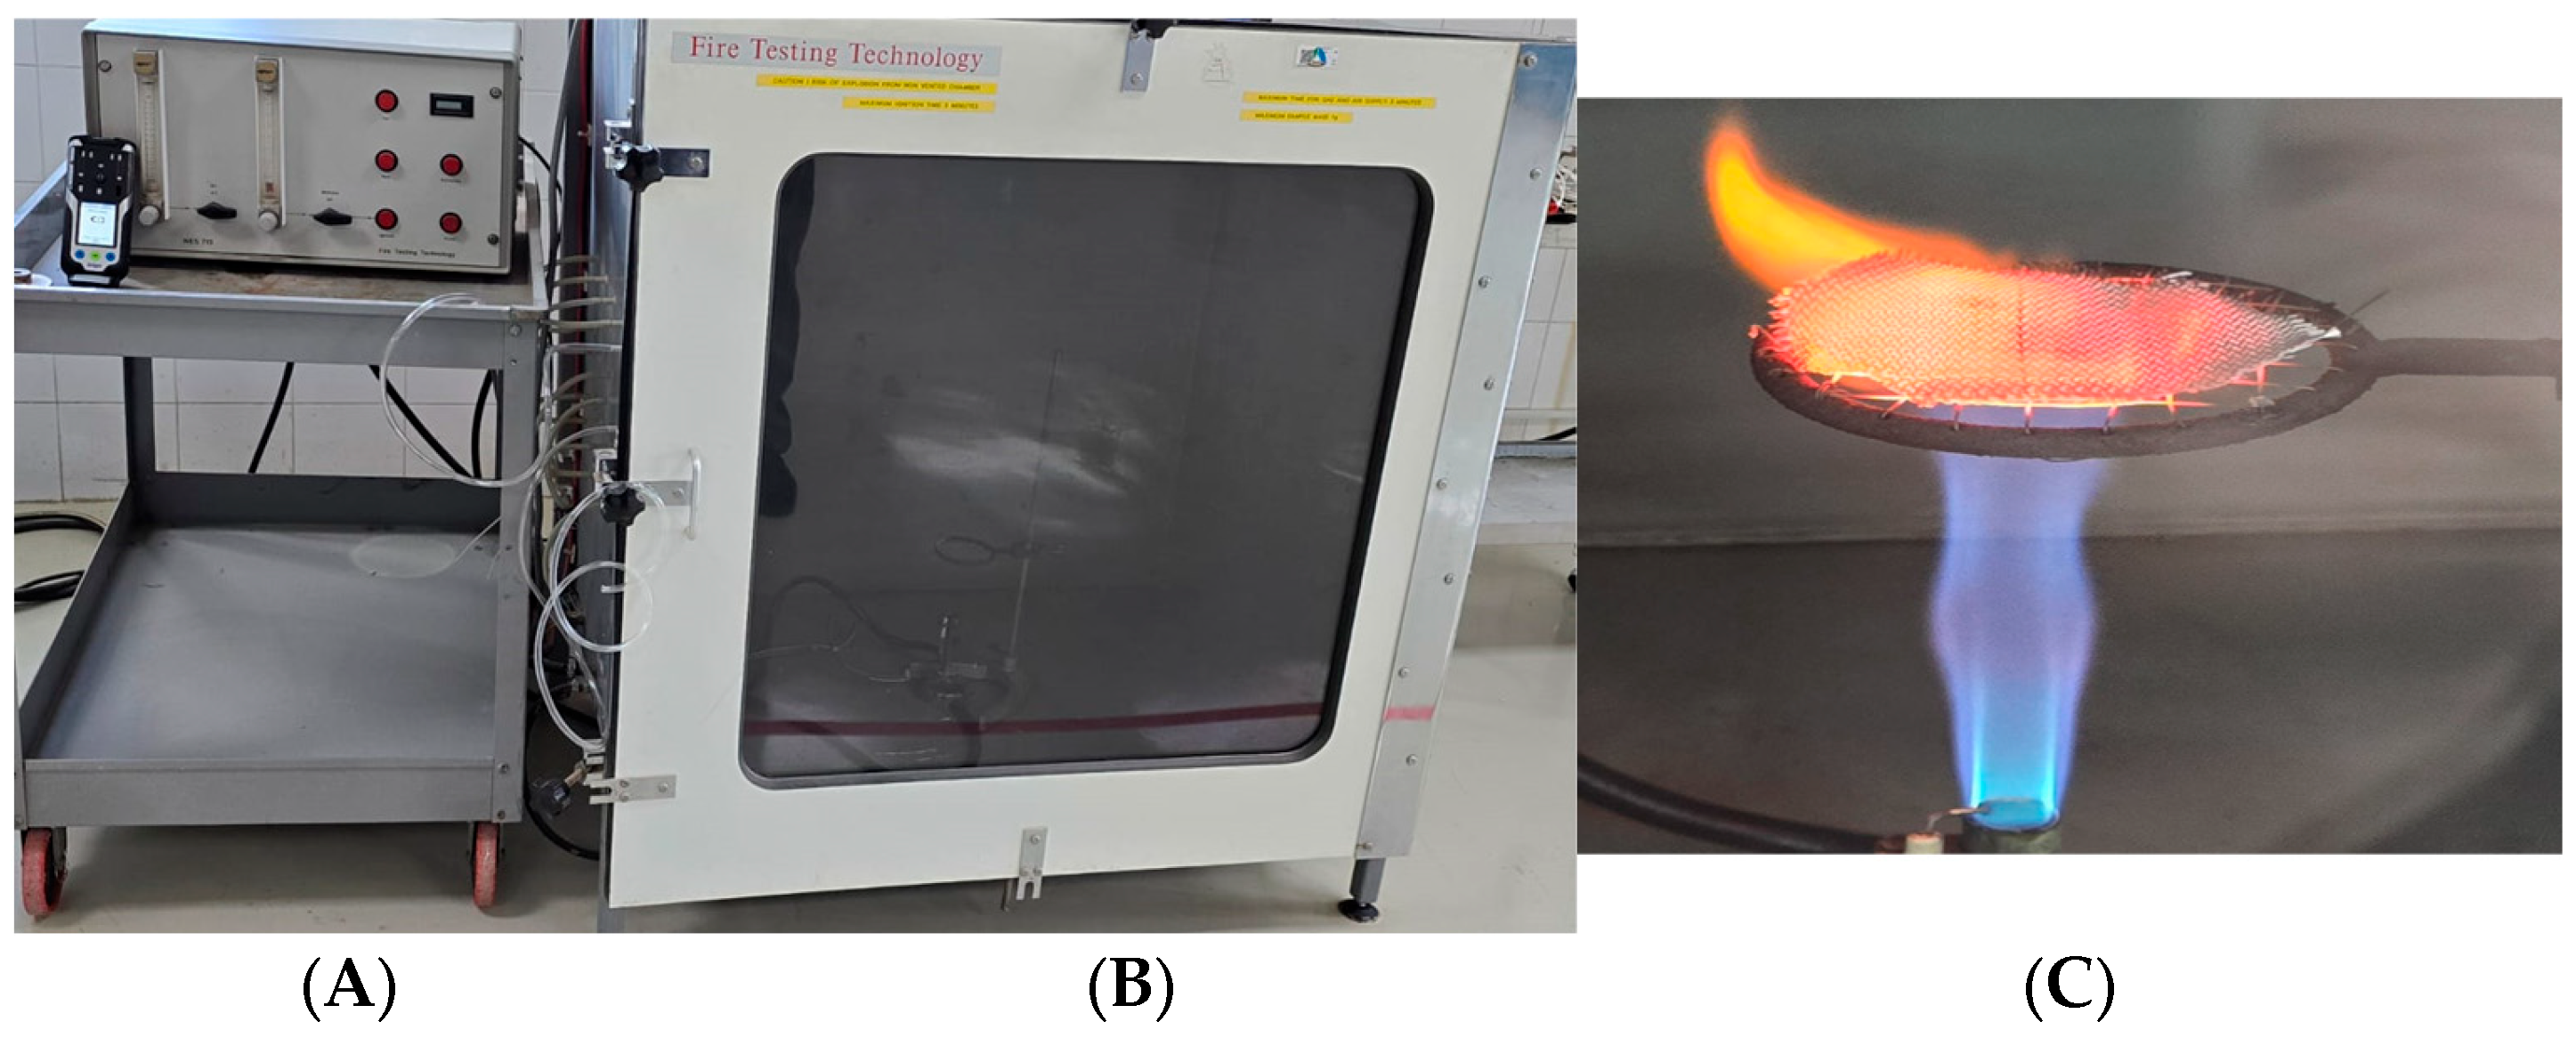
2.5. Toxicity of the Evolved Gases During Process of Fire Suppression
3. Results and Discussion
3.1. Summary of Results and Discussion
- Physical Properties
- -
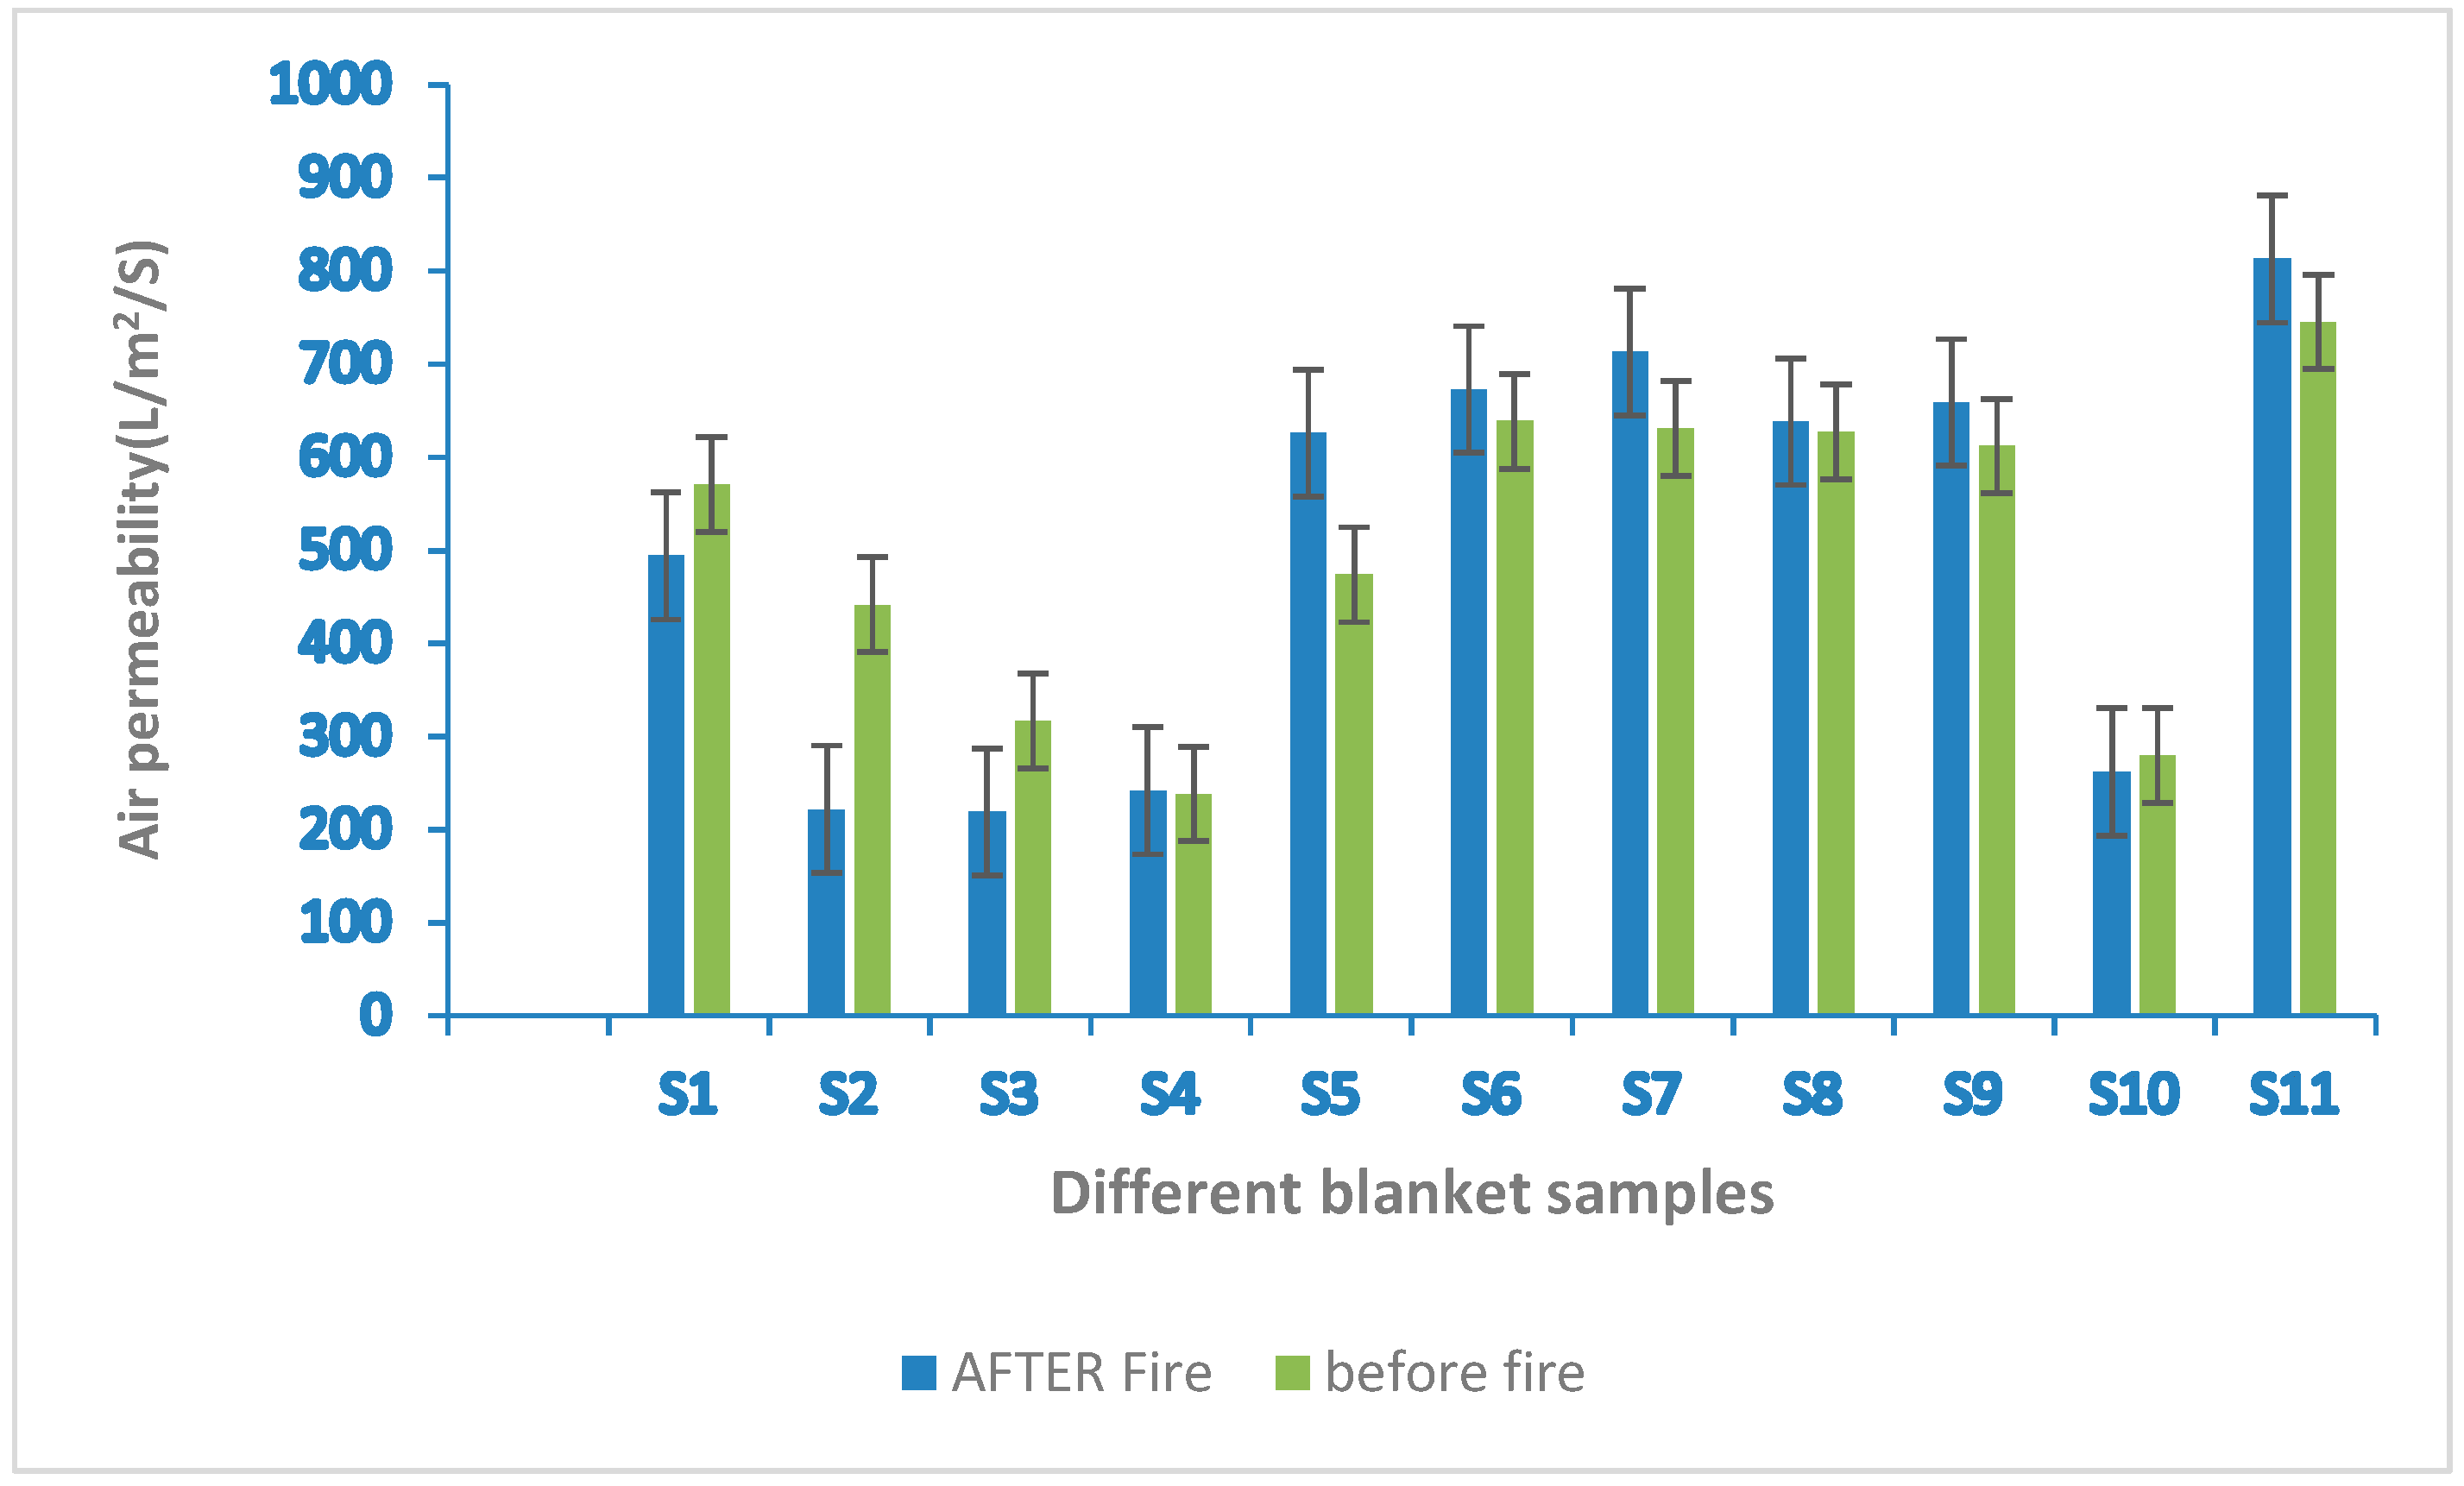
- Air Permeability: The air permeability of blanket samples varied significantly, with values ranging from 317 to 745 L/m2/s before the fire test. After the fire test, some samples showed a decrease due to fiber swelling and densification, while others increased due to fiber separation. Sample S11 had the highest air permeability (745 L/m2/s) and S10 had the lowest (279 L/m2/s).
- -
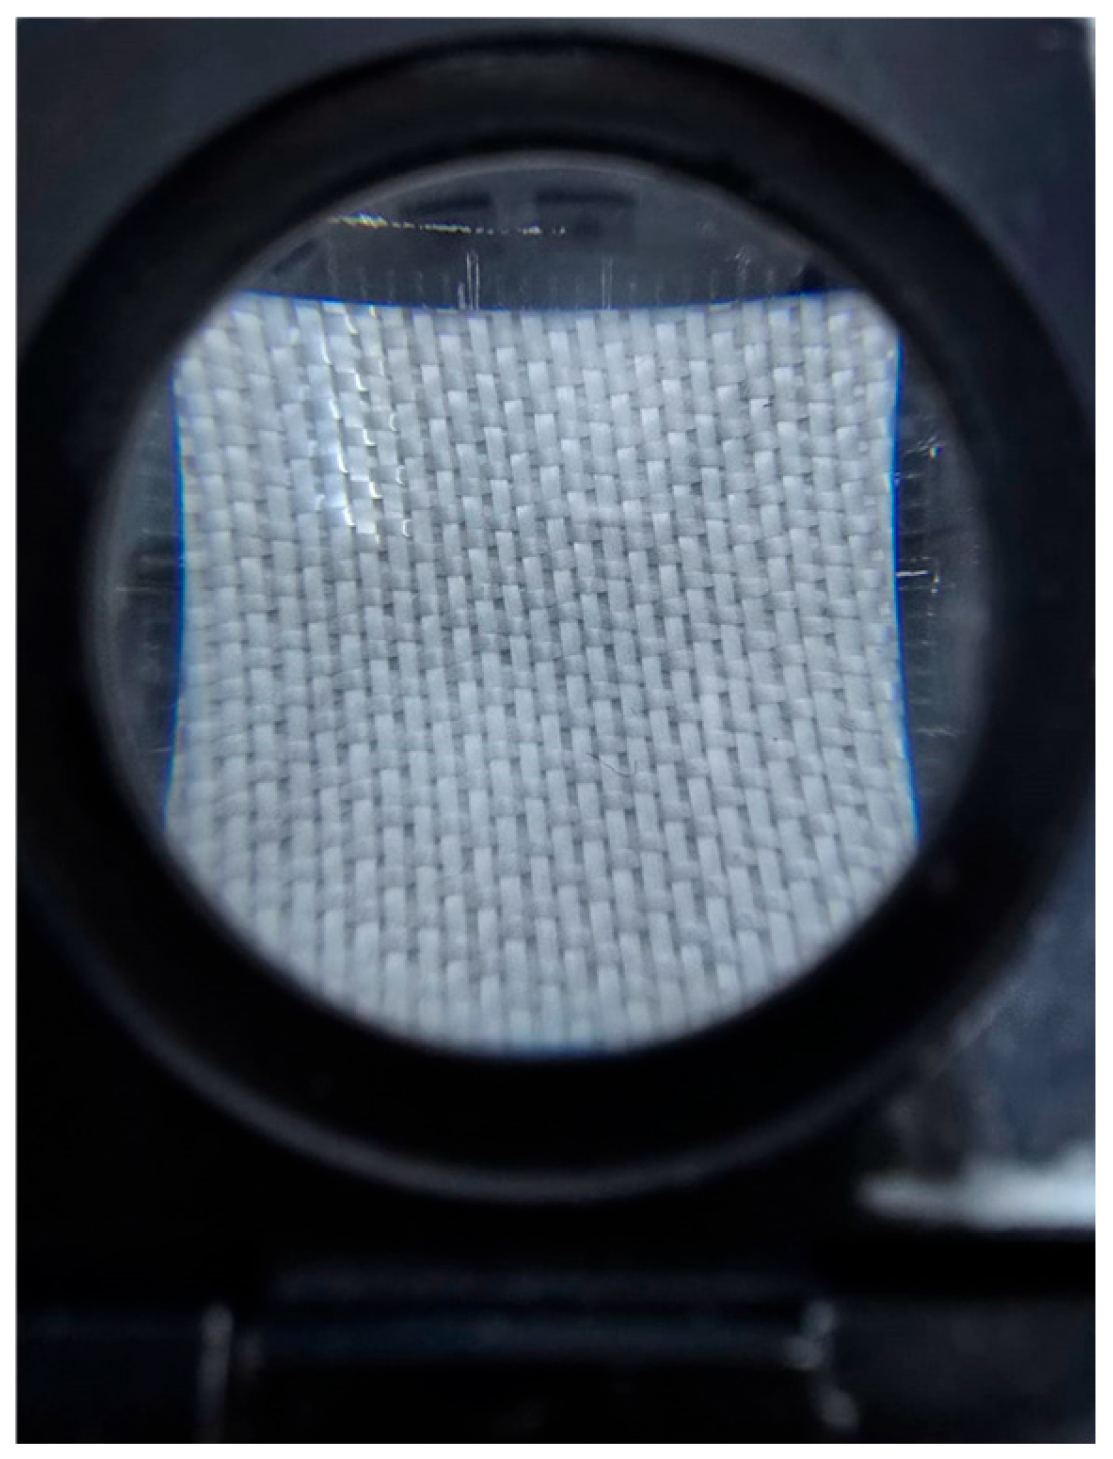
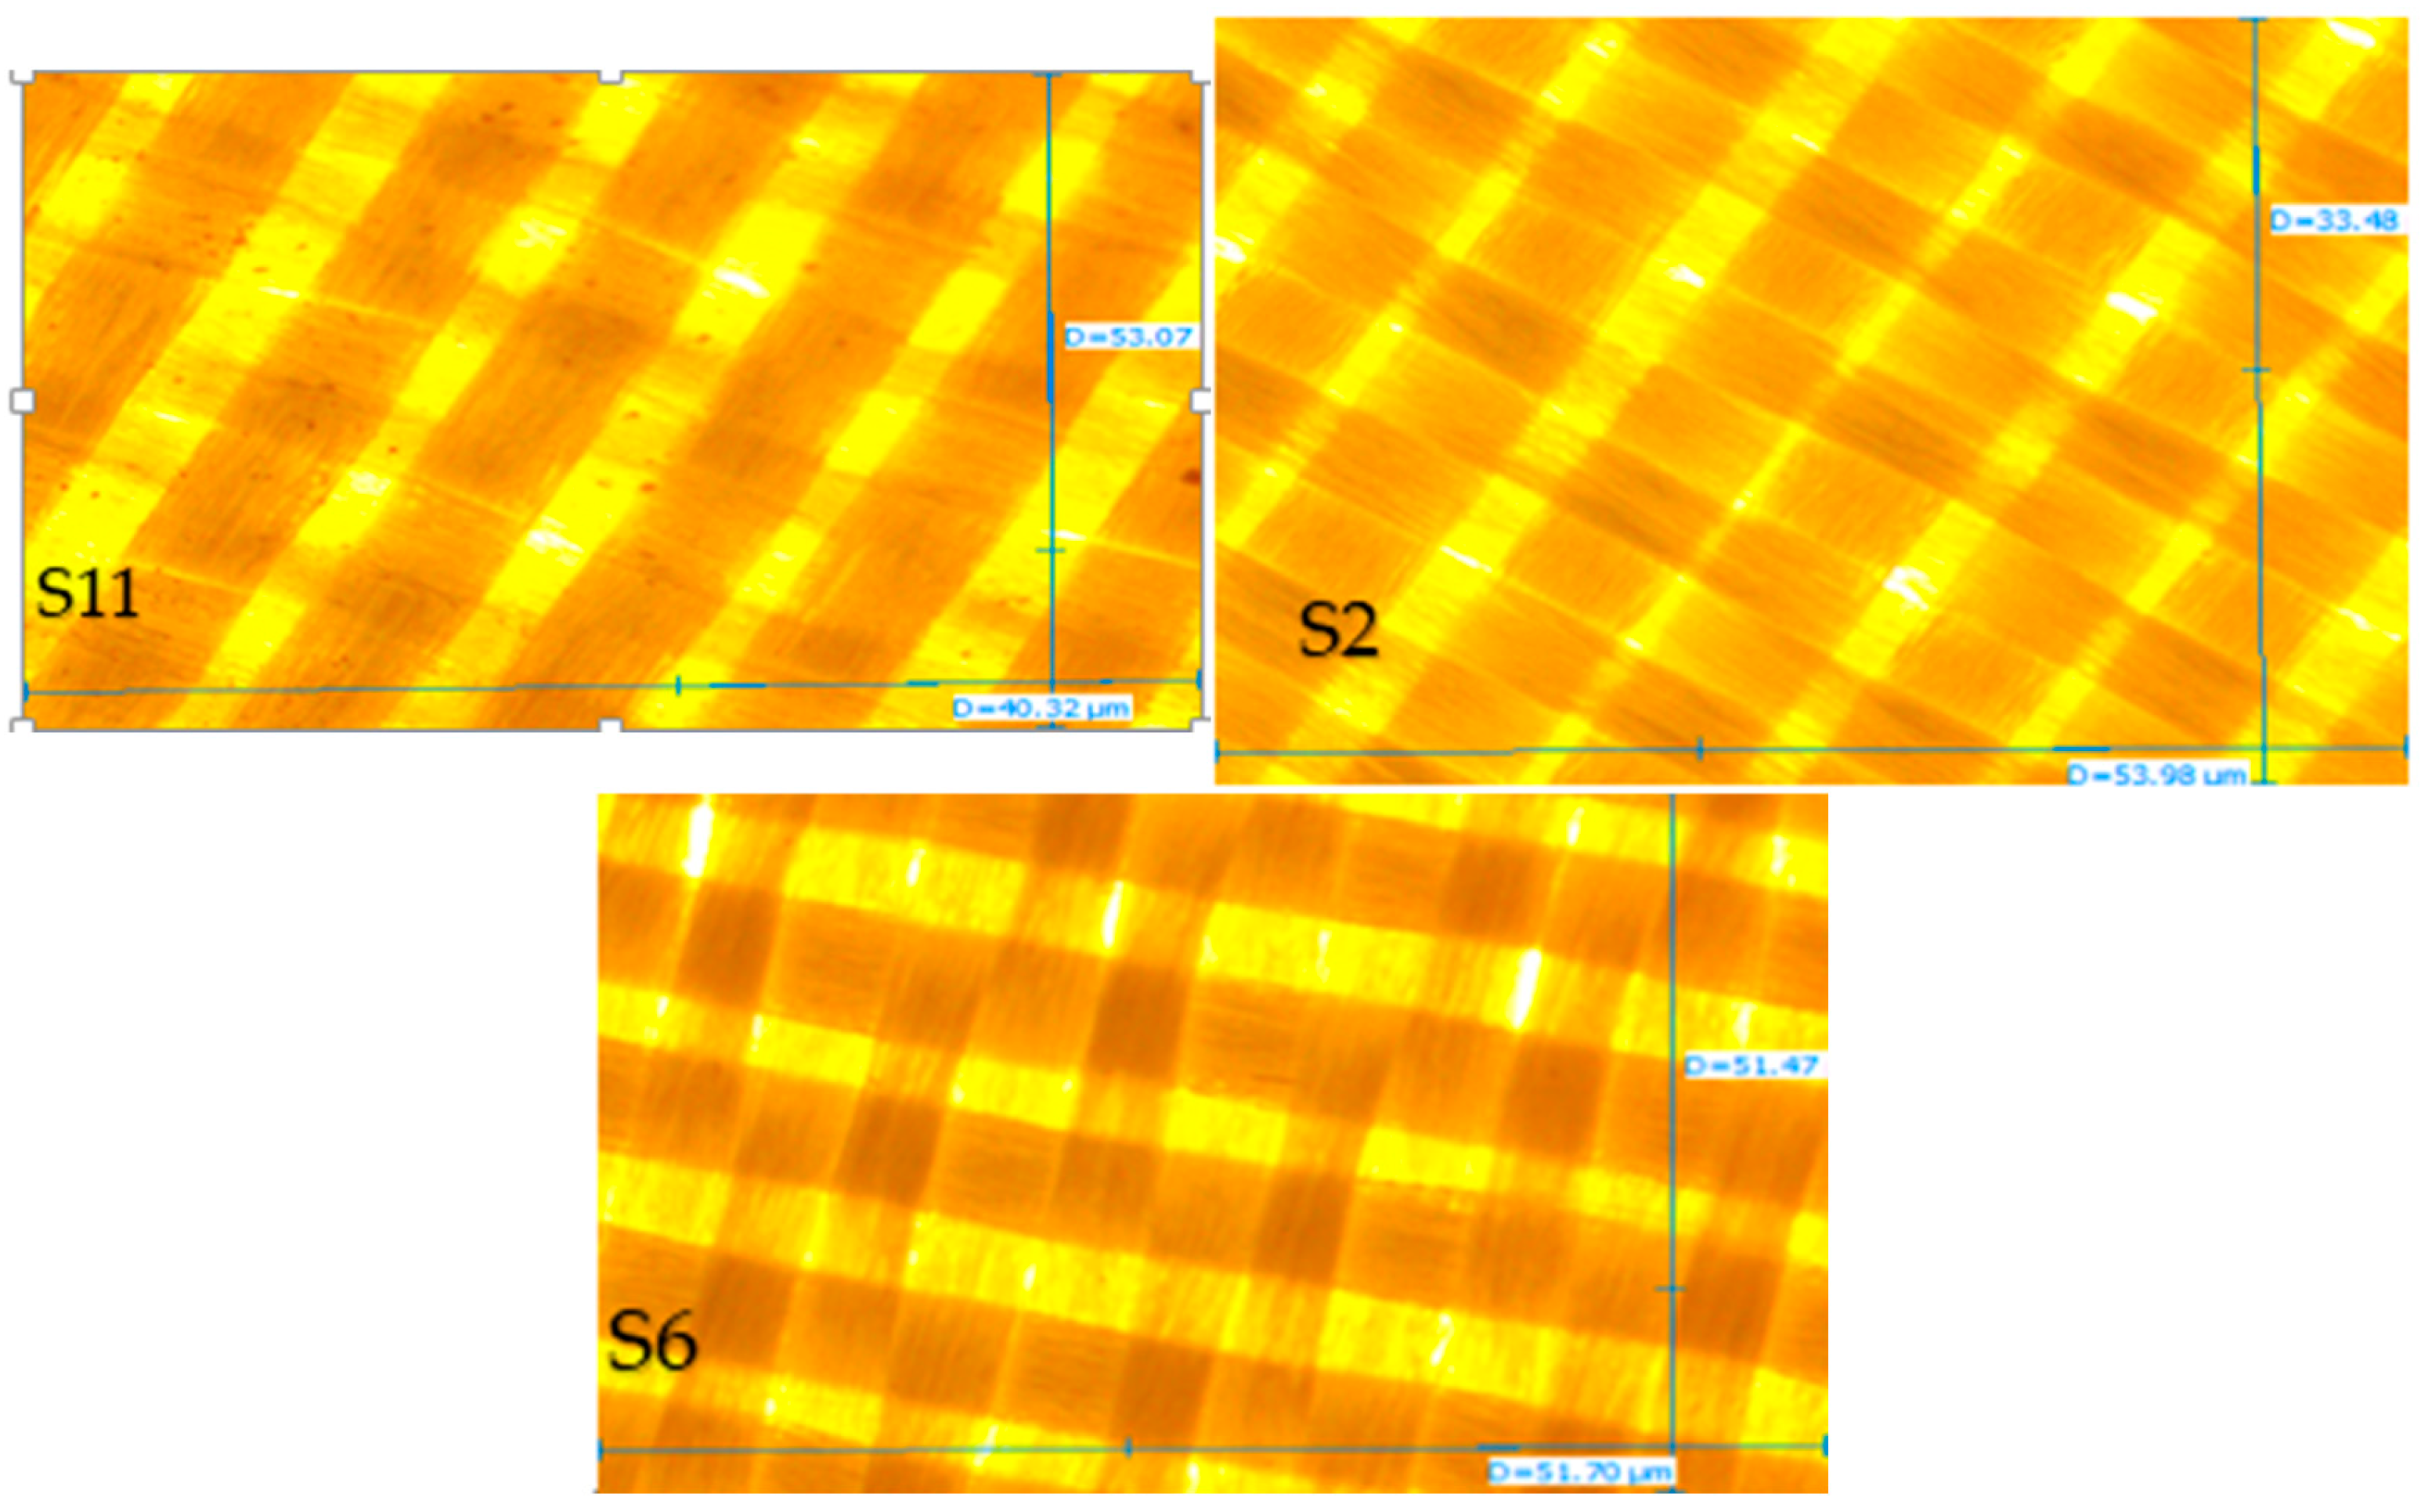
- Microscopic Analysis: Microscopy images revealed varying air gap structures among samples, correlating with air permeability results.
- -
- Textile Count, Insulation, and Thickness: The samples had two thickness categories (0.3 mm and 0.4 mm), influencing their weight (0.6–0.7 kg/m2) and air permeability. The highest static insulation (370 MΩ) was observed in S10, while S2 had the lowest (70 MΩ).
- Thermal Properties
- -
- Heat Blocking Efficiency (HBE):
- ◦
- At 25 kW/m2, the HBE ranged from 36.76% (S6) to 61.08% (S7). Samples with lower air permeability generally had better thermal insulation.
- ◦
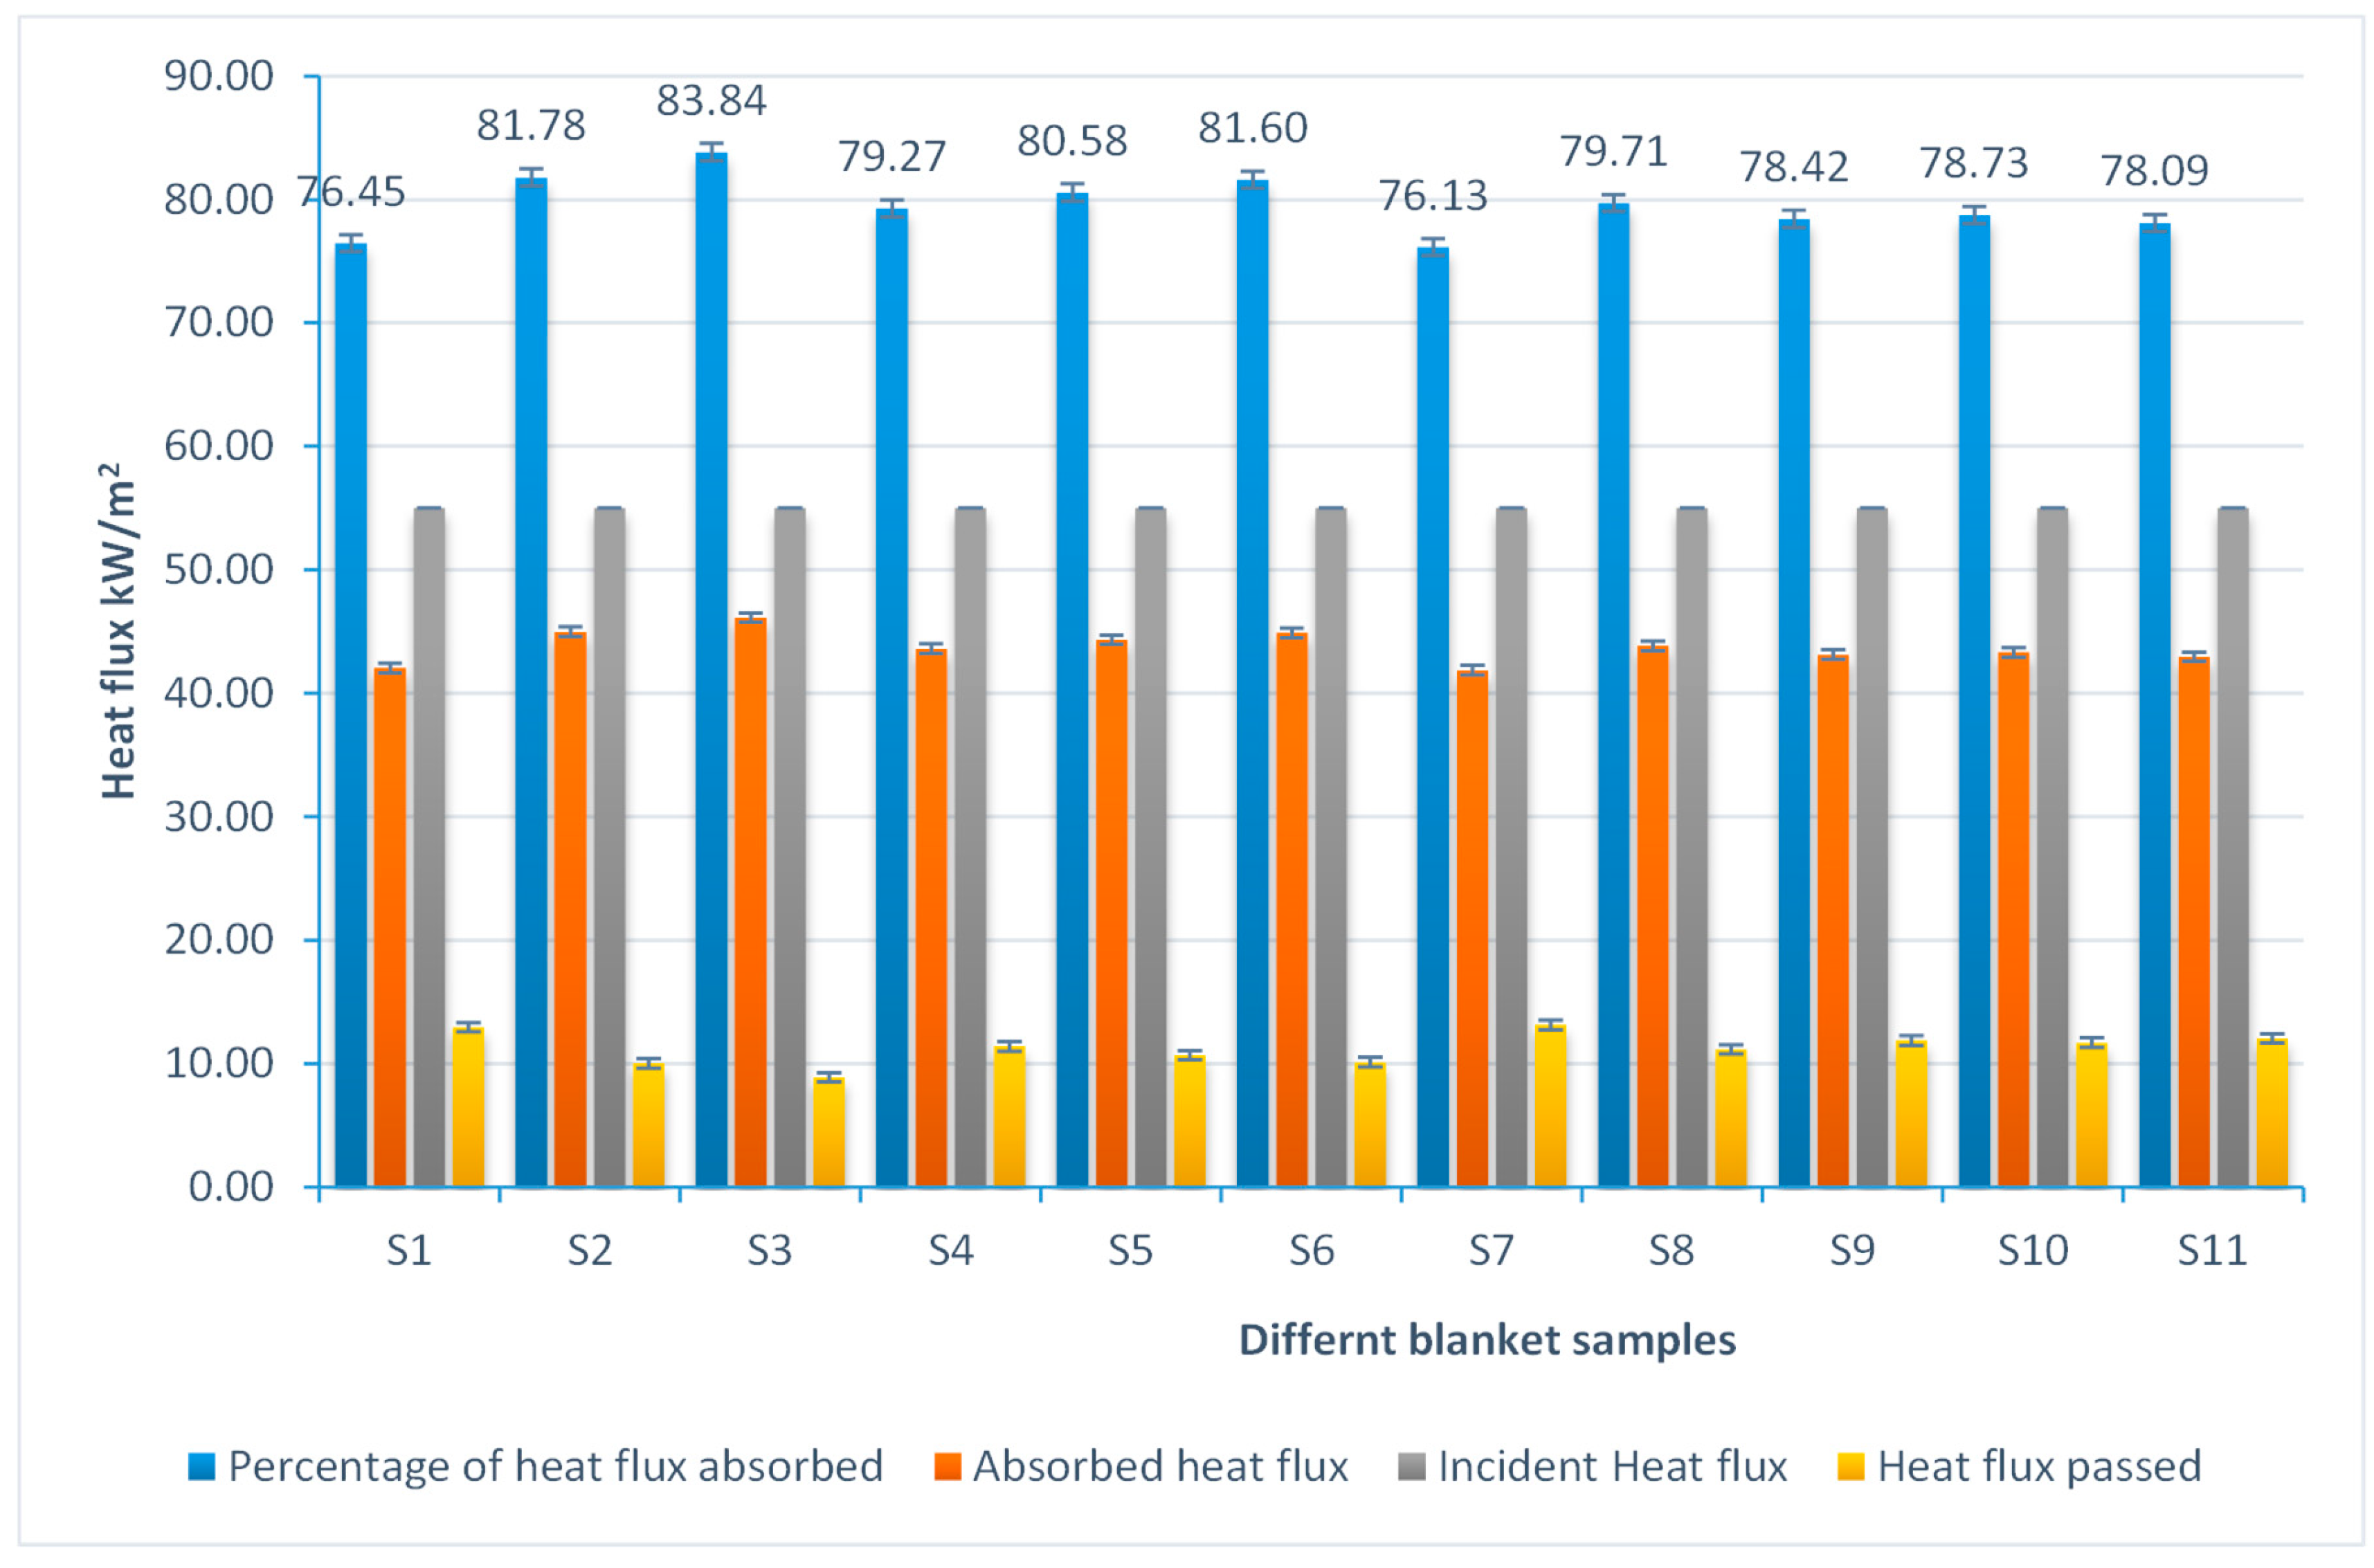
- At 55 kW/m2, efficiency increased across all samples, with S3 achieving the highest HBE (83.84%) and S7 the lowest (76.45%).
- -
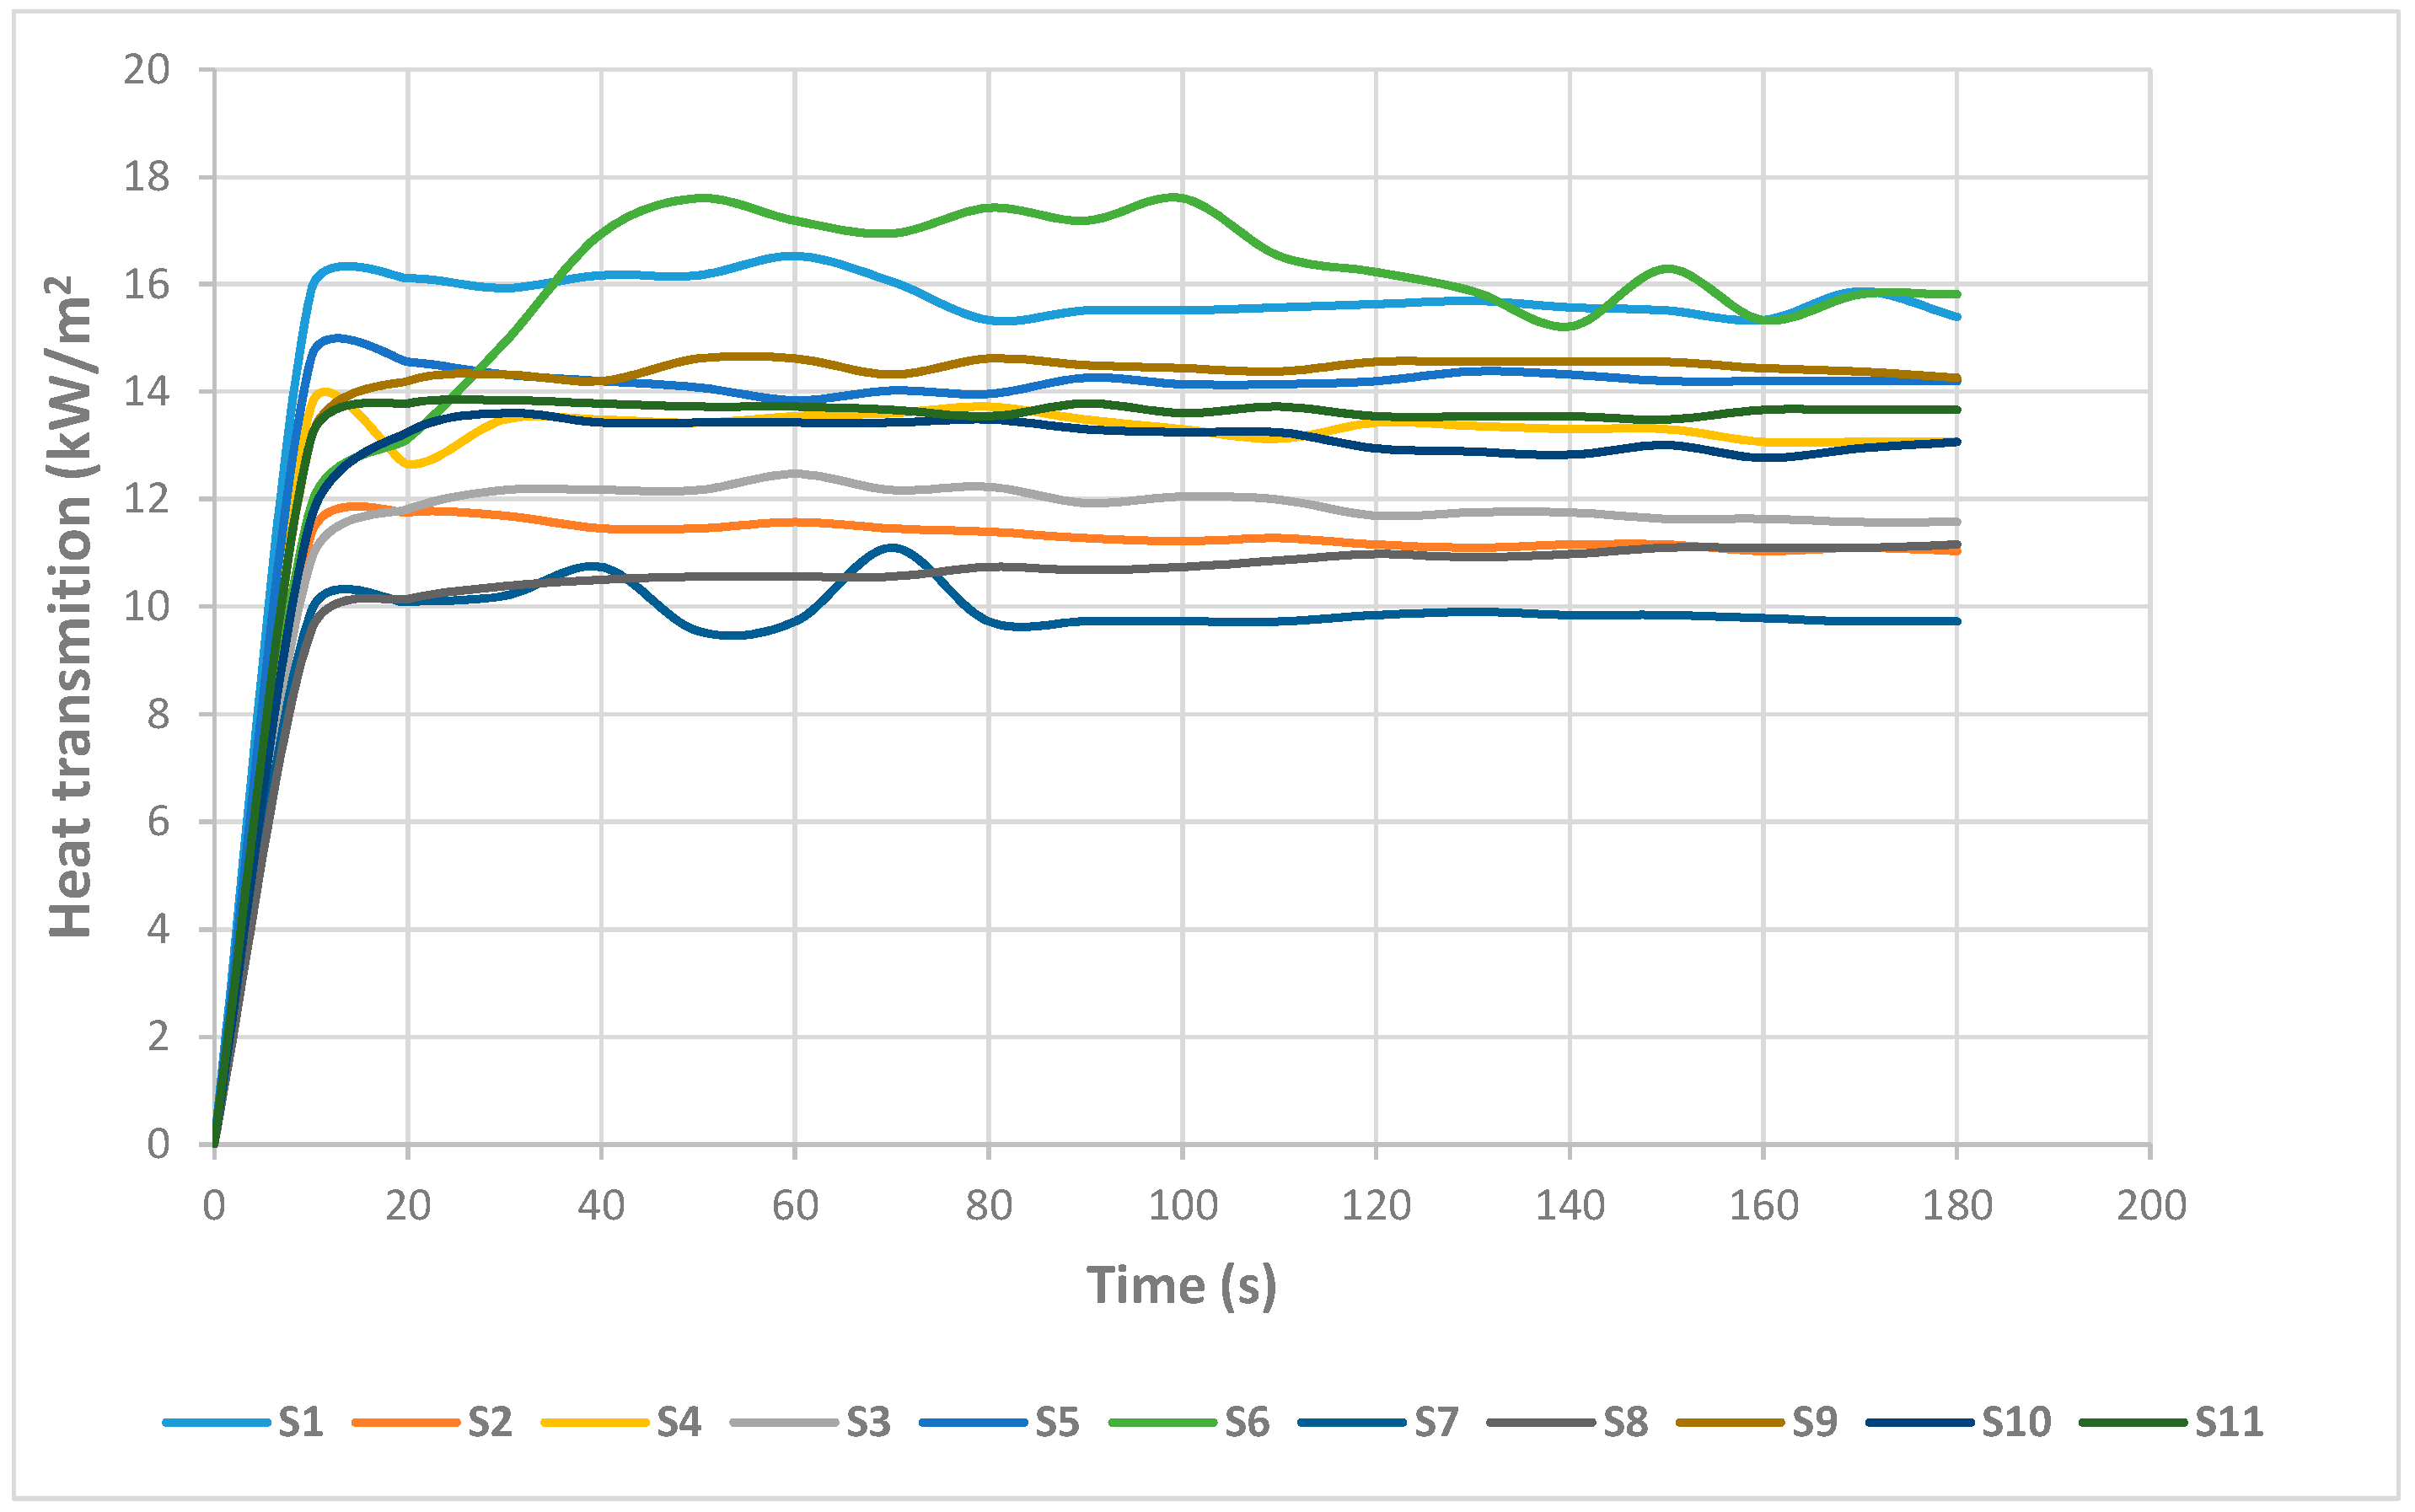
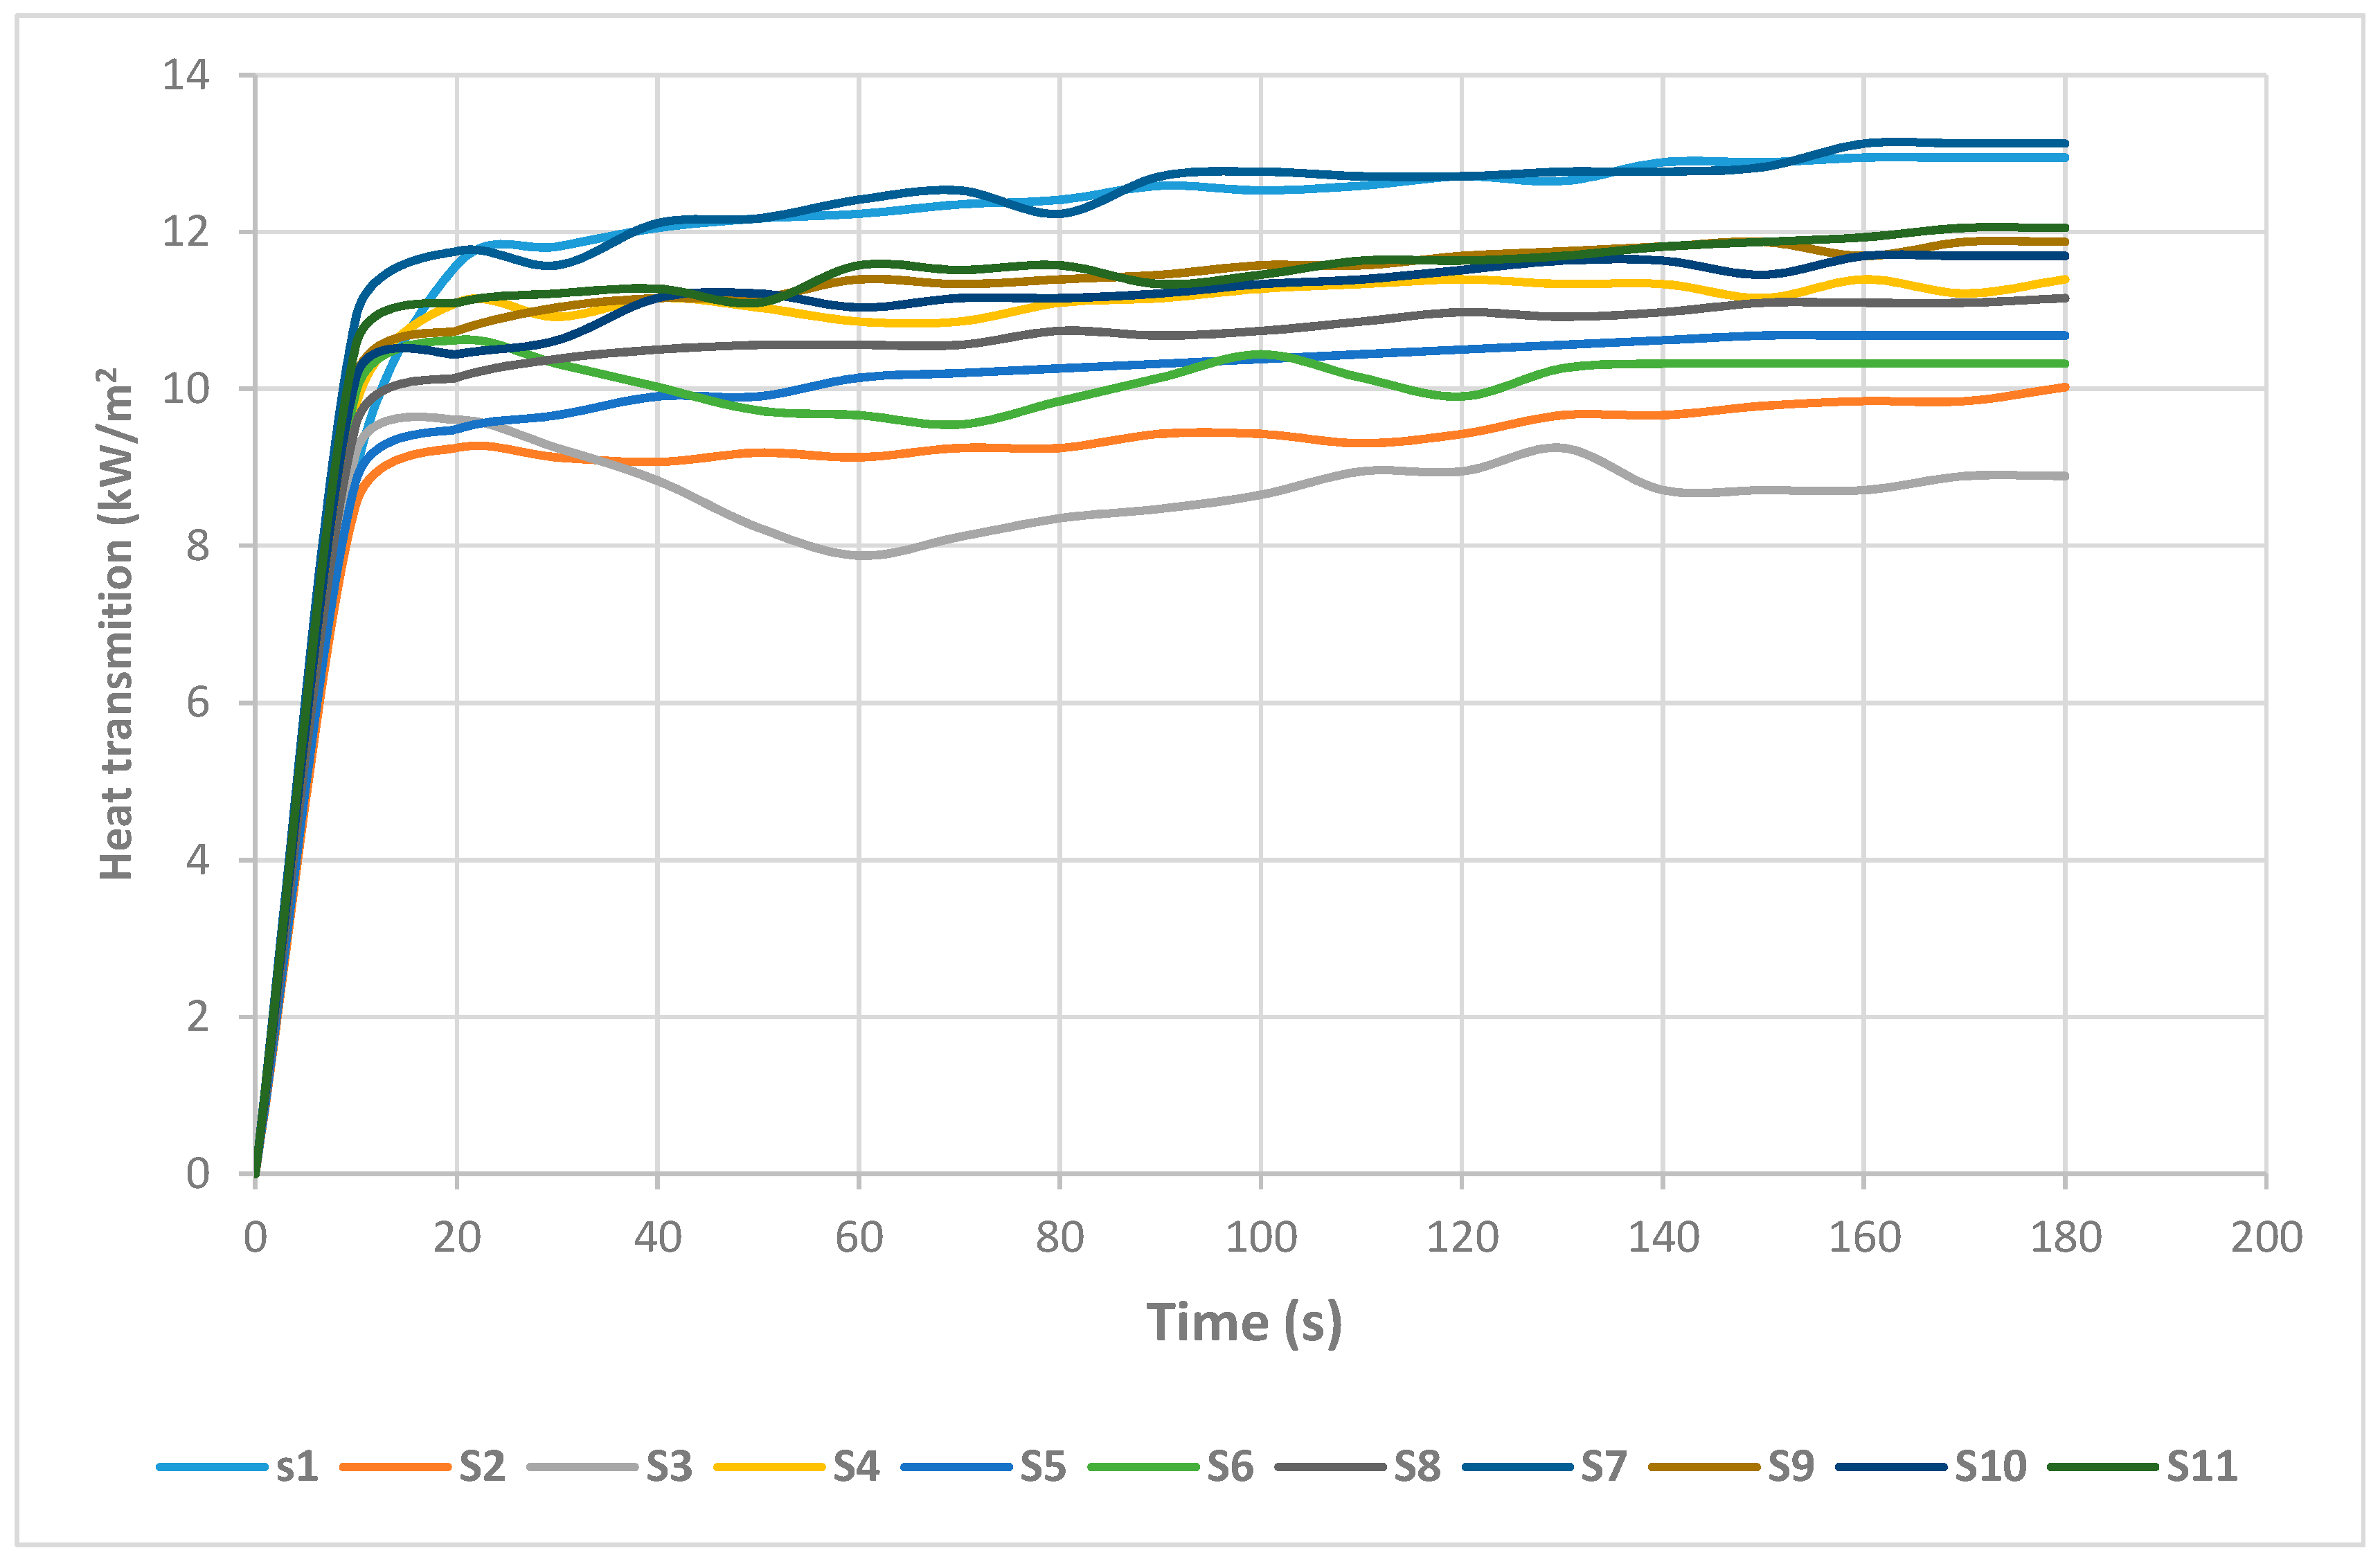
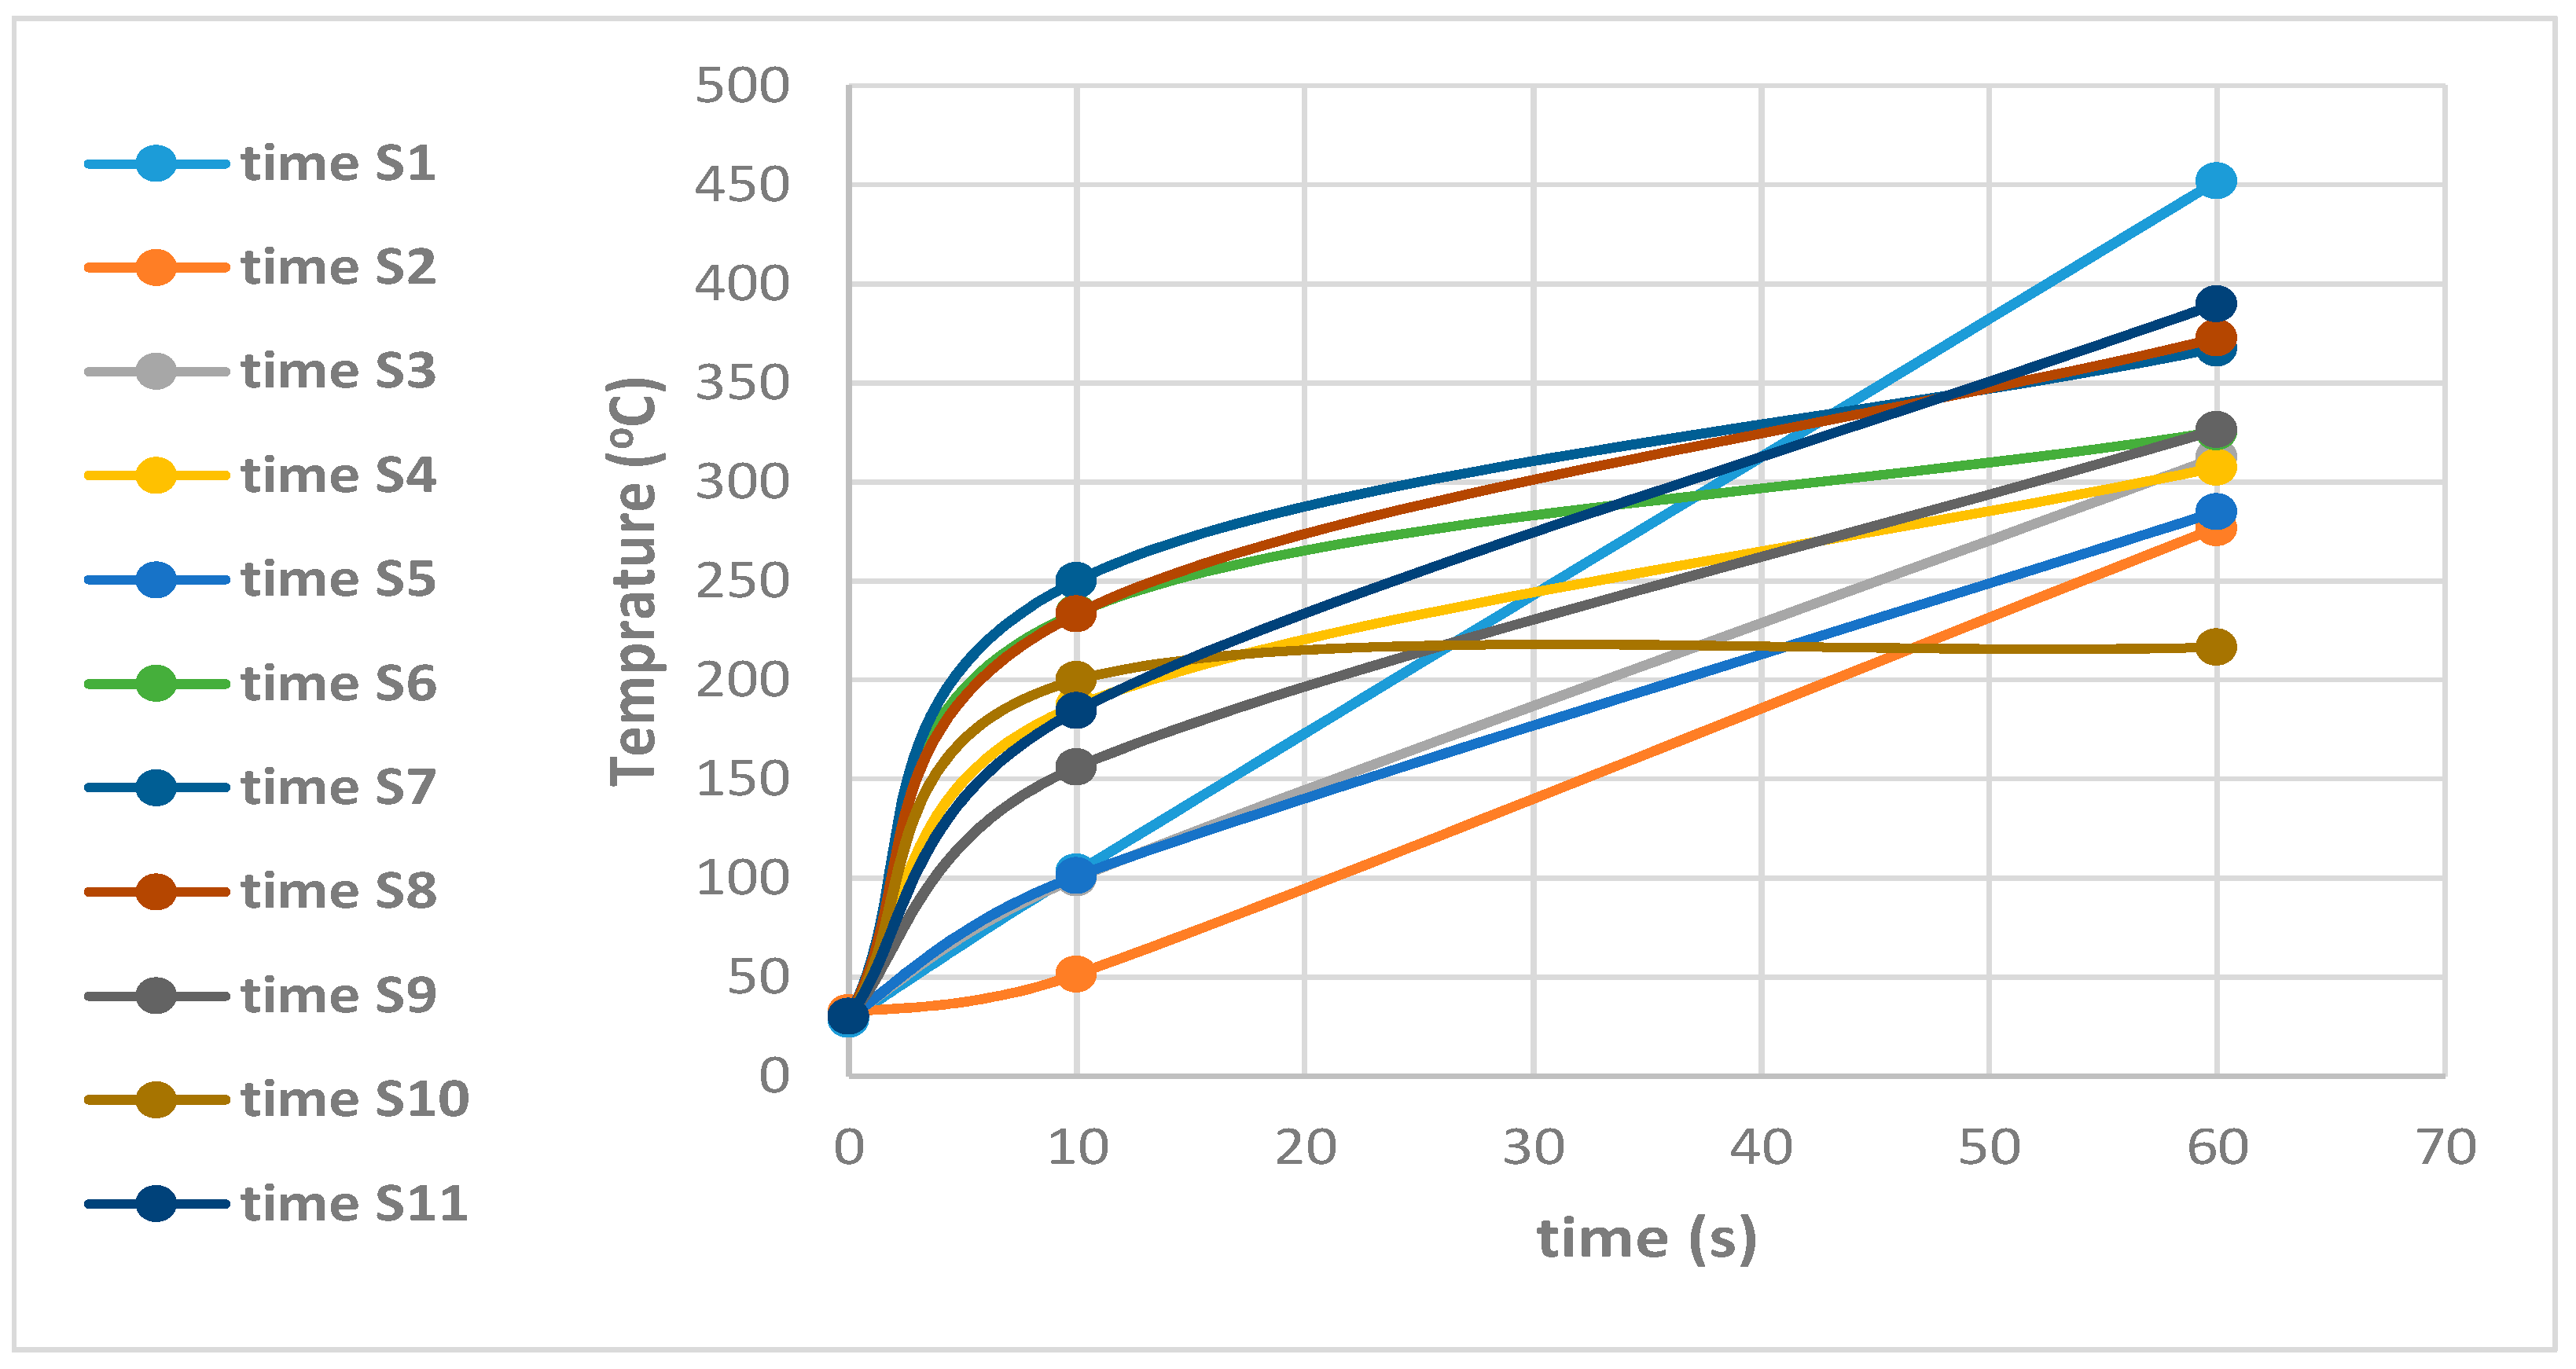
- Heat Transmission:
- ◦
- The time to reach steady-state transmission varied among samples, with most reaching equilibrium within 20–60 s.
- ◦
- At higher heat flux, blankets with tighter weaves and lower air permeability exhibited better insulation.
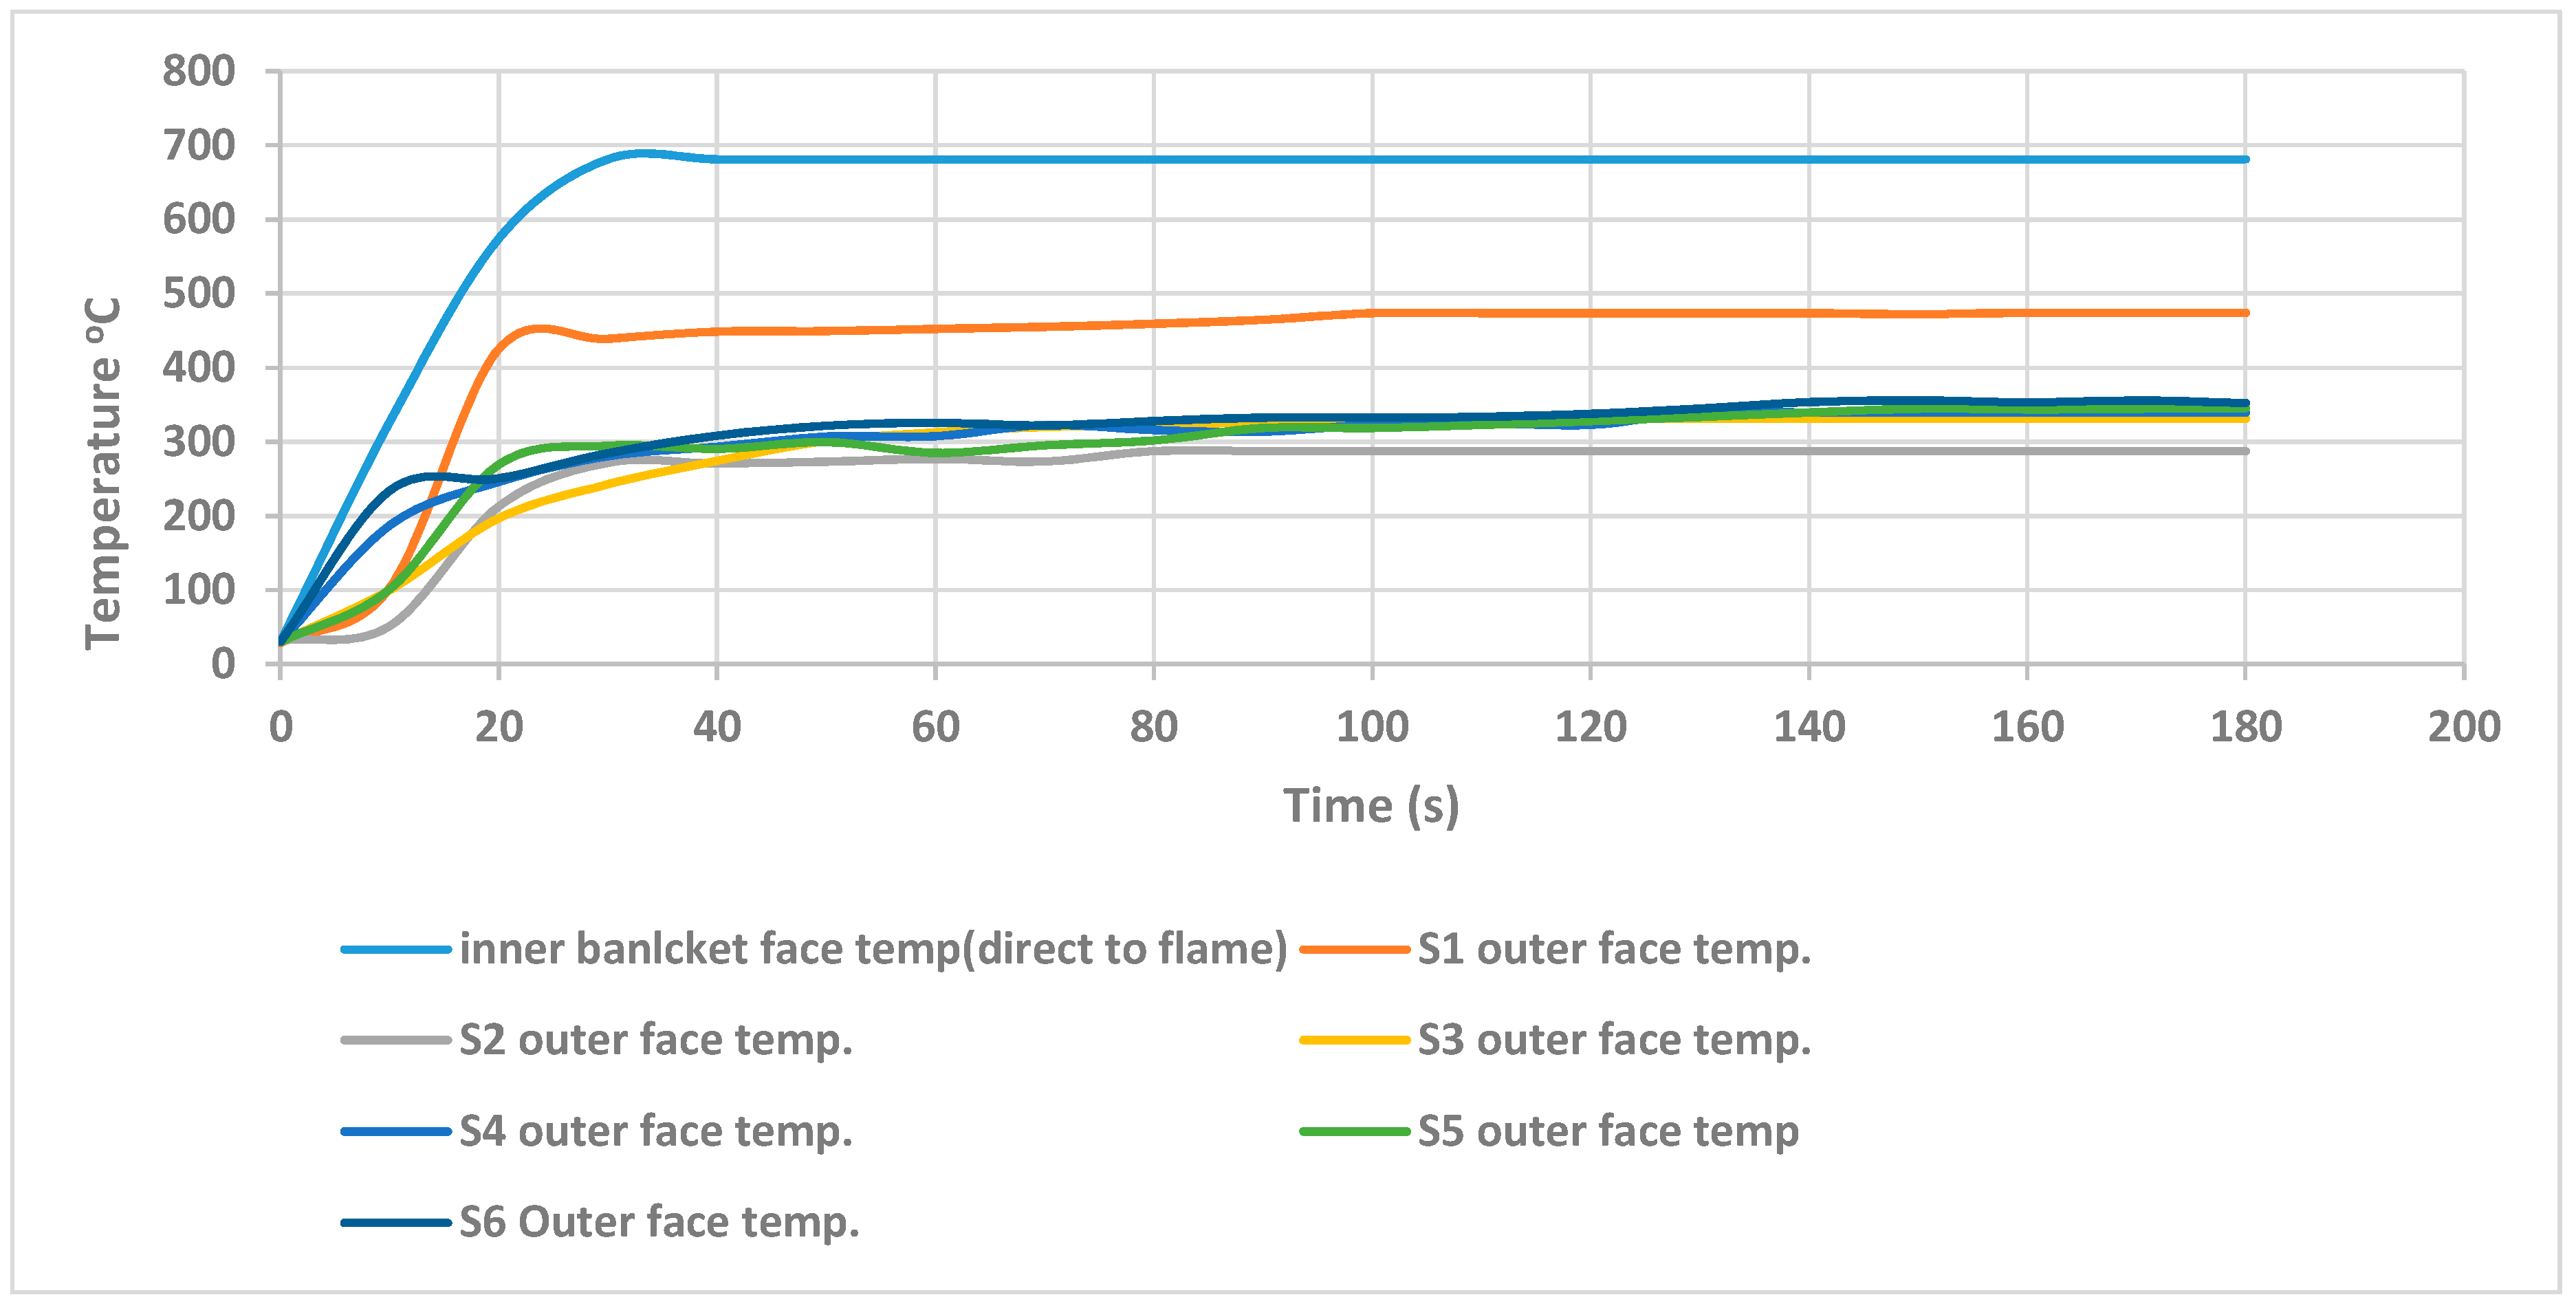
- Direct Flame Resistance
- -
- Inner surface temperatures reached 680.9 °C for all samples, but the outer surface temperature varied significantly.
- -
- S10 exhibited the lowest outer surface temperature (255.8 °C), whereas S1 had the highest (473.9 °C), indicating differences in heat resistance.
- -
- Samples with slower heat transmission provided better thermal protection.
- Fire Suppression Performance
- -
- Out of 11 tested samples, 8 passed the ASTM F1989-5 fire suppression test, while 3 failed (S1, S6, S11) due to re-ignition or flame penetration.
- -
- Smoke emission varied, with some samples emitting heavy smoke (S1, S2, S5, S6, S11) and others emitting light/moderate smoke (S3, S4, S7, S8, S9, S10).
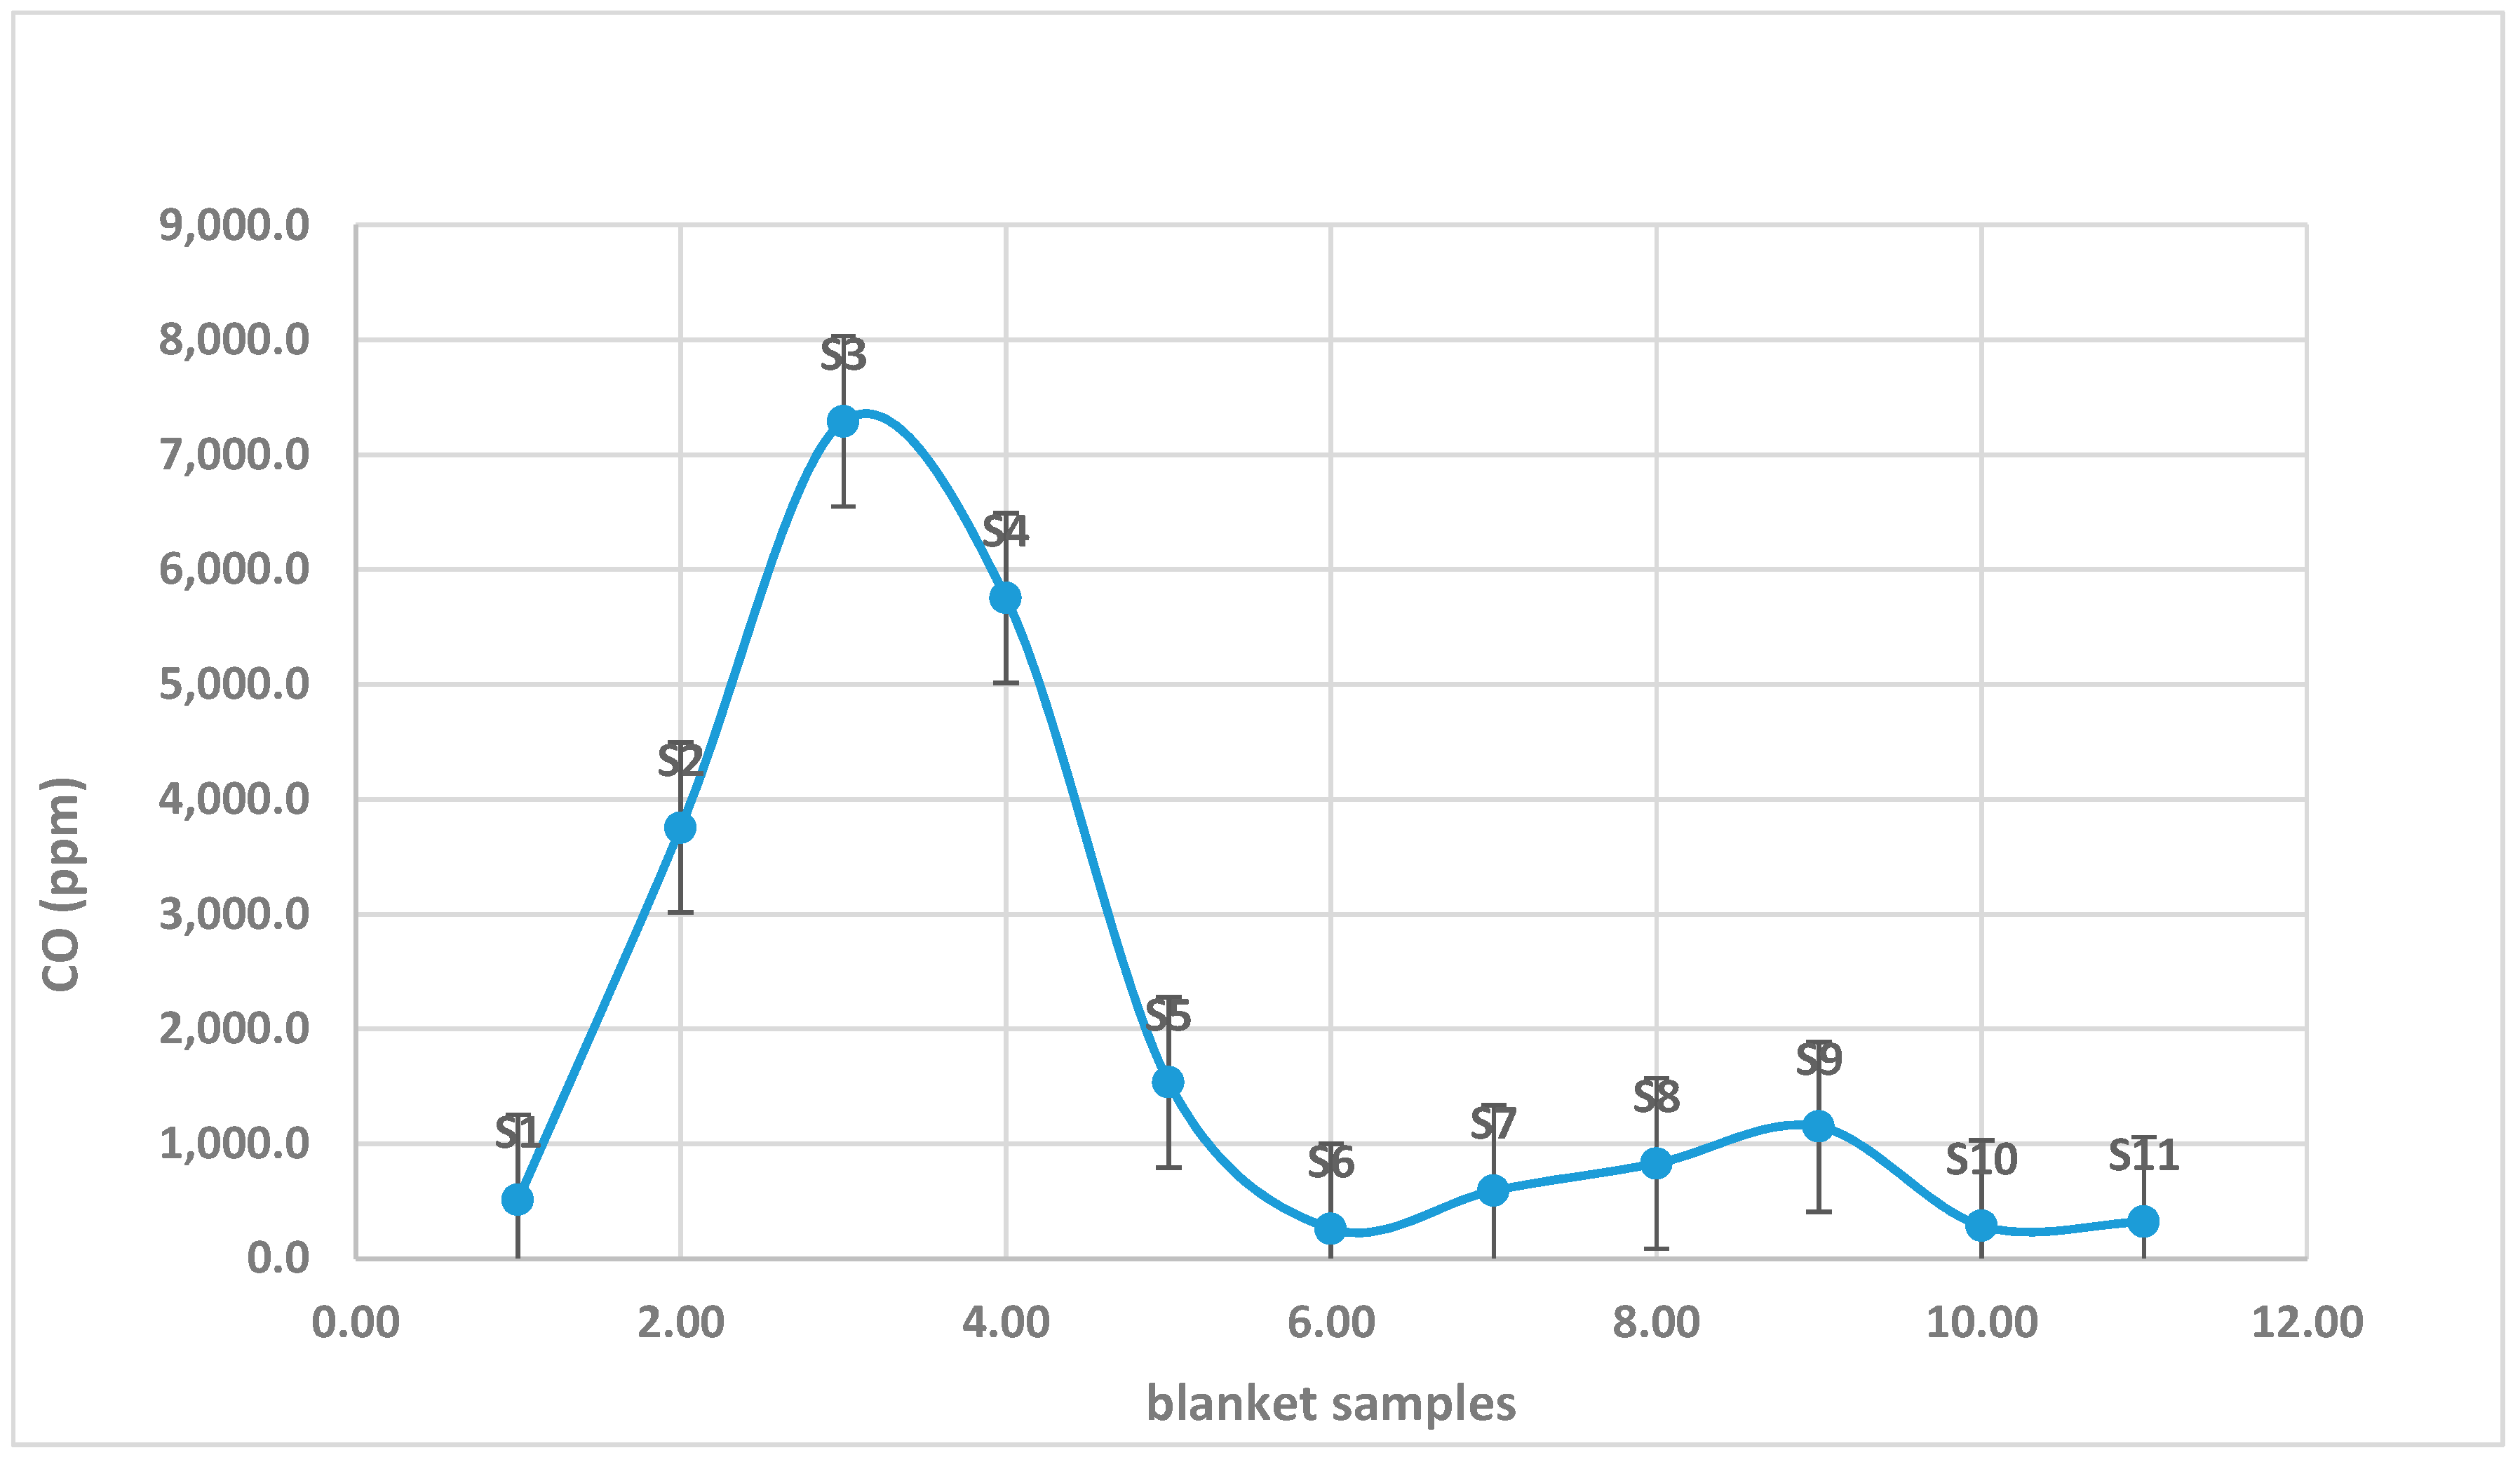
- Toxicity Assessment
- -
- Carbon monoxide (CO) exceeded safety limits in S2 (7293 ppm) and S4 (5752.8 ppm).
- -
- Nitric oxide (NO) was above the limit (285.9 ppm) in S6.
- -
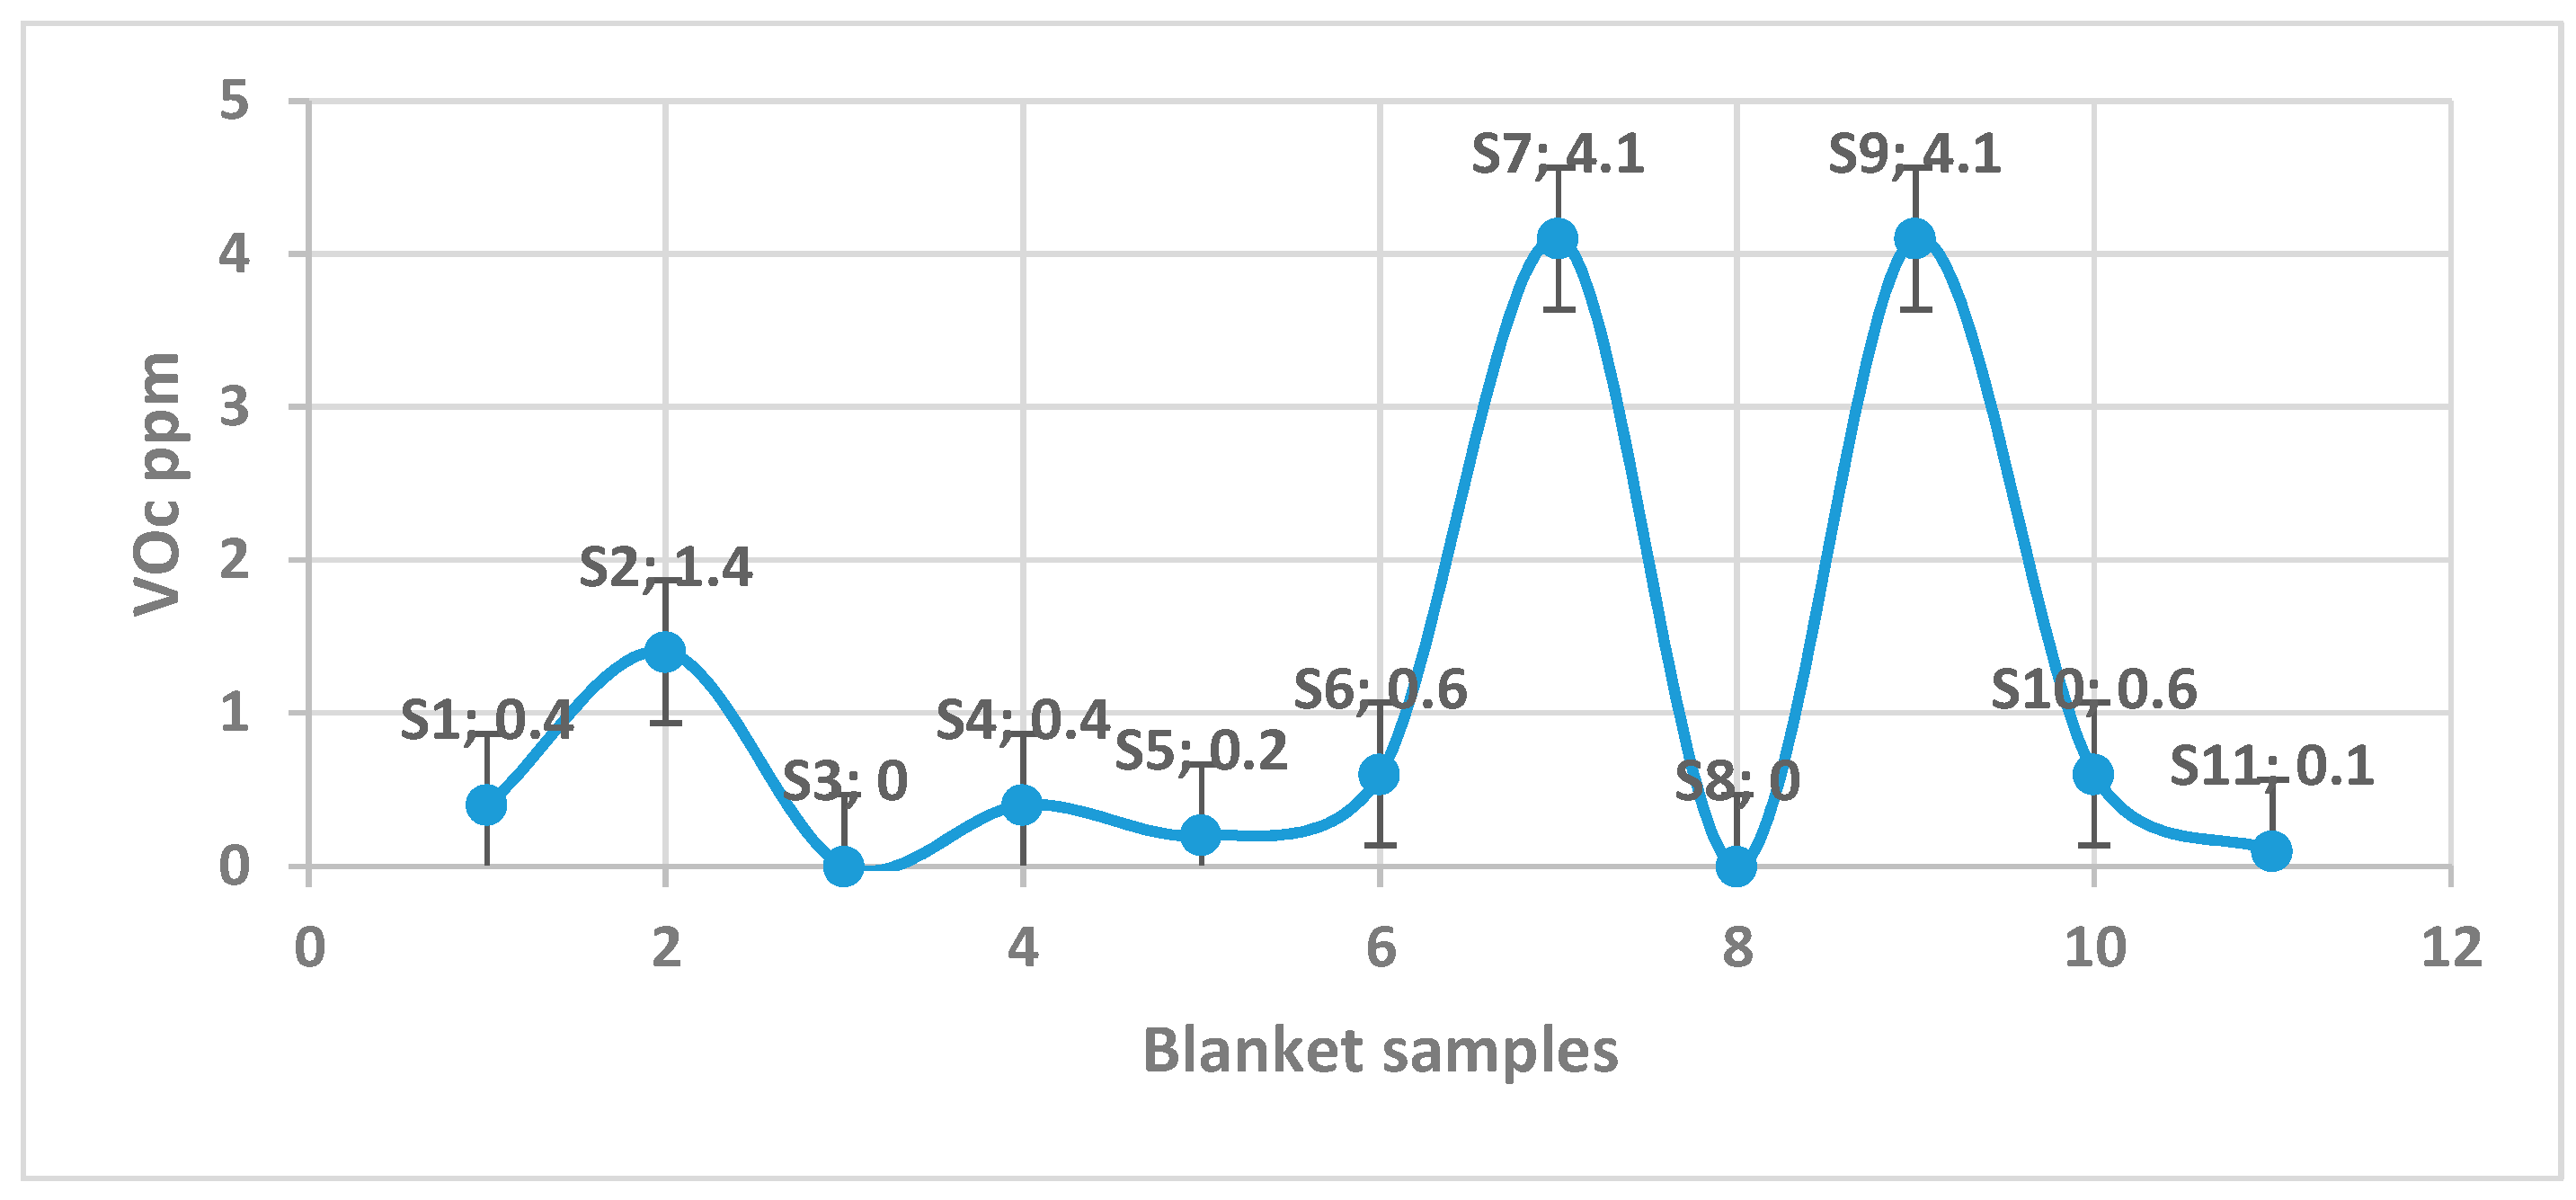
- Volatile organic compounds (VOC) exceeded limits in S2, S7, and S9.
- -
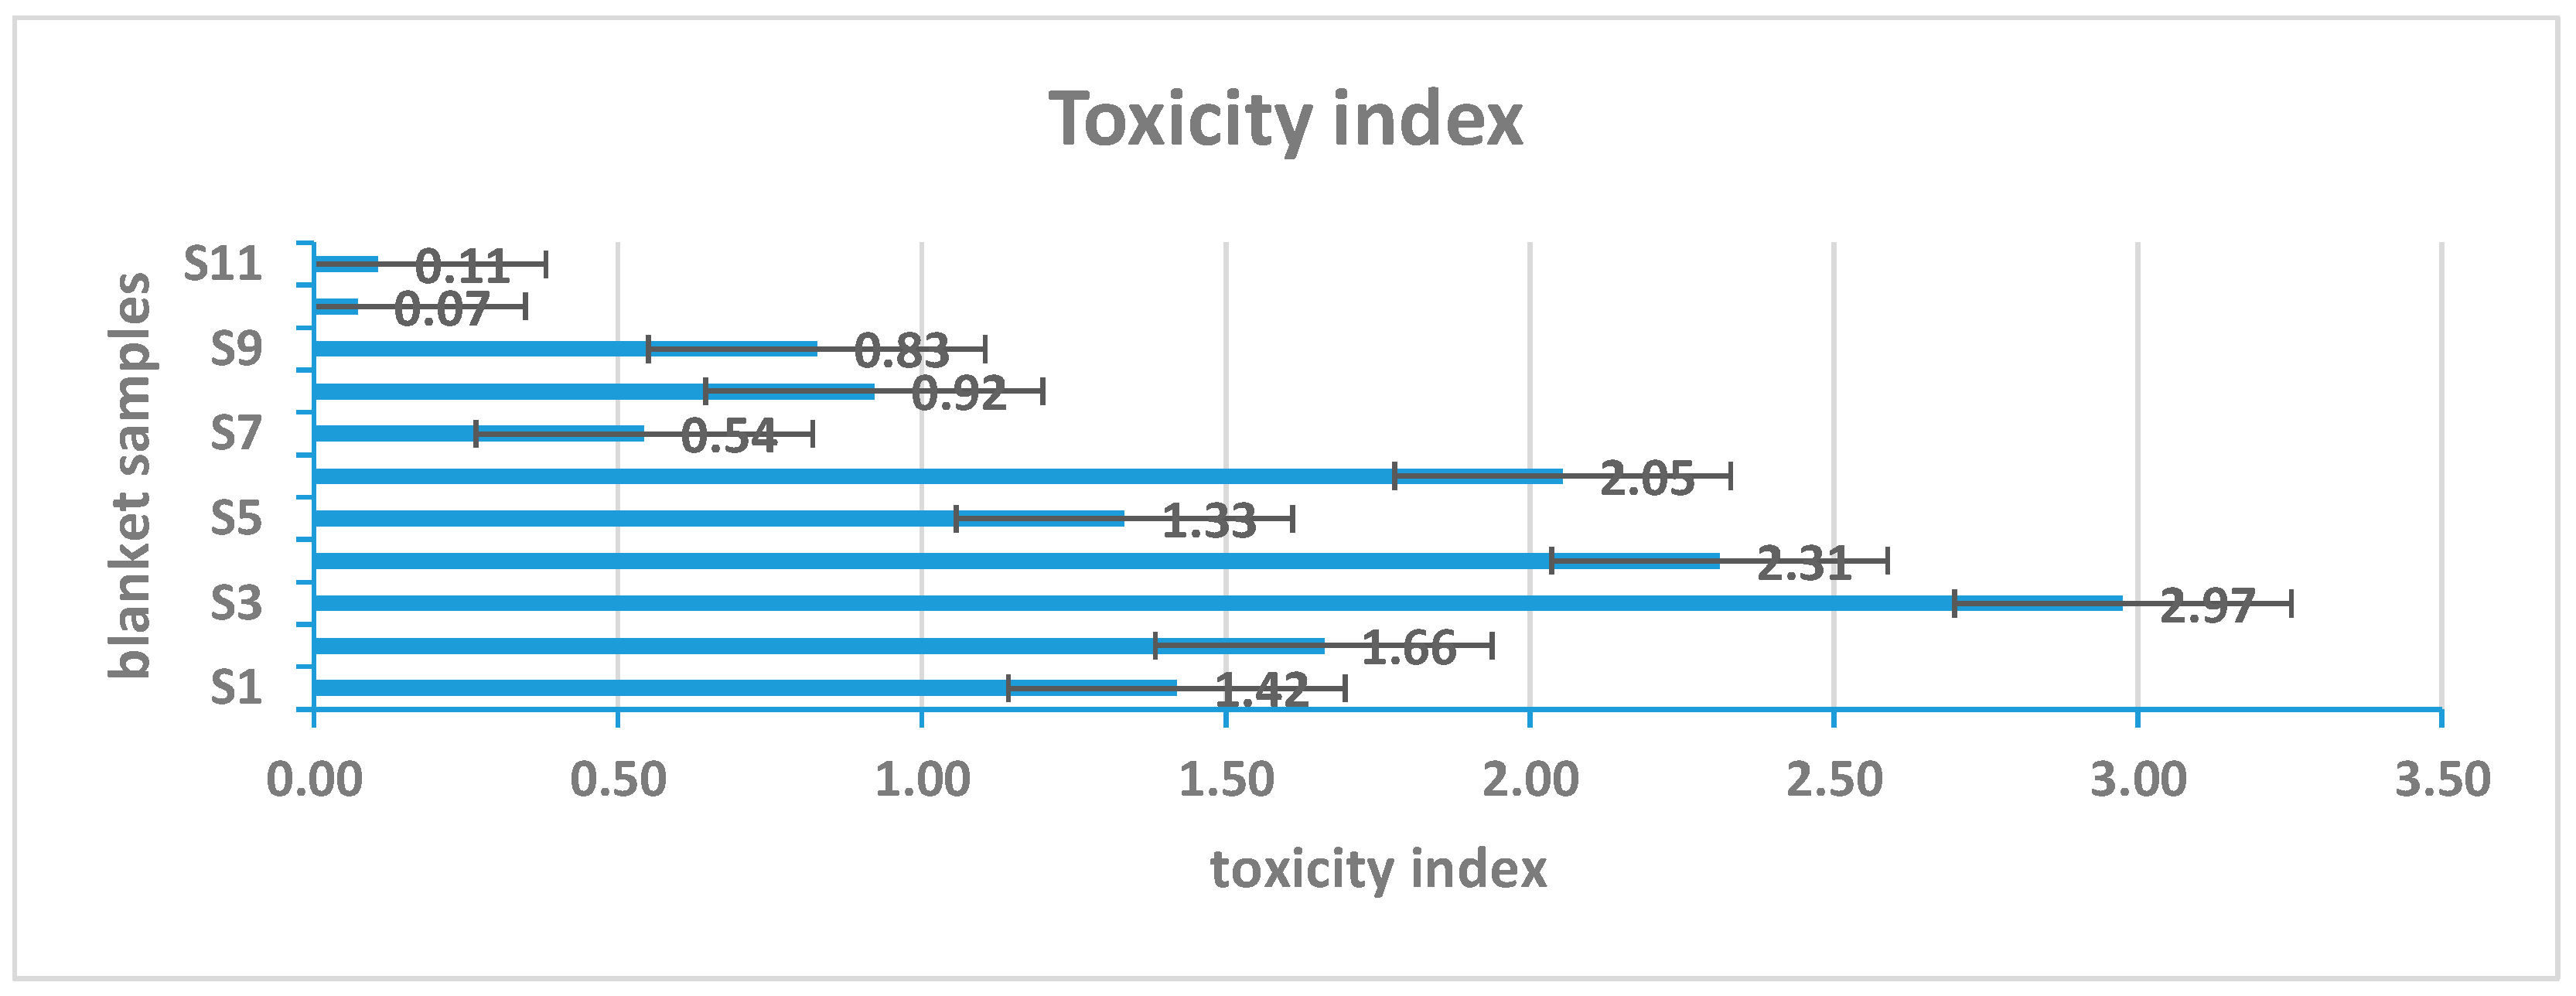
- S10 and S11 had the lowest toxicity index, while S3 had the highest (2.97).
- -
- Based on the proposed classification, S10 and S11 were the least toxic, while S3 and S4 fell into the more hazardous category.
3.2. Physical Properties
3.2.1. Air Permeability
3.2.2. Optical Microscopic Scan
3.2.3. Textile Count, Static Insulation, and Thickness Measurements
3.3. Thermal Properties
3.4. Heat Effect of Direct Flame
3.5. Fire Suppression Performance
3.6. Toxicity
Classification of Blanket Toxicity
- -
- The total toxicity index is lower than the number of gases detected (e.g., if the number of gases detected during the fire suppression process is three, the toxicity index shall be less than three);
- -
- The toxicity ratio of the individual gas detected shall be less than the total number of gas detected, when calculated according to following formula:Toxicity ratio =
- The total toxicity index is equal to or exceeds the number of gases detected. For example, if three gases were detected during the fire suppression process, the toxicity index must be greater than or equal to three.
- Alternatively, the total toxicity index is lower than the number of gases detected, but the toxicity ratio of each individual gas must be equal to or greater than one. For instance, if three gases were detected, the total toxicity index should be less than three, but the toxicity ratio for each gas must be at least one.
4. Conclusions
5. Practical Implications of the Study
- Selection of Fire Blankets for Enhanced Safety
- Fire blankets with lower air permeability (e.g., S10) provide superior thermal insulation, making them ideal for high-temperature industrial applications, such as welding, foundries, and firefighting gear.
- S10 demonstrated the best fire suppression performance with minimal heat transmission and low toxicity emissions, making it a top choice for residential, commercial, and industrial fire safety applications.
- Improving Fire Suppression Efficiency
- The failure of certain samples (S1, S6, S11) in fire suppression suggests that not all fiberglass blankets are equally effective in real fire scenarios.
- Manufacturers should optimize textile weave, air permeability, and fiber composition to enhance fire resistance and eliminate flame penetration risks.
- Fire safety professionals should carefully evaluate blankets based on ASTM F1989-5 compliance rather than assuming all fiberglass blankets perform equally.
- Consideration of Toxic Gas Emissions
- Toxic gas emissions (CO, NO, VOCs) varied widely between samples, highlighting the need for stricter regulations on blanket materials to minimize health hazards during fire suppression.
- S10 and S11 had the lowest toxicity index, making them safer for indoor use, while S3 and S4 had the highest toxicity levels, which may pose respiratory risks in enclosed spaces.
- Fire departments and emergency responders should prioritize blankets with lower toxicity emissions to reduce exposure risks to occupants and first responders.
- Enhancing Industrial and Personal Protective Equipment (PPE)
- Fire-resistant blankets are widely used in hazardous workplaces, such as chemical plants, electrical insulation, and oil and gas industries.
- Thicker blankets with optimized warp/weft count provide better protection against direct flame and high heat flux, reducing the likelihood of burns and heat-related injuries.
- The study underscores the importance of thermal performance testing for PPE materials, ensuring compliance with OSHA and NFPA standards.
- Future Design and Manufacturing Innovations
- The results provide a foundation for developing next-generation fire blankets with improved heat-blocking efficiency, lower smoke generation, and reduced toxic emissions.
- Material engineers can use these data to design composite fire blankets that combine fiberglass with other heat-resistant materials (e.g., silica, aramid fibers) to enhance durability and performance.
- There is a need for further research into environmentally friendly fire suppression blankets that minimize CO and VOC emissions while maintaining high efficiency.
Author Contributions
Funding
Data Availability Statement
Conflicts of Interest
References
- Tewarson, A.; Wu, P.K.; Chin, W.K.; Shuford, R. Fire Blankets for Munition Protection: Flame and Heat Blocking Properties of Advanced Materials; ARL-TR-2398; Army Research Laboratory: Adelphi, MD, USA, 2001. [Google Scholar]
- Hansen, J.G.R.; Frame, B.J. Flame penetration and burn testing of fire blanket materials. Fire Mater. 2008, 32, 457–483. [Google Scholar] [CrossRef]
- Chow, W.K. Fire safety concern on open kitchen in small residential units of tall buildings. Int. J. Eng. Perform. Based Fire Codes 2011, 10, 58–62. [Google Scholar]
- Arvidson, M.; Gehandler, J.; Bleye, J. Fire Suppression and Manual Firefighting of Battery Electric Vehicle Fires on Ro-Ro Ships. In Proceedings of the Seventh International Conference on Fires in Vehicles, Stavanger, Norway, 24–25 April 2023. [Google Scholar]
- Sturm, P.; Fößleitner, P.; Fruhwirt, D.; Galler, R.; Wenighofer, R.; Heindl, S.F.; Krausbar, S.; Heger, O. Fire tests with lithium-ion battery electric vehicles in road tunnels. Fire Saf. J. 2022, 134, 103695. [Google Scholar] [CrossRef]
- Wijesekere, T.; Funk, E.; Wilkens, K.; Husted, B. Long-Scale Tests of Firefighting Technologies for Electric Vehicle Fires on Board Ro-Ro Ferries. In Proceedings of the Seventh International Conference on Fires in Vehicles, Stavanger, Norway, 24–25 April 2023. [Google Scholar]
- Kwon, J.-S.; Kim, H.-J.; Lee, S.-H.; Park, T.-H.; Kim, T.-D.; Kim, S.-Y. Application of car fire blankets to car fires. Fire Sci. Eng. 2021, 35, 143–149. [Google Scholar] [CrossRef]
- Slašťan, K.; Svetlík, J.; Konárik, M.; Boroš, M. Identifying effect of car fire blankets on chosen fire parameters using large-scale fire tests of internal combustion engine vehicle and high-voltage traction battery—Comparative Slovak case study. Appl. Sci. 2024, 14, 4902. [Google Scholar] [CrossRef]
- Takahashi, F.; Abbott, A.; Murray, T.M.; T’ien, J.S.; Olson, S.L. Thermal response characteristics of fire blanket materials. Fire Mater. 2014, 38, 609–638. [Google Scholar] [CrossRef]
- Aventi. Performance optimization of thin fire blankets by varying their radiative properties. Int. J. Sci. Technol. 2019, 5, 36–58. [Google Scholar] [CrossRef]
- ISO 7211-2:2024; Textiles—Methods for Analysis of Woven Fabrics Construction—Part 2: Determination of Number of Threads per Unit Length. International Organization for Standardization: Geneva, Switzerland, 2024.
- ISO 9237:1995; Textiles—Determination of the Permeability of Fabrics to Air. International Organization for Standardization: Geneva, Switzerland, 1995.
- ASTM F1989−05; Standard Specification for Cooking Fire Suppression Blankets. ASTM International: West Conshohocken, PA, USA, 1989; (Reapproved 2020). [CrossRef]
- Standard 02-713 Issue 3; Determination of Toxicity Index of the Product of Combustion from Small Specimen of Materials. UK Ministry of Defence: London, UK, 2006.


| Sample No. | Permeability (L/m2/s) After Fire | Permeability (L/m2/s) Before Fire | Standard Deviation |
|---|---|---|---|
| S1 | 494 | 570.6 | ±17 |
| S2 | 222 | 441.60 | ±40 |
| S3 | 219 | 317.00 | ±15 |
| S4 | 242 | 238.2 | ±27 |
| S5 | 626 | 474.00 | ±32 |
| S6 | 673 | 638.60 | ±33 |
| S7 | 713 | 631.00 | ±45 |
| S8 | 638 | 627 | ±19 |
| S9 | 659 | 612.00 | ±31 |
| S10 | 262 | 279.80 | ±41 |
| S11 | 813 | 745.2 | ±11 |
| Thickness (mm) | Weight (kg/m2) | Static Insulation (MΩ) | Textile Count Warp/Weft | Sample No. |
|---|---|---|---|---|
| 0.4 ± 0.01 | 0.7 ± 0.05 | 207 ± 10 | (22/12) ± 1 | S1 |
| 0.4 ± 0.01 | 0.6 ± 0.05 | 70 ± 6 | (21/11) ± 1 | S2 |
| 0.3 ± 0.01 | 0.7 ± 0.05 | 100 ± 10 | (18/12) ± 1 | S3 |
| 0.3 ± 0.01 | 0.7 ± 0.05 | 63 ± 6 | (21/12) ± 1 | S4 |
| 0.4 ± 0.01 | 0.7 ± 0.05 | 83 ± 6 | (22/12) ± 1 | S5 |
| 0.3 ± 0.01 | 0.6 ± 0.05 | 173 ± 10 | (21/10) ± 1 | S6 |
| 0.3 ± 0.01 | 0.6 ± 0.05 | 172 ± 10 | (22/10) ± 1 | S7 |
| 0.4 ± 0.01 | 0.6 ± 0.05 | 102 ± 10 | (20/11) ± 1 | S8 |
| 0.4 ± 0.01 | 0.6 ± 0.05 | 33 ± 6 | (20/10) ± 1 | S9 |
| 0.4 ± 0.01 | 0.7 ± 0.05 | 370 ± 10 | (22/13) ± 1 | S10 |
| 0.3 ± 0.01 | 0.6 ± 0.05 | 100 ± 10 | (21/11) ± 1 | S11 |
| Heat Blocking Efficiency (HBE) (%) | Heat Transmitted from the Blanket kW/m2 | Heat Absorbed by the Blanket kW/m2 | Incident Heat Flux kW/m2 | Sample ID |
|---|---|---|---|---|
| 40.00 | 15.00 | 10.00 | 25.00 | S1 |
| 55.84 | 11.04 | 13.96 | 25.00 | S2 |
| 53.68 | 11.58 | 13.42 | 25.00 | S3 |
| 47.72 | 13.07 | 11.93 | 25.00 | S4 |
| 43.20 | 14.20 | 10.80 | 25.00 | S5 |
| 36.76 | 15.81 | 9.19 | 25.00 | S6 |
| 61.08 | 9.73 | 15.27 | 25.00 | S7 |
| 55.36 | 11.16 | 13.84 | 25.00 | S8 |
| 42.96 | 14.26 | 10.74 | 25.00 | S9 |
| 47.72 | 13.07 | 11.93 | 25.00 | S10 |
| 45.36 | 13.66 | 11.34 | 25.00 | S11 |
| ±5.0 | ±2.0 | ±2.0 | ±0.1 | SD |
| Heat Blocking Efficiency (HBE) (%) | Heat Absorbed by the Blanket kW/m2 | Heat Transmitted from the Blanket kW/m2 | Incident Heat Flux kW/m2 | Sample No. |
|---|---|---|---|---|
| 76.45 | 42.05 | 12.95 | 55 | S1 |
| 81.78 | 44.98 | 10.02 | 55 | S2 |
| 83.84 | 46.11 | 8.89 | 55 | S3 |
| 79.27 | 43.6 | 11.4 | 55 | S4 |
| 80.58 | 44.32 | 10.68 | 55 | S5 |
| 81.60 | 44.88 | 10.12 | 55 | S6 |
| 76.13 | 41.87 | 13.13 | 55 | S7 |
| 79.71 | 43.84 | 11.16 | 55 | S8 |
| 78.42 | 43.13 | 11.87 | 55 | S9 |
| 78.73 | 43.3 | 11.7 | 55 | S10 |
| 78.09 | 42.95 | 12.05 | 55 | S11 |
| ±5.0 | ±2.0 | ±2.0 | ±0.1 | SD |
| Time (s) | Temperature of Blankets Inner Face (°C) | Temperature of Outer Blanket Samples Face (°C) | |||||
|---|---|---|---|---|---|---|---|
| S1 | S2 | S3 | S4 | S5 | S6 | ||
| 0 | 30 | 28.5 | 32 | 30 | 30 | 30 | 30 |
| 10 | 326.5 | 103 | 51.4 | 100 | 187 | 101 | 233.9 |
| 60 | 680.9 | 452 | 276.9 | 312.5 | 307.4 | 285 | 325.4 |
| 120 | 680.9 | 473.4 | 287.3 | 331 | 322.8 | 327.8 | 337.6 |
| 180 | 680.9 | 473.9 | 287.3 | 331 | 339.5 | 345.2 | 352.2 |
| Time | Temperature of Blanket Inner Face (°C) | Temperature of Outer Blanket Samples Face (°C) | ||||
|---|---|---|---|---|---|---|
| S7 | S8 | S9 | S10 | S11 | ||
| 0 | 30 | 30 | 30 | 30 | 30 | 30 |
| 10 | 326.5 | 250.2 | 233.5 | 156 | 200 | 184.5 |
| 60 | 680.9 | 367.6 | 372.6 | 326.4 | 216.5 | 390 |
| 120 | 680.9 | 378 | 372.6 | 361 | 248 | 390 |
| 180 | 680.9 | 395.6 | 372.6 | 361 | 255.8 | 390 |
| Result | Observation | Sample ID |
|---|---|---|
| Fail | - Heavy smoke after fire suppression ◦ Fuel reignited after 3 min and removal of blanket | S1 |
| Pass | ● Heavy smoke after fire suppression | S2 |
| Pass | - Light smoke after fire suppression | S3 |
| Pass | - Light smoke after fire suppression | S4 |
| Pass | - Black smoke after fire suppression | S5 |
| Fail | - Black smoke after fire suppression - Fuel reignited after 3 min and removal of blanket | S6 |
| Pass | - Light smoke after fire suppression | S7 |
| Pass | - Moderate smoke after fire suppression | S8 |
| Pass | - Moderate smoke after fire suppression | S9 |
| Pass | - Light smoke after fire suppression | S10 |
| Fail | - Heavy smoke after fire suppression Flame passed through the center of the blanket | S11 |
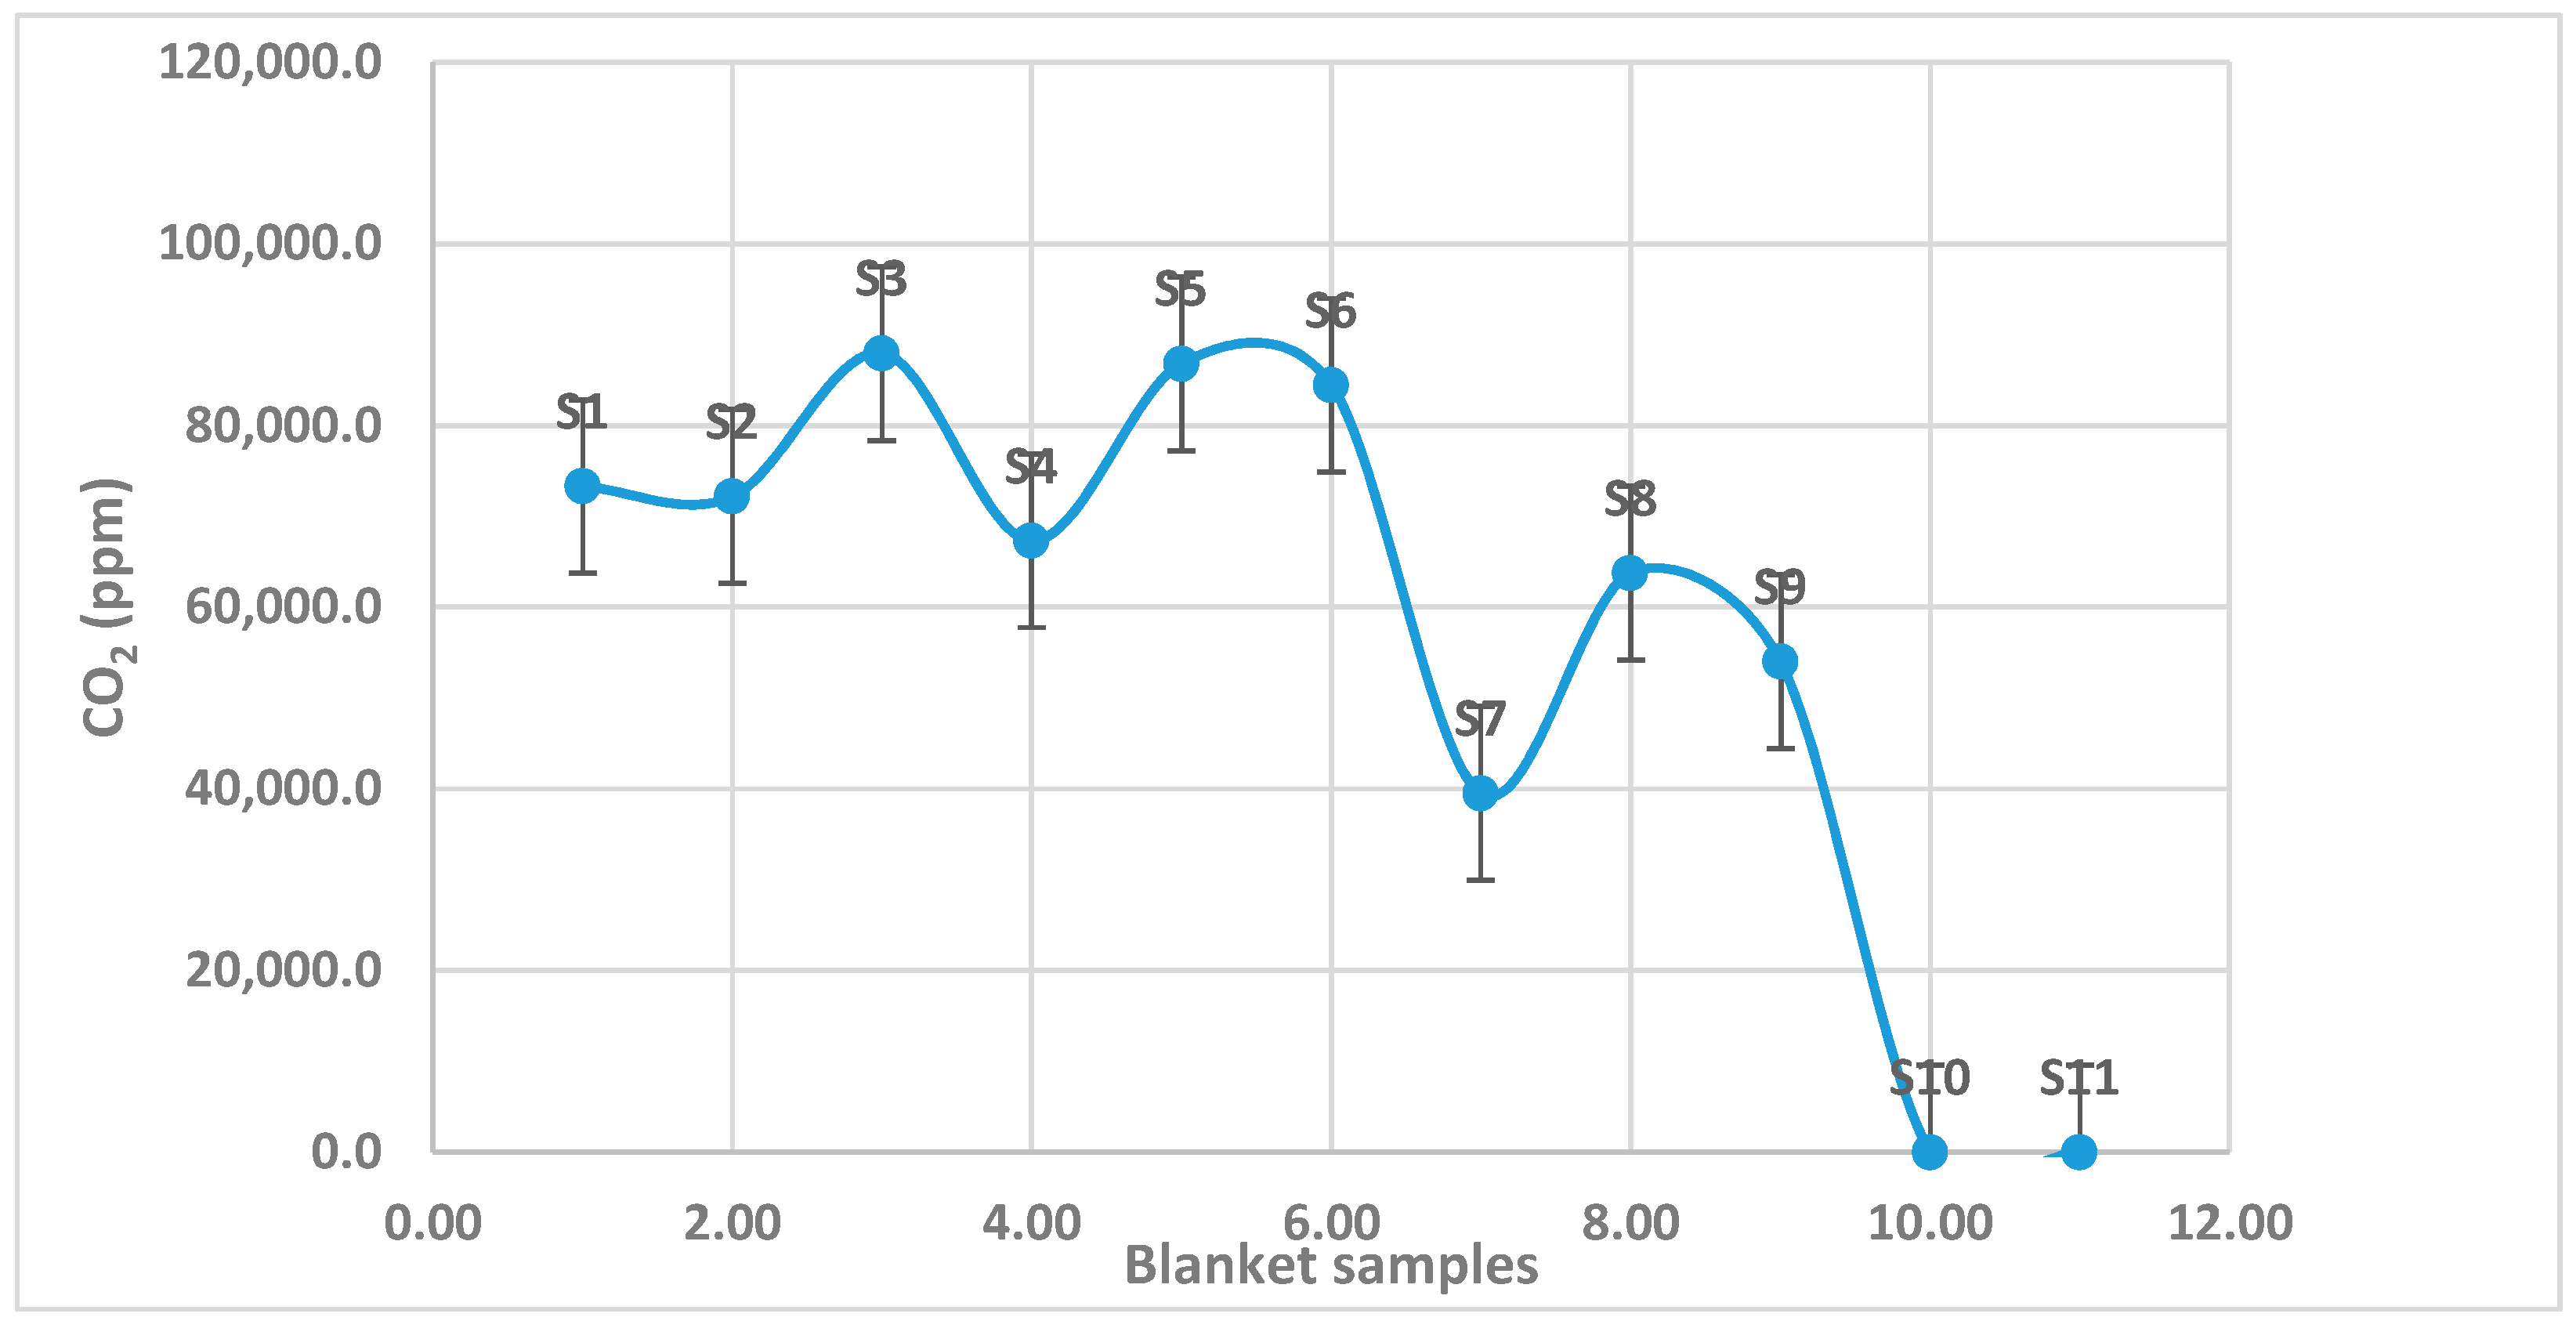
| Sample Number | CO2/100 g of Sample (ppm) | CO/100 g of Sample (ppm) | NO/100 g of Sample (ppm) | SO2/100 g of Sample (ppm) | VOC(ppm) | Mass of Sample (g) | Toxicity Index |
|---|---|---|---|---|---|---|---|
| Limits of toxic gases | 100,000 | 4000 | 250 | 400 | 0.6 | NA | NA |
| S1 | 73,313.8 | 513.2 | 139.3 | 0 | 0.4 | 1.364 | 1.42 |
| S2 | 72,202.2 | 3754.5 | 0.0 | 0.00 | 1.4 | 1.385 | 1.66 |
| S3 | 87,976.5 | 7293.0 | 68.0 | 0 | 0 | 1.618 | 2.97 |
| S4 | 67,319.5 | 5752.8 | 0.0 | 80.16 | 0.4 | 1.634 | 2.31 |
| S5 | 86,840.3 | 1536.4 | 20.0 | 0 | 0.2 | 1.497 | 1.33 |
| S6 | 84,470.4 | 259.9 | 285.9 | 0 | 0.6 | 1.539 | 2.05 |
| S7 | 39,499.7 | 592.5 | 0.0 | 0 | 4.1 | 1.519 | 0.54 |
| S8 | 63,775.5 | 829.1 | 19.1 | 0 | 0 | 1.568 | 0.92 |
| S9 | 54,017.6 | 1147.9 | 0.0 | 0 | 4.1 | 1.481 | 0.83 |
| S10 | 0.0 | 284.9 | 0.0 | 0 | 0.6 | 1.755 | 0.07 |
| S11 | 0.0 | 318.9 | 6.4 | 0 | 0.1 | 1.568 | 0.11 |
| SD % | 10 | 10 | 10 | 10 | 5 | 3 | 10 |
Disclaimer/Publisher’s Note: The statements, opinions and data contained in all publications are solely those of the individual author(s) and contributor(s) and not of MDPI and/or the editor(s). MDPI and/or the editor(s) disclaim responsibility for any injury to people or property resulting from any ideas, methods, instructions or products referred to in the content. |
© 2025 by the authors. Licensee MDPI, Basel, Switzerland. This article is an open access article distributed under the terms and conditions of the Creative Commons Attribution (CC BY) license (https://creativecommons.org/licenses/by/4.0/).
Share and Cite
Hassan, M.A.; AlSofian, M.M.; Al Zharani, A.; AlOtaibi, M.R.; Al Saeed, S.; Al Anazi, N. The Effect of Toxicity, Physical and Thermal Properties of Fire Blanket Made of Glass Fiber on Its Quality as Small Fire Suppression Tool. Fire 2025, 8, 191. https://doi.org/10.3390/fire8050191
Hassan MA, AlSofian MM, Al Zharani A, AlOtaibi MR, Al Saeed S, Al Anazi N. The Effect of Toxicity, Physical and Thermal Properties of Fire Blanket Made of Glass Fiber on Its Quality as Small Fire Suppression Tool. Fire. 2025; 8(5):191. https://doi.org/10.3390/fire8050191
Chicago/Turabian StyleHassan, Mohamed A., Mohamed M. AlSofian, Ahmed Al Zharani, Mohammed R. AlOtaibi, Sami Al Saeed, and Naif Al Anazi. 2025. "The Effect of Toxicity, Physical and Thermal Properties of Fire Blanket Made of Glass Fiber on Its Quality as Small Fire Suppression Tool" Fire 8, no. 5: 191. https://doi.org/10.3390/fire8050191
APA StyleHassan, M. A., AlSofian, M. M., Al Zharani, A., AlOtaibi, M. R., Al Saeed, S., & Al Anazi, N. (2025). The Effect of Toxicity, Physical and Thermal Properties of Fire Blanket Made of Glass Fiber on Its Quality as Small Fire Suppression Tool. Fire, 8(5), 191. https://doi.org/10.3390/fire8050191