Abstract
The ability of computer simulations to model airflows in a tunnel can significantly contribute to the effectiveness of fire safety precautions. This study examines two ways of modelling the Polana tunnel (Slovakia) and its influence on the airflow created via longitudinal ventilation using a fire dynamics simulator. The first class of studied models is based on the assumption that the airflow in the tunnel is influenced to a large extent by the supporting structures and other installations under the tunnel ceiling. Due to the resolution of the computational grid, the constructions are modelled using a system of cuboids distributed along the tunnel at regular distances. The second class of models combines this approach with the previous one, in which tunnel drag is modelled by increased roughness of the tunnel walls. Unlike the previous model, the roughness values are not constant but reflect the curvature of the tunnel walls. The simulations results are compared against on-site measurements during a full-scale ventilation test conducted in 2017 by a grid of five anemometers, as well as with the results of the previous model. The results agree well with the experimental data with relative errors below 2% for bulk velocities and with mean absolute percentage deviations of 3, 6, and 10% for velocities measured using individual grid anemometers for three ventilation modes. The new models achieve several improvements in accuracy compared to the previous one.
1. Introduction
Longitudinal ventilation is a common solution for emergency ventilation in medium-length tunnels, which are typical for the Slovak motorway network. The advantage of such a solution is simple design and operation. Air movement is induced in one direction along the tunnel by using jet fans, usually located in the vicinity of tunnel portals. In the event of a fire, the central control system (CCS) of the tunnel regulates the tunnel’s autonomous response to the fire in order to enable the safe evacuation of people. The accurate measurement and regulation of airflow velocity using jet fans are important prerequisites for successful safety measures. Of particular importance is precise velocity regulation in bi-directional tunnels, where regulatory requirements in the event of a fire require reaching and maintaining the airflow velocity in a specific interval in order to maintain the stratification of the smoke layer. The accurate computational modelling of airflows in tunnels is therefore very beneficial for fire safety studies.
The fire dynamics simulator (FDS) [1,2] is a well-known open-source CFD solver for modelling fire and fire-driven fluid flows, developed by the National Institute of Standards and Technology (NIST), USA, in cooperation with the VTT Technical Research Centre of Finland. FDS numerically solves a form of conservation equations for low-Mach-number flows with an emphasis on the smoke and heat transport from fire. The core algorithm is a very efficient and explicit predictor–corrector scheme and is accurate to the second order in space and time. FDS also includes models of fire-related processes such as turbulence, thermal radiation, pyrolysis, combustion of the pyrolysis products, and conductive heat transfer.
Although the mathematical model used in FDS is suitable for tunnel fires, the number of tunnel applications of FDS is significantly smaller, although growing recently, than that of building applications [3,4]. This is probably due to the FDS requirements for a rectilinear grid, which do not allow for a simple representation of the curved geometry of the tunnel. Moreover, many studies are focused on laboratory and small-scale experiments. Full-scale validation tests are valuable and rare because of their cost and organizational problems associated with the shutdown of the tunnel and traffic interruption. In [5], a series of sensitivity analyses for FDS 4.0 using Memorial Tunnel Ventilation Test Program (MTVTP) data was performed, focusing on the sensitivity of the mesh and the parameters used in the turbulence model. In [6], a coupled hybrid (1D/3D-CFD) modelling methodology was validated with full-scale fire tests in the 1600 m long Runehamar tunnel using FDS 6. For 6, 66, and 119 MW fires, temperature profiles, centreline velocity, back-layering lengths, and maximum temperatures up- and downstream from the fire source were investigated. In [7], prevailing conditions in three evacuation scenarios after a 20 MW fire accident in a 1500 m long railway tunnel with longitudinal ventilation and different ventilation activation times were examined. In [8], three full-scale experiments with 1.35, 3, and 3.8 MW fires conducted in a short metro tunnel with a mechanical ventilation system were simulated using FDS (version 5.5). The smoke temperature and decay rate of the temperature distribution under the tunnel ceiling were investigated. In [9], the Hsuehshan Tunnel fire, which occurred from a bus fire, was analyzed using data collected from the fire scene via FDS. These studies confirmed the ability of FDS to simulate various aspects of tunnel fires. An important area of tunnel smoke research using FDS is the numerical simulation of smoke back-layering and the numerical testing of models determining the back-layering length [10,11].
More specific studies deal with airflow simulations in tunnels without fire. In [12], the average velocity and velocity profile were determined and compared them against on-site measurements in the Dartford Tunnel which is 1200 m long and 8.5 m in diameter. The tunnel cross-section was modelled as a square. The simulated values correlated well with the measurements, indicating the FDS capability to simulate jet fans and the airflows they induce. The aim of this study was to compare full CFD and multi-scale modelling approaches. Nevertheless, such validated studies are still rare in the literature. In [13], the air velocity distribution in a road tunnel was modelled by Ansys Fluent. The variation in the calculated velocity did not exceed 9%. However, further validation studies are still expected by the research community.
The operation of jet fans in FDS is modelled via the HVAC feature for modelling heating, ventilation, and air conditioning systems [2]. This feature does not allow us to set the pressure of the air flowing through the jet fan; instead, the volume flow rate simulating the jet fan inlet and outlet can be specified [2,12]. In [14,15], the accuracy of mapping the airstream of 30 cm diameter jet fans using FDS was investigated. It was demonstrated that a 30 cm grid resolution is sufficient for horizontal flow stream simulations, although sloped jet fans require finer resolution. Limitations and advantages of various modelling methods of jet fans within Ansys Fluent and Ansys Cfx were evaluated by [16,17]. Some of the authors’ conclusions are also applicable for modelling FDS jet fans.
An FDS model of the 898 m long Polana highway tunnel (Slovakia) was developed to model airflows generated via longitudinal ventilation [18]. The model was intended for the purpose of fire simulations in road tunnels with the expectation of its generalization for other tunnels. The drag of the tunnel geometry components which cannot be directly modelled, as their dimensions are too small in comparison with the mesh resolution (e.g., measuring devices, lighting, their supporting structures, and niches), as well as the influence of tunnel curvature including its S-shaped tunnel geometry, was modelled by increased roughness of the tunnel walls. Roughness parameters specify velocity boundary conditions at rough solid surfaces using the log law [19]. Roughness in the tunnel was determined to be 70 and 3 mm for the tunnel walls and road surface, respectively (Model 0). These values are higher than typical values of concrete roughness in order to model the drag caused by the above-mentioned factors within an FDS rectilinear mesh. Note that a similar approach was used in [13] and the determined value of roughness was equal to 90 mm for a tested tunnel that was slightly curved and 678 m long.
The simulation results for the Polana tunnel were compared against on-site velocity measurements using a grid of five anemometers and using three anemometers installed in the tunnel during a full-scale ventilation test conducted in 2017. Three modes of ventilation operation were examined. A comparison with the experimental data confirmed very good accuracy (relative deviation lower than 2%) of the simulation results for the steady-state bulk airflow velocity. Slightly worse accuracy up to 9% was achieved for the steady-state velocities at the locations of grid anemometers for the first two ventilation modes. Predicted velocities for the third ventilation mode fell significantly outside the range of the measured values (relative deviations of 12–24%) due to a specific interaction of a not-fully developed airflow with the tunnel curvature.
The aim of the present study is to develop and supplement the approach used in [18] as well as to propose two alternative approaches for developing tunnel models for the purpose of fire simulations. Supporting structures and other installations under the tunnel ceiling are modelled using a system of cuboids distributed along the tunnel. The non-uniform roughness of tunnel walls is tested as a way to model the curvature of tunnel walls. Four different models based on these assumptions are constructed; their parameters are established, and the accuracy of the simulation results of these models is evaluated to determine which tunnel representation method is the most suitable for simulation purposes. Preliminary simulations based on the concept and technical issues related to them have already been presented in [20]. It is expected that the approaches used in this work could also be used with small modifications in the case of other roadway tunnels, as the similarity of individual tunnels in terms of tunnel tube geometry and the distribution of objects inside the tunnel under the ceiling is significant. We believe that such an approach will allow for a better description of the velocity profile of the flow in the tunnel for the purpose of fire simulations using FDS.
2. Materials and Methods
2.1. Ventilation Tests in the Polana Tunnel
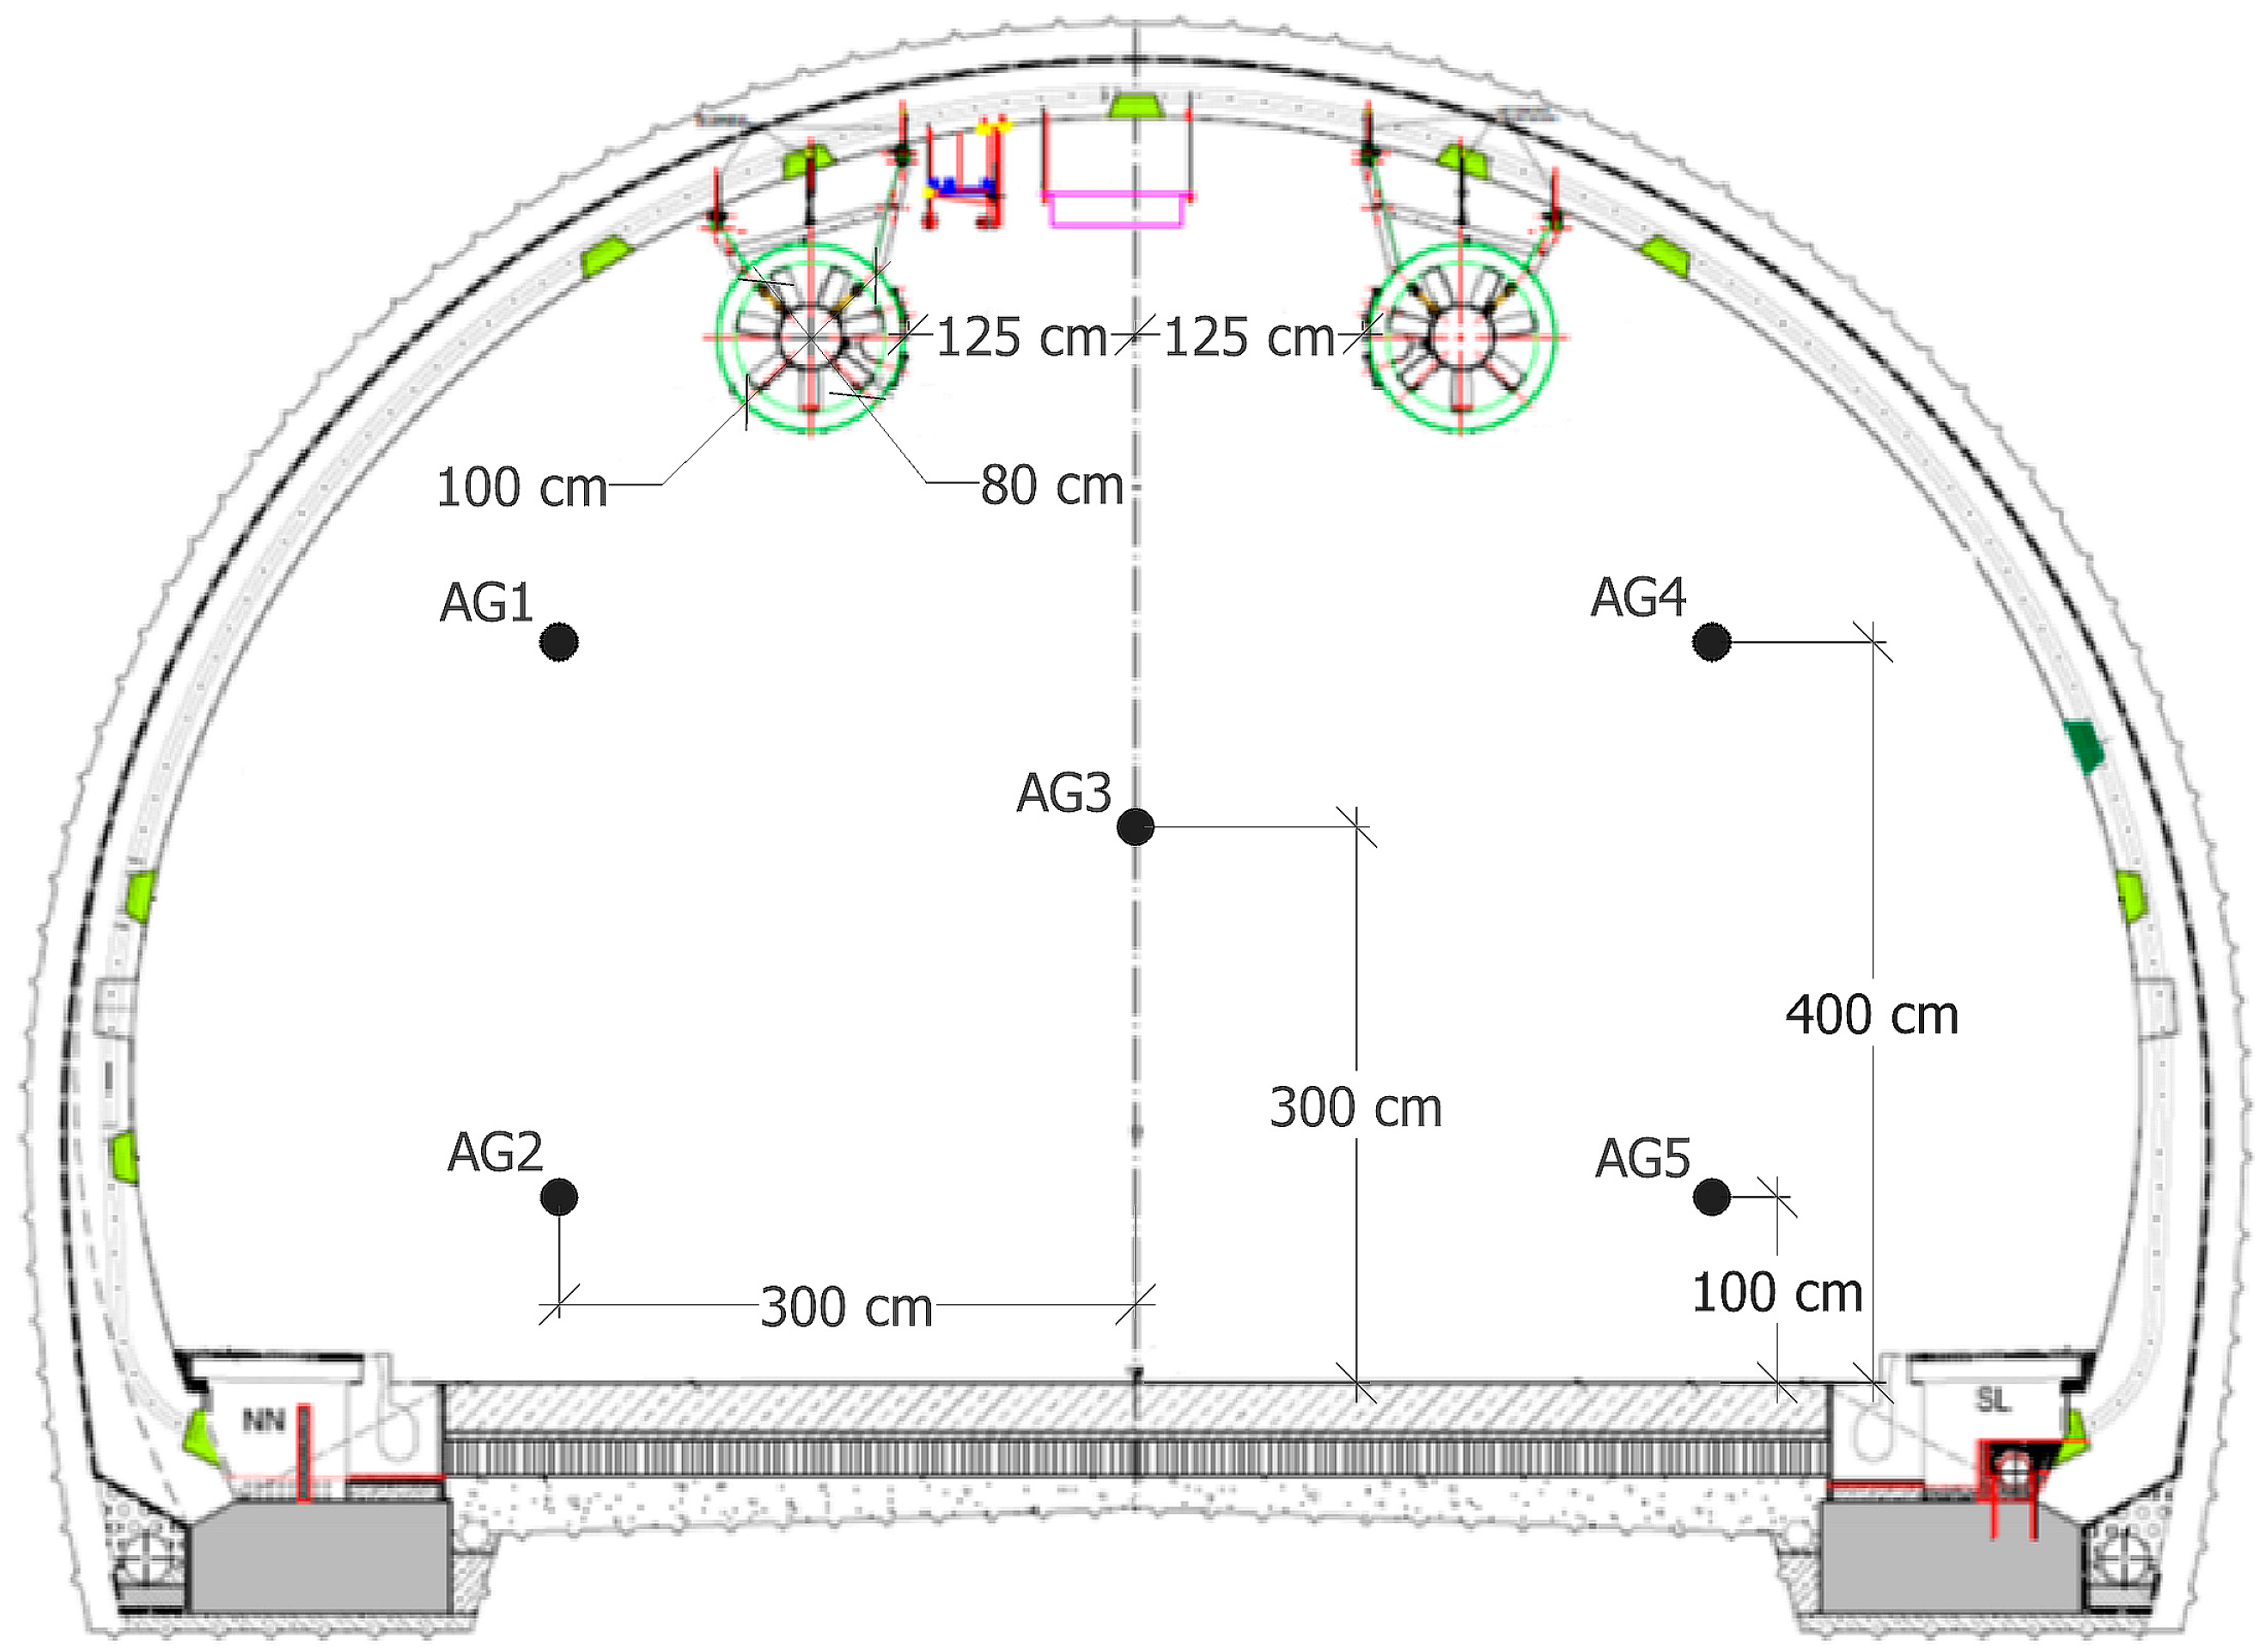
The Polana tunnel [21,22] is a single-tube 898 m long bi-directional highway tunnel in Slovakia (Figure 1 and Figure 2). Its horseshoe cross-section is 10.8 m wide and 6.8 m high with an area of 60.3 m2. Two 50 m long emergency lay-bys are located at 373 m (left side) and 635.6 m (right side) from the west tunnel portal. The cross-section of the lay-bys is horseshoe-shaped as well, with the maximal height of its ceiling at 7.8 m. The lay-by niches are 2.2 m wide. Such tunnel dimensions are often used in Slovak road tunnels [22]. The tunnel has a 2% ascending slope with the typical S-shape of the tunnel tube. It is equipped with various safety installations and measuring devices. Supporting structures bearing lighting and other installations are located under the tunnel ceiling along the tunnel centreline. The tunnel is equipped with longitudinal ventilation consisting of four pairs of axial jet fans with the main parameters presented in Table 1.
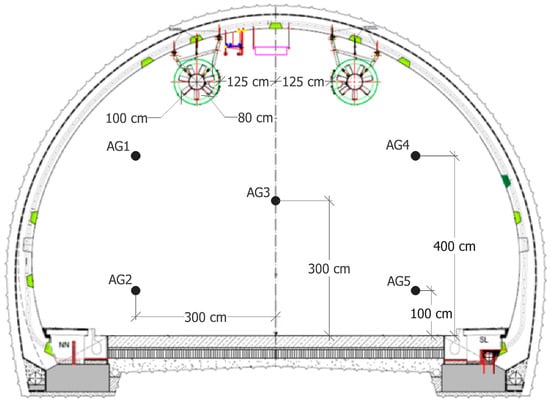
Figure 1.
Polana tunnel cross-section with the locations of grid anemometers AG1–5 and jet fans.
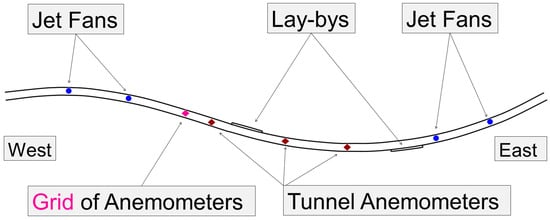
Figure 2.
Polana tunnel with lay-bys and anemometers.

Table 1.
Main parameter of jet fans in the Polana tunnel.
The ventilation system is supposed to achieve and stabilize a longitudinal airflow velocity of 1.0–1.5 m·s−1 within 120 s to maintain smoke stratification in the case of a fire, enabling the safe evacuation of people. This ventilation aim is to be achieved via stepless continuous airflow regulation using jet fans. Airflow velocity is measured using three tunnel anemometers AT1–3, located at 340, 465, and 565 m (see Figure 2), with a measuring accuracy of 0.1 m·s−1.
In 2017, ventilation tests in the Polana tunnel were conducted [23]. The airflow velocity in the empty tunnel was measured using a grid of 5 anemometers (AG1–5) located 300 m from the west tunnel portal (see Figure 1 and Figure 2). The airflow velocity in the tunnel was determined as a mean of the measured grid anemometer velocities. Simultaneously, the airflow velocity was measured using AT1–3 anemometers. Three modes of ventilation operation described in Table 2 were tested. The parameters of the anemometers used are listed in Table 3.
Table 2.
Three modes of ventilation operation during ventilation tests in 2017.
Table 3.
Anemometers used during ventilation tests and their parameters.
The total duration of ventilation tests was 2 h. The individual modes lasted approximately 10 min; A total of 20 to 30 min was left for the stabilization of the natural flow in the tunnel after finishing each measured mode. The aim of the measurements was to determine three steady-state air flow velocities corresponding to the particular modes and use them for the determination of calibration factors for the AT1–3 anemometers.
2.2. FDS Modelling of the Polana Tunnel
The geometry of the Polana tunnel including the tunnel tube and two emergency lay-bys for the FDS environment was modelled in detail in a similar way as in [18]. The computational domain dimensions were set to 900 × 18 × 8.1 m. In this way, the entire tunnel together with both lay-bys is included in the computational domain. The mesh resolution of 30 cm was used for all simulations in the present study. The sensitivity study performed in [18] demonstrated that the resolution is optimal with regard to the accuracy and efficiency of the computation, and a 20 cm resolution does not bring any further increase in accuracy. Since the modifications in the scenarios tested in this study included only changes in wall roughness and the addition of some objects to the simulations, using the same resolution of 30 cm was justified. The tunnel equipment with dimensions larger than the chosen mesh resolution was modelled explicitly, which included jet fans, vertical traffic signs, and SOS cabins.
The problem regarding the representation of objects not being directly modelled, due to their small dimensions, as well as the influence of curved walls, was solved by a proper setting of roughness parameters of the walls in [18]. The high value of the roughness of the tunnel walls equal to 70 mm indicates a strong drag of the tunnel geometry, significantly influencing airflow in the tunnel. This study tested a different approach. A significant part of the objects in the tunnel are made up of supporting structures carrying lighting, jet fans, and other devices (see Figure 3). Moreover, the structures are placed along the centreline of the tunnel under its ceiling, at a height where a strong interaction occurs with the not-fully developed and very fast airflow created by jet fans. This study tested the hypothesis that the tunnel drag is caused to a large extent by this interaction. Due to the complex shape of supporting structures with several dimensions smaller than the grid resolution, their modelling within the given 30 cm mesh resolution was not possible. Therefore, the drag they cause was modelled using a system of regularly placed cuboid objects under the tunnel ceiling. The geometry of the tunnel including the cuboids and anemometers is depicted in Figure 4.
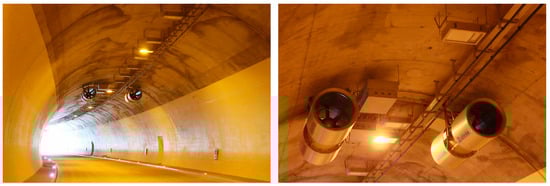
Figure 3.
Various installations under the tunnel ceiling.
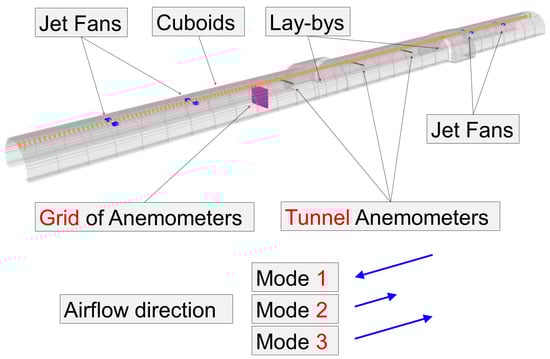
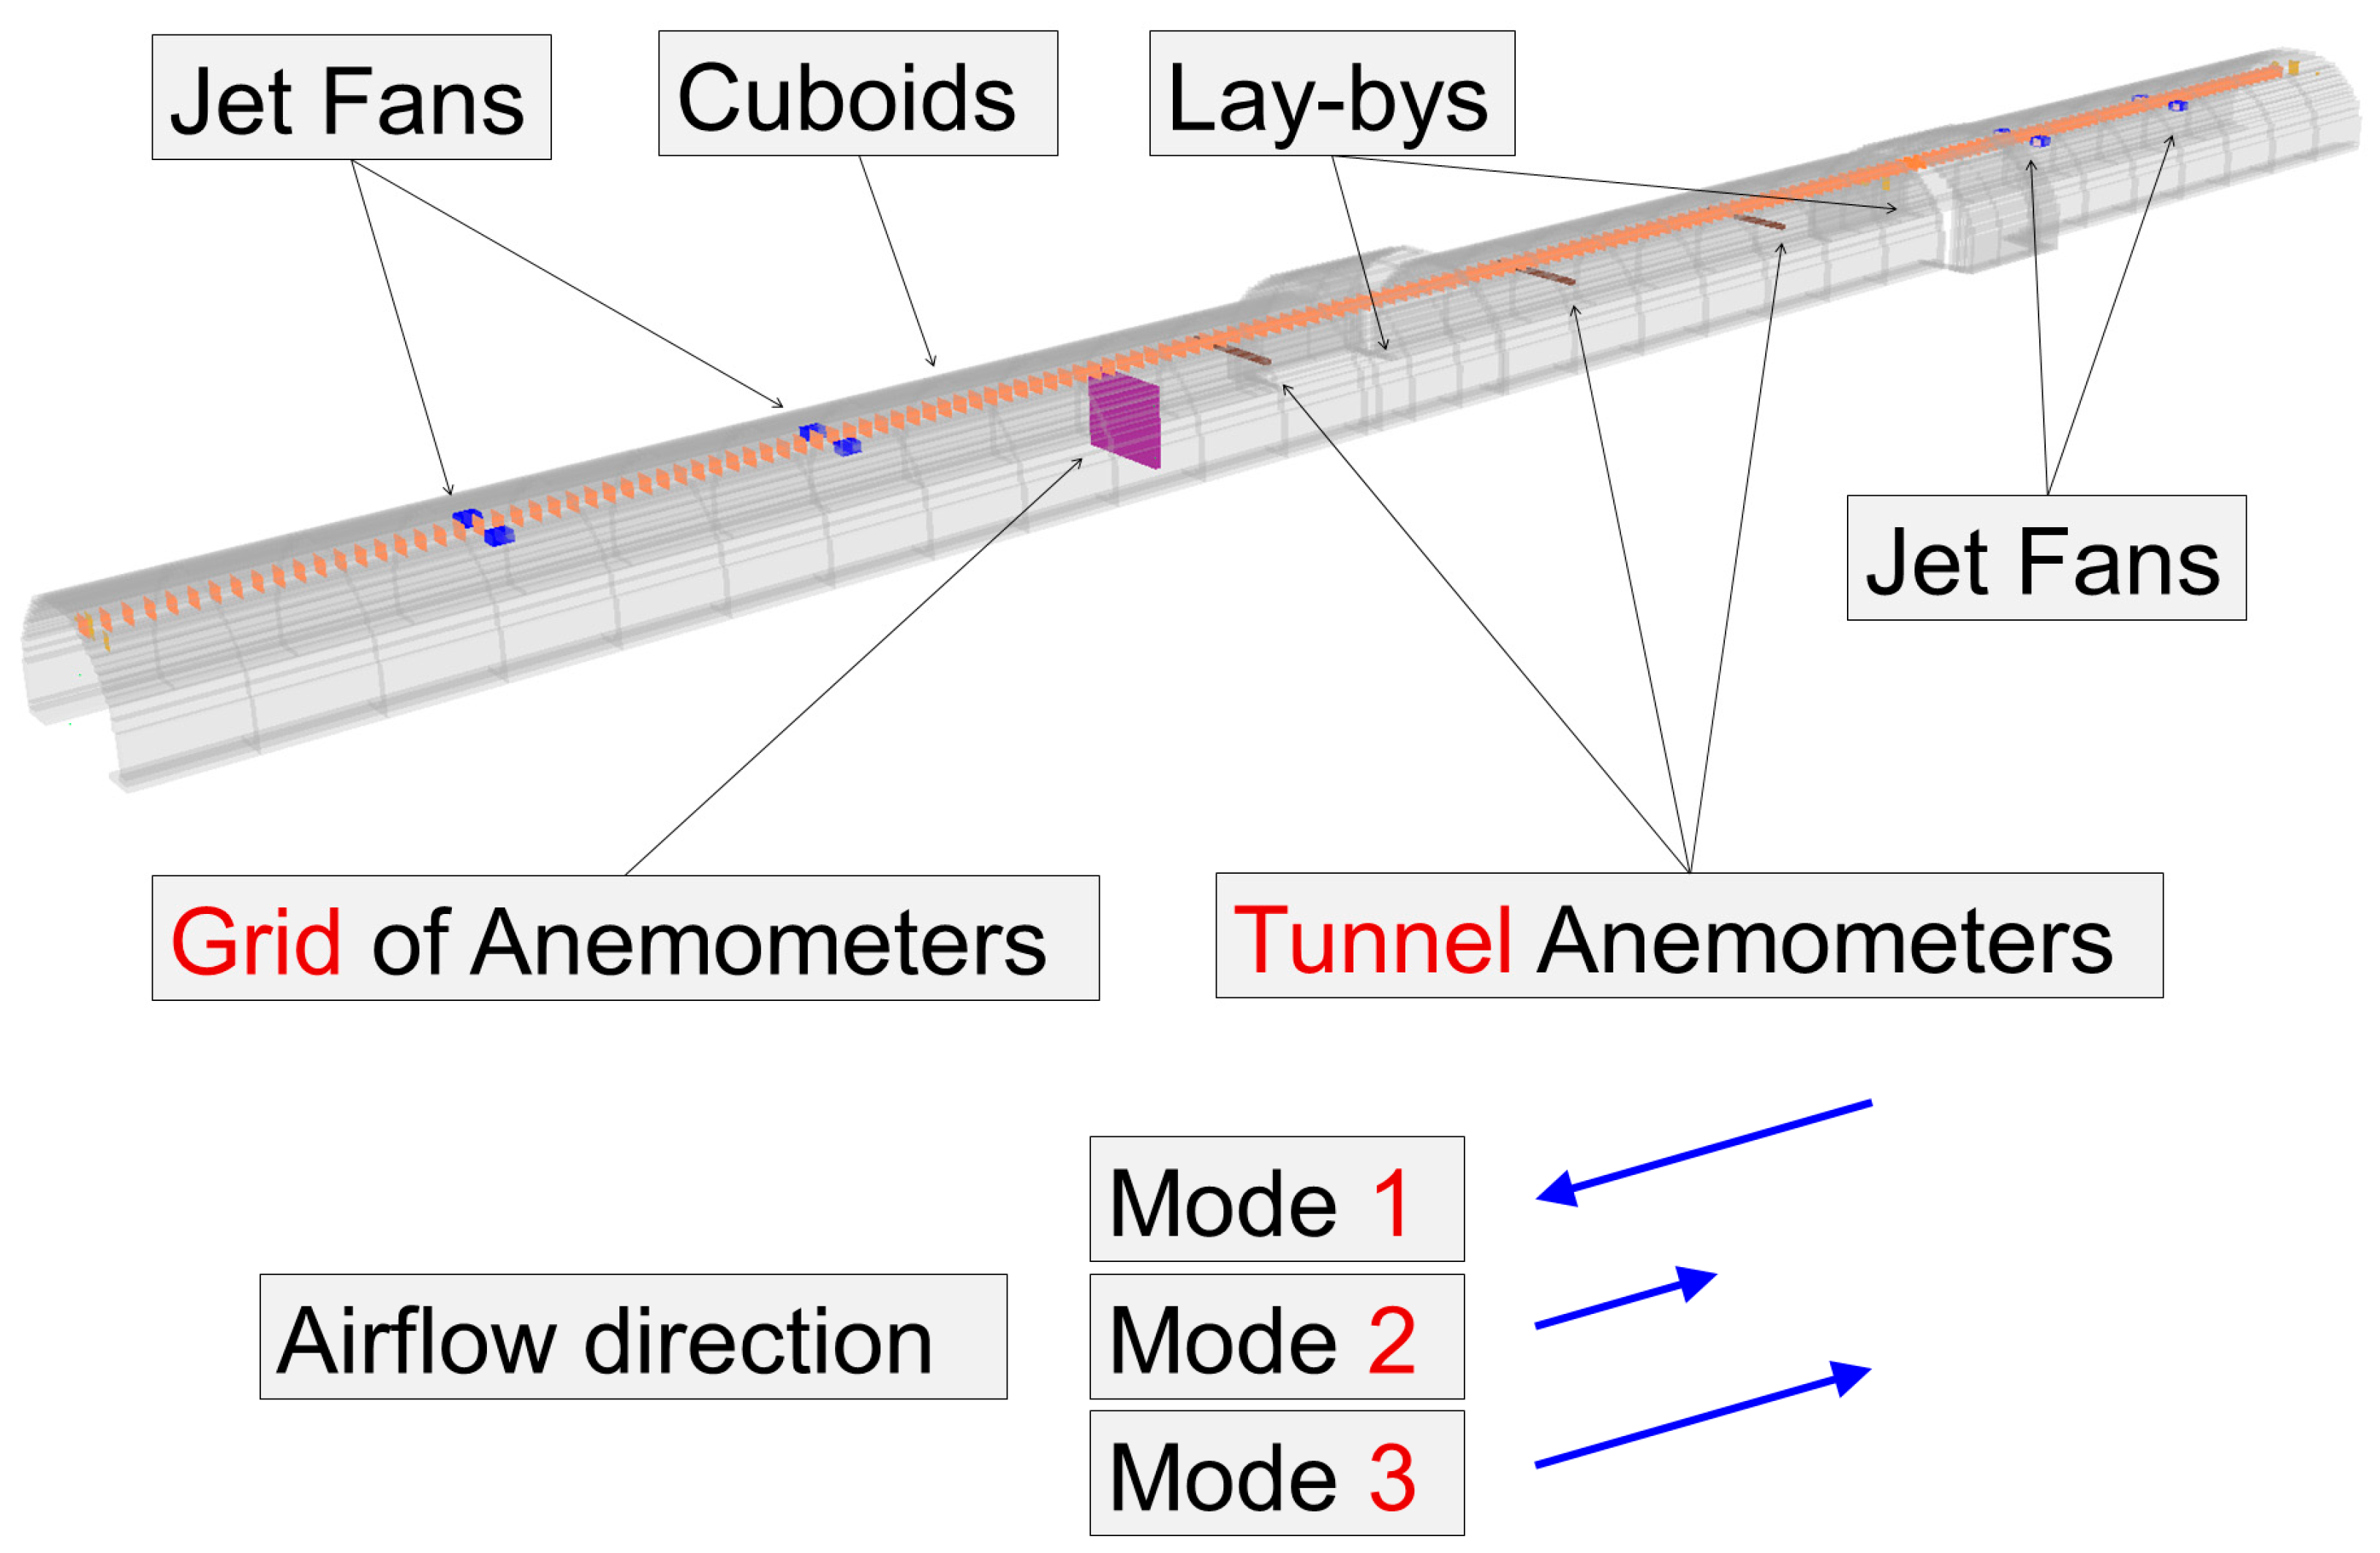
Figure 4.
FDS model of the Polana tunnel (Model S), where y and z dimensions are upscaled by a factor of 5.
In the three tested models, cuboids of the same dimensions, 1 × 4 × 3 computation cells, i.e., 0.3 × 1.2 × 0.9 m, were considered. Three types of arrangements under the tunnel ceiling were examined (see Figure 5).
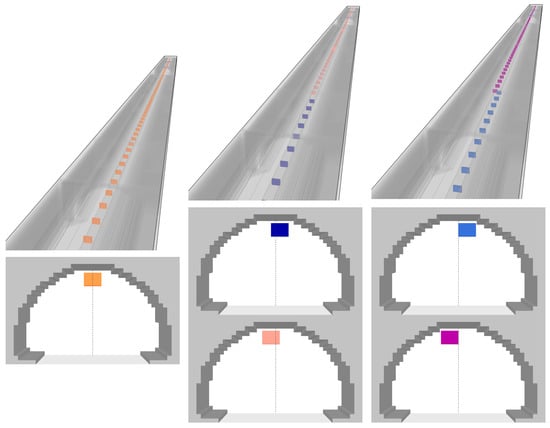
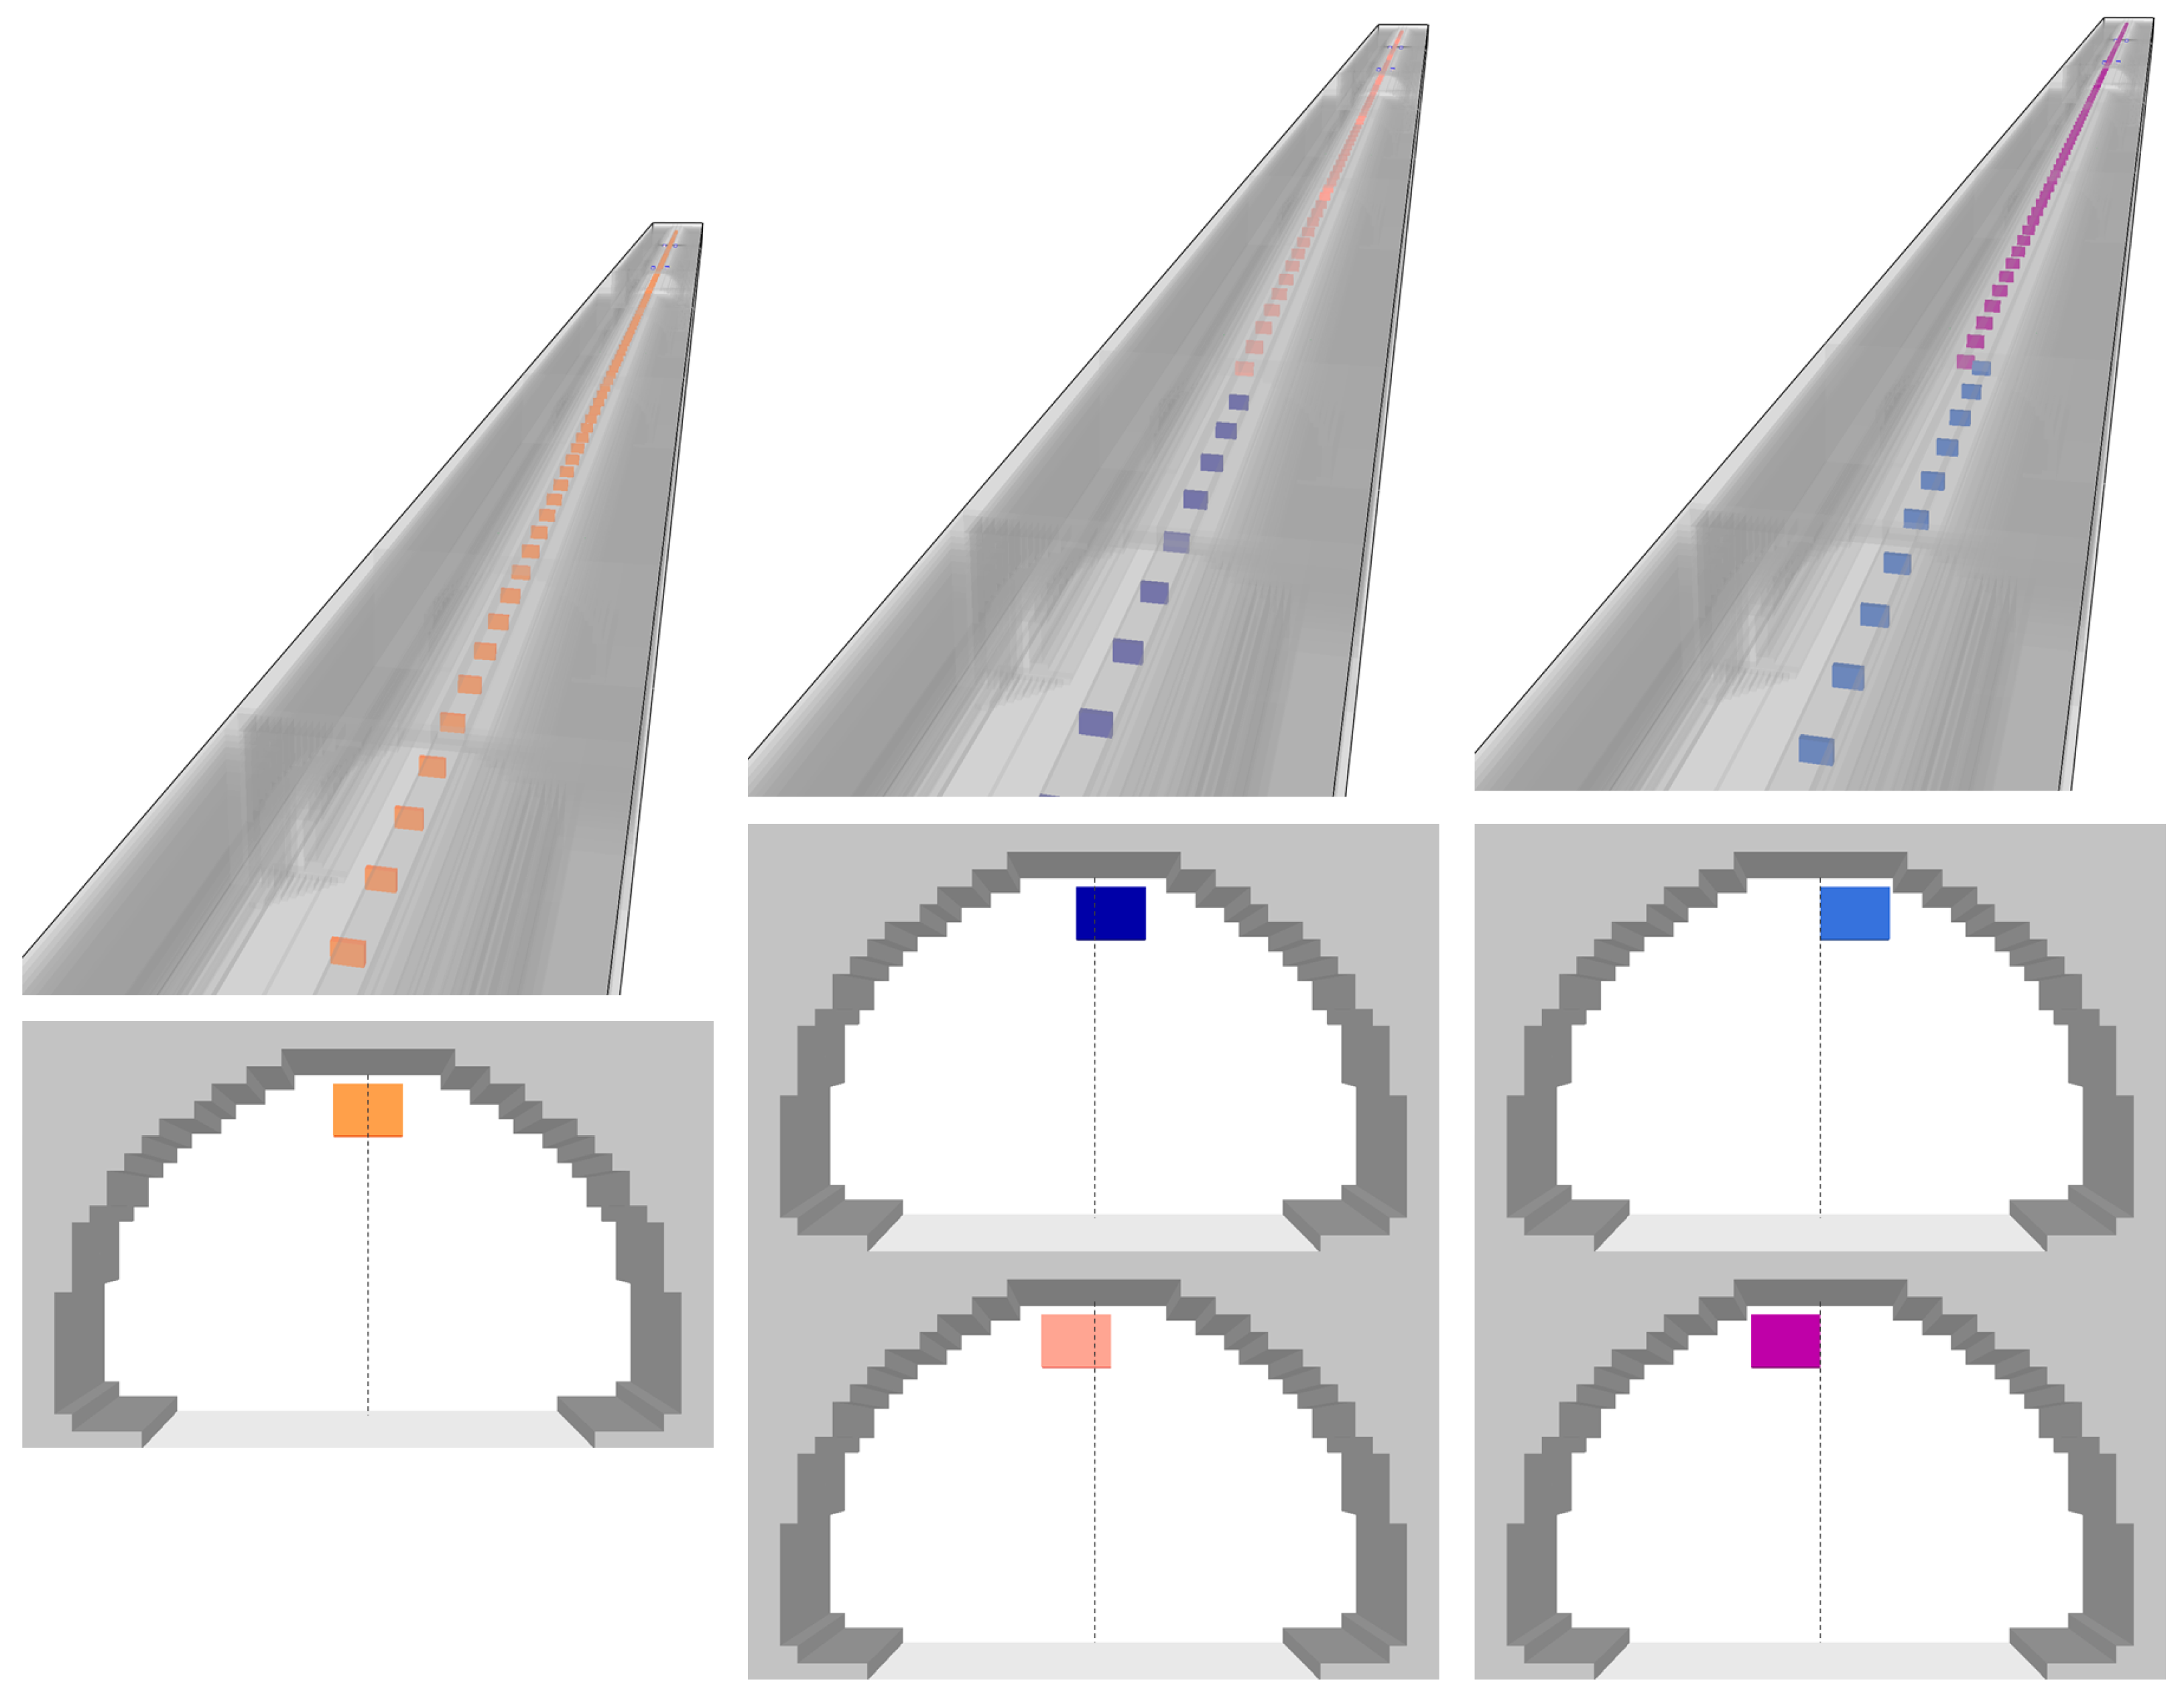
Figure 5.
Polana tunnel cross-section with locations of cuboids for three examined models: S, A1, and A2.
Model S: the cuboids are located above the tunnel centreline, i.e., symmetrically placed, at a height of 5.4 m and at regular distances from each other (see Figure 4)
Model A1: The cuboids are placed in two different ways. In the first half of the tunnel, the cuboids are placed above the tunnel centreline, shifted one cell to the right. In the second half of the tunnel, the cuboids are placed above the tunnel centreline and shifted one cell to the left. Such an arrangement reflects the curvature of the tunnel walls; cuboids are shifted to the convex wall.
Model A2: the cuboids are placed in a similar way as in the previous case, but they are shifted by 2 cells to the right and to the left, respectively.
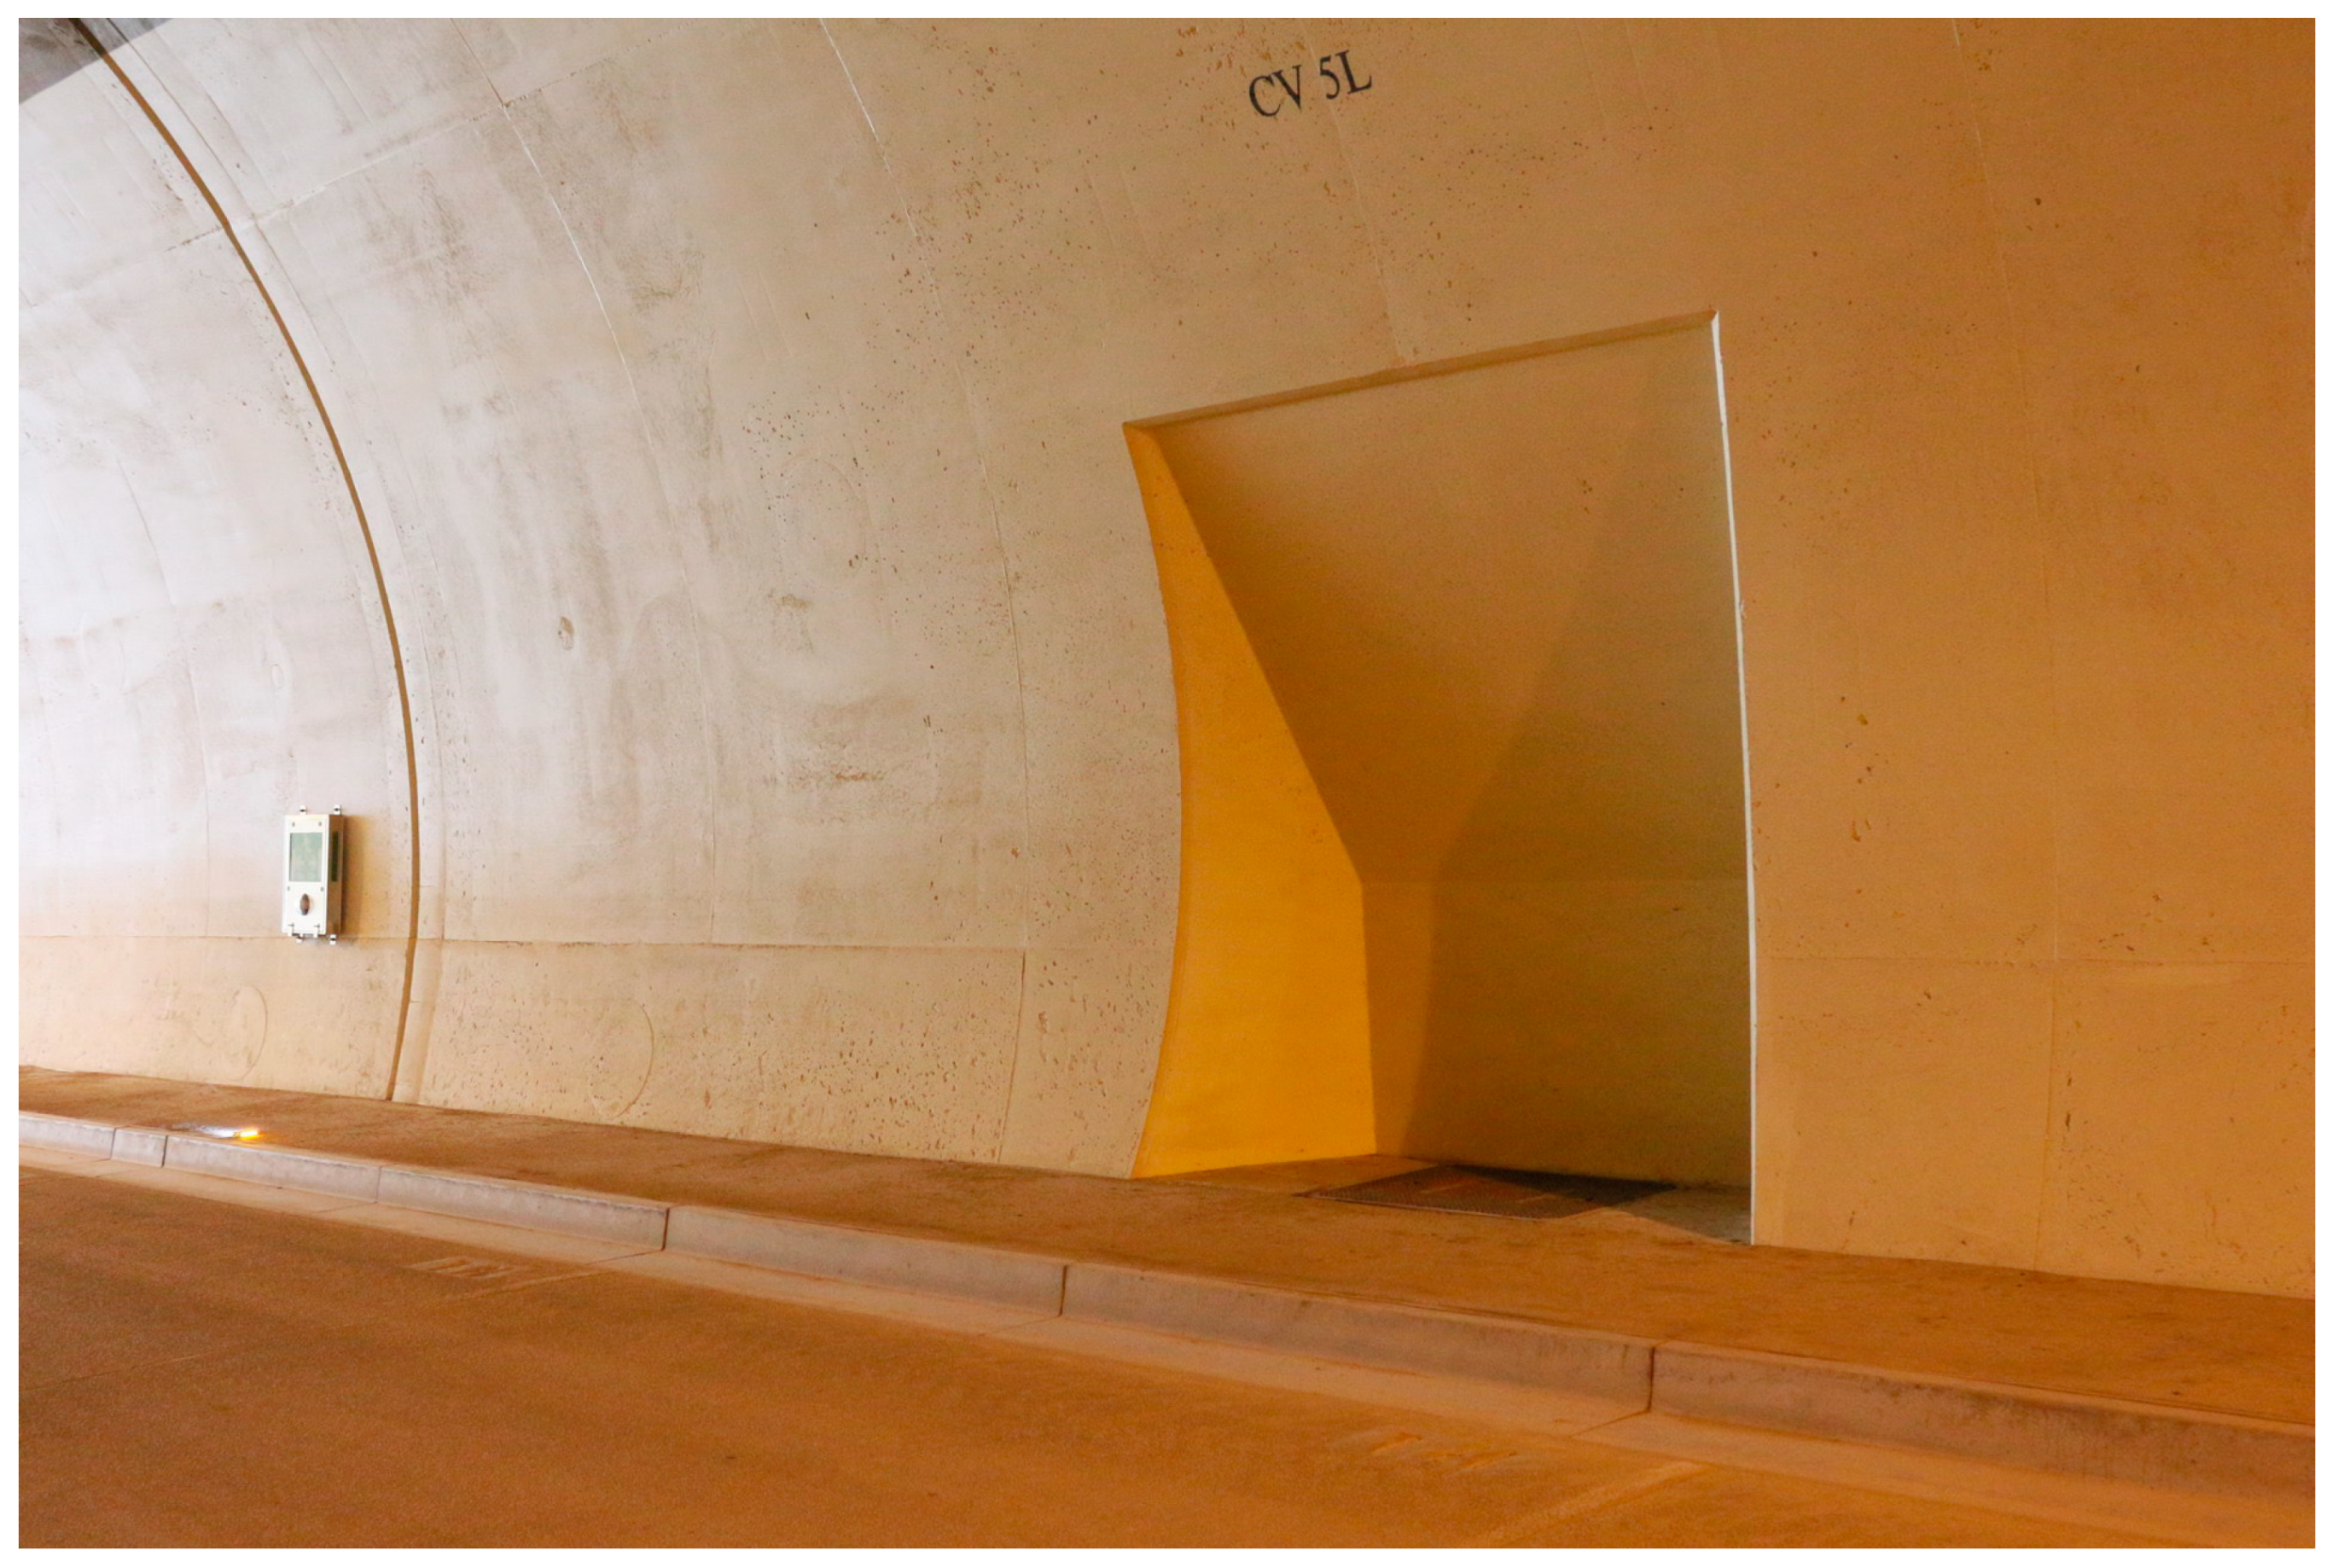
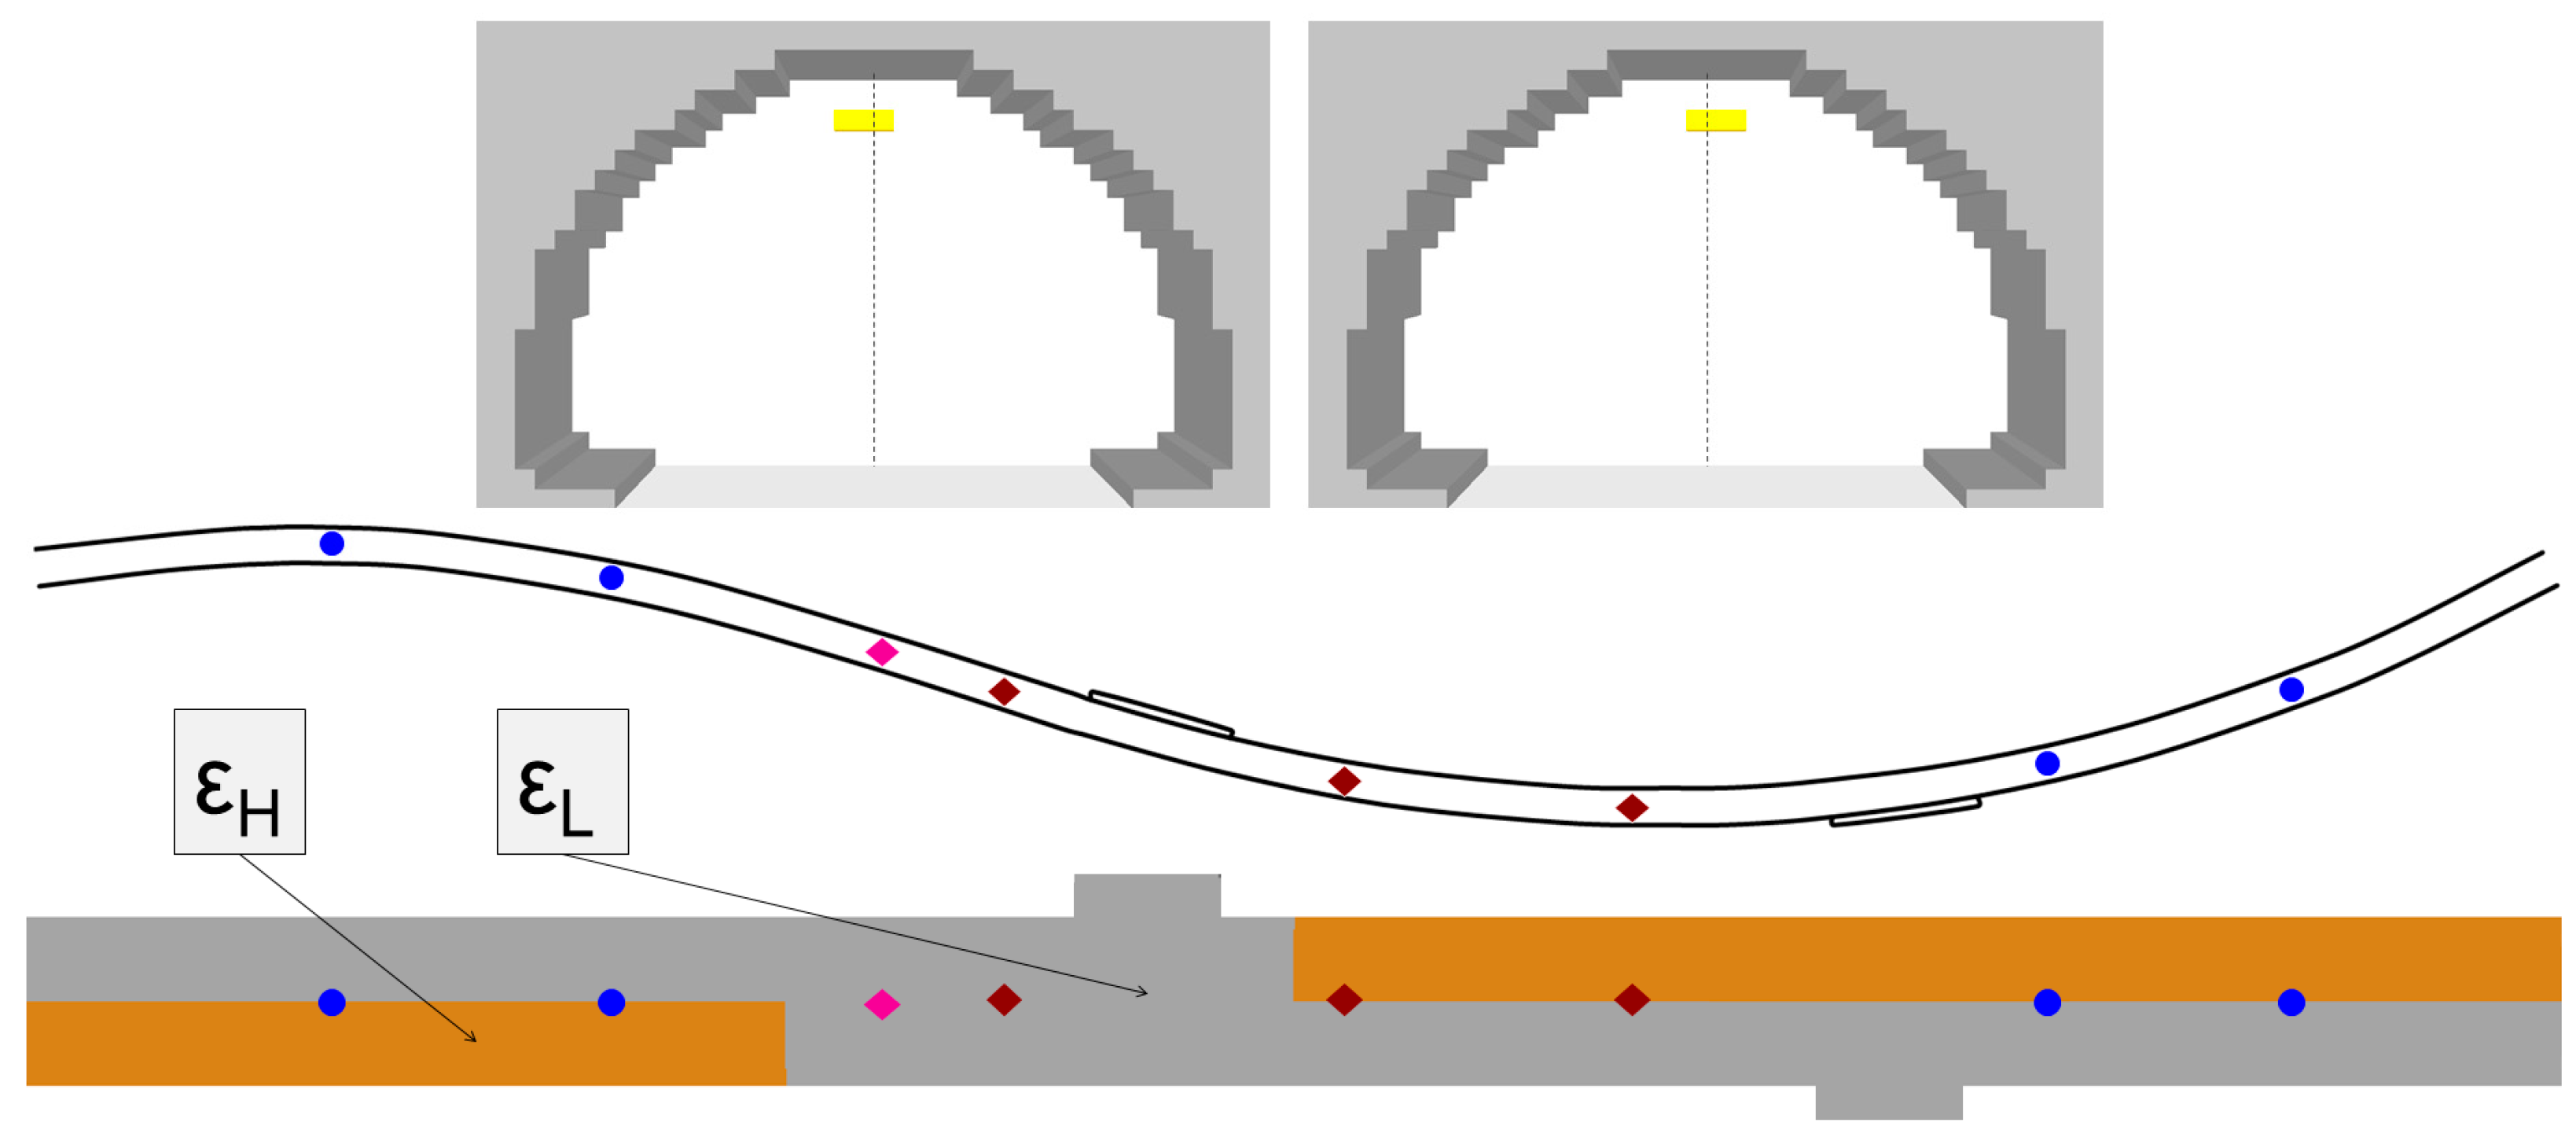
Another possible cause of tunnel drag can be niches in the tunnel walls (see Figure 6) and various installations located along the tunnel walls. The increased roughness of the walls seems more suitable for its modelling. Therefore, Model C was considered based on a combination of both previous approaches that tested the combined effect of wall roughness and drag caused by cuboids. Unlike the original model with uniform roughness of the concrete walls, in the new model, different roughness values were considered. Convex walls were modelled using concrete with a higher roughness value, εH, while concave walls had a lower roughness value, εL. The aim of this approach was to test the possibility of at least partially modelling the influence of the curvature of the tunnel walls within the framework of the FDS rectilinear grid. From this point of view, the tunnel consists of three sections (see Figure 7). In the first, the tunnel bends to the right, and therefore, the right wall is convex (0–270 m). The second is approximately straight (270–450 m). Finally, the third bends to the left, and therefore, the left wall is convex (450–900 m). In order to limit the number of free parameters of the model, the roughness of the concave walls εL as well as that of the walls in the second (straight) section of the tunnel was set equal to the roughness of the road in Model 0, i.e., 3 mm.

Figure 6.
Niches and installations in the tunnel walls.
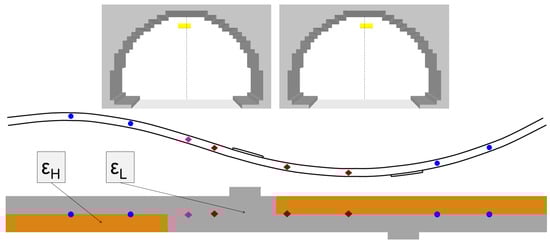
Figure 7.
Model C: locations of cuboids, distribution of roughness, and locations of jet fans and anemometers.
Because the cuboids in Model C are supposed to provide only part of the total drag and, at the same time, with the aim of achieving a better scalability of the model, smaller cuboids (with an assumed larger number) were used in Model C compared to those in the A1, A2, and S Models. The cuboids with dimensions of 1 × 3 × 1 computation cells (0.3 × 0.9 × 0.3 m) were located above the tunnel centreline at a height of 5.7 m. Successive cuboids were shifted alternately by one cell to the left and right, with the aim of achieving a symmetrical effect on the airflow. Such an arrangement was chosen to cover approximately the same area of the tunnel cross-section as the larger cuboids in previous models, i.e., 2 cells to the left and 2 cells to the right of the tunnel centreline.
The simulated airflow in the tunnel was created through the action of jet fans, which contributed to its more realistic simulation. We considered this approach more suitable than the usual approach used in the literature which prescribes the flow velocity under boundary conditions. The jet fan was modelled as a one-cell-thick obstruction of 0.9 × 0.6 m dimensions (6 cells), with two vents associated with it, representing the jet fan inlet and outlet with a prescribed volume flow. The shroud of jet fans was modelled using four one-mesh-cell-thick obstruction of 3.9 m in length. The volume flow set in HVAC, corresponding to the maximal performance of a particular jet fan at 3250 RPM, was adjusted to 19.75 m3·s−1 [18,24,25]. The time dependence of the volume flow rate of jet fans in operation was set using the RAMP feature according to their performance during the ventilation tests (see Figure 8).
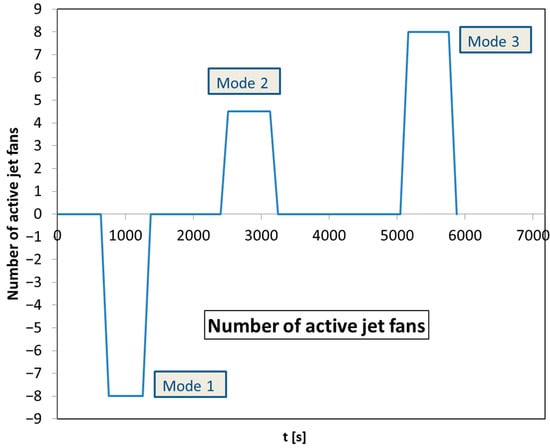
Figure 8.
Number of active jet fans for three ventilation modes.
Simulations of 7180 s of the ventilation tests were performed for 4 tested models. The three time intervals of stabilized jet fan performance, namely 755–1255, 2515–3130, and 5165–5760 s, were used for three ventilation modes. The main settings of FDS simulations, consistent with [18], are summarized in Table 4.
Table 4.
Main settings of FDS simulations.
The message passing interface (MPI) model was used in order to increase the computational efficiency of the simulation. The computational domain was decomposed into 12 meshes; each of them was assigned to one MPI process (one CPU core) with the aim of taking full advantage of the 12 CPU computational node performance. The simulations were carried out on an IBM dx360 M3 cluster (SIVVP cluster, IISAS, Bratislava, Slovakia) consisting of 54 computational nodes (2× Intel E5645 @ 2.4 GHz CPU, 48 GB RAM, Intel, Santa Clara, CA, USA) connected to the Infiniband interconnection network with a bandwidth of 40 Gbit/s per link and direction.
2.3. Determination of Free Parameters of the Models
The considered models have several unknown parameters that need to be determined. The unknown number of cuboids and mutual distances between them in Models A1, A2, and S was determined via trial and error. Simulations with different numbers of cuboids were considered within particular models. In a similar way, various values of εH within Model C were examined. The procedure was as follows.
The steady-state bulk velocities for all 3 operating modes (3 values) as well as the steady-state velocities at the locations of individual anemometers AG1–5 (3 × 5 values) were used to evaluate the accuracy of the simulation for a given set of parameters. Airflow velocity in the simulation (bulk velocity) was determined as a mean of velocities at the positions of AG1–5 anemometers. Time intervals of 920–1255, 2750–3130, and 5350–5750 s corresponding to steady-state conditions were used to determine steady-state velocities for three individual modes as a mean of all velocity values in the interval, recorded with a 5 s frequency.
As a measure of simulation accuracy, the root-mean-square deviation (RMSD) was used. Two values of RMSD were considered. RMSD3 was defined as the root mean square of the deviations of the 3 simulated steady-state bulk airflow velocities from the velocities obtained experimentally. RMSD15 was defined as the root mean square of the deviations of the 15 simulated steady-state velocities for AG1–5 positions from the experimental velocities. Note that with respect to the way they are defined, RMSDs are disproportionately more affected by larger deviations.
The optimal values of unknown model parameters were determined on the basis of the requirement to minimize the values of RMSD3 and RMSD15 separately for each of the 4 models. RMSD3 determined using bulk velocities was used as the primary criterion, while RMSD15 expressing the accuracy of the velocity profile was used as the secondary criterion. The parameters that led to the lowest value of RMDS3 within the given model also usually led to the lowest value of RMSD15 (Models A2 and S). Otherwise, the optimal values of the parameters were considered those that led to the best RMSD15 value and, in addition, to an RMSD3 value lower than or comparable to the RMSD3 value corresponding to Model 0. This was the case of Model A1.
The procedure of determining the optimal values of free parameters for Model A2 is described in more detail in [20] and is briefly reproduced here. Five settings of model parameters (the number and density of cuboids) were tested and evaluated. The procedure started with 160 cuboids. Slightly higher velocities achieved by these settings compared to the velocities measured during ventilation tests, as well as high values of RMSD3 and RMSD15, led to the necessity for increasing the number of cuboids (see Table 5). The fifth settings with 178 cuboids and 5.1 m mutual distances achieved RMSD3 and RMSD15 values lower than the ones determined in Model 0 and were considered the final ones. For the other two cuboid models, the process of determining the model parameters was very similar.
Table 5.
Five tested settings of Model A1 parameters and their corresponding RMSDs.
The estimates of Model C parameters were based on the known parameters of the previous models which accelerated the procedure. We assumed that the roughness value in Model C must be higher than the roughness value in Model 0 since the corresponding area with this roughness is significantly smaller, although it must cause a comparable drag effect on the airflows. Therefore, the procedure was limited to εH values higher than 70 mm. Several εH values were tested, and the corresponding number of cuboids was found. As the roughness value increases, the corresponding value of the number of cuboids must decrease to achieve a correct airflow velocity. For any roughness value, it is possible to find the corresponding number of cuboids to achieve the correct velocity value and thus a reasonably low RMSD3 value. However, only the evaluation of RMDS15 will determine which combination of parameters also provides the best description of the velocity profile. As we can see from Table 6, combination No. 3 is the most suitable.
Table 6.
Four tested settings of Model C parameters and their corresponding RMSDs.
The optimized parameters of all 4 models are summarized in Table 7, and the geometry of Model C is depicted in Figure 9.
Table 7.
Main parameters of the evaluated models.
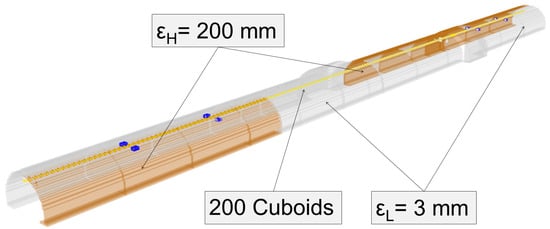
Figure 9.
Model C and its parameters, with y and z dimensions upscaled by a factor of 5.
3. Results and Discussion
In this section, the simulation results are compared with the results of the ventilation tests from 2017 as well as with the simulation results determined using Model 0 in [18]. Steady-state velocity values for three investigated modes are compared: both bulk steady-state airflow velocities and steady-state velocities measured using specific grid anemometers, i.e., the velocity profile.
3.1. Airflow Velocity Evaluation
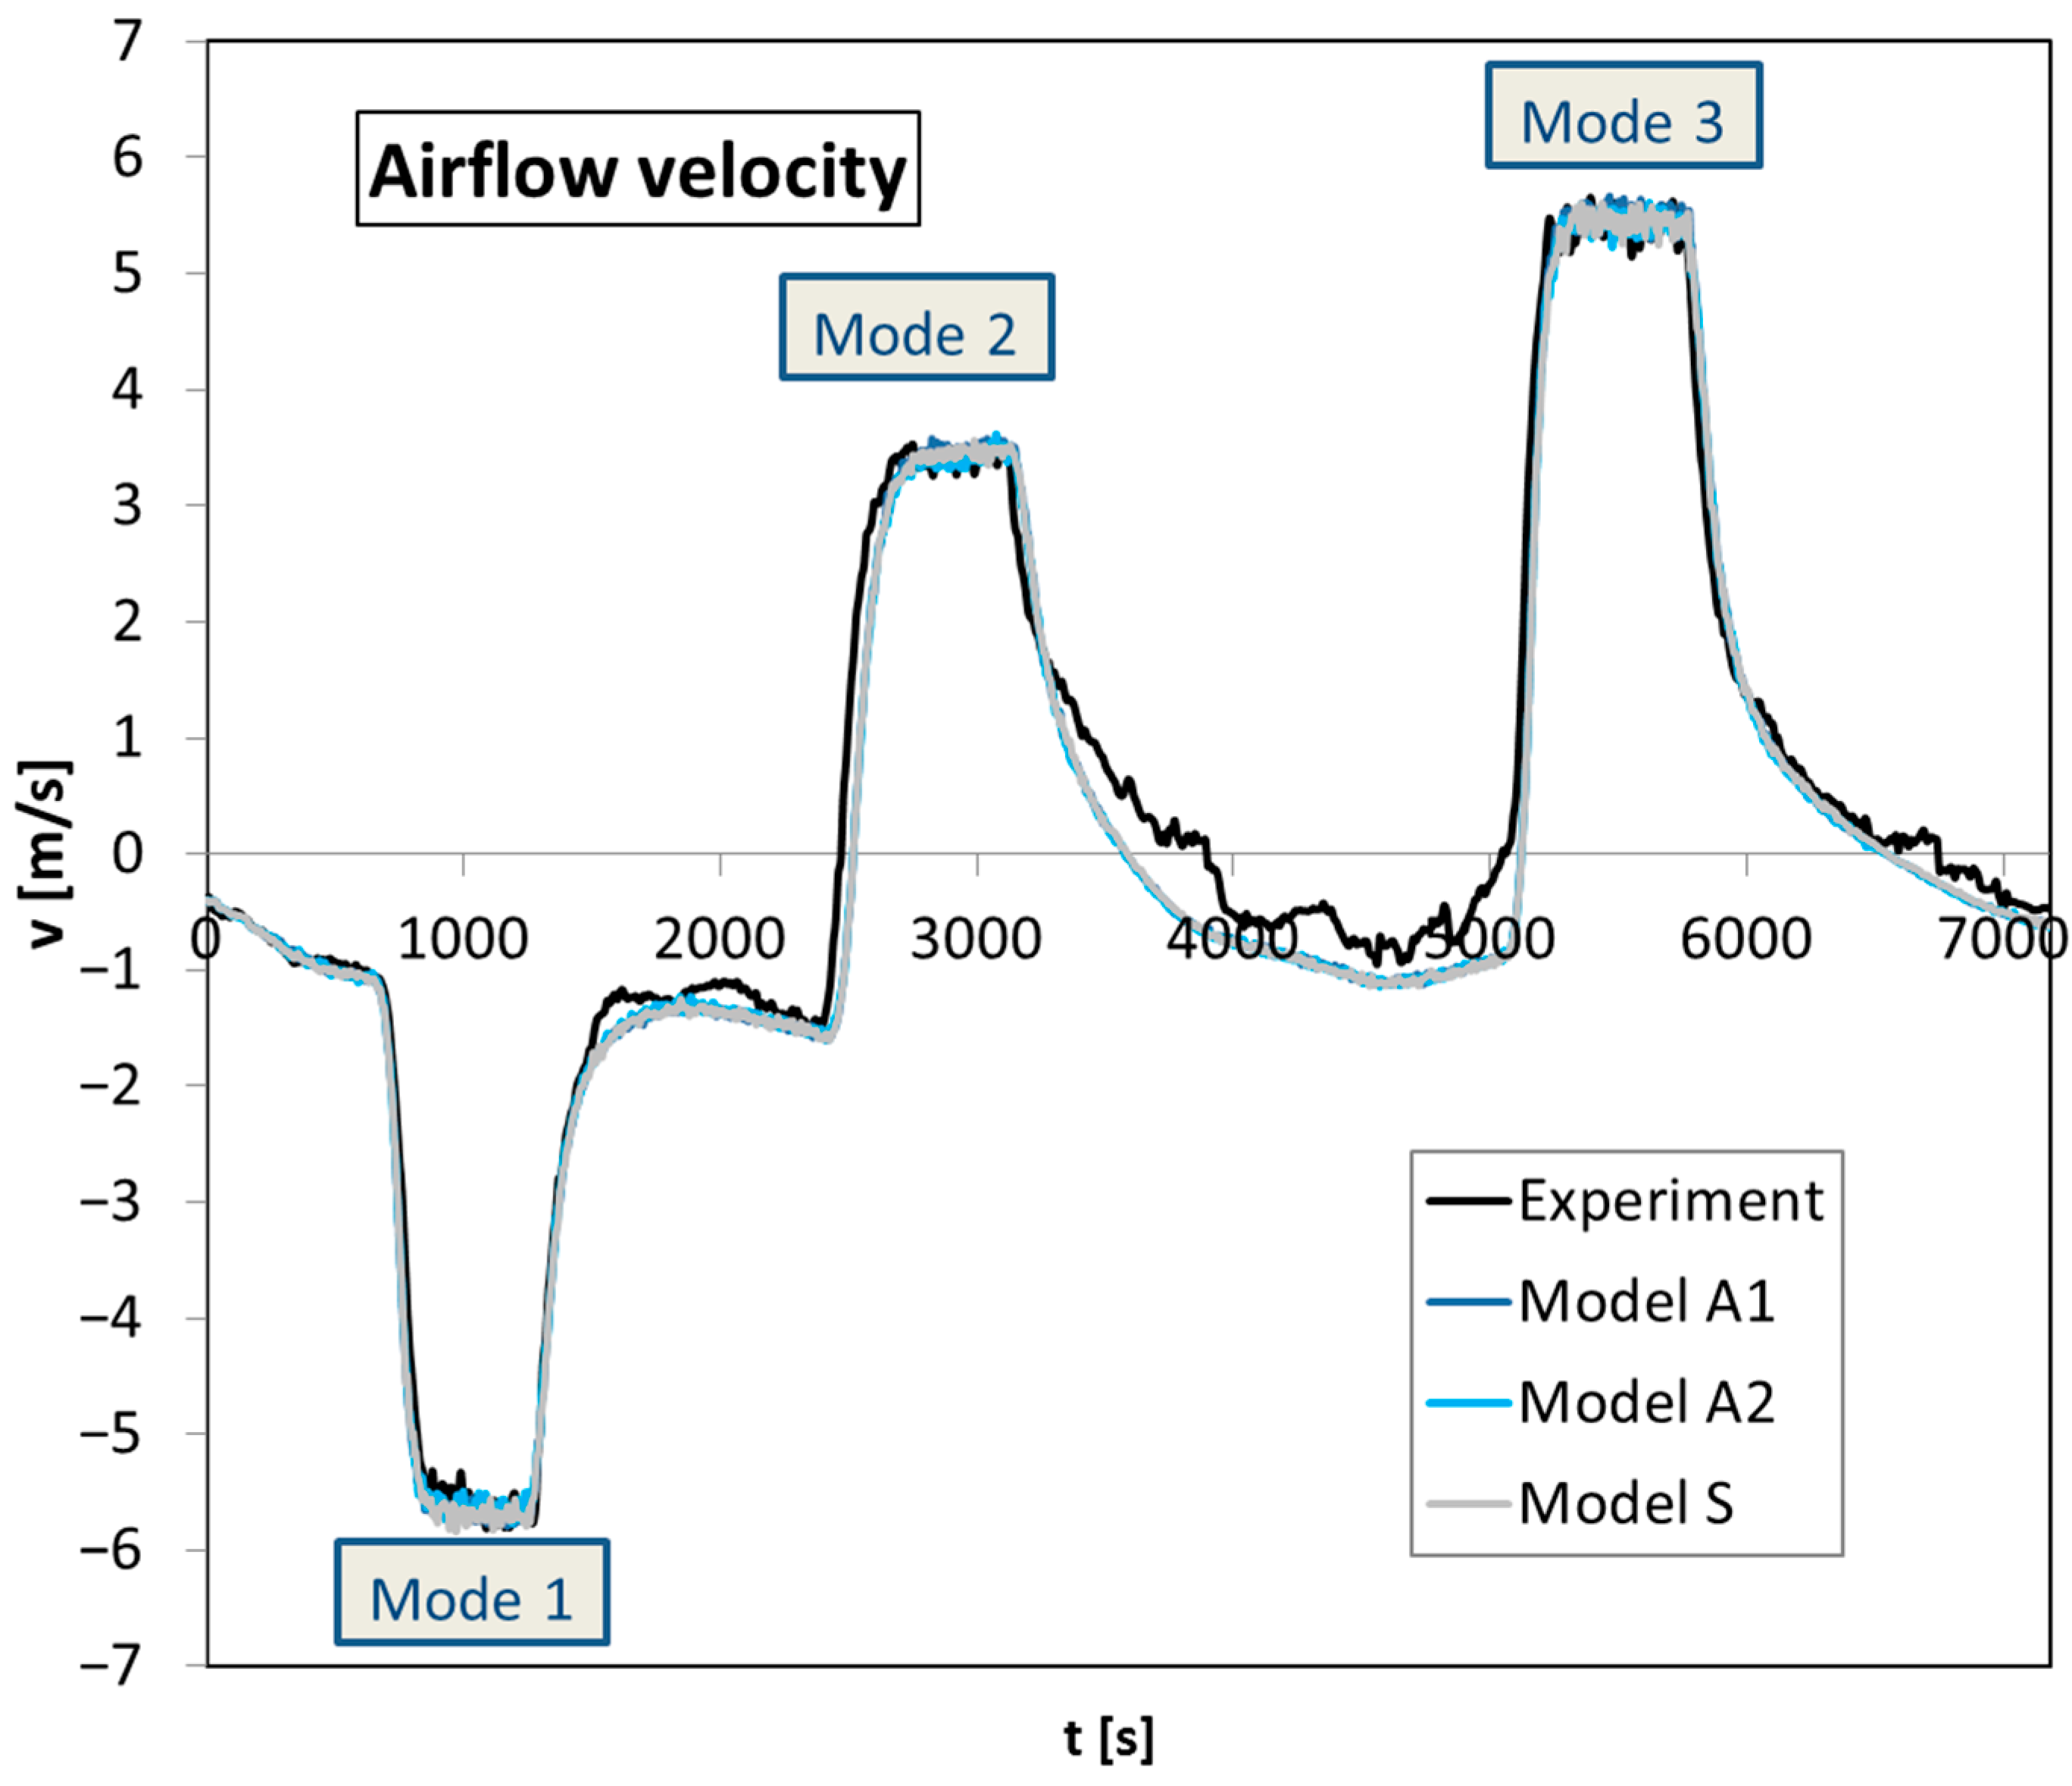
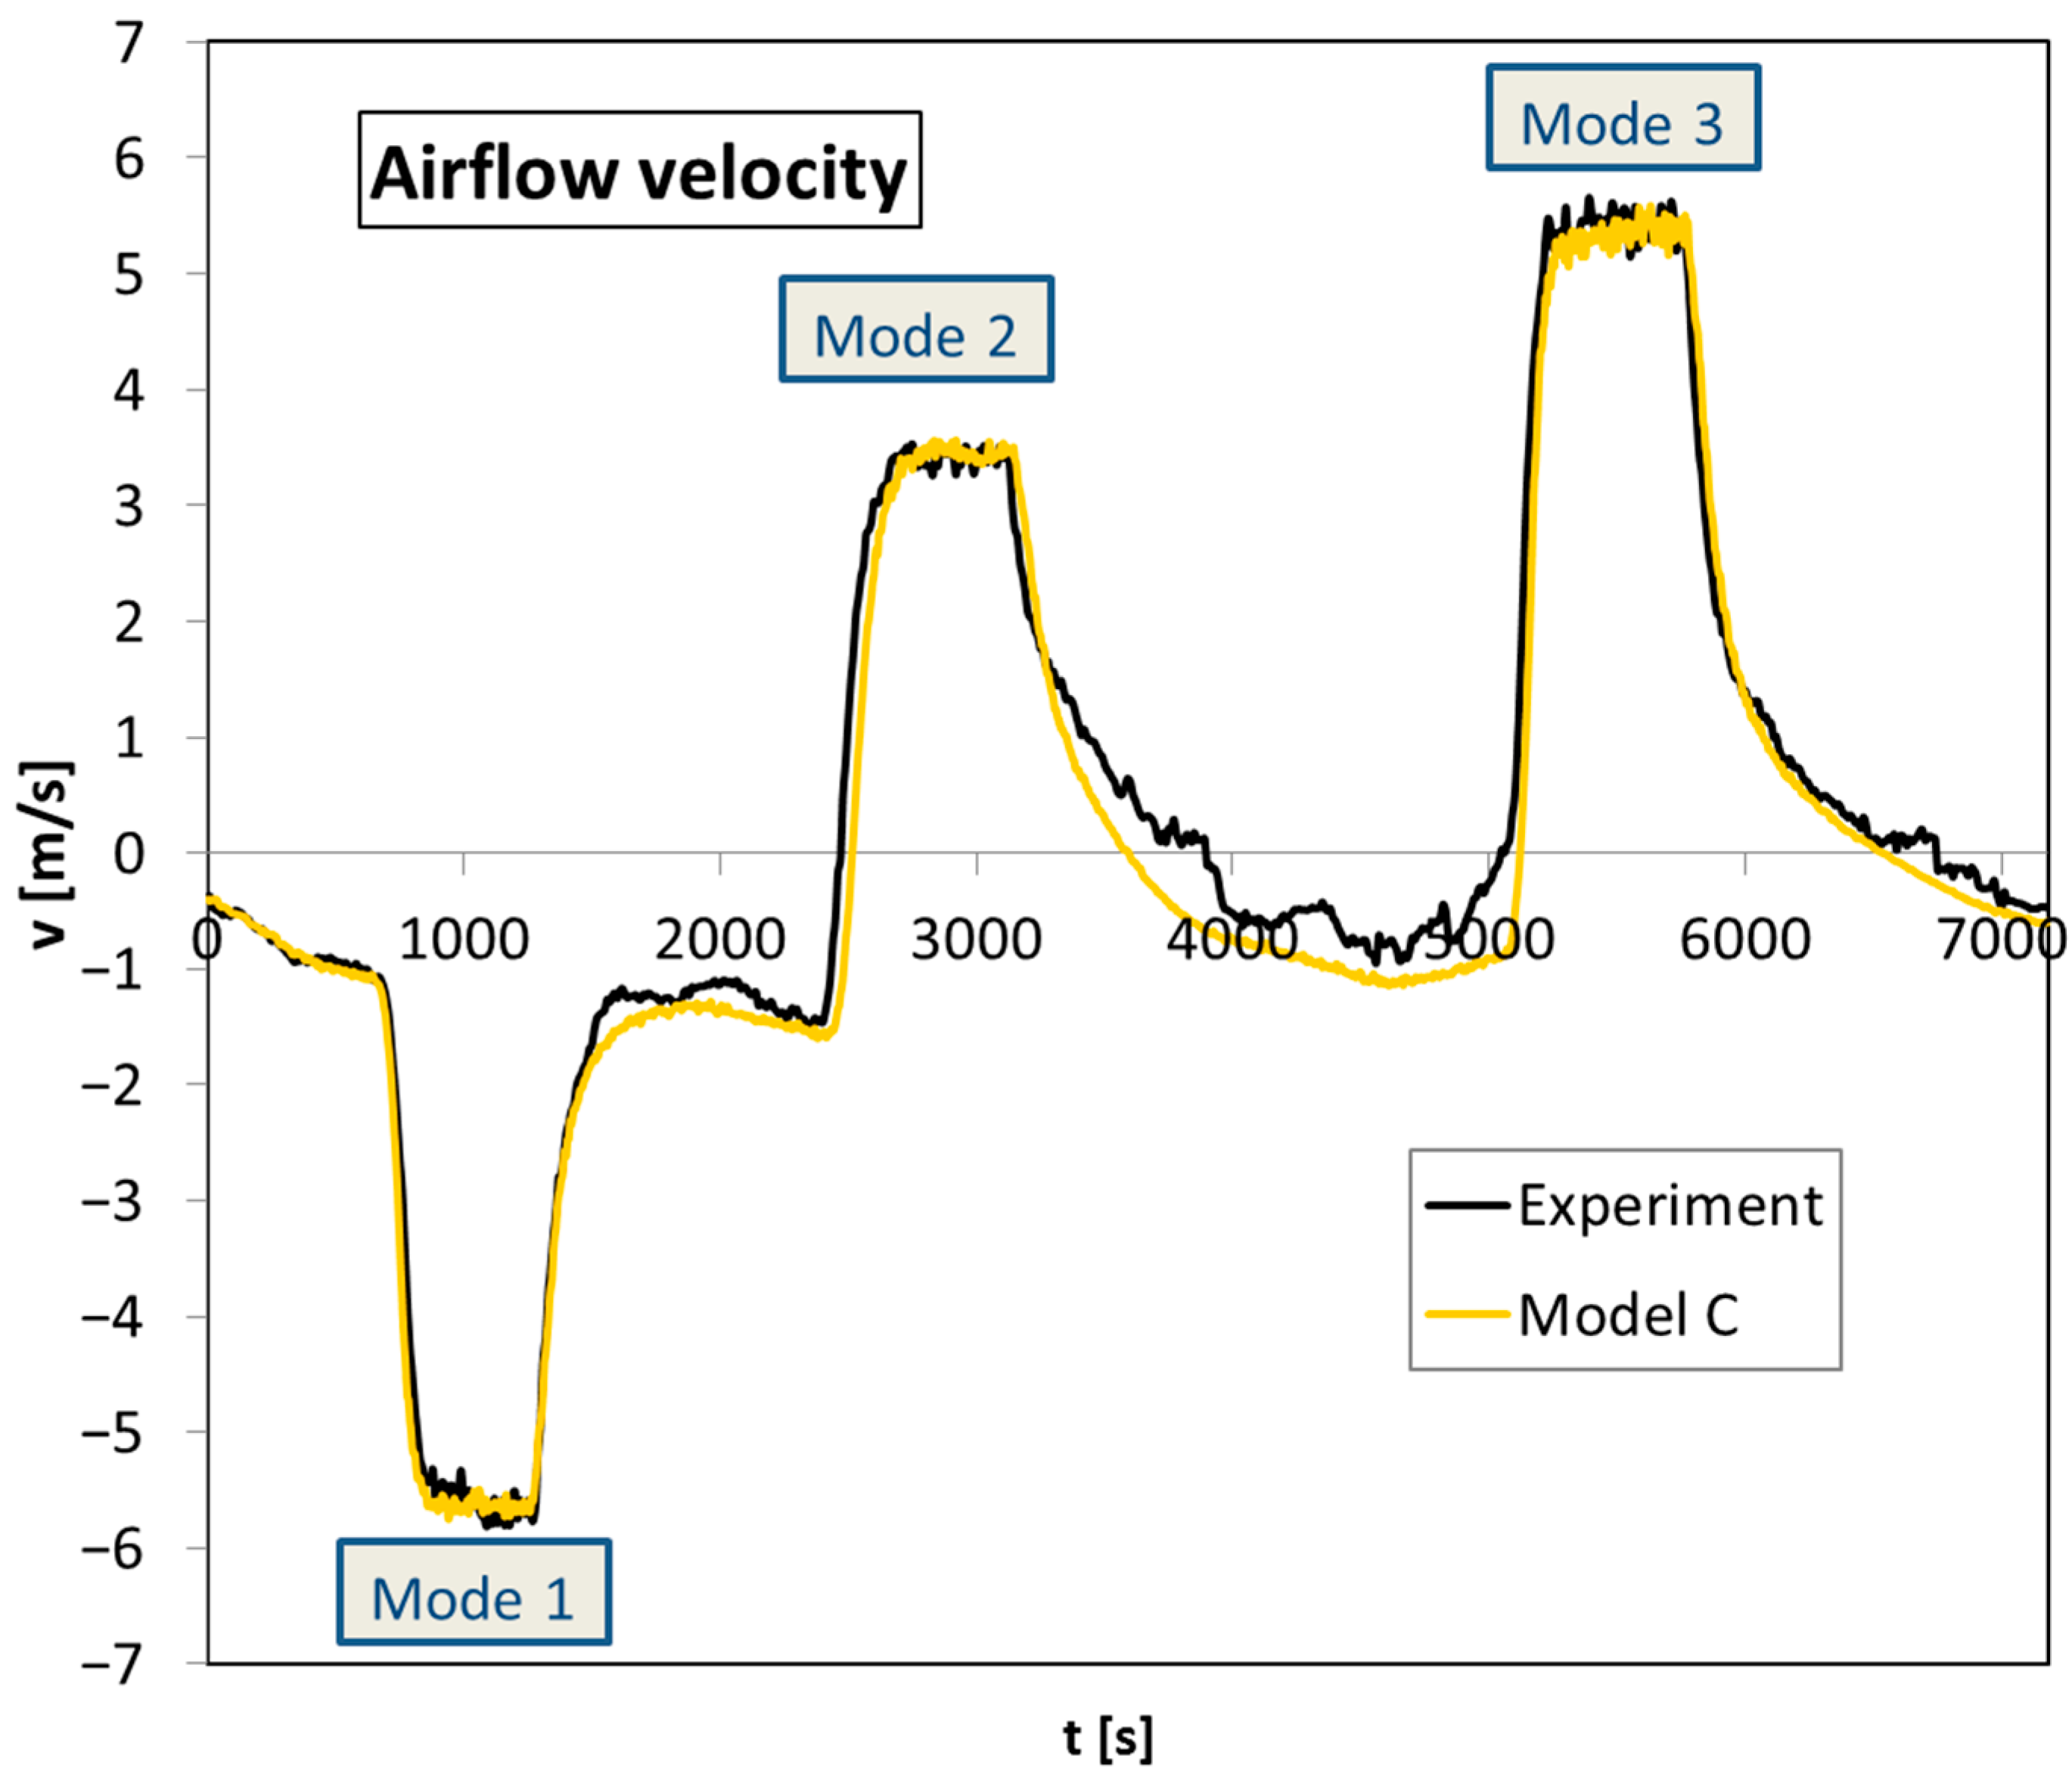
In Figure 10 and Figure 11, airflow velocities for Models S, A1, A2, and C are compared with the values obtained during the ventilation test. For all tested modes, the differences between experimental and simulated values, as well as between the values obtained via individual models, are very small. Steady-state airflow velocities for three modes and all four models are presented in Table 8. All relative deviations are below 2%, which is less than the accuracy of anemometers AG1–5 used in the measurements, and sufficient for practical purposes. As the accuracy of the original model has already been very good, new models do not bring further improvement; however, they are able to provide a comparable accuracy.
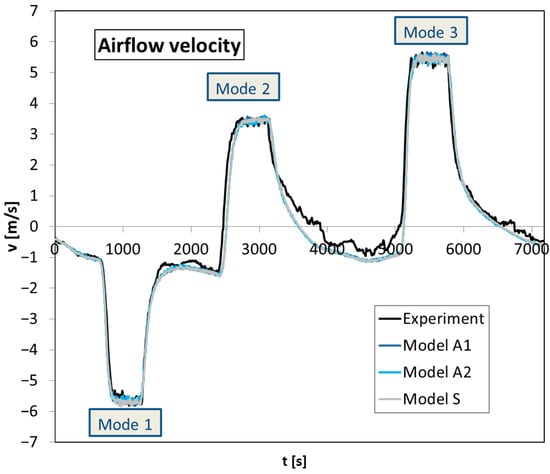
Figure 10.
Airflow velocity determined experimentally and via simulations of Models A1, A2, and S.

Figure 11.
Airflow velocity determined experimentally and via the simulation of Model C.
Table 8.
Experimental and simulated values of steady-state airflow velocity for three ventilation modes [m·s−1], their relative deviations [%], and the values of RMSD 3 and RMSD 15 [m·s−1].
3.2. Airflow Velocity Profile
A considerably higher value of RMSD15 than RMSD3 in Table 8 indicates that the relative deviations of steady-state velocities on anemometers AG1–5 are higher than those mentioned in the previous section. The values of RMSD15 also indicate that the newly tested models provide a better modelling of the velocity profile than the original Model 0. Table 9, Table 10 and Table 11 contain the values of steady-state velocities on anemometers AG1–5 of all four tested models for three ventilation modes, respectively. The sixth and seventh columns of the tables introduce the mean absolute percentage deviation (MAPD5) and the maximum of the absolute relative deviations on individual anemometers (Max5), respectively.
Table 9.
Experimental and simulated values of steady-state velocity on anemometers AG1–5 for Mode 1 [m·s−1], their relative deviations [%], and values of MAPD5 [%] and Max5 [%].
Table 10.
Experimental and simulated values of steady-state velocity on anemometers AG1–5 for Mode 2 [m·s−1], their relative deviations [%], and values of MAPD5 [%] and Max5 [%].
Table 11.
Experimental and simulated values of steady-state velocity on anemometers AG1–5 for Mode 3 [m·s−1], their relative deviations [%], and values of MAPD5 [%] and Max5 [%].
For Mode 1, the relative deviations between experimental and simulated values are below 5% (with one exception for the AG1 anemometer in Model C), which means that the simulated deviations are lower than the grid anemometer accuracy of 0.3 m·s−1. Mutual deviations between the considered models are very low, implicating again the comparable accuracy of the models in this case. Typical relative deviations of about 3% are sufficient for practical purposes.
The 9% relative deviation on the central anemometer AG3 represented the largest relative deviation of the original Model 0 within Modes 1 and 2 and, at the same time, the only case when the absolute deviation on any anemometer exceeded the accuracy of the grid anemometers. Table 10 shows that Models S and A1 lead to a noticeable improvement over the original model, as the maximum recorded deviation dropped to approximately 6%, i.e., to the range of accuracies of anemometers. In addition, the average relative deviation of Model S reached a value of 2.9%, significantly better than all other models.
The relative deviations of the simulated values observed in Mode 3 were significantly higher than in Modes 1 and 2 for Model 0, and this was also the case in all three purely cuboid models, as can be seen in Table 11. This phenomenon is caused by the curvature of the tunnel. The airflow generated by the second jet fan pair located at 200 m from the portal (see Figure 2) reaches the measuring grid 100 m downstream. Since the grid is located in the right-hand bend of the tunnel, the air flow, still not fully developed after 100 m, hits its left part. An asymmetric velocity profile is thus created, which is difficult to model via simulations using a rectilinear computational domain without tunnel bends. It is a significant limitation of any model of a curved tunnel within FDS as well as the limitation of the presented model.
Models A1, A2, and S do not completely solve this problem; however, they lead to a noticeable improvement. The maximum relative deviation observed on individual anemometers reaches similar values as in the original model, 24% or slightly more. However, the MAPD5 of the new models reaches a value of around 13–14% compared to 17% in Model 0. Model S appears to be the most suitable of all cuboid models again, with the maximum relative deviation at the level of the original model, while its MAPD5 reaches a significantly better value of 14.4%. The inclusion of cuboids led to a noticeable improvement in the modelling of the velocity profile.
Model C was designed with the aim of modelling an asymmetrical profile in Mode 3 to some extent. It performed quite well in that regard. Its RMSD15 equal to 0.44 m·s−1 is significantly lower than the RMSD15 of all other models. For Modes 1 and 2, the accuracy of Model C is comparable or slightly lower (by 1–2%) in comparison with Model 0. However, for Mode 3, it achieves significantly better results with 10% MAPD5. Three out of five simulated values have a relative deviation from experimental values lower than 10%, while in Model 0, all deviations are above 12%. Although the maximum observed deviation of 20% for anemometer AG2 is still high (24% in Model 0), such a large deviation occurs only for one of the fifteen values. Although the model was not intended to fully capture all air flows in the curved tunnel, which is not possible within the FDS rectilinear grid, it leads to a noticeable improvement compared to Model 0.
Note that the tested models contain several free parameters determined through trial and error. In order to use the proposed approach for other tunnels, the values of these parameters have to be determined for each tunnel separately. However, it is not a deficiency of our model, but an inevitable consequence of the complex geometry of the tunnel. Various tunnels differ in geometry and the type and dimensions of the objects they contain, a large part of which cannot be modelled within the given computational mesh, nor can the unknown parameters of the model be derived analytically. The trial-and-error method supplemented with the RMSD is the only possible one (see, e.g.,in [13]). Nonetheless, we believe that despite these limitations, our approach is also applicable to other tunnels. The roughness value of 90 mm determined by [13] for the slightly curved 678 m long tested tunnel is very similar to the value determined in the present study. Therefore, it is expected that the values of the model parameters for other tunnels are likely to vary within a relatively narrow range and can be estimated to some extent or possibly refined by measurements.
3.3. Velocity Profile and Velocity Distribution Visualization
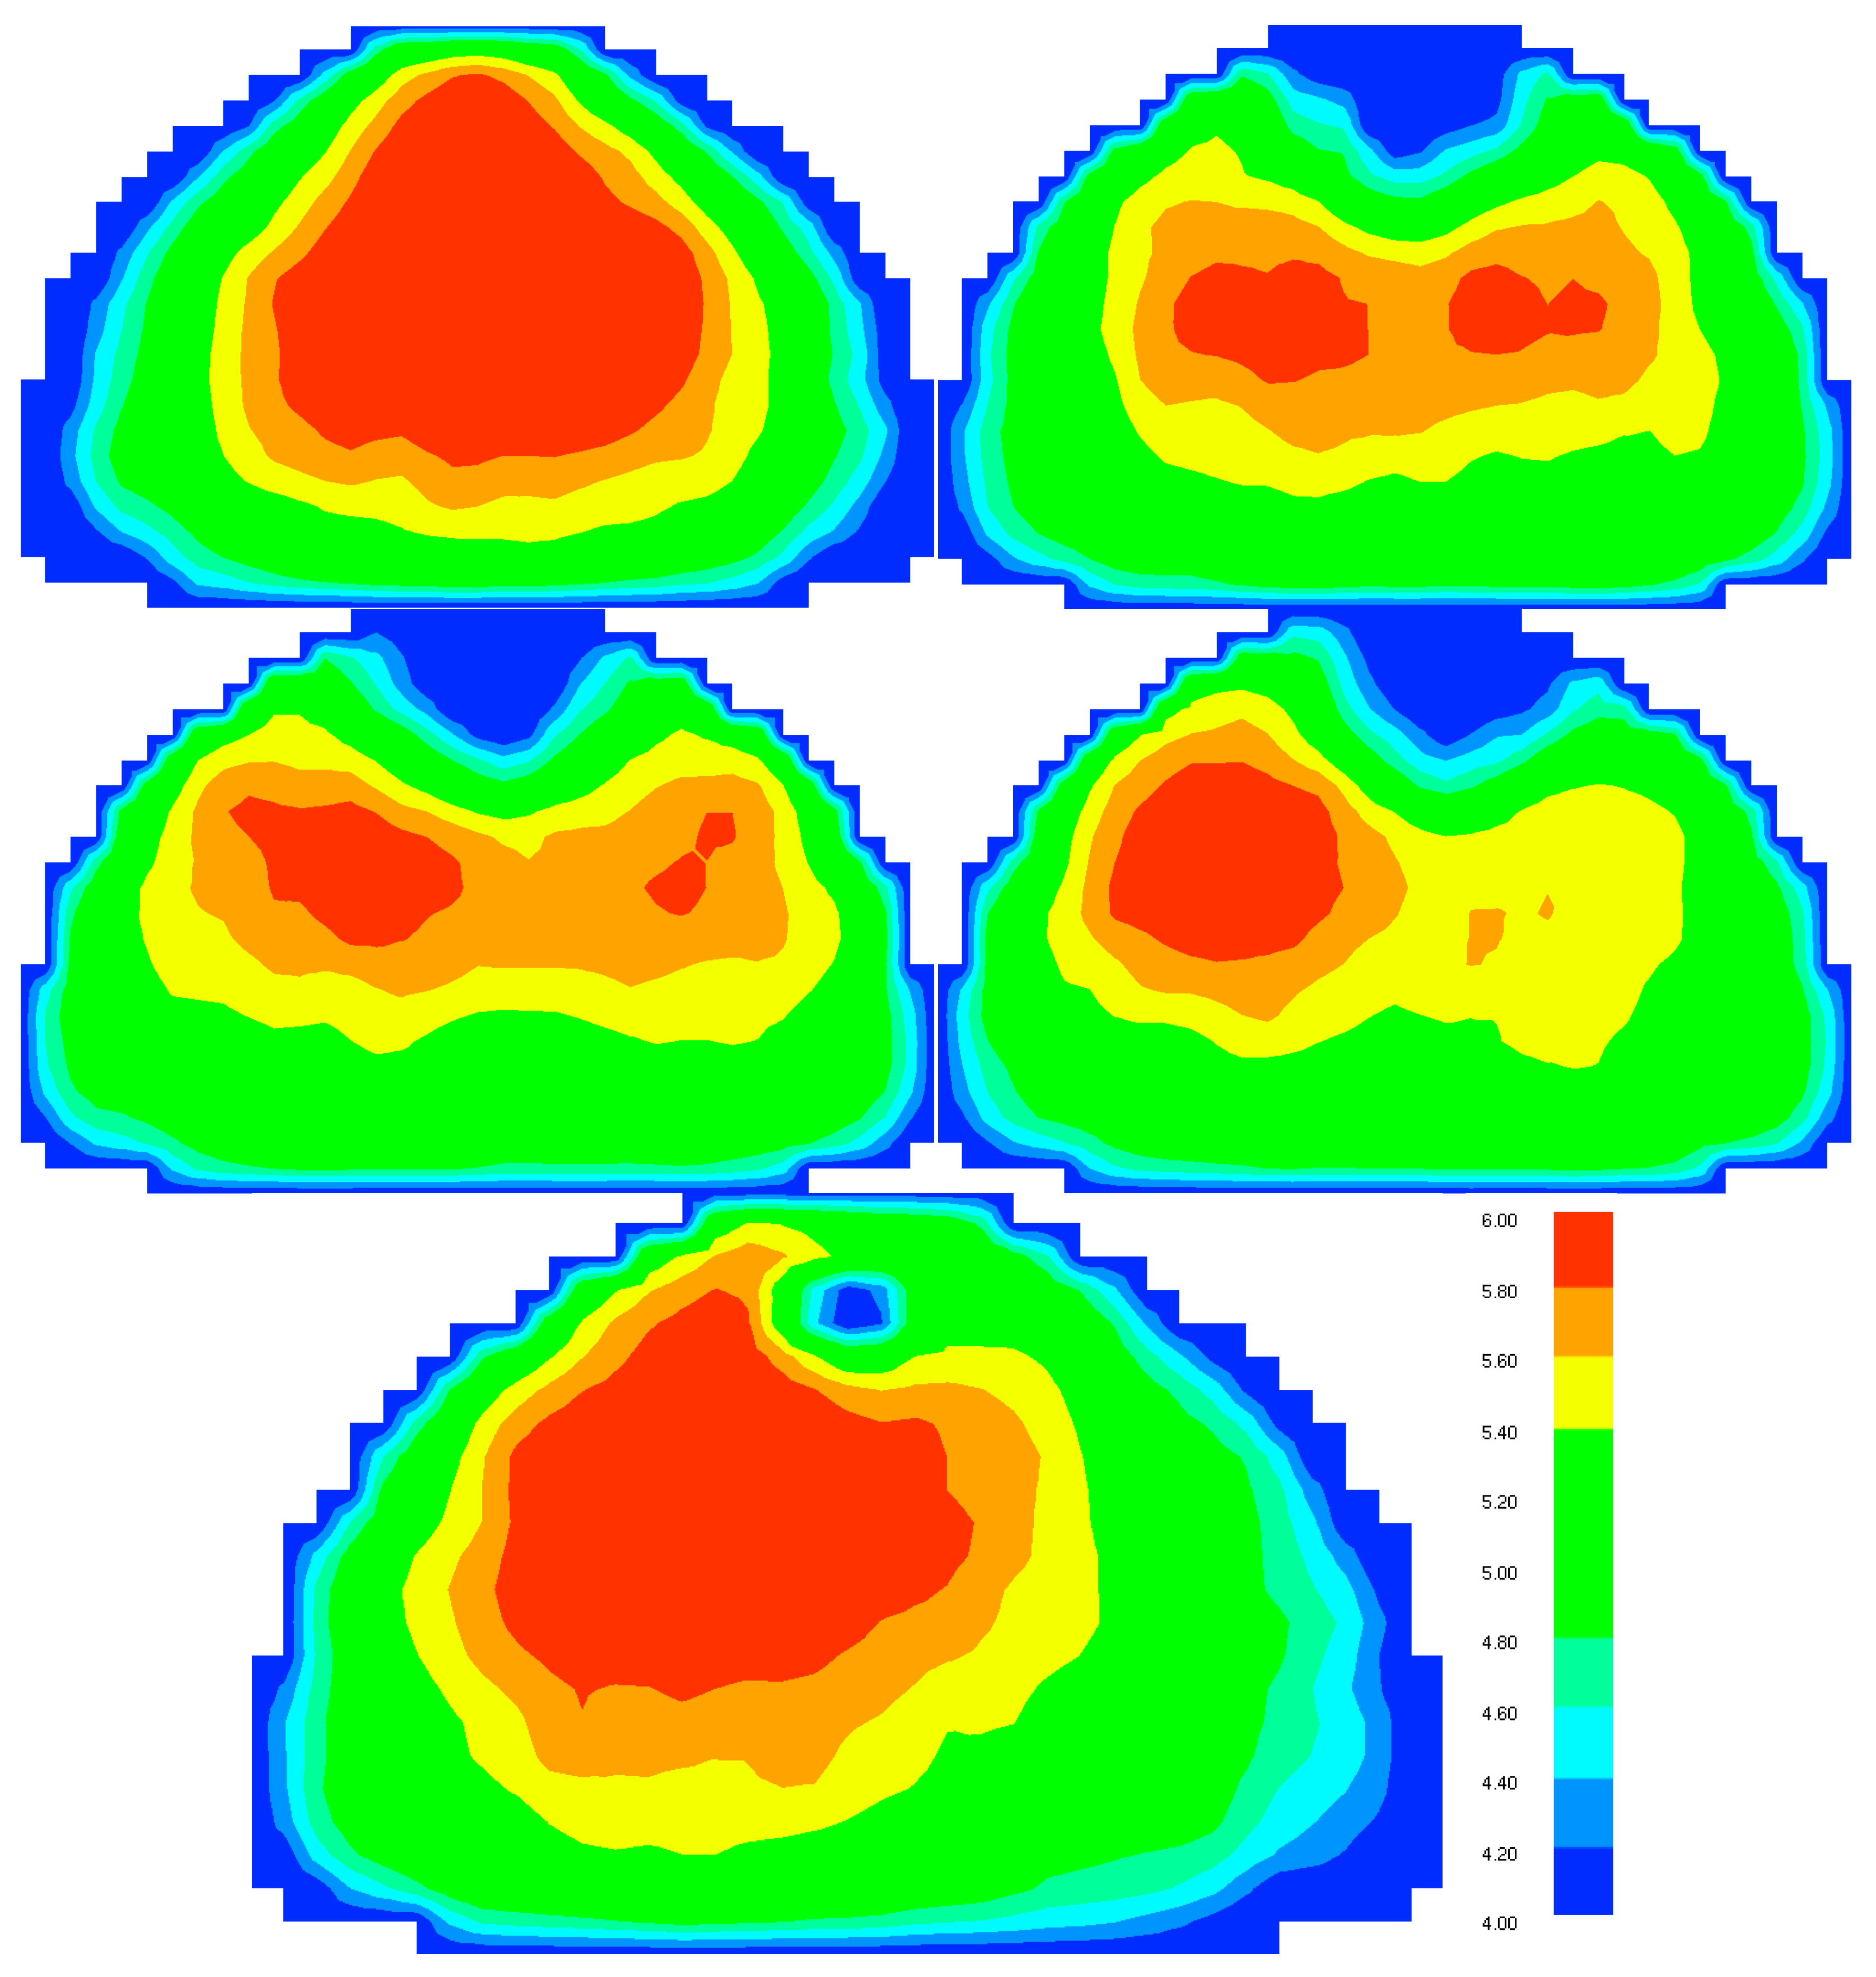
The different representations of the tunnel geometry drag in the individual models affect the shape of the velocity profiles. The distribution of airflow velocity in Mode 3 simulated using individual models is shown in Figure 12.

Figure 12.
Distribution of airflow velocity [m·s−1] in Mode 3 simulated using Models 0, S, A1, A2, and C.
In Model 0, the flow velocity is also high in the upper part of the tunnel cross-section, as this space does not contain any obstacles. On the contrary, in Model S, the velocity under the ceiling is reduced by the cuboids, and high flow velocities are distributed mainly in the medium height of the cross-section. Models A1 and A2 succeeded in creating asymmetric velocity profiles, although their shapes did not lead to a better description of the measurement than Model S. The velocity profile in Model C is similar, but its asymmetry is more pronounced due to the differences in roughness of the convex tunnel wall representing the curvature of the tube. This shape is in good agreement with the shapes of the velocity profile that can be found in the literature [26,27]. Although our approach is not able to fully reproduce all air flows in the tunnel, cuboids and the increased roughness of the tunnel walls made it possible to achieve a more realistic shape of the velocity profile and model its asymmetry to some extent.
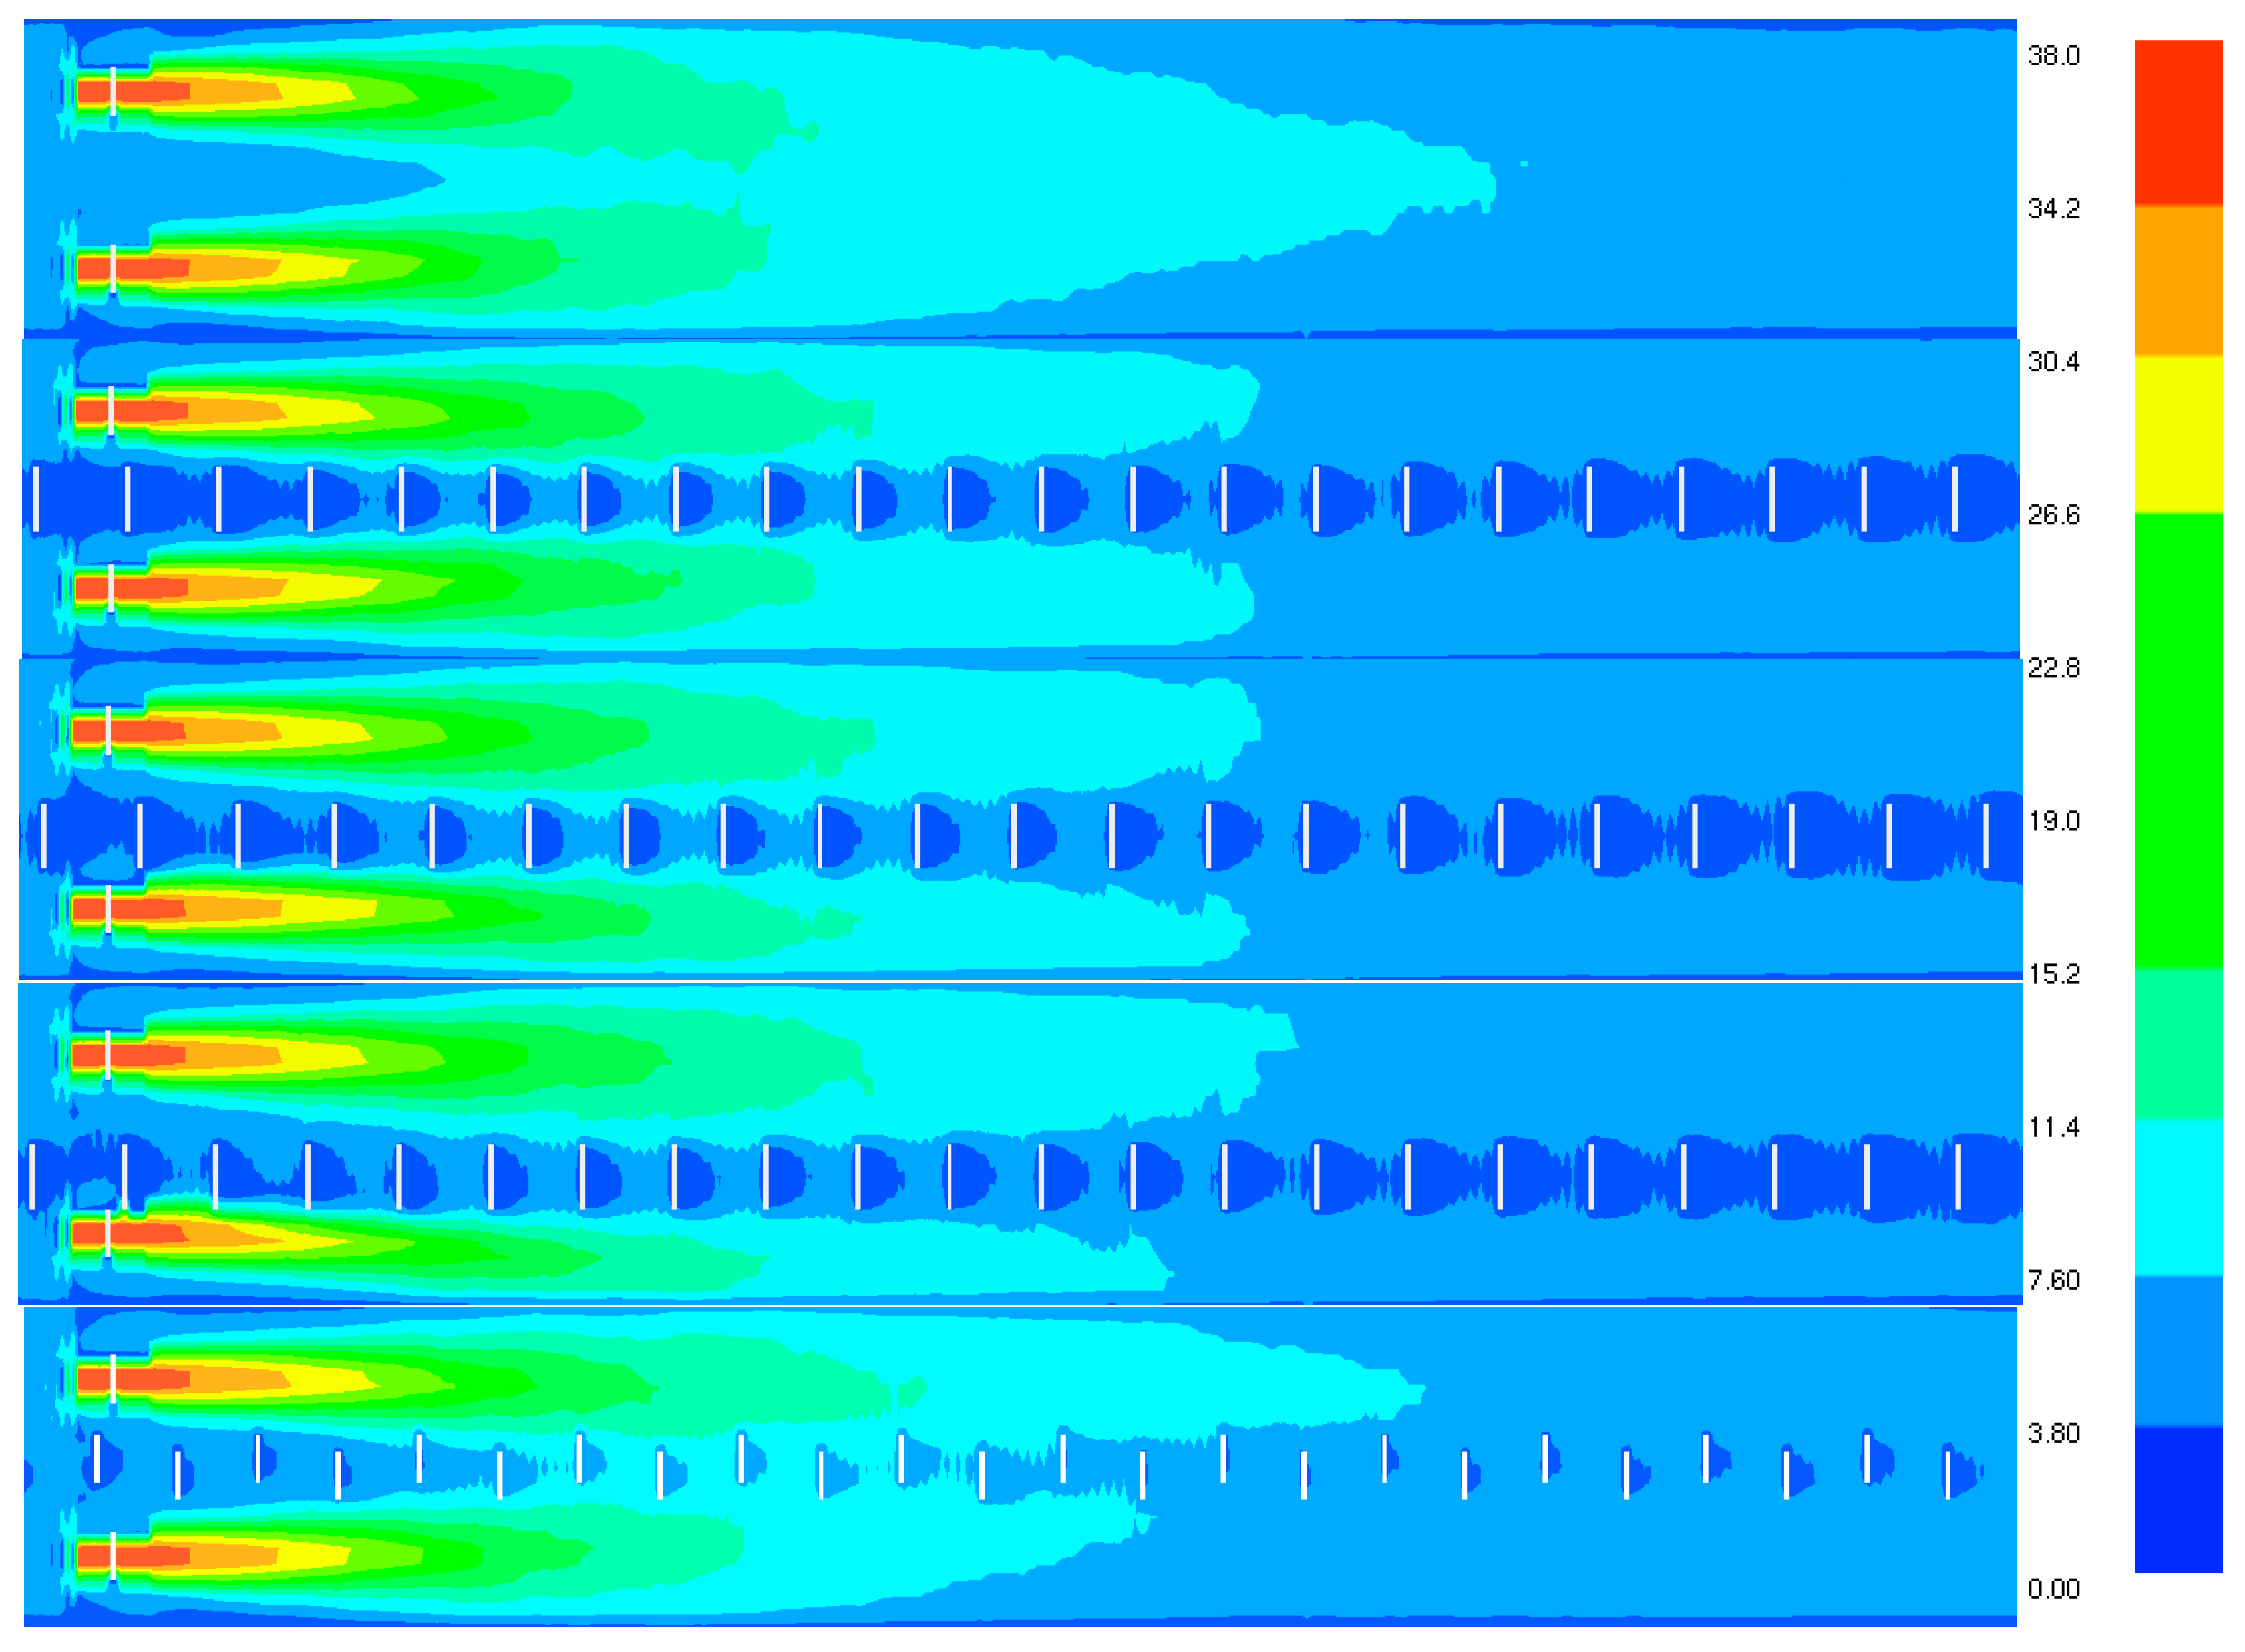
The distribution of longitudinal airflow velocity on a horizontal slice for Mode 3 and for the second pair of jet fans is shown in Figure 13. The velocity distribution of the first two models is symmetrical, while the velocity distribution of the other three models is asymmetrical, as intended based on their design, and the degree of their asymmetry gradually increases. The insufficient degree of asymmetry for model A2 could probably explain why this model does not achieve a sufficiently accurate description of the measured data, while Model C creates the most asymmetric distribution. The individual models also differ in whether the velocity field is compact (Model 0) or divided into two separate regions (Models S, A1, and A2). Model C represents a transition between the two possibilities. The differences in these distributions allow for an experimental investigation of which model represents the actual velocity distribution in the most accurate way. However, this would require a larger number of anemometers placed closer to the jet fans. In our case, the anemometers were placed at a distance where the flow is almost fully developed and the uniqueness of the distributions of individual models diminishes.
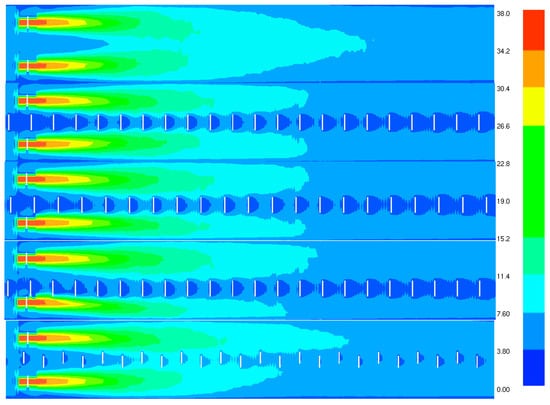
Figure 13.
The distribution of longitudinal airflow velocity on a horizontal slice [m·s−1] in Mode 3 simulated using Models 0, S, A1, A2, and C. The length of the tunnel section is 100 m.
3.4. Airflow Velocities Measured by Tunnel Anemometers
Table 12 shows a comparison of the velocity determined as the mean of velocities measured using the three anemometers AT1–3 installed in the tunnel and by the most accurate models S and C. The representation of tunnel anemometers described in [24] was used in the simulations. All relative deviations for Model C are below 2.1% which, again, confirms its accuracy as well as slight improvement against the original Model 0. More pronounced deviations in Model S (especially in Mode 2) indicate a higher degree of inaccuracy of purely cuboidal models in determining the velocity in the upper part of the tunnel cross-section. The use of smaller cuboids in Model C eliminates this shortcoming.
Table 12.
Experimental and simulated values of velocity measured using tunnel anemometers AT1–3 for three ventilation modes [m·s−1] and their relative deviations [%].
3.5. Simulation Performance
The presented simulations require significant computing resources and elapsed time. In order to reduce the elapsed time for the calculation, we performed two simulations on the Devana supercomputer. Devana consists of 148 compute nodes (9472 compute cores), 38 TB of RAM, and 32 GPU accelerators. The system’s theoretical peak performance is about 800 TFLOP/s. All nodes are interconnected through a fully non-blocking fat-tree InfiniBand HDR network and are equipped with Intel® Xeon® Ice Lake architecture processors [28].
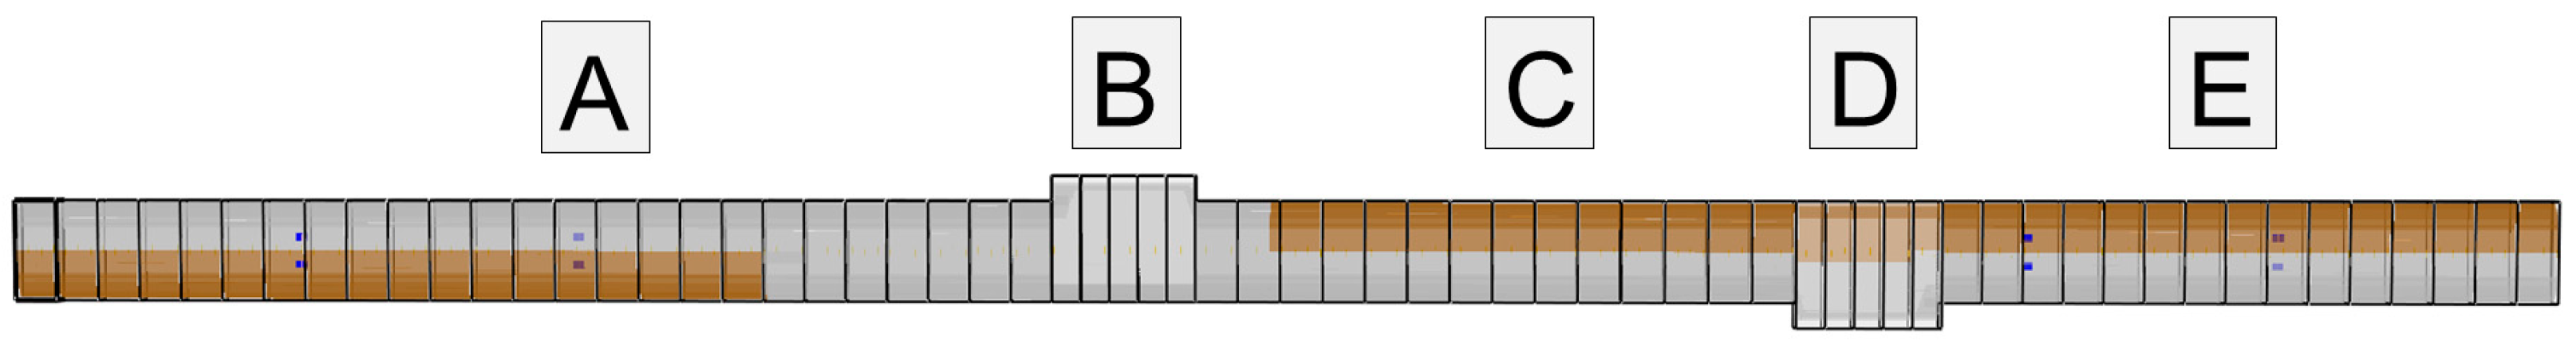
In the first simulation, the same decomposition of the computational domain into meshes as before was used. In the second simulation, the domain was divided into 64 meshes of different sizes chosen so that the number of cells in individual meshes varied as little as possible and, at the same time, the meshes encompassed the entire geometry of the tunnel with a minimal volume of space behind the tunnel walls. The latter domain decomposition approach is presented in Table 13 and Figure 14.
Table 13.
Decomposition of the computational domain into 64 meshes.
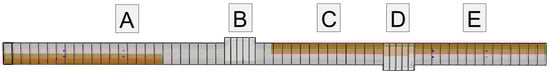
Figure 14.
Decomposition of the computational domain into 64 meshes.
The simulation results is shown in Table 14. Even for 64 meshes, the accuracy of the simulation was preserved, and the values of RMSD3 and RMSD15 were comparable to the original simulation. However, the performance of the simulation increased significantly, 13 times, so the calculation can be performed in 36 h. With the identical domain consisting of 12 meshes, the Devana cluster reached a performance three times higher than that achieved in the original simulation. Since the mesh number ratio for both Devana simulations is 64/12 = 5.33, the performance increase for the 64 mesh simulations equal to 4.38 indicates significant simulation efficiency for this domain decomposition approach.
Table 14.
Results of Model C simulations performed using different hardware platforms and computational domain decomposition.
4. Conclusions
This study investigates several FDS modelling approaches of airflows in the medium-length Polana highway tunnel (Slovakia) induced via longitudinal ventilation. It is assumed that the effect of tunnel geometry on the airflow is caused mainly by two classes of geometrical features of the tunnel: bearing constructions located under the tunnel ceiling and niches and installations on tunnel walls. Bearing constructions are modelled by a system of cuboids distributed at regular mutual distances along the tunnel. Three models with different cuboids displacement approaches are investigated. The fourth combined model includes cuboids as well as the increased roughness of the convex tunnel walls intended to model installations on the tunnel walls and their curvature. The models are intended for the purpose of fire simulations via FDS.
The simulation results are compared against on-site velocity measurements using a grid of five anemometers during a full-scale ventilation test in the Polana tunnel conducted in 2017, as well as with simulations based on the previous model, in which increased uniform roughness of the tunnel walls is considered. The best results are achieved for the model in which cuboids are placed exactly above the centreline of the tunnel and for the combined model with the increased roughness of convex tunnel walls.
Steady-state airflow velocities achieved during three ventilation modes simulated using the new model are in good accordance with the measured values and are comparable with the previous model. Relative deviations below 2% are lower than the experimental uncertainty of particular anemometers.
Mean absolute percentage deviations (MAPDs) of velocities at the locations of grid anemometers in the model with centrally placed cuboids are lower than 3% for the first two ventilation modes. All 10 values are within the experimental uncertainty of measurements. For the third ventilation mode, four of five simulated velocities fall outside the range of the measured values, as did all five values of the previous model. The models do not capture entirely the asymmetric velocity profile under the specific combination of circumstances occurring in this measurement. It points to the significant limitations imposed by the rectilinear computational mesh in FDS, which is not able to fully capture the effects given by the curvature of the tunnel walls. Nevertheless, the new model leads to a noticeable improvement, as the MAPD drops from 17 to 14%.
The MAPDs of the combined model are 3, 6, and 10% for the three ventilation modes. The increased roughness of the convex tunnel walls contributes to the significant increase in modelling accuracy of the third mode of ventilation, although two of five simulated velocities fall outside the range of the measured values. The model is able to capture to a certain extent the influence of the tunnel curvature and its interaction with the not-fully developed airflow.
This study demonstrates that the combination of cuboids located under the tunnel ceiling and the increased roughness of the tunnel’s convex walls allows the drag of the tunnel geometry to be modelled with considerable accuracy. Even within the limitations given by the rectangular geometry of the FDS, it is possible to improve the simulation of the velocity profile of the flow. Moreover, cuboids contribute to more accurate modelling of the tunnel interior. Taking into account the significant similarities of the individual tunnels and the similar distribution of objects under the tunnel ceiling, it is possible to expect that the presented approach will also be applicable to other tunnels with minor modifications. Further research will focus on the application of the approach in the modelling of steady-state velocities in curved tunnels and its validation for more accurate measurements of the velocity profile. This study indicates the potential of this approach to capture airflows and smoke movement in road tunnels during fire.
Author Contributions
Methodology, P.W. and J.G.; Validation, P.W. and L.V.; Formal analysis, P.W., J.G. and L.V.; Investigation, P.W.; Resources, J.G.; Data curation, P.W. and L.V.; Writing—original draft, P.W.; Writing—review & editing, P.W.; Visualization, P.W.; Supervision, P.W.; Project administration, J.G. All authors have read and agreed to the published version of the manuscript.
Funding
This work was supported by the Slovak Scientific Grant Agency VEGA under the contract 2/0096/24. Funded by the EU NextGenerationEU through the Recovery and Resilience Plan for Slovakia under the project No. 09I05-03-V02-00055. Research results were obtained using the computational resources procured in the national project National competence centre for high performance computing (project code: 311070AKF2) funded by the European Regional Development Fund, EU Structural Funds Informatization of society, Operational Program Integrated Infrastructure.
Institutional Review Board Statement
Not applicable.
Informed Consent Statement
Not applicable.
Data Availability Statement
The original contributions presented in this study are included in the article. Further inquiries can be directed to the corresponding author.
Acknowledgments
The author would like to thank Peter Schmidt for information about technical specifications of road tunnels.
Conflicts of Interest
The authors declare no conflict of interest.
References
- McGrattan, K.; Hostikka, S.; McDermott, R.; Floyd, J.; Weinschenk, C.; Overholt, K. Fire Dynamics Simulator, Technical Reference Guide, 6th ed.; NIST and VTT Technical Research Centre of Finland: Espoo, Finland, 2017. [Google Scholar]
- McGrattan, K.; Hostikka, S.; McDermott, R.; Floyd, J.; Weinschenk, C.; Overholt, K. Fire Dynamics Simulator, User’s Guide, 6th ed.; NIST and VTT Technical Research Centre of Finland: Espoo, Finland, 2017. [Google Scholar]
- Deckers, X.; Haga, S.; Tilley, N.; Merci, B. Smoke control in case of fire in a large car park: CFD simulations of full-scale configurations. Fire Saf. J. 2013, 57, 22–34. [Google Scholar] [CrossRef]
- Valasek, L.; Glasa, J. On Realization of Cinema Hall Fire Simulation Using Fire Dynamics Simulator. Comput. Inform. 2017, 36, 971–1000. [Google Scholar] [CrossRef]
- Kim, E.; Woycheese, J.P.; Dembsey, N.A. Fire dynamics simulator (Version 4.0) simulation for tunnel fire scenarios with forced, transient, longitudinal ventilation flows. Fire Technol. 2008, 44, 137–166. [Google Scholar] [CrossRef]
- Álvarez-Coedo, D.; Ayala, P.; Cantizano, A.; Węgrzyński, W. A coupled hybrid numerical study of tunnel longitudinal ventilation under fire conditions. Case Stud. Therm. Eng. 2022, 36, 102202. [Google Scholar] [CrossRef]
- Zisis, T.; Vasilopoulos, K.; Sarris, I. Numerical simulation of a fire accident in a longitudinally ventilated railway tunnel and tenability analysis. Appl. Sci. 2022, 12, 5667. [Google Scholar] [CrossRef]
- Weng, M.C.; Yu, L.X.; Liu, F.; Nielsen, P.V. Full-scale experiment and CFD simulation on smoke movement and smoke control in a metro tunnel with one opening portal. Tunn. Undergr. Space Technol. 2014, 42, 96–104. [Google Scholar] [CrossRef]
- Hsu, W.-S.; Huang, Y.-H.; Shen, T.-S.; Cheng, C.-Y.; Chen, T.-Y. Analysis of the Hsuehshan Tunnel Fire in Taiwan. Tunn. Undergr. Space Technol. 2017, 69, 108–115. [Google Scholar] [CrossRef]
- Du, T.; Li, P.; Wei, H.; Yang, D. On the backlayering length of the buoyant smoke in inclined tunnel fires under natural ventilation. Case Stud. Therm. Eng. 2022, 39, 102455. [Google Scholar] [CrossRef]
- Zhang, X.; Lin, Y.; Shi, C.; Zhang, J. Numerical simulation on the maximum temperature and smoke back-layering length in a tilted tunnel under natural ventilation. Tunn. Undergr. Space Technol. 2022, 107, 103661. [Google Scholar] [CrossRef]
- Ang, C.D.; Rein, G.; Peiro, J.; Harrison, R. Simulating longitudinal ventilation flows in long tunnels: Comparison of full CFD and multi-scale modelling approaches in FDS6. Tunn. Undergr. Space Technol. 2016, 52, 119–126. [Google Scholar] [CrossRef]
- Król, A.; Król, M.; Koper, P.; Wrona, P. Numerical modeling of air velocity distribution in a road tunnel with a longitudinal ventilation system. Tunn. Undergr. Space Technol. 2019, 91, 103003. [Google Scholar] [CrossRef]
- Brzezińska, D. Practical aspects of jet fan ventilation systems modelling in fire dynamics simulator code. Int. J. Vent. 2018, 17, 225–239. [Google Scholar] [CrossRef]
- Brzezinska, D.; Sompolinski, M. The accuracy of mapping the airstream of jet fan ventilators by fire dynamics simulator. Sci. Technol. Built Environ. 2017, 23, 736–747. [Google Scholar] [CrossRef]
- Król, A.; Król, M. some tips on numerical modeling of airflow and fires in road tunnels. Energies 2021, 14, 2366. [Google Scholar] [CrossRef]
- Król, A.; Król, M. Study on numerical modeling of jet fans. Tunn. Undergr. Space Technol. 2018, 73, 222–235. [Google Scholar] [CrossRef]
- Weisenpacher, P.; Valasek, L. Computer simulation of airflows generated by jet fans in real road tunnel by parallel version of FDS 6. Int. J. Vent. 2021, 20, 20–33. [Google Scholar] [CrossRef]
- Pope, S.B. Turbulent Flows; Cambridge University Press: Cambridge, UK, 2000. [Google Scholar]
- Weisenpacher, P. Modeling of road tunnel airflows by FDS using tunnel model with a system of geometrical objects. In Proceedings of the 35rd European Modeling and Simulation Symposium (EMSS 2023), Athens, Greece, 18–20 September 2023. [Google Scholar] [CrossRef]
- Pospisil, P.; Ockajak, R. Tunel Polana—DRS Vetranie Tunela a Unikovej Stolne; Technical Report; IP Engineering GmbH: Munchenstein, Switzerland, 2016. [Google Scholar]
- Danišovič, P.; Šrámek, J.; Hodoň, M.; Húdik, M. Testing measurements of airflow velocity in road tunnels. MATEC Web Conf. 2017, 117, 00035. [Google Scholar] [CrossRef]
- Pospisil, P.; Ockajak, R. Skusky Vetrania Tunela Polana a Svrcinovec; Technical Report; IP Engineering GmbH: Munchenstein, Switzerland, 2017. [Google Scholar]
- Glasa, J.; Valasek, L.; Weisenpacher, P.; Kubisova, T. Improvement of modeling velocity of airflow created by emergency ventilation in a road tunnel using FDS 6. Appl. Sci. 2023, 13, 2762. [Google Scholar] [CrossRef]
- Beyer, M.; Sturm, P.-J.; Sauerwein, M.; Bacher, M. Evaluation of Jet Fan Performance in Tunnels. In IVT Reports: Proceedings Tunnel Safety and Ventilation; Verlag der Technischen Universität Graz: Graz, Austria, 2016; Volume 100, p. 298. [Google Scholar]
- Chen, T.; Zhou, D.; Lu, Z.; Li, Y.; Xu, Z.; Wang, B.; Fan, C. Study of the applicability and optimal arrangement of alternative jet fans in curved road tunnel complexes. Tunn. Undergr. Space Technol. 2021, 108, 103721. [Google Scholar] [CrossRef]
- Wang, F.; Wang, M.; He, S.; Zhang, J.; Deng, Y. Computational study of effects of jet fans on the ventilation of a highway curved tunnel. Tunn. Undergr. Space Technol. 2010, 25, 382–390. [Google Scholar] [CrossRef]
- nscc.sk. Available online: https://userdocs.nscc.sk/devana/system_overview/ (accessed on 10 August 2024).


Disclaimer/Publisher’s Note: The statements, opinions and data contained in all publications are solely those of the individual author(s) and contributor(s) and not of MDPI and/or the editor(s). MDPI and/or the editor(s) disclaim responsibility for any injury to people or property resulting from any ideas, methods, instructions or products referred to in the content. |
© 2025 by the authors. Licensee MDPI, Basel, Switzerland. This article is an open access article distributed under the terms and conditions of the Creative Commons Attribution (CC BY) license (https://creativecommons.org/licenses/by/4.0/).