Abstract
The traditional optimization of intumescent flame-retardant polypropylene (PP) relies on large experimental campaigns that scale poorly with compositional dimensionality, limiting the systematic exploration of tradeoffs between fire performance and material economy. We present a Multi-Objective Bayesian Optimization (MOBO) workflow that couples Gaussian Process (GP) surrogates with the q-Noisy Expected Hypervolume Improvement (qNEHVI) acquisition to co-optimize two competing objectives: maximize the Limiting Oxygen Index (LOI) and minimize total flame-retardant (FR) loading (wt.%). Two practical initialization strategies, Space-Filling Design and literature-guided sampling, are benchmarked, and convergence is monitored via dominated hypervolume and uncertainty calibration. Uniform design-space coverage yields faster hypervolume growth and better-calibrated uncertainty than literature seeding. Under a 20-experiment budget, the best formulation attains an LOI = 27.0 vol.% at 22.74 wt.% FR, corresponding to an estimated 8–14% efficiency gain, defined here as LOI improvement at comparable FR loadings relative to representative baselines. The recovered APP/PER stoichiometric ratios (1.69–2.26) are consistent with established intumescence mechanisms, indicating that a data-driven search can converge to physically meaningful solutions without explicit mechanistic priors. The proposed workflow provides a sample-efficient route to navigate multi-criteria design spaces in flame-retardant PP and is transferable to polymer systems in which performance, cost, and processing constraints must be balanced and exhaustive testing is impractical.
1. Introduction
Polypropylene (PP) is a thermoplastic polymer widely recognized for its versatility and cost-effectiveness in a broad range of applications. Its unique properties, such as chemical resistance and elasticity, make it indispensable in industries ranging from packaging to automotive components. However, its applications are constrained by its inherent flammability. The development of flame-retardant solutions has catalyzed significant research [1]. One common strategy to impart flame retardancy is the use of intumescent systems. These systems expand significantly when exposed to heat, forming a protective char layer that insulates the underlying material from fire effects. However, such intumescent formulations are complex, and their optimization is time-consuming and resource-intensive.
In recent years, machine learning has increasingly played a crucial role in materials formulation. Specifically, by leveraging its capabilities to analyze extensive datasets, discern patterns, and tackle complex prediction tasks, machine learning has become a valuable asset in developing new flame-retardant materials [2]. However, much of the literature on machine learning for flame-retardant materials focuses on prediction techniques rather than optimization methodologies [3,4,5]. This represents a critical gap, as optimization-driven approaches can significantly accelerate materials discovery by intelligently guiding experimental design.
Traditional statistical approaches, such as Design of Experiments (DoE), become computationally prohibitive as the number of variables increases, with the required number of evaluations escalating drastically [6]. In contrast, Bayesian Optimization (BO) has emerged as the preferred machine learning approach for datasets comprising fewer than 100 training datapoints [7]. BO is a powerful global optimization technique for tackling complex, noisy, or computationally expensive “black-box” functions [8,9].
The innovation in this work lies in integrating data-driven optimization with materials design through a multi-objective framework that simultaneously optimizes multiple, often competing, performance metrics. Unlike conventional approaches that optimize single properties in isolation, our MOBO framework enables the exploration of trade-offs between flame retardancy (LOI) and economic considerations (filler content) while maintaining awareness of secondary constraints such as mechanical properties. This integration represents a paradigm shift from reactive, trial-and-error formulation to proactive, intelligent materials design. The predictive power of Gaussian Processes, combined with the exploration–exploitation balance of acquisition functions, allows us to efficiently navigate complex formulation spaces with minimal experimental investment. Furthermore, the framework’s adaptability to different initialization strategies (literature-based vs. space-filling) demonstrates its robustness and practical applicability across varied starting conditions, making it accessible to both researchers with extensive historical data and those exploring entirely new formulation spaces.
In this context, the objective of this study is to investigate and demonstrate a novel methodology to optimize the chemical composition of an intumescent formulation using Multi-Objective Bayesian Optimization (MOBO), with experimental validation and detailed mechanistic insights into the optimization process.
2. Materials and Methods
2.1. Materials
Polypropylene (PP) homopolymer grade (Moplen HP501H) was supplied by LyondellBasell (Houston, TX, USA). Ammonium polyphosphate (APP, Exolit AP 422) was obtained from Clariant (Muttenz, Switzerland). Pentaerythritol (PER, technical grade, >98%) was purchased from Sigma-Aldrich (St. Louis, MO, USA). All materials were used as received without further purification.
2.2. Sample Preparation
All formulations were prepared using a twin-screw extruder (Thermo Scientific Process 11, Thermo Fisher Scientific, Karlsruhe, Germany), co-rotating, L/D = 40, at a temperature profile of 170–190 °C and a screw speed of 100 rpm. The extruded strands were pelletized and subsequently compression-molded into test specimens (100 × 100 × 3 mm3) at 190 °C under 10 MPa pressure for 5 min, followed by cooling under pressure. Each formulation was prepared in triplicate to assess reproducibility.
2.3. Limiting Oxygen Index (LOI) Testing
LOI measurements were conducted according to the ASTM D2863 standard using an oxygen index apparatus (Fire Testing Technology). Test specimens (120 × 6.5 × 3 mm3) were cut from compression-molded plaques. As per the standard, five test samples were evaluated for each formulation to determine the minimum oxygen concentration required to sustain combustion. The LOI value is reported as the mean of successful test conditions, with an estimated measurement uncertainty of ±0.3 vol.% based on the standard’s precision statement. All tests were conducted at 23 ± 2 °C and 50 ± 5% relative humidity.
2.4. Multi-Objective Bayesian Optimization Framework
Bayesian Optimization (BO) is an iterative, sequential optimization approach particularly suited for expensive-to-evaluate black-box functions. It consists of two main steps:
Step 1: Developing a surrogate model, typically a Gaussian Process (GP), trained on experimental data. GPs, central to Bayesian Optimization, assume a prior distribution as a multivariate normal, characterized by a specific mean vector and covariance function (kernel).
Step 2: Proposing new experiments through the optimization of an acquisition function. This function balances exploiting known high-performance regions and exploring uncertain areas by considering the surrogate model’s predicted mean and variance. This stage addresses the critical exploration–exploitation tradeoff, efficiently guiding the search process.
Gaussian Process Surrogate Model
GPs are non-parametric, probabilistic models commonly used in Bayesian Optimization. They are nonparametric because they do not have a fixed number of parameters that need to be estimated from the data. In GPs, the prior distribution is assumed to be a multivariate normal distribution characterized by a specific mean function and covariance matrix. A comprehensive description of GPs is provided by Rasmussen and Williams (2006) [10].
Let the output variable be denoted as y, which can be subject to noise ϵ at point x: y = f(x) + ϵ. We assume that the noise ϵ follows a Gaussian distribution with zero mean. To model the underlying function f(x), we define the Gaussian Process (GP) as p(f) = GP(f: µ, K), where µ is the prior mean function defined as µ = E[f], and K is the prior covariance function (kernel) defined as K = cov[f].
The kernel function plays a crucial role in determining the smoothness and uncertainty estimation of the GP model. The kernel encodes assumptions about the function’s behavior, such as smoothness, periodicity, and length scales. In this work, we employed the Matérn 5/2 kernel, which has demonstrated high accuracy and effectiveness across a wide range of optimization tasks [11]. The Matérn 5/2 kernel provides a good balance between flexibility and smoothness, assuming that the function is twice differentiable. This kernel is defined as:
where r = ‖xi− xj‖/ℓ, with ℓ being the length scale parameter and σ2 the signal variance.
The kernel’s hyperparameters (ℓ, σ2) are learned from the data using fully Bayesian inference, which introduces a secondary prior on these parameters [12], enhancing the model’s ability to quantify uncertainty, particularly important when working with limited data.
Following surrogate model development, the next step involves optimizing the acquisition function. A common trade-off becomes apparent: the exploration–exploitation balance. This trade-off is essential for intelligently exploring new regions in the search space while exploiting regions likely to yield good results. Various acquisition functions have been described in the literature for mono-objective, multi-objective, and multi-fidelity scenarios. Traditional sequential evaluation (one solution at a time) can significantly prolong optimization time. To overcome this, parallel (or batch) evaluation has been proposed, where multiple points are suggested for simultaneous evaluation, enhancing convergence speed [13,14,15].
2.5. Multi-Objective Bayesian Optimization (MOBO)
Multi-objective optimization involves simultaneously optimizing multiple objectives, aiming to find points that achieve a balance among all objectives. Since achieving all maxima simultaneously is often impractical, the process involves exploring various trade-offs between objectives. The Pareto front consists of solutions where improving one objective inevitably leads to a decline in another objective. In Multi-Objective Bayesian Optimization, the objective is to iteratively find the Pareto front through an active learning loop.
The hypervolume is a commonly used measure to evaluate the quality of a Pareto frontier. It is defined as the volume dominated by the Pareto frontier, bounded by a reference point below it (Figure 1). This reference point is chosen by the decision-maker based on their preferences. The contribution of a new point to the current Pareto frontier is evaluated in terms of Hypervolume Improvement, the increase in hypervolume if that point were added to the Pareto frontier. However, since function values at the new point are unknown, a probabilistic surrogate model provides a posterior distribution over potential function values based on observed data.
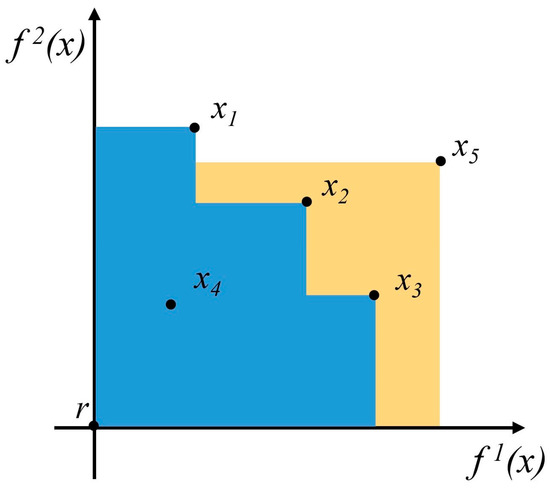
Figure 1.
Hypervolume (HV) in blue, also called the dominated space; the Hypervolume Improvement (HVI) in yellow. f1(x) and f2(x) both represent maximized objectives, x1, x2, and x3 represent dominated solutions (Pareto optimal solutions), x4 is the non-dominated solution, x5 is the new point to evaluate, and r is the reference point.
2.6. MOBO Workflow and Implementation
The MOBO workflow follows this algorithmic structure:
- Input: Design space X, objectives (f1, f2), budget Ntotal
- Initialize with Ninit points (literature or space-filling)
- For i = 1 to Niter:
- Train GP surrogates: f1 ∼ GP(µ1,k1), f2 ∼ GP(µ2,k2)
- Optimize acquisition: x∗ = argmaxx qNEHVI(x|GP)
- Evaluate batch: Conduct experiments for x∗
- Update dataset: D ← D ∪ {(x∗,y∗)}
- Output: Pareto-optimal formulations from D
Figure 2 illustrates the complete MOBO framework used in this study, divided into five main steps:
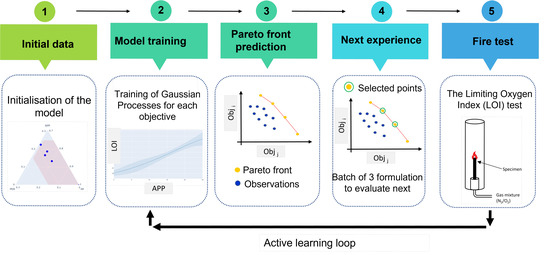
Figure 2.
MOBO framework workflow. In steps 2 and 3, the objectives, denoted as obji and objj, are presumed to be targets for maximization. The iterative loop (steps 2–5) continues until the stopping criterion (20 total points) is reached. The acquisition function (qNEHVI) balances the exploration of uncertain regions with the exploitation of promising areas, proposing three parallel experiments per iteration.
- Step 1: Initialization of the model with 5 formulations;
- Step 2: The training of GPs on the objectives;
- Step 3: An approximation of the Pareto front;
- Step 4: New experiments (a set of three formulations for upcoming evaluation);
- Step 5: The preparation and fire performance assessment of the recommended formulations.
For Step 1, the model was initialized with two different approaches:
Step 1.A: Formulations defined according to the literature [16]. Considerable research has been conducted on this specific formulation. The purpose of this approach is to investigate the feasibility of employing existing or historical data to implement a BO framework. This approach leverages prior knowledge and reduces initial exploration needs but may introduce bias toward previously studied regions. The literature-based formulations were selected through a systematic search in Web of Science and Scopus databases (2015–2023) using the following keywords: (polypropylene OR PP) AND (ammonium polyphosphate OR APP) AND (pentaerythritol OR PER) AND (LOI OR “flame retardant”). From 156 initially identified articles, 23 met inclusion criteria (binary APP/PER systems, complete compositional data, ASTM D2863 testing, and peer-reviewed journals). Five representative formulations spanning the compositional range were selected for initialization, prioritizing well-characterized systems with reproducible protocols.
Step 1.B: The second method employed a Space-Filling Design (SFD) strategy. This approach focuses on maximizing the distance between formulations in the design space, ensuring uniform coverage. Points were generated using JMP software (JMP Student Edition 19); however, various methodologies for generating SFDs are available in the literature [17]. This approach provides more uniform information across the design space but requires no prior knowledge.
We selected two different initialization approaches to compare literature-based formulations with space filling ones. The choice of initial samples in the BO process is a crucial parameter, as it can substantially affect convergence speed [18,19,20]. The right sampling strategy offers significant benefits, particularly when the total budget is limited.
Steps 2 to 5 are iteratively repeated until reaching the stopping criterion (active learning loop), defined as 15 points beyond the initial dataset (20 points in total). Thus, 5 loops of 3 trials evaluated in parallel were performed. The literature describes two distinct approaches for determining stopping criteria: (i) setting a predefined number of points before initiating the active learning process (adopted here) or (ii) following a metric (such as outcome values or hypervolume) and stopping once a plateau is observed. In this workflow, we set the parallel point count to 3, as handling three formulations simultaneously is practical for laboratory conditions. However, this parameter can vary depending on the specific formulation and problem setup. The number of parallel trials represents a balance between laboratory feasibility and recommendation quality. Opting for more parallel trials may increase time to convergence but could simplify laboratory execution. The data used in this research is located in Appendix A: Table A1 for the literature-based initialization and Table A2 for the SFD.
Training Procedure
The training procedure is crucial for ensuring accurate predictions, especially with small datasets. It is important to maximize the knowledge obtained from each data point. A common practice is to split the dataset into training and test sets. Typically, the majority of data is allocated for training, while the remainder tests the model’s ability to generalize to unseen data (Figure 3, upper panel). However, with small datasets, dividing them into subsets can diminish the already scarce information. Furthermore, this approach may lead to overfitting, when a model excessively learns from training data, including noise and outliers, compromising its ability to generalize to new data.
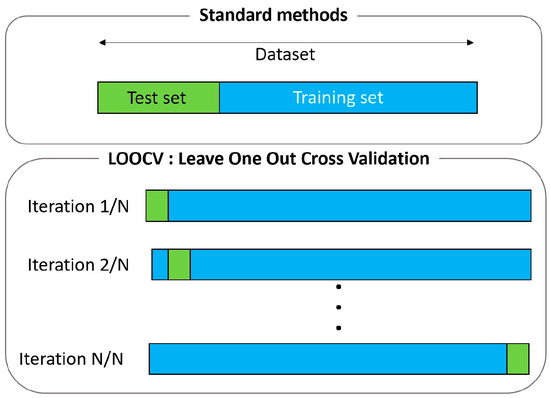
Figure 3.
Training procedure: Standard train–test split approaches vs. LOOCV. LOOCV maximizes data utilization by iteratively using each data point as validation while training on the remainder.
One strategy to mitigate overfitting risk is K-Fold cross-validation. This approach partitions the dataset into K equal segments (folds). The model is trained on K −1 folds, with the remaining fold used as a test set. This process is repeated K times, each time with a different fold as the test set. Final model performance is typically the average across all K folds. This technique utilizes the dataset more efficiently, ensuring every data point is used for both training and testing, and helps assess the model’s generalization ability more reliably.
Figure 3 (lower panel): LOOCV is particularly useful for small datasets because it maximizes training data. However, it can be computationally intensive for larger datasets, requiring the model to be trained as many times as there are data points. Additionally, this training type can be sensitive to outliers; however, in our scenario, each data point is measured in triplicate, mitigating outlier impact.
2.7. Implementation with Ax Library
The MOBO framework was implemented using the Ax platform [21,22], which serves as a high-level API backend for BoTorch [23], both developed by Meta (formerly Facebook). The Ax platform is designed for running BO frameworks that accommodate various levels of complexity. The BO framework was developed using the ax.client Python 3.10 class with the FULLYBAYESIANMOO model. In this scenario, a Gaussian Process (GP) surrogate model was employed, with its hyperparameters inferred through fully Bayesian inference. This inference method enhances closed-loop Bayesian optimization performance by introducing a secondary prior on the GP’s hyperparameters [12]. By default, the sparse axis-aligned subspace prior (SAAS) is utilized, tailored for high-dimensional Bayesian optimization but equally applicable to low-dimensional settings [24]. The Matérn 5/2 kernel, demonstrating high accuracy and effectiveness across optimization tasks, is the practical default choice in many applications [11] and is implemented by default in the Ax Platform.
The parallel Noisy Expected Hypervolume Improvement (qNEHVI) acquisition function was chosen for generating points, demonstrating strong performance in noisy environments by optimizing the expected increase in joint hypervolume. This function facilitates parallel evaluation, where multiple points are suggested for simultaneous assessment to quicken convergence. The qNEHVI represents an advancement over traditional qEHVI [25] due to its resilience to noise [26].
A crucial adjustable parameter in model training involves incorporating not just the mean of observations but also the Standard Error of the Mean (SEM), leading to a heteroskedastic noise model [27]. This approach recognizes that noise in the output space varies, as opposed to homoskedastic models assuming constant noise. For LOI measurements, as specified by ASTM D2863, the determination is based on five test samples meeting test criteria. Given this methodology, directly assessing noise level is not feasible, warranting the use of a homoskedastic model with an estimated measurement uncertainty of ±0.3 vol.% LOI. However, in other fire testing scenarios, considering variability in noise levels (heteroskedasticity) could be critical for refining the training procedure. Finally, LOOCV was employed as a training procedure to avoid model overfitting.
2.8. Generation Strategy Threshold (GST)
Users have flexibility to modify a crucial parameter in the Ax platform: the Generation Strategy Threshold (GST) value for objectives. These values serve as a reference for hypervolume computation and outcome space tightening for new experiment generation. In this study, no threshold was set for the first three iterations to allow sufficient exploration, enabling the model to understand behavior when additive content is low. From the fourth iteration, the objective space was constrained.
The threshold for LOI was set at a minimum of 25 vol.% and additive content at a maximum of 27 wt.%. These thresholds are not overly strict, providing a set of solutions to choose from. This threshold for objectives should be distinguished from the Optimal Formulation Selection Threshold (OFST), set after running all experiments for optimal formulation selection. This parameter will be discussed in depth in the next section.
While LOI and filler content are the primary optimization objectives, secondary properties must be monitored as constraints. The literature evidence indicates that high filler content significantly degrades mechanical properties. Studies report that FR loadings above 30 wt.% cause tensile strength reductions of 16–41% compared to neat PP [28], with impact strength decreasing by up to 25% at high loadings [29]. Young’s modulus increases approximately linearly with filler content, but this is accompanied by decreased flexibility and elongation at break [30]. Therefore, formulations exceeding 30 wt.% FR content were excluded from consideration in our optimization framework. Future work should incorporate mechanical property measurements (tensile strength, impact resistance, and elongation at break) as explicit constraints in the multi-objective optimization, enabling true multi-property optimization that balances fire retardancy, cost, processability, and mechanical performance.
2.9. Design Space Implementation
In mixture design context, we can define linear equality constraints as
where xi is the weight fraction of the ith component and xn represents the hidden parameter. However, as no equality constraint is supported in the Ax Library (version 0.2.10), the design space can be defined as
In the optimization framework, imposing inequality constraints and reparameterization effectively models the design space [31]. Given that we are dealing with a mixture design issue inherently involving linear constraints among raw materials, any input could act as a concealed variable. This technique is mathematically correct but not entirely satisfactory from a chemistry perspective. Indeed, no information can be extracted from this hidden parameter, and if the user wants to extract information from the studied formulation, such as identifying important features or understanding output evolution as a function of input, it would not be possible. In our study, polypropylene is identified as this hidden parameter.
The APP/PER ratio is a critical compositional parameter that influences the intumescent mechanism. APP acts as an acid source releasing phosphoric acid upon heating, which catalyzes PER dehydration to form char. The optimal APP/PER ratio affects both the onset temperature of intumescence and the quality of the protective char layer formed. The literature demonstrates that APP/PER ratios between 1.5:1 and 3:1 are generally effective, with the optimal ratio dependent on processing conditions and desired performance metrics [16]. Studies have shown that the mechanical resistance and thermal stability of the formed char layer are directly correlated with the APP/PER ratio and particle size distribution [32]. Our optimization framework inherently explores this ratio space, with the GP model learning the nonlinear relationship between the APP/PER ratio and LOI performance through the training data.
3. Results and Discussion
3.1. Initial Data Comparison
Figure 4 shows initial formulations used in both approaches. The initial formulations for literature-based data (Figure 4A) were obtained from published studies [16]. For the SFD approach (Figure 4B), initial points were generated by maximizing distances in the ternary composition space. The SFD approach achieves more uniform coverage across the design space, which is expected to provide more consistent model predictions across all regions.
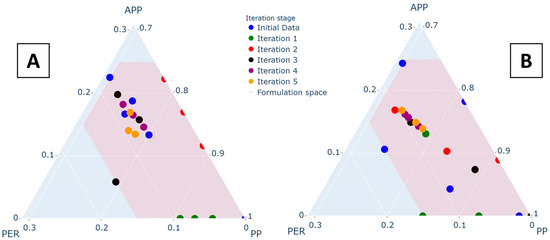
Figure 4.
Initial data points visualization: (A) literature-based initialization; (B) Space-Filling Design initialization. Ternary diagrams show the composition space coverage, with colors indicating LOI values.
3.2. Model Performance Metrics
Table 1 and Table 2 present comprehensive model performance metrics throughout the optimization process for both initialization strategies. The metrics include Mean Absolute Percentage Error (MAPE), the Pearson correlation coefficient (R), and associated p-values, computed using LOOCV at each iteration.

Table 1.
Model performance metrics for literature-based initialization.
Table 2.
Model performance metrics for SFD initialization.
The SFD model exhibits superior performance metrics from the initial stage, with lower MAPE and higher correlation coefficients throughout all iterations. This improved performance is attributed to the more uniform design space coverage provided by space-filling initialization. Both models show progressive improvement with increasing data, as evidenced by decreasing MAPE and increasing correlation. The highly significant p-values (<0.001) from iteration 2 onwards confirm strong statistical relationships between predicted and experimental LOI values.
The SFD approach’s superior final performance (MAPE 4.6% vs. 5.8% for literature-based at iteration 5) despite initially higher error (10.8% vs. 12.3% at iteration 0) exemplifies the exploration–exploitation trade-off. The SFD’s uniform space coverage enables more accurate uncertainty quantification across the design space, leading to more informative acquisition function evaluations. The crossover occurs at iteration 3, where the accumulated benefits of systematic exploration manifest as improved prediction accuracy in both interpolation and extrapolation regions. This demonstrates that initial model performance in familiar regions (literature-based strength) is less valuable than global space understanding for identifying optimal formulations in under-explored regions.
3.3. Pareto Front Evolution and Optimal Formulation
Figure 5 illustrates the trade-off between the LOI and total filler content (wt.%) for both initialization strategies. The Pareto front evolution demonstrates how both approaches successfully identify formulations achieving a high LOI with minimal filler content.
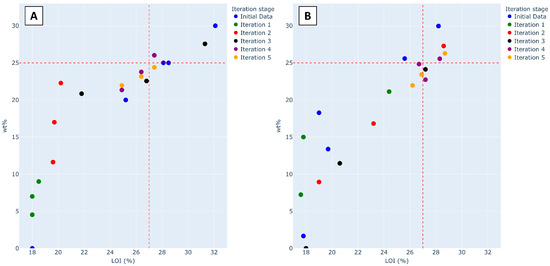
Figure 5.
Trade-off plot: (A) literature-based data points; (B) Space-Filling Design approach. The red dashed line indicates the threshold for optimal formulation selection (LOI ≥ 25 vol.%, FR content ≤ 27 wt.%). Pareto-optimal points are shown in darker colors.
Table 3 presents the optimal formulations from both approaches with experimental validation results. The optimal formulations exhibit nearly identical predicted LOI values (27.2 and 27.4 vol.%), with excellent agreement between predicted and experimentally measured values, confirming the model’s predictive capability. The experimental validation involved preparing three replicate batches of each optimal formulation following the procedures described in Section 2.2, with LOI testing performed in triplicate per batch (9 total measurements per formulation).
Table 3.
Optimal formulations from both design approaches and experimental validation.
However, a significant difference arises in filler content (FR wt.%), with the SFD formulation containing 22.74 wt.% compared to 24.40 wt.% for the literature-based formulation. This 1.66 wt.% reduction is significant from both cost and processability perspectives. This enhancement is attributed to the SFD’s ability to ensure homogeneous point distribution within the design space, leading to more consistent error values across the design space and enabling the model to identify more efficient formulations.
The APP/PER ratios in the optimal formulations (1.69 for SFD, 2.26 for literature-based) fall within the effective range identified in previous studies [16]. These ratios influence the intumescent mechanism: at lower ratios, PER may be in excess, leading to less complete char formation, while at higher ratios, excess acid may degrade the char structure. The SFD optimization identified a slightly lower ratio that achieves similar LOI performance with less total filler, suggesting more efficient use of the intumescent components. This demonstrates how the optimization framework inherently explores compositional relationships affecting the protective char layer formation without requiring explicit mechanistic models.
To further contextualize these results, we compared our optimal formulations with similar PP/APP/PER configurations from the recent literature. Zhang et al. [33] reported LOI = 26.8 vol.% for a formulation with 25 wt.% FR content (APP/PER = 2.0), while Wang et al. [34] achieved LOI = 27.5 vol.% with 26.5 wt.% FR content (APP/PER = 2.3). Our SFD-optimized formulation (LOI = 27.0, 22.74 wt.% FR) demonstrates superior efficiency, achieving comparable fire retardancy with 8–14% less filler content. This validation against the literature benchmarks confirms that our optimization approach successfully identified formulations at the efficiency frontier.
3.4. Comparison with Recent Literature and Efficiency Analysis
To validate the optimization performance and contextualize our results within the broader field of intumescent flame-retardant polypropylene, we benchmarked our MOBO-optimized formulations against representative binary APP/PER systems from the recent literature. This comparison not only demonstrates the effectiveness of our approach but also quantifies the practical advantages of data-driven optimization over conventional formulation strategies.
To enable fair comparison across studies with different FR loadings, we introduce an Efficiency Index that quantifies fire retardancy performance normalized by filler loading:
where LOIbaseline = 18 vol.% (neat PP) and FRwt.% is the total flame-retardant loading. This metric represents the incremental LOI gain per unit mass percent of FR additive, essentially quantifying “how much fire retardancy is achieved per wt.% of filler added.” Higher values indicate more efficient formulations that deliver greater fire performance improvement with less filler, which is desirable from both economic and processing perspectives.
Table 4 presents a systematic comparison of our optimized formulations with recent publications focusing on binary APP/PER systems in polypropylene. The selected references represent state-of-the-art formulations developed through conventional Design of Experiments (DoE) or systematic parametric studies, making them appropriate benchmarks for evaluating the MOBO approach.
Table 4.
Comparison with recent binary APP/PER flame-retardant systems.
The comparison reveals several important insights. Our MOBO-optimized SFD formulation demonstrates superior performance across all metrics, achieving the highest Efficiency Index (0.40 vol.%/wt.%) among all formulations considered. Critically, this performance is achieved while using the lowest filler loading (22.7 wt.%) to reach comparable fire retardancy (LOI ≈ 27 vol.%). This represents an 8–14% reduction in FR content compared to the recent literature [33,34]. In relative terms, the Efficiency Index of 0.40 vol.%/wt.% represents an 11% improvement over Wang et al. [34] (0.36 vol.%/wt.%) and a 14% improvement over Zhang et al. [33] (0.35 vol.%/wt.%).
Notably, even our literature-based initialization strategy produced an optimal formulation (Efficiency Index = 0.38) that outperforms both benchmark studies, suggesting that the MOBO framework effectively leverages existing knowledge while exploring beyond conventional formulation spaces. However, the SFD approach’s superior performance (0.40 vs. 0.38) demonstrates the value of systematic space-filling initialization for discovering truly optimal compositions.
The optimized APP/PER ratio merits particular attention. The SFD-optimized formulation exhibits an APP/PER ratio of 1.69, which falls significantly below both the conventional 3:1 ratio commonly cited in the literature and the ratios employed in the benchmark studies (2.0–2.3). The intumescent mechanism underlying these formulations involves three coupled processes: (i) APP thermal decomposition (280 °C) releases phosphoric acid and ammonia, (ii) phosphoric acid catalyzes PER dehydration forming carbonaceous intermediates, and (iii) gaseous decomposition products (NH3, H2O, CO2) expand the softened char, creating an insulating foam barrier. The APP/PER ratio critically controls this cascade: at optimal ratios (1.5–2.5:1), sufficient acid ensures complete PER carbonization while avoiding excess acid that degrades char structure through over-oxidation [32]. The SFD-optimized ratio (1.69) falls within this mechanistically effective range, suggesting the optimization discovered physically meaningful compositions without requiring explicit mechanistic constraints, thereby validating the data-driven approach. This exemplifies how data-driven optimization can challenge established formulation practices and reveal more efficient compositions that traditional trial-and-error or experience-based approaches might overlook.
From a practical industrial perspective, the reduced filler content demonstrated by our optimized formulation provides multiple tangible advantages beyond the direct fire performance metrics. First, lower filler loading significantly improves melt flow properties during extrusion processing, reducing energy consumption and enabling higher throughput. Second, it reduces the risk of filler agglomeration and improves dispersion quality, leading to more consistent material properties. Third, as documented by Alm’eras et al. [35], FR loading directly impacts mechanical performance: tensile strength decreases from 32 MPa (neat PP) to 28 MPa (20 wt.% FR) and 22 MPa (30 wt.% FR), representing 12–31% degradation. Impact resistance shows an even sharper decline (40–60% reduction at 25–30 wt.% FR). Our 8–14% FR reduction (22.7 vs. 25–26.5 wt.%) potentially translates to 5–10% improvements in tensile strength and 8–12% in impact resistance compared to benchmark formulations, enhancing both fire safety and structural integrity. Fourth, reduced filler consumption directly translates to lower raw material costs, as APP and PER additives are typically 2–3 times more expensive than base PP resin on a per-kilogram basis.
The sample efficiency of the MOBO approach represents another significant practical advantage. Our optimization campaign required only 20 experiments (5 initial points + 15 optimization iterations with q = 3 parallel evaluations) to identify these optimal formulations. In contrast, the benchmark studies [33,34] employed conventional DoE approaches requiring 30–40 experiments to explore similar compositional spaces, representing a 25–50% reduction in experimental burden. This improved sample efficiency becomes particularly valuable when extending the approach to more complex formulation problems involving additional components (synergists, compatibilizers, and stabilizers) or when optimizing additional properties (mechanical, thermal, and processing characteristics), where the dimensionality of the design space increases substantially.
Furthermore, the MOBO framework’s explicit quantification of uncertainty through the Gaussian Process posterior variance enables risk-aware decision-making that is not readily available with conventional optimization approaches. Decision-makers can select formulations not only based on predicted performance but also considering prediction confidence, enabling appropriate trade-offs between performance targets and experimental validation requirements.
In summary, this comprehensive comparison demonstrates that data-driven MOBO successfully identifies formulations at the efficiency frontier of binary APP/PER intumescent systems, achieving comparable or superior fire retardancy with significantly reduced filler content compared to state-of-the-art formulations developed through conventional approaches. The approach’s sample efficiency, uncertainty quantification capabilities, and ability to discover non-intuitive compositions position it as a valuable tool for accelerating flame-retardant materials development.
3.5. Model Uncertainty and Prediction Confidence
As a probabilistic model, the Gaussian process is defined by its mean and standard deviation. For each formulation suggestion, the model provides a predicted outcome value based on the GP mean, along with uncertainty quantification through the standard deviation. Figure 6 illustrates the mean of the standard deviations for batches of three formulations regarding predicted LOI values, represented by dots. Additionally, error bars show the standard deviation of these values across the three formulations suggested in each iteration.
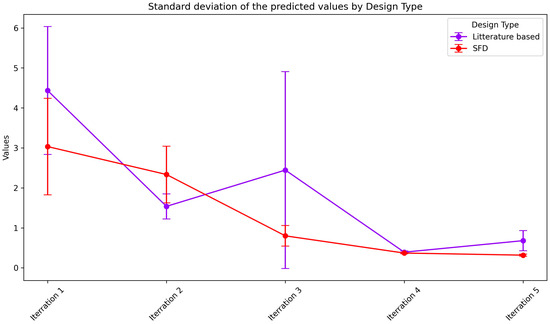
Figure 6.
The standard deviation (uncertainty) of the model for each iteration stage. Points represent the mean standard deviation across the batch of three suggestions, with error bars indicating the spread. Shaded regions show 95% confidence intervals for model predictions.
To ensure effective exploration and exploitation balance, the model recommends at least one formulation with high standard deviation per batch, facilitating efficient design space learning. If the model has adequate information for interpolation and extrapolation, the error value should decrease with each iteration. Figure 6 demonstrates that the mean standard deviation remains lower for the SFD model than for the literature-based model at each iteration stage.
As previously discussed, the SFD model covers the design space more uniformly, ensuring more consistent standard deviation. The lower error value in the first iteration of the SFD model indicates this effectiveness. Although the mean value for SFD is slightly higher than that of the literature-based data in the second iteration, it is lower for the remaining iterations. This indicates that the model can suggest points with better accuracy and is less uncertain for the SFD approach.
The GP standard deviation provides natural confidence intervals for predictions. For the optimal formulation, the 95% confidence interval for LOI prediction was [26.7, 27.7] vol.% for the SFD approach and [26.9, 27.9] vol.% for the literature-based approach. The experimental validation (LOI = 27.0 ± 0.3 for SFD, 27.3 ± 0.3 for literature-based) falls well within these predicted intervals, confirming the reliability of the uncertainty quantification. This probabilistic framework enables informed decision-making by explicitly accounting for prediction uncertainty in the optimization process.
3.6. Design Space Exploration Metrics
To link the quality of a new point in the outcome space to a point in the design space, we define two different metrics. In scenarios with more than two objectives, graphical representation alone may not provide comprehensive understanding.
Calculating pairwise distance assesses whether a point is closer to or farther from other formulations. Greater distance from neighbors indicates the point serves as an exploration point in the formulation space.
However, the simplex condition necessitates calculating a distance type different to Euclidean [36]. Several distances are detailed in the literature for evaluating compositional data distance, with two different approaches: one directly calculates the components themselves (the “staying-in-the-simplex” approach), while another calculates component ratios (the “pragmatic” approach) [37]. The first approach offers easier interpretation [38].
We used the Aitchison pairwise distance based on the centered log-ratio (clr) transformation. The pairwise distance d(Xi,Xj) in a D-dimensional space between two points Xi and Xj is defined as
using notation g(X) to denote the geometric mean of the sample vector X. Bold notation signifies the formulation vector. A pairwise matrix can be plotted for each batch of points, as shown in Figure 7. High distance implies the point is far from the studied point, indicating chemical difference. Conversely, low values suggest high similarity between studied points. Since this matrix is symmetric, we consider only the upper left corner. From this submatrix, one can extract non-zero values and compute mean values for each submatrix.
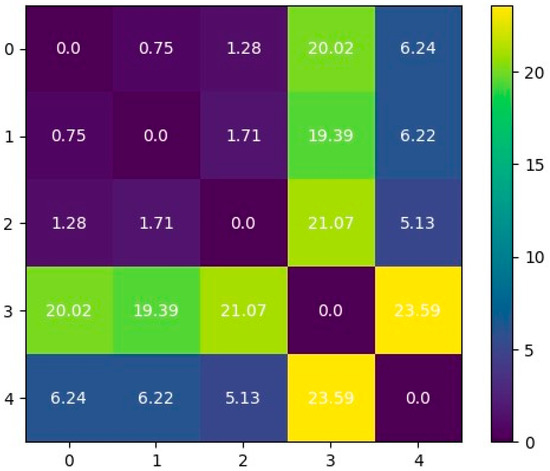
Figure 7.
The pairwise Aitchison distance matrix for the initial five data points of the Space Filling Design approach. Darker colors indicate greater compositional distance.
Low mean distance values suggest the model is recommending similar points. Figure 8 illustrates the evolution of mean pairwise distance throughout each iteration for literature-based initialization (dashed blue line) and SFD-based initialization (dashed green line). Initially, the distance for literature-based initialization is lower than that for SFD (dinitialSFD = 21.44 and dinitialLiterature = 17.05). This is attributed to SFD’s tendency to maximize inter-point distances.
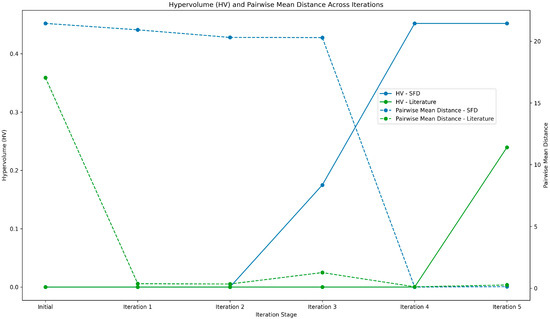
Figure 8.
A plot showing the mean pairwise distance (in green) and hypervolume (in blue) for each iteration step. The convergence of distances in later iterations reflects outcome space constraints (GST), while hypervolume increase indicates Pareto front improvement.
For the SFD, values remain within the same range from iterations 1 to 3, indicating that suggested points adequately cover the formulation space. In contrast, for the literature-based approach, the model suggests similar points during iterations 1 and 2, which may be due to higher variance in the literature-based model than for SFD. The small increase in values at iteration 3 for literature-based initialization shows better exploration by the model. For both models, distances converge for the last two iterations within the same range due to outcome space thinning (detailed in Section 2.8).
The metric used to assess new point quality in the output space is the hypervolume measurement with the reference point of the Optimal Formulation Selection Threshold (OFST). Figure 8 illustrates that with literature-based initialization (the continuous green line), hypervolume values stay constant (HV = 0) up to iteration 5, indicating no points in the desired area. At iteration 5, HV rises to 0.24. For SFD-based initialization (the continuous blue line), hypervolume values remain constant (HV = 0) until iteration 3, where they rise to 0.17. This suggests that the point is of lower quality than the one suggested by the literature-based approach at iteration 5. Then, at iteration 4, a slight increase to 0.45 is observed, and this value remains consistent through the last iteration. This suggests no further improvement is observed, although this higher value indicates better performance of SFD-based initialization.
The earlier achievement of non-zero hypervolume by the SFD approach (iteration 3 vs. iteration 5) demonstrates faster convergence to the desired region of the objective space. This faster convergence translates to reduced experimental cost and time. The sustained higher hypervolume for SFD (0.45 vs. 0.24) indicates a more efficient exploration of the Pareto front, providing decision-makers with a broader range of high-quality formulation options balancing fire retardancy and filler content.
To assess the sensitivity of the Pareto front to compositional variations, we examined how small perturbations (±1 wt.%) in the optimal formulation components affect objective values. For the SFD optimal formulation (APP 14.3, PER 8.44, PP 77.26), increasing APP by 1 wt.% while proportionally decreasing PP shifts the predicted LOI from 27.2 to 27.6 vol.% but increases FR content from 22.74 to 23.74 wt.%, moving the point slightly along the Pareto front toward higher performance but also higher cost. Conversely, decreasing APP by 1 wt.% reduces the predicted LOI to 26.7 vol.% while lowering FR content to 21.74 wt.%. These perturbation analyses confirm that the identified optimal formulations lie on a smooth, well-defined Pareto front, with trade-offs behaving predictably: each 1 wt.% increase in FR content yields approximately 0.4–0.5 vol.% LOI improvement in the optimal region. This sensitivity information guides practical decision-making, allowing formulators to adjust compositions based on specific performance requirements or cost constraints while maintaining near-optimal efficiency.
3.7. Experimental Uncertainty Analysis
The total experimental uncertainty in LOI measurements arises from multiple sources. Mixing uniformity during twin-screw extrusion contributes approximately ±0.10 vol.% variability, assessed through replicate batch processing under identical conditions (170–190 °C, 100 rpm). Compression molding variability (temperature, pressure, and cooling rate) contributes ±0.08 vol.%, controlled through standardized procedures and dimensional verification. LOI measurement uncertainty (±0.20 vol.%) dominates the error budget, consistent with ASTM D2863 precision statements and confirmed through intra-laboratory reproducibility studies.
The combined uncertainty, calculated as 0.24 vol.%, aligns closely with the GP model’s optimized noise parameter (σn = 0.25 vol.%), confirming appropriate uncertainty quantification. Quality control measures included a visual inspection of extrudates, an SEM verification of filler dispersion (representative samples), and the center-cutting of test specimens to minimize edge effects.
These comprehensive uncertainty quantifications underscore the importance of (i) standardized sample preparation and testing protocols, (ii) replicate measurements to quantify variability, and (iii) proper uncertainty quantification in the optimization framework. The GP model’s probabilistic nature naturally accommodates these sources of uncertainty through its noise model and variance predictions.
3.8. Mechanistic Insights: Formulation Composition and Char Formation
While the optimization framework treats the formulation–LOI relationship as a black box, understanding the underlying mechanisms provides valuable insights. The intumescent mechanism involves three key components: acid source (APP), carbonization agent (PER), and gas source (decomposition products).
Upon heating above 300 °C, APP undergoes thermal decomposition releasing phosphoric acid and ammonia. The phosphoric acid catalyzes PER dehydration, forming a carbon-rich intermediate that further polymerizes into a stable char network [39]. Simultaneously, decomposition gases (NH3, H2O, and CO2) expand the softened char, creating an insulating foam structure with closed-cell morphology. This expanded char acts as both a thermal barrier and oxygen diffusion barrier, protecting the underlying polymer [28].
The APP/PER ratio critically affects char quality and formation kinetics. At optimal ratios (approximately 1.5–2.5:1), sufficient acid catalyzes complete PER carbonization while avoiding excess acid that degrades char structure [32]. Studies using the compression testing of char residues demonstrate that mechanically resistant foam structures provide superior flame-retardant performance, with char stiffness directly correlated to LOI values [32]. The particle size of APP also influences char formation efficiency, with smaller particles promoting more uniform and stable char structures through better polymer matrix distribution [32].
Our optimization inherently explored these mechanistic relationships, with the GP model learning the nonlinear effects of the APP/PER ratio, total FR content, and their interactions on LOI performance. The optimal formulations identified (APP/PER ratios of 1.69 and 2.26) fall within the mechanistically effective range, confirming that data-driven optimization converged to chemically sensible solutions.
The slightly lower APP/PER ratio in the SFD-optimized formulation (1.69 vs. 2.26) suggests a more balanced acid–carbon relationship, potentially leading to more complete char formation with better mechanical resistance at lower total filler content. This demonstrates how the optimization framework can discover non-intuitive formulations that may be overlooked by traditional rational design approaches based solely on mechanistic understanding or literature precedent.
4. Conclusions
We have demonstrated in this work the efficiency of MOBO on a simple intumescent polypropylene formulation as a case study. Employing literature-based formulations for BO framework initialization is feasible yet not the most effective strategy due to the non-uniform coverage of formulations within the domain. Nevertheless, in practical applications, it might be more convenient to utilize existing data, despite its suboptimal nature. One approach to mitigate this drawback is to directly refine the design and/or outcome space to offset slow convergence speed.
The experimental validation of the optimal formulation confirmed the model’s predictive accuracy, with measured LOI values (27.0 ± 0.3 vol.% for SFD, 27.3 ± 0.3 vol.%) falling within the predicted 95% confidence intervals. This validation demonstrates that MOBO can reliably guide experimental work, reducing trial-and-error iterations and accelerating materials discovery.
This research demonstrates several key advantages of the MOBO approach: (i) the efficient exploration of compositional space with limited experimental budget, (ii) explicit quantification of prediction uncertainty through the GP framework, (iii) balanced exploration–exploitation through acquisition function optimization, and (iv) natural accommodation of multiple competing objectives through Pareto front approximation.
Future research directions include (i) the exploration of various kernel types, especially when problem formulation has been extensively studied and when response across design space exhibits distinct shapes (linear or exponential), (ii) extension to other polymer systems (epoxy, polyurethane, or PA6) to demonstrate framework generalizability, (iii) the incorporation of additional objectives (mechanical properties, thermal stability, cost, and sustainability) into the multi-objective framework to enable true multi-property optimization, and (iv) the integration of computational methods (molecular dynamics or finite element analysis) as low-fidelity data sources in a multi-fidelity optimization framework.
Depending on decision-maker objectives, various approaches can be adopted: extracting comprehensive information across the entire output space, exploring diverse possibilities within a broad range of outputs, or pinpointing optimal solutions within constrained spaces. Decision-makers have flexibility to adjust parameters such as threshold values or expand/contract the search space iteratively. Additionally, design space refinement can be carried out at each iteration stage. The active learning methodology offers myriad customizable combinations tailored to specific materials, requirements, and constraints.
Even if this active learning loop appears promising, it also comes with limitations. Traditional Design of Experiments (DoE), with presupposed models, offers the advantage of planning and conducting all formulations simultaneously, providing a more convenient approach in some cases. Another drawback of BO is the limitation in design space dimensionality, where the number of parameters should be fewer than 20. MOBO is computationally expensive (O(N3), with N samples), which can be a limitation for use with large datasets.
The broader impact of this work extends beyond flame-retardant formulation optimization. The demonstrated framework is applicable to diverse materials design problems where multiple competing objectives must be balanced, experimental evaluation is expensive or time-consuming, and the underlying structure–property relationships are complex or poorly understood. By bridging data-driven optimization with materials chemistry, this approach represents a step toward accelerated, intelligent materials discovery that complements traditional rational design methodologies.
Author Contributions
Conceptualization, E.V.; Validation, E.V.; Investigation, M.S.; Data curation, E.V.; Writing—original draft, E.V.; Writing—review & editing, A.C.; Supervision, A.C.; Funding acquisition, S.D. All authors have read and agreed to the published version of the manuscript.
Funding
This work was supported in part by the “AI in an Interdisciplinary Context” project, AI PhD@Lille, funded by the French National Research Agency (ANR). We also extend our gratitude to the LEMTA laboratory, University of Lorraine, Nancy, France, for their co-financing and contributions to this project.
Data Availability Statement
The data used in this research are provided in Appendix A (Table A1 for the literature-based initialization and Table A2 for the SFD), and the code is available on the GitHub repository: https://github.com/Eric-verret/MOBO_FR (accessed on 6 November 2025).
Conflicts of Interest
The authors declare that they have no known competing financial interests or personal relationships that could have appeared to influence the work reported in this paper.
Appendix A. Data
Table A1.
Formulation with literature-based initialization.
Table A1.
Formulation with literature-based initialization.
| APP (%) | PER (%) | PP (%) | LOI | wt.% | |
|---|---|---|---|---|---|
| Initial data | 0.00 | 0.00 | 100.00 | 18.00 | 0.00 |
| 13.33 | 6.67 | 80.00 | 25.20 | 20.00 | |
| 18.75 | 6.25 | 75.00 | 28.50 | 25.00 | |
| 16.66 | 8.34 | 75.00 | 28.10 | 25.00 | |
| 22.50 | 7.50 | 70.00 | 32.10 | 30.00 | |
| Iteration 1 | 0.00 | 9.01 | 90.99 | 18.50 | 9.01 |
| 0.00 | 4.53 | 95.47 | 18.00 | 4.53 | |
| 0.00 | 7.00 | 93.00 | 18.00 | 7.00 | |
| Iteration 2 | 11.62 | 0.00 | 88.38 | 19.60 | 11.62 |
| 22.28 | 0.00 | 77.72 | 20.20 | 22.28 | |
| 17.00 | 0.00 | 83.00 | 19.70 | 17.00 | |
| Iteration 3 | 19.77 | 7.78 | 72.44 | 31.30 | 27.56 |
| 15.76 | 6.80 | 77.45 | 26.80 | 22.55 | |
| 5.84 | 15.00 | 79.16 | 21.80 | 20.84 | |
| Iteration 4 | 16.49 | 7.30 | 76.22 | 26.40 | 23.78 |
| 14.59 | 6.76 | 78.66 | 24.90 | 21.35 | |
| 18.20 | 7.82 | 73.98 | 27.40 | 26.02 | |
| Iteration 5 | 14.02 | 9.14 | 76.84 | 26.40 | 23.16 |
| 13.44 | 8.51 | 78.04 | 24.90 | 21.96 | |
| 16.92 | 7.48 | 75.60 | 27.40 | 24.40 |
Table A2.
Formulation with SFD initialization.
Table A2.
Formulation with SFD initialization.
| APP (%) | PER (%) | PP (%) | LOI | wt.% | |
|---|---|---|---|---|---|
| Initial data | 10.63 | 14.97 | 74.41 | 25.60 | 25.59 |
| 4.31 | 9.07 | 86.63 | 19.70 | 13.38 | |
| 24.33 | 5.64 | 70.04 | 28.20 | 29.96 | |
| 0.00 | 1.66 | 98.34 | 17.80 | 1.66 | |
| 18.26 | 0.01 | 81.73 | 19.00 | 18.28 | |
| Iteration 1 | 0.00 | 15.00 | 85.00 | 17.80 | 15.00 |
| 0.00 | 7.24 | 92.76 | 17.60 | 7.24 | |
| 13.09 | 8.03 | 78.88 | 24.40 | 21.12 | |
| Iteration 2 | 8.94 | 0.00 | 91.06 | 19.00 | 8.94 |
| 10.32 | 6.50 | 83.18 | 23.20 | 16.82 | |
| 16.87 | 10.41 | 72.73 | 28.60 | 27.28 | |
| Iteration 3 | 7.40 | 4.06 | 88.54 | 20.60 | 11.46 |
| 14.93 | 9.20 | 75.88 | 27.20 | 24.13 | |
| 0.00 | 0.00 | 100.00 | 18.00 | 0.00 | |
| Iteration 4 | 16.20 | 9.36 | 74.45 | 28.30 | 25.56 |
| 14.30 | 8.44 | 77.26 | 27.20 | 22.74 | |
| 15.70 | 9.14 | 75.17 | 26.70 | 24.84 | |
| Iteration 5 | 13.90 | 8.06 | 78.05 | 26.20 | 21.96 |
| 16.84 | 9.44 | 73.73 | 28.70 | 26.28 | |
| 14.92 | 8.51 | 76.57 | 26.90 | 23.43 |
References
- Zhao, W.; Kundu, C.K.; Li, Z.; Li, X.; Zhang, Z. Flame retardant treatments for polypropylene: Strategies and recent advances. Compos. Part A Appl. Sci. Manuf. 2021, 145, 106382. [Google Scholar] [CrossRef]
- Pilania, G. Machine learning in materials science: From explainable predictions to autonomous design. Comput. Mater. Sci. 2021, 193, 110360. [Google Scholar] [CrossRef]
- Chen, F.; Wang, J.; Guo, Z.; Jiang, F.; Ouyang, R.; Ding, P. Machine learning and structural design to optimize the flame retardancy of polymer nanocomposites with graphene oxide hydrogen bonded zinc hydroxystannate. ACS Appl. Mater. Interfaces 2021, 13, 53425–53438. [Google Scholar] [CrossRef] [PubMed]
- Jafari, P.; Zhang, R.; Huo, S.; Wang, Q.; Yong, J.; Hong, M.; Deo, R.; Wang, H.; Song, P. Machine learning for expediting next-generation of fire-retardant polymer composites. Compos. Commun. 2024, 45, 101806. [Google Scholar] [CrossRef]
- Huo, S.; Song, P.; Yu, B.; Ran, S.; Chevali, V.S.; Liu, L.; Fang, Z.; Wang, H. Phosphorus-containing flame retardant epoxy thermosets: Recent advances and future perspectives. Prog. Polym. Sci. 2021, 114, 101366. [Google Scholar] [CrossRef]
- Greenhill, S.; Rana, S.; Gupta, S.; Vellanki, P.; Venkatesh, S. Bayesian optimization for adaptive experimental design: A review. IEEE Access 2020, 8, 13937–13948. [Google Scholar] [CrossRef]
- Arróyave, R.; Khatamsaz, D.; Vela, B.; Couperthwaite, R.; Molkeri, A.; Singh, P.; Johnson, D.D.; Qian, X.; Srivastava, A.; Allaire, D. A perspective on Bayesian methods applied to materials discovery and design. MRS Commun. 2022, 12, 1037–1049. [Google Scholar] [CrossRef]
- Frazier, P.I. A tutorial on bayesian optimization. arXiv 2018, arXiv:1807.02811. [Google Scholar] [CrossRef]
- Garnett, R. Bayesian Optimization; Cambridge University Press: Cambridge, UK, 2023; ISBN 978-1-108-42578-0. [Google Scholar]
- Rasmussen, C.E.; Williams, C.K.I. Gaussian Processes for Machine Learning; MIT Press: Cambridge, MA, USA, 2006; ISBN 978-0-262-18253-9. [Google Scholar]
- Wilson, A.G.; Adams, R.P. Gaussian process kernels for pattern discovery and extrapolation. In Proceedings of the International Conference on Machine Learning, PMLR, Atlanta, GA, USA, 16–21 June 2013; pp. 1067–1075. [Google Scholar]
- Snoek, J.; Larochelle, H.; Adams, R.P. Practical bayesian optimization of machine learning algorithms. In Advances in Neural Information Processing Systems; MIT Press: Cambridge, MA, USA, 2012; Volume 25, pp. 2951–2959. [Google Scholar]
- González, J.; Dai, Z.; Hennig, P.; Lawrence, N. Batch bayesian optimization via local penalization. Artif. Intell. Stat. 2016, 51, 648–657. [Google Scholar]
- Yang, K.; Emmerich, M.; Deutz, A.; Bäck, T. Efficient computation of expected hypervolume improvement using box decomposition algorithms. J. Glob. Optim. 2019, 75, 3–34. [Google Scholar] [CrossRef]
- Hickman, R.J.; Aldeghi, M.; Häse, F.; Aspuru-Guzik, A. Bayesian optimization with known experimental and design constraints for chemistry applications. Digit. Discov. 2022, 1, 732–744. [Google Scholar] [CrossRef]
- Dong, Q.; Huang, C.; Mao, H.; Yang, X.; Zhang, S.; Chen, Y.; Yang, R. Effects of ammonium polyphosphate on thermal degradation and flame retardancy properties of intumescent flame retardant polypropylene composites. Polym. Degrad. Stab. 2014, 102, 60–68. [Google Scholar] [CrossRef]
- Gramacy, R.B. Gaussian Process Modeling, Design, and Optimization for the Applied Sciences; CRC Press: Boca Raton, FL, USA, 2020; ISBN 978-1-4987-8057-7. [Google Scholar]
- Lu, L.; Anderson-Cook, C.M. Leveraging what you know: Versatile space-filling designs. Qual. Eng. 2023, 35, 566–583. [Google Scholar] [CrossRef]
- Pronzato, L.; Müller, W.G. Design of computer experiments: Space filling and beyond. Stat. Comput. 2012, 22, 681–701. [Google Scholar] [CrossRef]
- Viana, F.A.C.; Haftka, R.T.; Steffen, V. Multiple surrogates: How cross-validation errors can help us to obtain the best predictor. Struct. Multidiscip. Optim. 2009, 39, 439–457. [Google Scholar] [CrossRef]
- Bakshy, E.; Dworkin, L.; Karrer, B.; Kashin, K.; Letham, B.; Murthy, A.; Singh, S. AE: A Domain-Agnostic Platform for Adaptive Experimentation. In Proceedings of the 32nd Conference on Neural Information Processing Systems (NeurIPS 2018), Workshop on Systems for Machine Learning, Montréal, QC, Canada, 7 December 2018. [Google Scholar]
- Letham, B.; Bakshy, E. Bayesian Optimization for Policy Search via Online–Offline Experimentation. J. Mach. Learn. Res. 2019, 20, 1–30. [Google Scholar]
- Balandat, M.; Karrer, B.; Jiang, D.; Daulton, S.; Letham, B.; Wilson, A.G.; Bakshy, E. Botorch: A framework for efficient monte-carlo bayesian optimization. Adv. Neural Inf. Process. Syst. 2020, 33, 21524–21538. [Google Scholar]
- Eriksson, D.; Jankowiak, M. High-dimensional bayesian optimization with sparse axis-aligned subspaces. In Proceedings of the Uncertainty in Artificial Intelligence, PMLR, Online, 27–30 July 2021; pp. 493–503. [Google Scholar]
- Daulton, S.; Balandat, M.; Bakshy, E. Differentiable expected hypervolume improvement for parallel multi-objective bayesian optimization. Adv. Neural Inf. Process. Syst. 2020, 33, 9851–9864. [Google Scholar]
- Daulton, S.; Balandat, M.; Bakshy, E. Parallel bayesian optimization of multiple noisy objectives with expected hypervolume improvement. Adv. Neural Inf. Process. Syst. 2021, 34, 2187–2200. [Google Scholar]
- Lázaro-Gredilla, M.; Titsias, M.K. Variational heteroscedastic gaussian process regression. In Proceedings of the 28th International Conference on Machine Learning, Bellevue, WA, USA, 28 June–2 July 2011; pp. 841–848. [Google Scholar]
- Donmez, S.; Tuzenli, Z.; Bayram, G.; Savaskan Yilmaz, S. Flame retardancy and mechanical properties of polypropylene composites containing intumescent flame retardants, preceramic polymers, and other additives. SPE Polym. 2024, 5, 34–45. [Google Scholar] [CrossRef]
- Pérez, N.; Qi, X.-L.; Nie, S.; Acuña, P.; Chen, M.-J.; Wang, D.-Y. Flame Retardant Polypropylene Composites with Low Densities. Materials 2019, 12, 152. [Google Scholar] [CrossRef]
- Zhang, T.; Yan, H.; Peng, M.; Wang, L.; Ding, H.; Fang, Z. Construction of flame retardant nanocoating on ramie fabric via layer-by-layer assembly of carbon nanocages onto chitosan. Carbohydr. Polym. 2013, 91, 638–643. [Google Scholar] [CrossRef]
- Baird, S.G.; Diep, T.Q.; Sparks, T.D. DiSCoVeR: A materials discovery screening tool for high performance, unique chemical compositions. Digit. Discov. 2022, 1, 226–240. [Google Scholar] [CrossRef]
- Bocz, K.; Krain, T.; Marosi, G. Effect of particle size of additives on the flammability and mechanical properties of intumescent flame retarded polypropylene compounds. Int. J. Polym. Sci. 2015, 2015, 493710. [Google Scholar] [CrossRef]
- Zhang, Y.; Li, X.; Fang, Z.; Hull, T.R.; Kelarakis, A.; Stec, A.A. Mechanism of enhancement of intumescent fire retardancy by metal acetates in polypropylene. Polym. Degrad. Stab. 2017, 136, 139–145. [Google Scholar] [CrossRef]
- Wang, X.; Li, J.; Chen, Y. Flame retardant mechanism of intumescent polypropylene systems. Fire Mater. 2020, 44, 678–688. [Google Scholar] [CrossRef]
- Alméras, X.; Le Bras, M.; Hornsby, P.; Bourbigot, S.; Marosi, G.; Keszei, S. Effect of fillers on the fire retardancy of intumescent polypropylene compounds. Polym. Degrad. Stab. 2003, 82, 325–331. [Google Scholar] [CrossRef]
- Aitchison, J. The statistical analysis of compositional data. J. R. Stat. Soc. Ser. B (Methodol.) 1982, 44, 139–160. [Google Scholar] [CrossRef]
- Greenacre, M. Towards a pragmatic approach to compositional data analysis. Austrian J. Stat. 2017, 46, 61–73. [Google Scholar] [CrossRef]
- Quinn, T.P.; Erb, I.; Richardson, M.F.; Crowley, T.M. Understanding sequencing data as compositions: An outlook and review. Bioinformatics 2018, 34, 2870–2878. [Google Scholar] [CrossRef] [PubMed]
- Yuan, J.; Wang, H.; Wang, Y.; Ma, Y.; Zhu, Z.; Lin, X. A Novel Highly Efficient Intumescent Flame-Retardant Polypropylene: Thermal Degradation, Flame Retardance and Mechanism. J. Polym. Res. 2022, 29, 205. [Google Scholar] [CrossRef]
Disclaimer/Publisher’s Note: The statements, opinions and data contained in all publications are solely those of the individual author(s) and contributor(s) and not of MDPI and/or the editor(s). MDPI and/or the editor(s) disclaim responsibility for any injury to people or property resulting from any ideas, methods, instructions or products referred to in the content. |
© 2025 by the authors. Licensee MDPI, Basel, Switzerland. This article is an open access article distributed under the terms and conditions of the Creative Commons Attribution (CC BY) license (https://creativecommons.org/licenses/by/4.0/).