Abstract
Wildfire causes environmental, economic, and human problems or losses. This study reviewed wildfires induced by lightning strikes. This review focuses on the investigations of lightning mechanisms in the laboratory. Also, the paper aims to discuss some of the modeling studies on lightning-induced wildfires at different geographical locations using satellite-recorded lightning data and different statistical analyses. This review established that irrespective of the different models used to predict lightning wildfires, there is still a lack of understanding of the lightning-strike ignition mechanism; few experiments have been modeled to establish the dynamics of lightning-strike ignition. Therefore, further research needs to be carried out in this area to understand lightning ignition. It was ascertained from the various statistical modeling that lightning-induced wildfires are exacerbated by the abundant availability of fuel with a lower moisture content and high lightning efficiency. Moreover, because of changes in the climate and weather conditions, i.e., harsh weather and climate conditions due to anthropogenic activities, lightning-induced ignition wildfires have increased over the years, and they are expected to increase in the future if the climate and weather conditions continue to aggravate. Although various modeling studies have identified that lightning-induced wildfires have increased recently, no preventive measures have been conclusively proposed to reduce lightning-caused wildfires. Hence, this aspect of research has to be given critical attention. This review presents information that gives a profound understanding of lightning-induced wildfires, especially factors that influence lightning wildfires, and the state-of-the-art research that has been completed to understand lightning-induced wildfires.
1. Introduction
Although fire has been part of the Earth’s system and with the human community for many years, recently, dry weather conditions due to global warming or climate change as a result of excessive greenhouse gas accumulation in the atmosphere have provided lightning strikes as a new and different source of ignition for fires. Lightning strikes are the fundamental cause or the essential natural cause of wildfire ignition, which leads to the loss of properties and human lives [1,2,3]. Nowadays, lightning strikes ignite most of the fires in the ecosystem or the wildlands. It is estimated to be responsible for 10% of global forest fires [4]. Every second, almost 46 lightning flashes occur on the Earth due to the electric fields between the cloud and the ground, which potentially trigger wildfires [5].
Weather conditions influence lightning-induced wildfires. Lightning-induced wildfires mostly occur in regions with extreme weather conditions, especially very hot conditions. That is, in more recent years, increased atmospheric temperatures due to global warming and extreme thunderstorms have been occurring, which have been causing lightning strikes and wildland fires [6,7,8]. Moreover, strong dry winds due to severe weather conditions influence and advance cloud-to-ground lightning-induced wildfires [9]. In turn, lightning-induced wildfires contribute to the weather conditions that favor lightning and dry vegetation for wildfires. Thus, harsh weather conditions cause lightning strikes and, at the same time, dry vegetation, both of which eventually cause wildfires [10]. Therefore, the incessant increase in global warming and atmospheric temperatures would increase lightning-induced fires and the destruction of properties and natural vegetation. Considering this, the degree to which lightning strikes are involved in global wildland fires has to be resolved to make efforts to decrease lightning-strike wildfires.
Lightning-induced wildfires in China are prevalent in the Daxing’an Mountains in Heilongjiang, Inner Mongolia, and the Xinjiang Altai Mountains. From 1988 to 2007, lightning strikes accounted for 60% of wildfire accidents in the Daxing’an Mountains in Inner Mongolia. Furthermore, as of 2020, lightning had contributed to 21% of forest fires in the Daxing’an Mountains in Inner Mongolia [11]. However, lightning has caused almost 68% of wildland fires in the Daxing’an Mountains of Heilongjiang Province in the past four decades. Also, past reports indicate that lightning strikes are the main cause of grassland fires in Inner Mongolia [12]. From 2012 to 2020, lightning caused nearly 77.6% of the wildfires in the Heilongjiang Province of China, mostly occurring in April [13]. In Muli County in Sichuan Province, lightning strikes contributed to nearly 47% of wildland fire accidents from 2005 to 2008 [14,15]. In the same Muli County (Li’er village), a lightning-induced fire took the lives of 27 firefighters and 4 residents in March 2019 [14,16]. Liu et al. [17] reported that lightning strikes caused 45% of the wildfires in the boreal forest of northeast China.
Approximately two-thirds of the wildfires that occur in the U.S.A. are caused by lightning strikes [18]. In July 1994, lightning-induced wildland fires caused the deaths of 14 firefighters in the U.S.A. [14,19]. Also, from 1992 to 2013, lightning-induced fire accounted for 16% of wildfires in the U.S.A. From 2008 to 2012, per the National Fire Protection Association records, 9000 wildfires were initiated by lightning strikes, contributing to 12% of lightning-induced fires in the U.S.A. [19]. The same report emphasized that 38 firefighters were killed by lightning-caused wildfires from 2003 to 2013. Moreover, in 2017, lightning caused the majority of the burned area in the North American boreal forest [20]. Nevertheless, lightning strikes have been increasing exponentially in North America since 1975. They account for more than 55% of the total burned area in North America’s boreal forest, with lightning-induced fires predominantly occurring in Alaska. From 1973 to 1982, lightning caused 34% of the 10,000 wildland fires that occurred annually in Canada. In 2005, about 48% of wildfires in Canada’s remote areas were caused by lightning strikes [21]. From 1995 to 1999, nearly 89% of lightning-induced fires occurred in the Emas National Park in Brazil [22] whereas from 2002 to 2003, lightning strikes caused 13 wildfires [23] in the same area. According to the National Interagency Fire Center, Boise, Idaho [24] statistics, from 2001 to 2020, the highest number of lightning-induced wildfires occurred in the southwest (Figure 1a). However, a large acreage was burned by lightning-induced wildfires in Alaska (see Figure 1b).

Figure 1.
The number of lightning-induced wildfires and burned acres in U.S.A. areas from 2001 to 2020; data extracted from National Interagency Fire Center, Boise, Idaho [24]. (a) is the occurrence of lightning-induced wildfires, and (b) is the burned acreage due to lightning-ignitions.
In Australia, lightning strikes caused 30% and 90% of wildfires and burned areas, respectively [25]. Specifically, in Victoria, Australia, from 1973 to 2014, lightning strikes accounted for 70% of burned land, contributing to 11% of wildfire ignition [26]. Collins et al. [27] found that from 1951 to 2015, 29 lightning-induced wildfires destroyed 843 houses in New South Wales and Victoria. In Spain, lightning-induced fires contributed to 7.3% of the total burned areas from 2001 to 2010 [28]. Also, in 2012, it was reported that lightning strikes contributed to 3.9% of wildfires in Spain [29]. On 6 June 2017, a lightning-induced fire left hundreds of people homeless in the Western Cape, South Africa [30].
Adversely, lightning-induced fires are a menace to the ecosystem, atmospheric composition, and human lives and cause property loss; thus, they cause socioeconomic problems. Therefore, the mechanism of lightning-induced fires has to be deeply understood to develop systems to mitigate lightning-induced fire disasters. Understanding the dynamics of lightning-induced fires, especially ignition dynamics, is vital to predicting wildland fires. Although efforts have been expended toward understanding the mechanism of lightning-strike fires, there are still interesting and undiscovered facts about lightning-strike fires. Motivated by this, this review aims to report the literature and state-of-the-art knowledge of lightning-induced wildfires concerning research that studied the underlying mechanism of lightning ignition, the influential factors of lightning wildfires, and the modeling of lightning-induced fire occurrence in different geographical regions. Thus, this review intends to identify the ignition criteria and characteristics of lightning-ignition energies. Moreover, the critical environmental factors that affect lightning-induced wildfires are presented and discussed. Lastly, global lightning-induced wildfire investigations are discussed. This review provides information that is beneficial to understanding and managing lightning-induced wildfires. The other sections of this paper are arranged as follows: Section 2 provides lightning mechanisms, the types of lightning strikes, and the lightning strikes that mostly trigger wildfires. The lightning-ignition model and the various studies that have been reported to model lightning strikes in the laboratory are discussed in Section 3. Section 4 is about the factors that affect lightning-strike fires. Section 5 discusses some of the recent modeling studies on lightning-induced ignition. The conclusions of this study are presented in Section 6 of this paper.
2. Lightning Mechanism
Lightning is a natural event caused by the electric charges between the atmosphere (cloud) and the atmosphere, the atmosphere and the ground, and the atmosphere and the air [31]. Thus, lightning phenomena can occur within the clouds (intracloud), between the cloud and the cloud (cloud-to-cloud), between the cloud and the air (cloud-to-air), and between the cloud and the ground (cloud-to-ground) due to the interaction or exchange between free electrons, as shown in Figure 2 [32]. Lightning occurs when there is an accumulation of sufficient electric charges in the cumulus of the cloud, which is enough to lead to an electrical breakdown in the cloud [33]. In other words, lightning starts in the regions of strong electric fields within thunderstorms, between layers of positively and negatively charged precipitation particles. To this end, electric current or energy transfer occurs either in the cloud (intracloud) or between the cloud-charged zones and the ground (cloud-to-ground) [34]. In thunderstorms, cumulonimbus clouds produce lightning; thus, lightning usually starts in the cumulonimbus cloud and ends on the ground as a lightning strike (cloud-to-ground lightning) [35]. The cloud-to-ground lightning is mostly dry, i.e., before it arrives on the ground, most of its precipitation evaporates, and it is the usual cause of wildfires. Because it has no or less precipitation, it has a high amount of heat, and when it comes in contact with trees or other vegetation, it can cause its moisture content to evaporate and cause fire, although not all cloud-to-ground lightning encounters with vegetation cause fire [36,37].
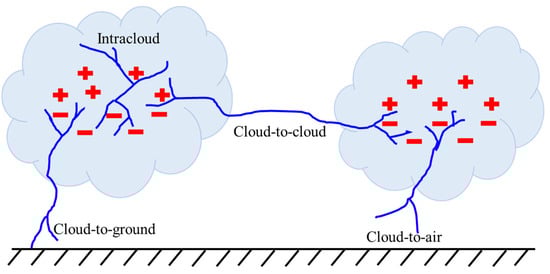
Figure 2.
The types of lightning strikes [32].
2.1. Types of Cloud-to-Ground Lightning
Cloud-to-ground lightning strikes can be categorized into two categories. They can either be a negative or positive strike, depending on the polarity of the discharge or the ionic source of the striking thunderstorm. Negative cloud-to-ground lightning occurs from the negatively charged zones in the middle of the cloud [38]. That is, it is caused by the movement of the negative end of the in-cloud bidirectional stepped leader (i.e., the initial stages of lightning, which establish suitable channels for the electrostatic charges) to the ground as a result of negative charges [15]. On the other hand, positive cloud-to-ground lightning is due to the charges in the upper part of the cloud. That is, the movement of the positive end of the in-cloud bidirectional stepped leader to the ground caused by positive charges. Whereas negative cloud-to-ground lightning strikes are common or frequently occur, positive cloud-to-ground lightning seldom occurs, but it is more dangerous than negative cloud-to-ground lightning. Most of the lightning strikes that occur during thunderstorms are negative cloud-to-ground lightning. Negative cloud-to-ground lightning has many return strokes, but positive cloud-to-ground lightning strikes have a single stroke. Positive strikes have a longer duration, and they are mostly responsible for lightning fires. Table 1 briefly summarizes the characteristics of negative and positive cloud-to-ground lightning.

Table 1.
Properties of positive and negative cloud-to-ground lightning [38].
2.2. Stages of Cloud-to-Ground Lightning
To better understand lightning-induced fires, it is worth understanding the stages of a lightning phenomenon. Thus, accurate knowledge of the formation of lightning or the processes that are involved in the development of lightning strikes in a thunderstorm cloud is of paramount importance for assessing and predicting lightning-induced wildfires. Therefore, knowledge of lightning formation elements in a thunderstorm cloud should be taken into account in evaluating the severity of lightning-induced wildfires. Generally, four stages constitute the formation of cloud-to-ground lightning in a thunderstorm cloud, namely, the stepped leader, return stroke, dart leader, and subsequent return stroke. Figure 3 shows the lightning phenomenon.
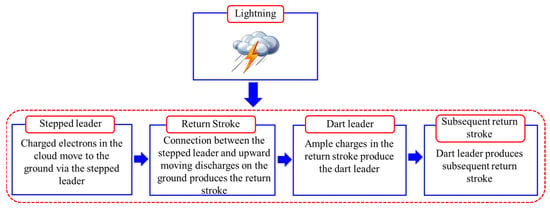
Figure 3.
Lightning flashes phenomena.
The electrostatic charges caused by the breakdown of air as a result of exposure to a high voltage require a channel to move through to the cloud, and the channel via which the electrons move through is known as a stepped leader [38]. The stepped leader is the initial and most crucial stage of the formation of cloud-to-ground lightning. It establishes a suitable medium for the lightning’s electrical charges to move through to the ground [39]. From a different perspective, a stepped leader is the vehicle that hosts the downward movement of charged electrons to the ground [40]. Fundamentally, the stepped leader is formed by the movement of small charge pockets toward the ground. That is, a stepped leader is generated or formed in a thunderstorm cloud when the charge differences between the little region of positive charges near the storm’s base and the larger region of negative charges in the center of the thunderstorm grow significantly [41]. Therefore, the stepped leader is started as a result of a large charge difference in the cloud. When there is a large charge difference in the cloud, the insulating capacity of the air breaks down and the negative charges move upward [42]. On the one hand, because the negative charge accrued along the upward conductive channel is not satisfied by the small positive charge at the base of the cloud close to the growing channel, the negatively charged channel moves from the bottom of the cloud and moves continuously to the ground [43]. As the stepped leader reaches the ground, one or more leaders move upward to meet the descending stepped leader. The stepped leader produces many branches before it approaches the ground. The branch that attaches the leader first completes the path appropriate for the charged electron to connect the cloud and the ground in the form of a wire. The stepped leader does not move in the path of the least resistance but branches outward and connects to the ground.
The return stroke is the next step in the lightning formation process after the stepped leader. The return stroke is the most luminous part of a thunderstorm lightning flash. During a thunderstorm, the return stroke is the bright and visible lightning flashes that appear to the human eye. The return stroke is a collection of current flowing through the discharged electrons [44]. The return stroke occurs when the negative charges build up in the stepped leader and move rapidly to the ground. It is developed when the small discharged electrons along the stepped leader channel connect the cloud and ground [45]. Consequently, the stepped leader charge is neutralized when the return stroke is formed [46]. The return strokes travel at a speed up to one-third of the speed of light. As seen in Table 1, negative cloud-to-ground lightning has an average number of three to four strokes, whereas positive cloud-to-ground lightning has an average number of one stroke. While the stepped leader is the crucial stage in generating lightning flashes, the return stroke is the most dangerous part of a lightning flash. The return stroke mainly causes lightning accidents or hazards, and it is largely responsible for wildfires. The continuing current that follows the return stroke produces thermal energy that is sufficient to ignite forest fuels [47]. Therefore, when a forest fuel is consistently exposed to more repeated return strokes, there is a likelihood the return stroke will ignite the forest fuel.
The dart leader is a downward leader produced after the return stroke. It moves in the same path as the first return stroke discharge but in the opposite direction [48]. The dart leader is formed by the excess negative charges in the return stroke. The excess charges travel to the ground along the conductive path produced by the initial return stroke, and the dart leader is generated [49]. The dart leader travels at a speed of nearly 107 m/s. The dart leader is also luminous, but its head is the brightest, and the luminosity of the leader behind the channel is relatively low [48]. When the dart leader charges reach the ground, it produces another return stroke known as the subsequent return strokes [32]. Most negative cloud-to-ground lightning flashes have multiple dart leaders and subsequent return strokes.
3. Ignition
After the occurrence of a lightning strike, the first stage of lightning-induced fire is ignition. The ignition of the lightning flashes that reach the ground causes wildfires. The whole lightning fire primarily depends on the ignition, and it is the circumstance whereby a smoldering fire starts the wildfire. It occurs when the lightning strike energy is higher than the minimum energy required for ignition. Therefore, before a fire starts, fuel has to absorb enough energy for combustion to occur. That is, the lightning current that reaches a potential fuel should heat the fuel to its ignition temperature before it can ignite [38]. However, the ignition of the available fuel depends on the state or condition of the lightning flash current. Thus, the ignition of the fuel depends on the lightning flash intensity and the duration of the continuous current.
Mostly, in combustion science, ignition can be spontaneous or piloted. In the former, a heat pulse is applied to the fuel, whereas in the latter, the fuel is exposed to steadily rising heat for a prolonged duration, which preheats the fuel, subjecting the fuel to pulse heat [39]. Lightning ignition is spontaneous ignition. The long-continuing current (LCC) in the lightning wave is affirmed to be primarily responsible for the ignition of forest fuels that cause wildfires. Therefore, the successful ignition or smoldering of the wildland fuels depends on the duration of the long-continuing current. On the other hand, lightning strikes without the LCC or short-duration currents can also cause fires. The long-continuing current can heat fuels longer, have much more energy, and transfer more energy to ignite the fuels.
3.1. Lightning-Ignition Models
Lightning-ignition wildfire models are used to forecast or estimate the probability of lightning-induced wildfire occurrences. The lightning-ignition model is also used to understand and identify the conditions that expedite lightning ignition and wildfires. Fuquay et al. [50] pioneered and implemented the first lightning-ignition model. The model was established using stochastic and physical processes. The author’s model was established using regression analysis. The model was developed based on several factors, such as the lightning activity level, speed of a thunderstorm, fuel moisture, and bulk fuel density. The storm’s speed, fuel moisture, lightning activity level, and fuel bulk density were used as the inputs, whereas the rainfall effects on the fuel and ignition probability per cloud-to-ground flash were used as the intermediates in the model, as demonstrated in Figure 4. Finally, the interactions between these parameters produce the number of ignitions.
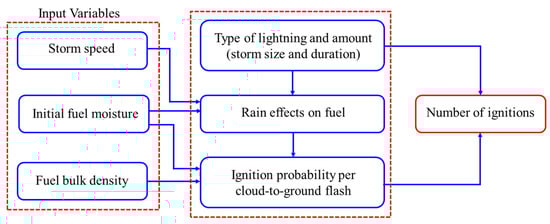
Figure 4.
Lightning-ignition model, extracted from [50].
Since the publication of Fuquay et al.’s [50] model, several models have been put forth to simulate lightning-related wildfires. Thus, empirical models, conceptual models, models based on spatiotemporal analysis, and machine-learning-based models have been established to evaluate lightning-ignition wildfires. However, similar to Fuquay’s model, these models use the fuel moisture, fuel bulk density, fuel type, weather and climate conditions, and lightning frequency to accurately estimate wildfire ignition by lightning strikes. Last but not least, the models mostly apply historical recorded data to model lightning-ignition wildfires.
3.2. Experimental Investigations of Lightning Ignition
To understand the lightning-ignition mechanism of wildfires, researchers have endeavored to study the lightning mechanisms of long-continuing currents and short-duration currents in the laboratory. In the seminal study by Fuquay et al. [51], they revealed that the LCC mainly causes forest fires. They tested 16 discharges of lightning, and 11 out of the 16 discharges showed a long-continuing current of at least 40 ms. The 11 discharges that showed long-continuing currents caused wildfires in the western Montana forest. Larjavaara et al. [52] indicated that cloud-to-ground lightning strikes in long-lasting and intense thunderstorms are less likely to cause ignition than strikes in local, small-scale thunderstorms. In another study, Darveniza and Zhou [53] showed that the impulse current significantly leads to lightning-strike fires. The authors found that lightning characteristics like the waveform, the duration of the impulse current, and the continuing current influence the ignition probability.
Latham and Schlieter [54] studied the ignition probability of forest fuels using lightning discharges. The electric arc discharge current was used to model lightning’s continuing current. The regression was used to analyze the ignition probabilities. The ignition probability was found to be solely dependent on the duration of the arc, with the flowing current showing no detectable influence. Zhang et al. [14] also studied lightning ignition under laboratory conditions using discharges with a long-continuous current. Remarkably, three stages of ignition were observed: the discharge heating stage, the thermal feedback stage, and the self-sustaining flaming stage. The discharge energy significantly influenced the discharge heating stage and the thermal feedback stage. In another study, Zhang et al. [55] experimentally investigated lightning-induced smoldering ignition using an electric arc current with a long-continuing current. The ignition of the investigated fuel occurred at a discharge current ranging from 100 to 220 A with a duration of 40 to 480 ms. In their research, the discharge duration needed for smoldering ignition decreased as the discharge current increased when the discharge current was less than 160 A, but it was slightly dependent on the discharge current when the discharge current was more than or equal to 160 A. As demonstrated in Figure 5a, when the discharge current is less than or equal to 160 A, a higher discharge current at a shorter discharge time is needed for ignition. Additionally, the L-shaped ignition boundaries in Figure 5b indicate that the ignition depends on both the minimum discharge duration and discharge energy, respectively. The study revealed that the discharge duration influences the ignition and discharge current.
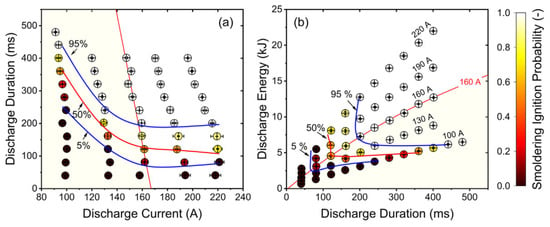
Figure 5.
Smoldering ignition probability by electric arcs [55]. (a) is the discharge duration, and (b) is the discharge energy. The 5%, 50%, and 95% represent the ignition probability boundaries.
To understand the dynamics of long-continuing currents, it is worth understanding the impulse current that occurs before long-continuing currents in a lightning strike. Given this consideration, some research has been completed to analyze the impulse current. Feng et al. [12] used the impulse current generator to investigate lightning-induced ignition. They derived a model for the impulse current based on the impulse current generator. Nevertheless, the lightning energy increased as the peak current increased and the heating efficiency decreased. What is more, Feng et al. [16] experimentally modeled lightning-induced ignition using the impulse current and established a lightning-ignition model for different fuels. Ignition occurred at 10/350 s impulse current; hence, their model applies to grass and needle fuel beds with a waveform of 10/350 s impulse current and short-continuing current. In another work, Feng et al. [56] studied the lightning-ignition mechanism using an impulse current generator. They used an impulse current generator of 8/20 s to study the ignition influence of the impulse current on conifer needle beds. With an increase in the current, the total energy of the impulse current increased. Also, an increase in the current decreased the heating efficiency.
As a concluding remark, although the mechanism of lightning ignition has been well studied in the laboratory, these studies are not insightful for understanding the lightning ignition of wildfires. There are different schools of thought; some researchers agree that long-continuous currents are mainly responsible for the lightning ignition of wildland fires. However, other scholars have reported that short-duration currents can potentially cause wildfires. Considering the above arguments, it is worth performing more research to understand the dynamics of lightning ignition, i.e., the physical behavior and dynamics of lightning ignition have to be thoroughly investigated using different and advanced experimental technologies and well elucidated. Thus, the ignition criteria of lightning fires have to be well understood.
4. Drivers of Lightning-Induced Fire
As shown in Figure 6, lightning-induced ignition and fire depend on the elements that constitute the fire behavior triangle. Therefore, understanding the relationship between the weather, topography, and fuel is beneficial to planning wildfire management. Wildfires’ influential factors are described and discussed in this section of the review. Table 2 summarizes the studies on influential wildfire factors (presented at the end of Section 4).
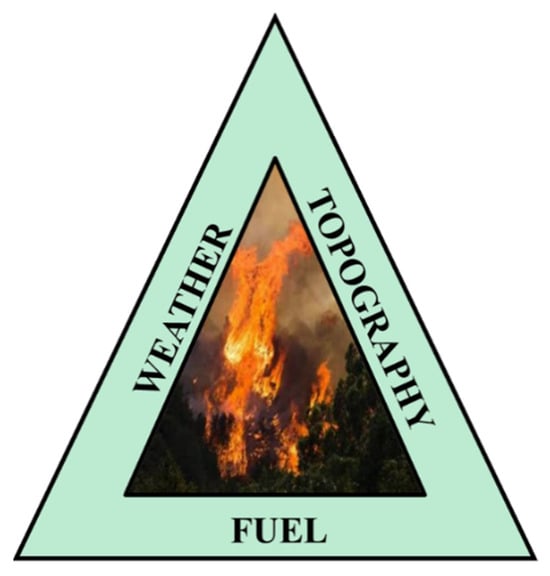
Figure 6.
Wildfire triangle: wildfire influential factors.
4.1. Fuel Conditions
Lightning-strike ignition intensity depends on the chemical composition, moisture content, shape and size, or bulk density of the fuel. Therefore, the self-sustenance of the ignition process mainly depends on the fuel’s chemical composition, moisture content, shape, and size. Thus, the flammability of fuel lies in the moisture level, chemical composition, and density of the fuel. The moisture content is the most vital characteristic; it determines the extent to which the fuel can be ignited, the intensity of the fire, its hotness, and the fire spread of the fuel. Therefore, a fuel with a higher moisture content will lethargically burn compared to a fuel with a low moisture content. In other words, the higher the moisture content of a fuel, the slower the combustion, and the lower the moisture content, the faster the combustion of the fuel. Thus, the higher the moisture content, the higher the heat capacity, and more heat has to be absorbed to reach the minimum ignition required to realize ignition or combustion. Therefore, a higher moisture content delays ignition. The ignition and burning of live leaves are different from those of dead or dry leaves [57,58]. Live leaves have a lot of moisture, or their moisture content is higher, whereas dead leaves have a low moisture content. Accordingly, live leaves might burn more slowly than dry leaves. On the contrary, some live leaves can support fire spread at higher fuel moisture contents than dead leaves [59]. Finally, in some cases, the moisture content of the soil will also influence the burning of the fuel. Followed by the chemical composition, which determines the degree to which the fuel will burn. The chemical composition of some fuels favors or expedites the combustion of the fuels [60]. For example, some leaves or plants have higher heating values that promote faster and more strenuous combustion of the leaves. The fuel’s density is the next influential parameter of the fuel’s flammability. The shape, size, and compactness or arrangement of the fuel all fall under the fuel’s density. Fuels that are compact or close to one another with enough air circulation will ignite each other easily, and the rate of combustion will increase. Heat transfer is high in less compact fuels; therefore, less compact fuels have lower sustenance for combustion.
Anderson’s [46] lightning-induced fire model predicted high fires for dry fuels rather than moist fuels. McAllister and Weise [61] asserted that due to the physical and chemical changes in live leaves, the moisture content is not a suitable criterion to determine the ignition of live leaves. Therefore, other parameters, like the thermal properties of live leaves, could be explored. The fundamental ins and outs of this phenomenon are not well studied and explained in the literature, and it is noteworthy to investigate it further for a better understanding. Viegas et al. [62] discovered that the moisture content is critical when examining the ignition probability and ignition time delay in different fuel species. Engstrom et al. [63] studied the ignition behavior of live California chaparral leaves under various experimental test conditions. The study revealed that the moisture concentration in the leaf delayed ignition. The shape of the leaves highly influenced the ignition time of the chaparral leaves, whereas the ignition temperature was dependent on the leaf’s chemical composition. The average time for the ignition of broadleaf ranged from 1 to 4 s. Prince and Fletcher [64] investigated the influence of the moisture content on the burning of live and dead leaves at different temperatures and found that internal pressures were higher in the live leaves. The study by Bianchi et al. [65] found that conifers ignited faster than Patagonian plant species, i.e., the conifer’s live fuel moisture content was lower than the Patagonian plant species’. Podschwit and Cullen [66] claimed that the decreased moisture content of the available forest fuels controlled lightning wildfires. A more recent study by Zhang et al. [14] indicated that the discharge current required to ignite a pine needle increased with an increase in the moisture content in the pine needle (see Figure 7). However, the moisture predominated the hazard of lightning-induced ignition when the moisture concentration was high.
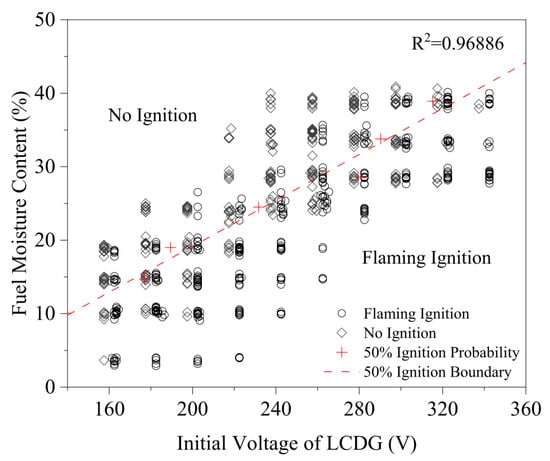
Figure 7.
Variation in moisture content with long-continuing discharge current [14].
Feng et al. [12] also found that an increase in the moisture content of grassland attenuated the voltage of a grass bed. Dennison and Moritz [9] investigated the combustion characteristics of ornamental city trees and forest parks. The study revealed that the moisture content of the trees and leaves in the forest parks affected the heating values of the leaves and the ignition of the leaves and the trees. Sun et al. [57] analyzed the combustion characteristics of live and dead or dry chaparral leaves in southern California. The physical characteristics’ effects on chamise, manzanita, and ceanothus fuel combustion were ascertained. It was discovered that the moisture content of the fuels affected the heat release rate of the fuels. The study by Prat-Guitart and colleagues [67] showed that an increase in the moisture content and bulk density of peat decreased the fire spread of the peat. The influence of the moisture content on the fire spread rate was, however, higher than the effect of the bulk density on the fire spread rate. The effect of the bulk density on the spread rate was highly significant when the moisture content was low. Pineda et al. [68] also found that the moisture content mostly controlled lightning wildfires. The moisture content of the fuel during midday decreased and promoted the burning of wildfires.
Using shrub fuel, Marino et al. [69] studied the effect of the bulk density and moisture content on the spread rate of fire. The research disclosed that the spread rate of fire decreased with an increase in the bulk density of the fuel. Furthermore, as the moisture content of the shrub increased, the propagation rate of fire decreased. Weise and Biging [70] also found that an increased fuel moisture content reduced the flame propagation and flame length. As shown in Figure 8a,b, Dahale et al. [71] investigated the effects of the moisture content on the spread rate and mass burning rate of shrubs using numerical analysis. The results in Figure 8a show that the spread rate decreases as the moisture content increases due to a lower heat capacity. Moreover, the burning rate slows down as the moisture content increases; therefore, the unburnt mass increases as the fuel moisture content increases (see Figure 8b). In the same article, the authors studied the effects of the fuel’s bulk density on the burning characteristics of shrubs, and it was ascertained that, when the bulk density of the fuel was higher, the absorbed heat was distributed within a higher number of solid particles. Therefore, the heat absorbed by the individual fuels was reduced, delaying the combustion.

Figure 8.
Spread rate and unburnt mass versus moisture content [71]. (a) is the fire spread rate, and (b) is the unburnt mass. Case 1 (distributed), Case 2 (fixed), Case 3a–e (distributed), and Case 4a–e (fixed) are the simulation conditions for the fuel bulk density model.
In summary, the moisture content of fuel has a significant influence on the ignition, spread rate, and heat release rate of wildfires. Fuel with a higher moisture content has a higher heat capacity, a higher ignition delay, low heating temperatures, a decreased heat release rate, and a slow fire spread rate. Also, a higher moisture content reduces the combustion or burning efficiency, i.e., a higher moisture content attenuates the arrival and survival of the burning process. The probability or possibility of ignition and the size of the fire depend on the availability of fuel in the dry vegetation. Lastly, although the fuel’s bulk density and chemical composition influence the ignition and survival of wildfires, much focus has been on the evaluation of the moisture content in the fuel.
4.2. Weather and Climate
The weather and climate conditions significantly influence the ignition, sustenance, and spreading of a wildfire. Thus, weather and climate conditions such as high temperatures, low precipitation, strong winds, and low humidity increase the potential of wildfires and their severity [72]. Dry thunderstorms and, thus, hot summers cause lightning wildfires. Therefore, dry weather conditions usually associated with high temperatures and strong wind speeds affect the wildland fuel ignition, spreading rate, and intensity [73]. The wind can intensify a smoldering fire and increase the spreading rate and turbulence of the fire. Since the inception of industrialization in the late 18th century through the 19th century to date, the atmosphere has been heating up due to the carbon dioxide trapped in the atmosphere released from the burning of fossil fuels. This has been influencing the climate and weather conditions and the extent of forest fires. However, in recent years, due to overdependence on fossil fuels, the climate and weather conditions have been exacerbated, and this has affected the frequency and severity of lightning strikes and wildfires. That is, due to severe climate and weather conditions caused by climate change, wildfires due to lightning strikes are becoming more frequent. Globally, many forests or wildlands have become highly predisposed to fires due to low precipitation, earlier snow melt, low humidity, strong winds, and high temperatures because of extremely dry and hot weather conditions fueled by climate change or global warming [74]. That is, climate change-induced warm weather, drier conditions, and intense drought have been increasing lightning strikes and the susceptibility of forests to lightning-induced fires.
Because of this, many scholars and other fire protection institutions have sought to explore and understand how changes in the climate and weather conditions influence the rate of recurrence and severity of wildfires. According to the study by Pérez-Invernón et al. [75], long-continuous current lightning greater than 18 ms occurred in thunderstorms that had high relative humidity. Low precipitation rates and high temperatures enhanced lightning-ignition wildfires. Cruz et al. [76] endeavored to understand the influence of the wind speed on wildfires. The effect of wind on the spread rate was examined, and it was found that the forward rate of the fire spread was almost 10% of the average 10 m open wind speed. D’Este et al.’s [77] investigations using the forest in Catalonia, Sardinia, and Apulia showed that the climate conditions influence the severity of forest fires. However, the influence of the climate conditions on forest fires was not as strong as the anthropic effects. Whereas the temperature and wind speed significantly influenced wildfires, the relative humidity effect on the wildfire was lower [27]. According to a study by Mansoor et al. [78], high temperatures increased soil water evaporation, leading to water loss in the soil and facilitating wildfires. Moreover, the study revealed that dry weather conditions reduced the fuel moisture, which caused physiological changes in forest vegetation, leading to wildfires. Jain et al. [79] have looked into the effects of extreme weather conditions on wildfires using fire weather metrics such as the fire weather index, the initial spread index, and the vapor pressure deficit over four decades (1979–2020) in Africa, North and South America, Europe, and Asia. Their results showed that from 1979 to 2020, an increase in extreme weather dramatically increased half of the Earth’s burned area or surface. However, an increase in atmospheric temperatures and a decrease in relative humidity are the main driving forces behind global wildfires. The changes in wind speed and low precipitation have also significantly influenced global wildfires.
Huang et al. [80] also found that low relative humidity, low precipitation, and increased wind speeds caused extreme wildfires. Thus, dry air significantly decreases vegetation moisture, and the strong wind speed accelerates or increases the spread rate or fire propagation. Therefore, the combined effects of dry air, or low relative humidity, and intensified wind speed increase wildfires. Pereira et al. [81] emphasized in their treatise that whereas precipitation, temperature, and relative humidity are the key controlling factors for drying and controlling the moisture content in vegetation, wind speed is the main element that controls fire spread. The weather and climate affect the vegetation at various spatial and temporal scales; therefore, the climate and weather significantly influence the timing of wildfires. The investigations of Mohammadi et al. [82] indicated that as the air temperature increases, vegetation dries quickly due to reduced vegetation moisture, thus expediting vegetation ignition and flammability as well as the burned area of a wildfire. What is more, increased relative humidity and decreased wind speed are beneficial for reduced burned areas. Thus, a decreased wind speed inhibits the spreading rate of the fire and reduces the burned area. Flannigan et al. [83] sought to understand the relationship between the temperature, precipitation, and fuel moisture. An increase in the temperature causes the quick drying of wildland fuel, and the drier fuels are easy to ignite and endure a faster rate of fire spread. Finally, Madadgar et al. [84] asserted that increased temperatures in the summer significantly influence forest vegetation flammability.
In summary, harsh weather and climate conditions significantly influence the initiation of ignition and the survival of wildfires. The drier or warmer the weather, the higher the tendency for the arrival and sustenance of ignition and wildfires. High temperatures promote the ignition and flammability of wildland vegetation and the severity of the fire. Thus, hot or dry weather reduces precipitation and relative humidity, thereby increasing wildfire behavior or survival. A hot and dry summer ensures the quick drying of vegetation and its susceptibility to fire ignition, fire spreading, and fire severity. Recently, because of the changes in weather patterns, there have been increased heatwaves and other climate-related changes; hence, lightning strikes have a higher probability of occurring and initiating wildfires, which will mostly thrive in hot temperatures, low precipitation, and low relative humidity invoked by the changes in the climate. That is, the aggravated climate conditions due to global warming or excessive greenhouse gases have increased droughts, heatwaves, and wildfires globally. Most forest fuels are dried or have less moisture content due to increased drought and hot weather conditions, leading to a high risk of wildfires. It is quite astonishing how the change in the climate and weather conditions has increased the risk of lightning strikes and fires worldwide recently; due to changes in the climate and weather, wildfires that are caused by lightning are staggering. Multifold acres of land have been burned, especially in the hot summer nowadays. Now, climate and weather variations significantly influence the start of big wildfires.
4.3. Topography
Topography refers to the shape of the land, including the height above sea level, slope, steepness of the land, aspect, direction a slope faces, and land features like valleys. These topographies can promote or inhibit the spread of wildfires. A rocky slope can naturally extinguish the fire because of inadequate fuel and reduced bulk density. Also, the arrival and survival of ignition might not be achieved in valleys or drainages if the available fuels are highly moist. The elevation and aspect of the land can also determine the hotness and dryness of a particular region and the risk of wildfire behavior. Additionally, the aspect and elevation influence the water balance on the land [85,86]. A high elevation is drier and colder than a low elevation. Also, a north-facing slope heats up slowly or is more humid [87]. The slope can be used to determine the rate of fire spread. A fire that starts at the bottom of a steep slope will spread quickly upward. That is, the incoming fuel and the rising hot air preheat the fire.
Zhou et al. [88] contended that an increased slope increased the convective and radiative heat flux of a fuel bed and the burning rate of the fuel. Elsewhere, Silvani et al.’s [89] study showed that the slope changed the rate of the fire spread, flame structure, and the rate of heat transfer ahead of the fire. When the slope angle increased from 0 degrees to 20 and 30 degrees, the flame spread rate increased by 3.1 and 7.3, respectively. Therefore, the rate of flame propagation increased when the slope increased. Morandini et al. [90,91] also studied the influence of the slope on the propagation rate of wildfires and found that the increase in the propagation rate of fire due to an increased slope is a result of the significant changes in the fire’s fluid dynamics. The rate of increase in upslope flame propagation is due to an increase in radiant and convective heat flux between the slope and flame. Also, Li et al. [92] examined the upslope effects on fire propagation using experimental analysis. The study revealed that an increased upslope increased the rate of the fire spread, and radiative heat flux was mainly responsible for preheating. Both convective and radiative heat flux mainly preheated the fuel when the slope was less than or equal to 20 degrees and 30 degrees, respectively. Yang et al. [93] investigated the influence of the downslope on wildfire flame propagation using experiments for slopes of −30, −20, and −10 degrees. The fire spread rate first decreased and then increased when the slope increased from 0 to −30 degrees. The radiative heat flux significantly dominated the rate of the fire spread. Lecina-Diaz et al.’s [94] investigations showed that fire was more severe in the northern aspect with steeper slopes. In Weise and Biging’s [70] paper, it was shown that the propagation rate of downslope-heading fires was higher.
In summation, the topography and local environmental conditions influence the behavior of the fuel and the burning process of the fuel. That is, the topography affects the extent of incident solar radiation and the drying rate of the available fuel, thus the rate of loss of moisture from fuels. Moreover, it influences the spread rate of the fire. Generally speaking, an upslope increases the flame propagation rate. Irrespective of its significance in the wildfire evaluations, least is studied about the effects of the topography on wildfires.
Table 2.
Summary of studies on lightning-induced wildfire influential parameters.
Table 2.
Summary of studies on lightning-induced wildfire influential parameters.
| Reference | Driving Parameter | Conclusions |
|---|---|---|
| Fuel conditions | ||
| Anderson [46] | Moisture content | Dry fuel flames propagated faster than live fuels. |
| McAllister and Weiser [61] | Moisture content | Moisture content influenced the burning process, but it is not the best criterion to determine the ignition of live fuels. |
| Viegas et al. [62] | Moisture content | Moisture content was critical for determining the ignition probability and ignition delay of fuels. |
| Engstrom et al. [63] | Moisture content, chemical composition, shapes, and sizes | The leaf size, shape, and chemical composition significantly influenced the ignition of the live fuels. |
| Prince and Fletcher [64] | Moisture content | Internal pressures were higher in more moist fuels. |
| Bianchi et al. [65] | Moisture content | Live conifers (less moist) ignited faster than Patagonian leaves. |
| Podschwit and Cullen [66] | Moisture content | The moisture content of forest vegetation significantly affected lightning ignition. |
| Zhang et al. [14] | Moisture content | The discharge current required to ignite pine needles decreased with decreasing moisture content. |
| Feng et al. [12] | Moisture content | Increased moisture content decreased the grass bed voltage. |
| Dennison and Moritz [9] | Moisture content | Moisture content influenced the heating values of fuels. |
| Sun et al. [57] | Moisture content | Moisture content influenced the heat release rate of fuels. |
| Prat-Guitart et al. [67] | Moisture content and bulk density | Increased moisture content and bulk density decreased fire propagation. |
| Pineda et al. [68] | Moisture content | The moisture content significantly influenced lightning wildfires. |
| Marino et al. [69] | Moisture content and bulk density | The rate of fire spread increased with decreased fuel bulk density and moisture content. |
| Weise and Biging [70] | Moisture | Increased moisture content delayed the burning process and reduced flame length. |
| Dahale et al. [71] | Moisture and bulk density | Higher moisture content slowed down combustion and increased the unburned mass of the fuel. Increased bulk density delayed the combustion of fuel. |
| Weather and climate | ||
| Perez-Invernon et al. [75] | Relative humidity, precipitation, and temperature | Low precipitation and high temperatures increased wildfires. |
| Cruz and Alexander [76] | Wind speed | Increased wind speed increased wildfire severity. |
| D’Este et al. [77] | Temperature | Dry weather conditions increased the severity of wildfires. |
| Collins et al. [27] | Temperature, wind speed, and relative humidity | Temperature and wind speed significantly influenced wildfires. |
| Mansoor et al. [78] | Temperature | Dry weather conditions decreased fuel moisture, leading to physiological changes in forest vegetation and increasing wildfires. |
| Jain et al. [79] | Temperature, relative humidity, and wind speed. | High temperatures, low humidity, and strong wind speed strongly influenced wildfires. |
| Huang et al. [80] | Relative humidity, precipitation, and wind speed. | Wildfires increased with low relative humidity, low precipitation, and increased wind speeds. |
| Pereira et al. [81] | Precipitation, temperature, relative humidity, and wind speed. | Low precipitation, low relative humidity, and high temperature accelerated the ignition and survival of wildfires. Increased wind speed increased the flame spread rate. |
| Mohammadi et al. [82] | Temperature | High temperatures reduced the fuel moisture content and increased its ignition and flammability. |
| Flannigan et al. [83] | Temperature, precipitation, and fuel moisture | Increased temperatures increased the drying of fuels and the ignition probability. |
| Madadgar et al. [84] | Temperature | Increased temperature increased the vegetation’s flammability. |
| Topography | ||
| Zhou et al. [88] | Upslope | Radiative and convective heat increased with increased slope. |
| Silvani et al. [89] | Upslope | The rate of flame spread increased with increased slope. |
| Morandini et al. [90,91] | Upslope | Radiative and convective heat increased with increasing slope, thereby increasing the rate of fire propagation. |
| Li et al. [92] | Upslope | Increased in the slope significantly increased the radiative heat and rate of fire spread. |
| Zhang et al. [93] | Downslope | The downward slope increased radiant heat and fire spread rate. |
| Lecina-Diaz et al. [94] | Upslope | Upslope fires were more severe. |
| Weise and Biging [70] | Downslope | The rate of fire spreading was higher for downward-heading fires. |
5. Lightning-Induced Wildfire Modeling Studies
5.1. Lightning-Induced Wildfire Modeling Methods
In this section, some of the methods used to analyze lightning-induced wildfire occurrences are briefly discussed. Generally, wildfire occurrences and forecasting in different geographical locations are mostly analyzed using satellite-recorded data. The satellite data are mainly processed and evaluated using statistical analysis. Different statistical analyses are used depending on the accuracy of the method and the author’s preference. Numerous models have been developed to analyze wildfires, including quantitative and qualitative statistical models, Bayesian-based models, time-series tests, linearity models, etc. [95,96]. The models mostly use regression analysis to evaluate the occurrence of wildfires. Although classical or traditional statistical methods have been long used to analyze wildfires, recently, advanced technologies such as machine-learning and artificial intelligence techniques have been incorporated into classical statistical models to accurately and effectively determine and forecast wildfires [97,98,99,100,101,102,103]. Some of the machine-learning and artificial intelligence techniques include support vector machine classifier, random forests, multilayer perception neural network, neuro-fuzzy models, etc. [104,105,106,107,108,109]. These models have their advantages and disadvantages. For instance, the support vector machine can use a small dataset to predict wildfire incidences and produce high-accuracy results [95]. Some researchers in the fire science community have also contended that the accuracy of the random forest model is higher [104]. That is, the random forest model can simulate complex interactions between input models, and it is efficient for large datasets. In summary, factors such as the fire weather conditions and topography are considered inputs in these various models to predict wildfires. However, in recent years, deep-learning methods have mostly been used by the forest and fire science communities to investigate wildfires due to their high accuracy.
5.2. Lightning-Induced Investigations
Recently, there has been a lot of focus on assessing and understanding lightning-induced wildfires. Researchers thus endeavored to model or investigate lightning-induced fires at different geographical locations using different modeling techniques. These studies were aimed at investigating and understanding the prevalence of lightning-induced fires in various geographical settings and how such wildfires can be managed. Here, some of these studies in the different geographical regions are presented and discussed. The studies were conducted using satellite-recorded data over a period, and the various models discussed in Section 5.1 were used to analyze the data. The discussions focus on the different lightning-caused investigations in South and North America, Europe, Asia, and Australia.
5.2.1. South and North America
Schumacher et al. [23] used satellite-detected or recorded data to study lightning-induced fires in Central Brazil within the span of 4 years, i.e., from 2015 to 2019. The cloud-to-ground and cloud-to-ground dry-lightning recorded data were used for the investigations. Meteorological characteristics, polarity, and peak current of lightning were used to simulate lightning-induced forest fires. As the findings revealed, low precipitation, moderate relative humidity, high temperatures, and low wind speed influenced the lightning-caused forest fires in Central Brazil. Forest fires occurred due to cloud-to-ground dry lightning when the precipitation was less than 1 mm and the relative humidity was lower, whereas the reverse was true for cloud-to-ground lightning-caused forest fires. The lightning current intensity for ignition was lower than 20 kA. The author’s results contradicted the idea that negative lightning strikes are less likely to cause ignition. That is, they observed that negative lightning strokes can cause active ignition and lightning-induced fires. Menezes and collaborators [110] looked into the lightning-caused fires in the Pantanal wetland in Brazil. Remote sensing data like VIIRS active fires, MODIS burned areas, and STARNET lightning observations from 2001 to 2017 were used in the research. Although it was found that the highest lightning occurred in December to February (summer) and the lowest in June to August (winter), lightning strikes caused only 5% of the fires. Therefore, lightning-induced fires were minimal in the Pantanal wetland. Pinto Neto et al. [111] evaluated the lightning-caused fires in the Mato Grosso and Amazonas states of Brazil using wavelet analysis. It was accentuated that 26,554 fires and nearly 3 million cloud-to-ground lightning flashes occurred at Mato Grosso in the first four months of 2022, whereas 2468 fires and 3.4 million cloud-to-ground lightning occurred at the Amazonas in the same first four months of 2022. However, in 2021, 16,844 fires and almost 2.7 million cloud-to-ground lightning flashes occurred at Mato Grosso, and 1258 fires and 3.2 million cloud-to-ground lightning flashes occurred at Amazonas. Human-caused fires influence lightning-induced fires via the aerosol–cloud particle interaction.
Veraverbeke et al.’s [20] modeling studies on lightning-induced fires in North American boreal forests indicated that 55% of the forest fires that were caused by lightning ignition were closely aligned with the precipitation and temperature. Moreover, it was projected that the convective mass flux of the studied region might increase by 2050–2074, which will result in frequent lightning strikes and probably lightning-caused fires. Evett et al. [112] investigated the influence of moisture on lightning fire ignitions in southwestern North America (Arizona and New Mexico) using 16 years of lightning flashing, relative humidity, and precipitation data from a 34,800 square kilometer area. The tendency for lightning flash ignition was strongly correlated to the minimum relative humidity for a day in the form of a power law, which ranged from 0.023 on days with the least humidity to <0.0001 on days of high humidity. Furthermore, the number of lightning fires observed per day was strongly aligned with the minimum relative humidity for a day in log-normal distribution, which peaked at 4.09 fires per day at 22.1% of a day’s minimum relative humidity. When the area burned per day was correlated with the daily minimum relative humidity in log-normal form, it peaked at 53.7 ha per day at 16.5% for the daily minimum relative humidity. Hessilt et al. [113] also investigated lightning-induced fires in Alaska, the U.S.A., and the Northwest Territories, Canada, between 2001 and 2018. The denser forest areas were susceptible to lightning fires. The changes in the vegetation and fire weather enhanced the lightning efficiency by 14 ± 9% in Alaska and 31 ± 28% in the Northwest Territories. Krawchuk and Cumming [114] simulated the lightning wildfires in western Canada’s boreal forest regions from 1994 to 2001. Their model showed that standing harvest residuals act as a channel for lightning to strike harvested stands, where there is enough dry and fine fuel to combust. Calef et al. [115] studied wildfire occurrences in Alaska from 1943 to 2016, as shown in Figure 9. The lightning-induced forest and burned areas in Alaska were high and have increased over the years.

Figure 9.
Lightning-ignition wildfires in interior Alaska from 1943 to 2016 [115]. (a) is the annual burned area, and (b) is the number of annual fire ignitions.
MacNamara et al. [116] analyzed the lightning-induced wildfires in western U.S.A. from May to October 2017. They used satellite-recorded information to perform the analysis and aimed to examine the lightning flash density, polarity, 2 min rainfall rate, and 24 h precipitation at the location of the lightning flash that initiates the fire. Also, they sought to understand the precipitation rate at the onset of a lightning flash. The study disclosed that negative cloud-to-ground lightning flashes caused 89% of the forest fires. However, single-stroke flashes triggered 66% of the fire. Li et al. [117] examined the lightning-ignition fires in western U.S.A. national forests and parks in the mid- and late 21st century. They modeled the smoke pollution emitted by lightning-induced fires. The researchers found that in the late 21st century, lightning-ignition wildfire smoke increased by almost 53%. About 93% of lightning fires occurred in Alberta, and there were frequent wildfires with high- and low-frequency lightning [118]. Cha et al. [118] argued that 94% of the annual lightning that occurred in Alberta, Canada, was during the warm months; hence, this could increase lightning-ignition wildfires in that area. The wildfire modeling investigations in California reported by Chen and Jin [119] showed that lightning-caused fires were larger in the Sierra Nevada and North Interior. Also, as reported by Coogan et al. [120], lightning wildfires increased from 1959 to 2018. The number of days with lightning-induced fires also increased. Nonetheless, lightning-ignition wildfires were predominant in the boreal Shield West. Abatzoglou et al. [121] investigated the controls on the interannual variability in lightning wildfires in western U.S.A. from 1992 to 2013. They reported that overall, lightning caused 40% of the wildfires and contributed to 69% of the burned area. As shown in Figure 10, lightning ignited most of the wildland. However, in western U.S.A., lightning ignited 54% and 61% of the wildfires in July and August, respectively. Also, lightning ignited 19%, 35%, and 40% of the wildfires in April, May, and September, respectively.
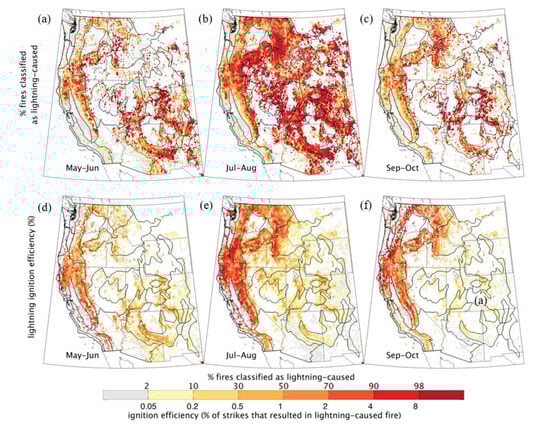
Figure 10.
Lightning-ignition fires in western U.S.A from 1992 to 2013 [121]. (a–c) represent the percent of lightning-induced fires, and (d–f) is the lightning ignition efficiency.
Pérez-Invernón et al. [122] also studied global lightning wildfires. They analyzed 5858 lightning-ignited wildfires. By using the 10 km radius and 14-day spatiotemporal criteria, lightning caused 90% of the wildfires. Furthermore, the study showed a future increase in lightning strikes on the west coast of North America, indicative of possible frequent lightning-ignited forest fires in this geographical location. A different study by Pérez-Invernón et al. [75] showed that the lightning-ignition efficiency was high in coniferous forests like Arizona and New Mexico ponderosa pine. Using extensive data from 1897 to 2017, Fill et al. [123] investigated lightning-caused wildfires in southeast U.S.A. According to Fill et al., the dry season in southeast U.S.A. has increased by 156 days, or almost 130%, over 120 years. This has increased lightning-ignited wildfires and wildfire risks. Prestemon et al.’s [124] investigations on lightning wildfires in the southeast of the U.S.A. also indicated that the median annual burned area due to lightning strikes will increase by 34% by the years 2056–2060 when compared to the years 2016–2020. Schultz et al. [116] sought to understand all the lightning-initiated wildfires reported in the U.S.A. from 2012 to 2015. They analyzed 1158 lightning-started wildfires. Negative cloud-to-ground flashes contributed to 90% of the wildfires, whereas positive cloud-to-ground flashes caused 10% of the wildfires. According to the fixed and fire search analyses, 81–88% of the wildfires corresponded to lightning flashes within 14 days. Moreover, most of the lightning flash densities were lower than 0.41 flashes km−2. As reported by Brey et al. [125] in Figure 11, the lightning-ignition wildfires between 1992 and 2015 in the western region of the U.S.A. were higher than the lightning-induced wildfires that occurred in the southeast region of the U.S.A.
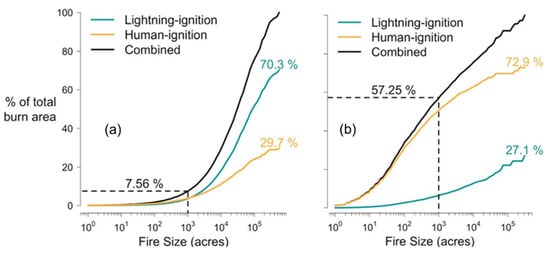
Figure 11.
Wildfires in the western and southeastern parts of the U.S.A. [125]. In (a), approximately 70.3% and 29.7% of the burned area were caused by lightning and human ignitions, respectively, in the western part of the U.S.A. In (b), almost 27.1% and 72.9% of the burned area were caused by lightning and human ignitions, respectively, in the southeastern part of the U.S.A.
Aftergood and Flannigan [126] examined the lightning-caused fires in western Canada over 38 years, that is, from 1981 to 2018. They aimed to identify the areas in western Canada that experience continuous lightning fire clustering events. Northern Alberta, some parts of Saskatchewan, and British Columbia had persistent lightning fire clustering activity, with an increase in the clustering of lightning wildfires in northern Alberta. The clustering of lightning was observed in August and July in British Columbia and June and July in northern Alberta. In their study on the wildfires in Canada from 1959 to 2018, Coogan et al. [120] contended that lightning-ignition fires in Canada peaked from June to August (summer) when temperatures were high, and the weather was warmer.
5.2.2. Europe
Pineda et al. [47,68,127,128] have performed several studies to understand the lightning-induced wildfires in Catalonia. In this study [68], the authors found that conifer forests covered half of the burned area. These researchers [68] also observed that 80% of the wildfires that occurred in Catalonia occurred from June to September (summer). Therefore, the holdover duration of lightning wildfires was prolonged in the late afternoon. In Pineda et al. [47], 500 lightning-ignition datasets from 2004 to 2009 were utilized for the analysis. It was ascertained that the holdover time was shorter when the lightning flashes occurred in weather conditions suitable to cause wildfires. Moreover, evening and night ignitions smolder until the next day. In Pineda et al.’s paper [127], they reported that, whereas 25% of the lightning-ignited wildfires had no precipitation, 40% and 90% had less than 2 mm and 10 mm of precipitation, respectively. Also, holdover fires were scarcely detected in this study, and there was no relationship between the holdover duration and the concentration of precipitation. Furthermore, after analyzing 870 lightning-caused wildfires between 2005 and 2020, Pineda et al. [128] observed that synoptic weather conditions with a short-wave trough at 500 hPa mainly caused the lightning wildfires.
Ordóñez et al. [129] used the spatial linear model to investigate lightning-induced wildfires in Leon, in the northwest of Spain. They used 78,256 lightning strike data in their analysis. Lightning-induced wildfires mostly occurred in the east and west of the province. Nevertheless, the altitude in the region did not significantly influence the lightning-caused wildfires. Likewise, the topography did not sustain the lightning-induced fires, but wooded areas and dry-storm days significantly influenced the survival of the lightning-caused fires. The positive lightning strikes caused the wildfires. Amatulli et al.’s [102] studies on the prediction of lightning-induced wildfires in the region of Aragon in the northeast of Spain over 19 years indicated that lightning-caused fires were few in that region. The lightning-caused wildfires occurred in large wildland patterns. The lightning-caused wildfires occurred mostly in mountainous areas. The fuel characteristics, including moisture and bio/necro-mass, significantly influenced lightning-induced wildfires. Vecín-Arias et al. [28] assessed the lightning-induced wildfires in the central plateau of the Iberian Peninsula in Spain using logistic regression and random forest analysis. Whereas lightning-induced wildfires decreased with increased altitudes, lightning-caused wildfires increased with the percentage of coniferous and mixed woodlands as well as the mean peak current of negative cloud-to-ground lightning flashes.
Müller et al.’s [130] data analysis of lightning strikes in Austria showed that lightning strikes caused 15% of wildfires. The lightning-induced fires mostly occurred in the summer. Approximately 40% of the lightning-induced fires occurred from June to August. The lightning-caused fires were predominant in the south and east of Austria. The lightning fires mostly occurred in areas with higher altitudes, owing to frequent thunderstorms and enhanced lightning density. Müller and Vacik [131] studied lightning-induced wildfires in Austria. They analyzed 351 lightning-induced wildfires using lightning strength, polarity, and multiplicity as the evaluation indices. The burned area or surface was larger when the lightning strikes ignited the vegetation during the daytime or hours. Also, lightning-induced fires were dominant at higher altitudes with southerly or western exposition. Moris and his research team [132] used 267 lightning-induced wildfire data reports from 2000 to 2018 in Switzerland to understand the relationship between lightning and natural wildfires. Most of the lightning was detected within 1 km of the starting point of the fire and before 24 h. Positive lightning strikes mostly contributed to the ignition of the forest. Sari’s [133] study of Turkey’s Mediterranean coast wildfires showed that 30.2% of the wildfires in that area were caused by lightning strikes.
5.2.3. Asia and Australia
Liu et al. [17] investigated the wildfire trend in the boreal forest of northeast China from 1965 to 2009 using satellite-recorded data. The writers aspired to understand the factors that influence lightning wildfires in the boreal forest. Nonetheless, lightning fires were higher in coniferous forests than in meadow forests. Also, lightning fires occurred frequently on the ridgetop. The overall conclusions of the study asserted that the key contributing factors to the lightning wildfires in the boreal forest were the type of vegetation and its moisture content, lightning intensity, slope, and temperature. Zong et al. [134] used the k-means algorithm to evaluate satellite-recorded data from 2000 to 2020 to determine the frequency of lightning-induced wildfires in China. Most of the wildfires occurred in the southern part of China; however, lightning strikes triggered 4.3% of the total number of wildfires. The Great Xing’an Mountains in Inner Mongolia are one of the most wildfire-prone areas in China; because of that, researchers have sought to understand lightning-induced wildfires in this region. Considering this, Zhang et al. [135] showed that lightning-caused wildfires were frequent from June to August in the Great Xing’an Mountains of Inner Mongolia. The air moisture content, slope, maximum surface air temperature, wind direction, and surface pressure significantly dictated the occurrence of lightning-induced wildfires. Also, the study by Hu et al. [136] used simple linear regression and second-order polynomial regression to investigate lightning-induced wildfires in the same Great Xing’an Mountains. The lightning-induced wildfires in this region have increased over time; however, the climate condition is the main cause of the increase in lightning-caused wildfires in this area. Using statistical analysis, Touge et al. [94] studied the lightning-caused wildfires in Japan. They analyzed 55,863 wildfires for a total burned area of 289.91 km2 from 1995 to 2020. The study findings revealed that lightning strikes caused only 1.23% of the wildfires.
Bates et al. [137] evaluated the lightning-strike ignition wildfires in the Warren region of Australia from 1976 to 2016. In total, 76% of the lightning strikes that ignited trees were on or close to trees. The study observed seasonal cycles and long-term patterns in lightning ignitions. Bates et al. [138] used the Bayesian network as a framework to assess climate variability in lightning-induced wildfires, and unlike the lightning ignitions, the climate modes were allied to the fire weather conditions. Dorph et al.’s [139] study in Victoria, Australia, also indicated that lightning-caused wildfires are steered by weather conditions. Clarke et al. [140] developed fire models to investigate lightning-induced wildfires in southeastern Australia, specifically Victoria, South Australia, and Tasmania. The fire weather conditions were incorporated into the model, and they constituted 57% of the lightning-ignition wildfires. Whereas 157 lightning ignitions were detected in South Australia, 472 lightning ignitions were recorded in Tasmania. In addition, the frequency of lightning-induced ignitions in Tasmania was 1.4%, 2.9% in South Australia, and 11% in Victoria. Moreover, the topography and elevation influenced the probability of lightning ignitions in the study areas. Also, Read et al. [26] studied the lightning-induced wildfires in Victoria, Australia, by fitting logistic regression models. They used lightning-strike data from February 2009 and 2010, and January 2011. Although the logistic regression could not predict well the occurrence of wildfires by lightning strikes in their research, a significant number of wildfires in Victoria were caused by lightning ignitions. Nampak et al. [141] studied lightning-induced wildfires in southeast Australia from January 2011 to June 2019. The study revealed that the annual number of lightning strikes and the ratio of negative to positive lightning were different between the years. However, lightning ignitions were found to be 70%. Lightning ignitions mostly occurred in the summer; the average lightning-ignition efficiency was 0.24% ignition per lightning stroke.
In short, various studies in different geographical locations have shown that lightning significantly contributes to the number of wildfires. Lightning-caused fires are due to severe changes in the climate and weather. The lightning-flash intensity and efficiency have increased with changes in the weather and climate in various locations, leading to severe wildfires. Though recorded lightning-ignited fire datasets have been used to simulate lightning-induced fires to assess the severity of the fires, the various works studied the severity without suggesting mitigation measures to reduce lightning-strike wildfires. Table 3 summarizes lightning wildfire studies in different geographical areas.
Table 3.
Summary of studies on lightning-induced wildfire influential parameters in different geographical areas.
6. Conclusions
Lightning-induced fires occur globally, and they can disturb the ecosystem and cause property and financial loss. Lightning-ignited wildfires are responsible for the majority of burned areas globally, yet the lightning-ignition mechanism is barely understood. This brief review assessed lightning-induced wildfires by analyzing studies on lightning-ignition wildfires. The modeling of lightning flash ignition in the laboratory was reviewed. Lightning strikes with long-continuous and short currents can initiate wildfires. Although it is deemed that lightning strikes with long-continuous currents have the highest possibility of igniting forest fuels, little has been conducted to better understand the physical behavior and mechanism of lightning ignition. Therefore, much more has to be conducted in terms of experimental analysis, and the experimental results have to be benchmarked with satellite-recorded lightning datasets for a better understanding. Fuel conditions like the chemical composition, moisture content, shape and size, or bulk density of the fuel influence the rate of ignition when lightning strikes. Also, meteorological conditions such as the wind speed, temperature, precipitation, and humidity are essential for the initiation of lightning-strike fires and their sustenance. Furthermore, the shape of the land affects the lightning threshold, drying of available fuel, and the extent to which ignition can occur; lands with upslope topography mostly enhance the flaming of the fire and its spreading. Although the fuel conditions, weather and climate conditions, and topography significantly influence lightning-induced wildfires, the sensitivity of lightning-induced fires to these conditions has to be well understood for different geographical locations. Also, lightning-induced wildfire studies mainly analyze the occurrence of lightning ignition either by negative lightning strikes or positive strikes. However, there are barely any investigations into the controlling measures that can be implemented to reduce lightning-induced wildfires. Moreover, some scholars argue that positive lightning strikes are mainly responsible for the ignition of wildfires; on the other hand, different research groups contend that negative lightning strikes cause forest vegetation fires. These two lightning strikes should be well investigated to elucidate the main lightning strike that causes wildfires. Lastly, the insight gained from this review can be used to further study lightning-ignition wildfires and understand them to devise resilient long-term wildfire control strategies.
Author Contributions
Conceptualization, F.O., C.X. and Y.S.; methodology, F.O.; resources, Y.S. and C.X.; data curation, F.O.; writing—F.O.; writing—review and editing, F.O., X.L. and C.X.; visualization, X.L. and C.X.; supervision, C.X.; project administration, C.X. and Y.S.; funding acquisition, Y.S. All authors have read and agreed to the published version of the manuscript.
Funding
This research was funded by the National Natural Science Foundation of China Research Fund for International Young Scientists (52350410458), Zhejiang Provincial Natural Science Foundation of China (LZ23E060002), National Natural Science Foundation of China (52076010), and Ningbo Major Science and Technology Project (20212ZDYF020041).
Conflicts of Interest
The authors declare no conflicts of interest.
References
- Fisher, R.J.; Schnetzer, G.H.; Thottappillil, R.; Rakov, V.A.; Uman, M.A.; Goldberg, J.D. Parameters of triggered-lightning flashes in Florida and Alabama. J. Geophys. Res. 1993, 98, 22887–22902. [Google Scholar] [CrossRef]
- Conedera, M.; Cesti, G.; Pezzatti, G.; Zumbrunnen, T.; Spinedi, F. Lightning-induced fires in the Alpine region: An increasing problem. For. Ecol. Manag. 2006, 234, S68. [Google Scholar] [CrossRef]
- Flannigan, M.D.; Wotton, B.M. Lightning-ignited forest fires in northwestern Ontario. Can. J. For. Res. 1991, 21, 277–287. [Google Scholar] [CrossRef]
- Scott, A.C. The Pre-Quaternary history of fire. Palaeogeogr. Palaeoclimatol. Palaeoecol. 2000, 164, 281–329. [Google Scholar] [CrossRef]
- Kauf, Z. Testing Vegetation Flammability: Examining Seasonal and Local Differences in Six Mediterranean Tree Species. Ph.D. Thesis, University of Hohenheim, Stuttgart, Germany, 2016. [Google Scholar]
- Couto, F.T.; Iakunin, M.; Salgado, R.; Pinto, P.; Viegas, T.; Pinty, J.-P. Lightning modelling for the research of forest fire ignition in Portugal. Atmos. Res. 2020, 242, 104993. [Google Scholar] [CrossRef]
- Rodríguez-Pérez, J.R.; Ordóñez, C.; Roca-Pardiñas, J.; Vecín-Arias, D.; Castedo-Dorado, F. Evaluating lightning-caused fire occurrence using spatial generalized additive models: A case study in central Spain. Risk Anal. 2020, 40, 1418–1437. [Google Scholar] [CrossRef] [PubMed]
- Canadell, J.G.; Meyer, C.P.; Cook, G.D.; Dowdy, A.; Briggs, P.R.; Knauer, J.; Pepler, A.; Haverd, V. Multi-decadal increase of forest burned area in Australia is linked to climate change. Nat. Commun. 2021, 12, 6921. [Google Scholar] [CrossRef] [PubMed]
- Dennison, P.E.; Moritz, M.A. Critical live fuel moisture in chaparral ecosystems: A threshold for fire activity and its relationship to antecedent precipitation. Int. J. Wildland Fire 2009, 18, 1021–1027. [Google Scholar] [CrossRef]
- Malamud, B.D.; Millington, J.D.A.; Perry, G.L.W. Characterizing wildfire regimes in the United States. Proc. Natl. Acad. Sci. USA 2005, 102, 4694–4699. [Google Scholar] [CrossRef]
- Shu, Y.; Shi, C.; Yi, B.; Zhao, P.; Guan, L.; Zhou, M. Influence of climatic factors on lightning fires in the primeval forest region of the Northern Daxing’an Mountains, China. Sustainability 2022, 14, 5462. [Google Scholar] [CrossRef]
- Feng, J.; Liang, D.; Shen, H. Experimental analysis of artificial lightning breakdown and ignition characteristics in grassland. Theor. Appl. Clim. 2020, 141, 817–825. [Google Scholar] [CrossRef]
- Jiao, Q.; Fan, M.; Tao, J.; Wang, W.; Liu, D.; Wang, P. Forest fire patterns and lightning-caused forest fire detection in Heilongjiang Province of China using satellite data. Fire 2023, 6, 166. [Google Scholar] [CrossRef]
- Zhang, H.; Qiao, Y.; Chen, H.; Liu, N.; Zhang, L.; Xie, X. Experimental study on flaming ignition of pine needles by simulated lightning discharge. Fire Saf. J. 2021, 120, 103029. [Google Scholar] [CrossRef]
- Yang, Y.; Song, D.; Wang, S.; Li, P.; Xu, Y. Characteristics of cloud-to-ground lightning and its relationship with climate change in Muli, Sichuan province, China. Nat. Hazards 2018, 91, 1097–1112. [Google Scholar] [CrossRef]
- Feng, J.; Shen, H.; Liang, D. Experimental study on artificial lightning ignition phenomenon and model of the fuel bed. Int. J. Wildland Fire 2021, 30, 720–731. [Google Scholar] [CrossRef]
- Liu, Z.; Yang, J.; Chang, Y.; Weisberg, P.J.; He, H.S. Spatial patterns and drivers of fire occurrence and its future trend under climate change in a boreal forest of Northeast China. Glob. Chang. Biol. 2012, 18, 2041–2056. [Google Scholar] [CrossRef]
- Barros, A.M.; Day, M.A.; Preisler, H.K.; Abatzoglou, J.T.; Krawchuk, M.A.; Houtman, R.; Ager, A.A. Contrasting the role of human- and lightning-caused wildfires on future fire regimes on a Central Oregon landscape. Environ. Res. Lett. 2021, 16, 064081. [Google Scholar] [CrossRef]
- NFPA, Lightning Fires and Lightning Strikes. 2013. Available online: www.nfpa.org/osds (accessed on 1 June 2023).
- Veraverbeke, S.; Rogers, B.M.; Goulden, M.L.; Jandt, R.R.; Miller, C.E.; Wiggins, E.B.; Randerson, J.T. Lightning as a major driver of recent large fire years in North American boreal forests. Nat. Clim. Chang. 2017, 7, 529–534. [Google Scholar] [CrossRef]
- Wotton, B.M.; Martell, D.L. A lightning fire occurrence model for Ontario. Can. J. For. Res. 2005, 35, 1389–1401. [Google Scholar] [CrossRef]
- Ramos-Neto, M.B.; Pivello, V.R. Lightning fires in a Brazilian Savanna National Park: Rethinking management strategies. Environ. Manag. 2000, 26, 675–684. [Google Scholar] [CrossRef]
- Schumacher, V.; Setzer, A.; Saba, M.M.; Naccarato, K.P.; Mattos, E.; Justino, F. Characteristics of lightning-caused wildfires in central Brazil in relation to cloud-ground and dry lightning. Agric. For. Meteorol. 2022, 312, 108723. [Google Scholar] [CrossRef]
- National Interagency Fire Center, Lightning-Caused and Human-Caused Fires and Acres Lightning Fires. 2023. Available online: https://www.nifc.gov/ (accessed on 23 June 2023).
- Egloff, B. Lightning strikes: Rethinking the nexus between Australian Indigenous land management and natural forces. Aust. For. 2017, 80, 275–285. [Google Scholar] [CrossRef]
- Read, N.; Duff, T.J.; Taylor, P.G. A lightning-caused wildfire ignition forecasting model for operational use. Agric. For. Meteorol. 2018, 253–254, 233–246. [Google Scholar] [CrossRef]
- Collins, K.M.; Penman, T.D.; Price, O.F. Some Wildfire Ignition Causes Pose More Risk of Destroying Houses than Others. PLoS ONE 2016, 11, e0162083. [Google Scholar] [CrossRef]
- Vecín-Arias, D.; Castedo-Dorado, F.; Ordóñez, C.; Rodríguez-Pérez, J.R. Biophysical and lightning characteristics drive lightning-induced fire occurrence in the central plateau of the Iberian Peninsula. Agric. For. Meteorol. 2016, 225, 36–47. [Google Scholar] [CrossRef]
- Nieto, H.; Aguado, I.; García, M.; Chuvieco, E. Lightning-caused fires in Central Spain: Development of a probability model of occurrence for two Spanish regions. Agric. For. Meteorol. 2012, 162–163, 35–43. [Google Scholar] [CrossRef]
- RedZone. Wildfires Rage across South Africa’s Cape Town after Massive Winter Storm. Available online: https://www.redzone.co/2017/06/08/south-africa-winter-storm-wildfires/ (accessed on 1 August 2023).
- Etherington, T.R.; Perry, G.L. Spatially adaptive probabilistic computation of a sub-kilometre resolution lightning climatology for New Zealand. Comput. Geosci. 2017, 98, 38–45. [Google Scholar] [CrossRef]
- Rakor, V.A. Lightning; the science. In Lightning: Science; Engineering, and Economic Implications for Developing Countries; Springer Singapore: Singapore, 2020; pp. 1–35. [Google Scholar]
- Byard, R.W. Thunderstorm mortality: Issues of medicolegal concern. Med. Sci. Law 2023, 63, 334–336. [Google Scholar] [CrossRef] [PubMed]
- Coughlan, R.; Di Giuseppe, F.; Vitolo, C.; Barnard, C.; Lopez, P.; Drusch, M. Using machine learning to predict fire-ignition occurrences from lightning forecasts. Meteorol. Appl. 2021, 28, e1973. [Google Scholar] [CrossRef]
- Baba, Y.; Rakov, V.A. Present understanding of the lightning return stroke. In Lightning: Principles, Instruments and Applications; Springer: Singapore, 2009; pp. 1–20. [Google Scholar]
- Tran, M.D.; Rakov, V.A. Initiation and propagation of cloud-to-ground lightning observed with a high-speed video camera. Sci. Rep. 2016, 6, 39521. [Google Scholar] [CrossRef] [PubMed]
- Hare, B.M.; Scholten, O.; Dwyer, J.; Trinh, T.N.G.; Buitink, S.; ter Veen, S.; Bonardi, A.; Corstanje, A.; Falcke, H.; Hörandel, J.R.; et al. Needle-like structures discovered on positively charged lightning branches. Nature 2019, 568, 360–363. [Google Scholar] [CrossRef] [PubMed]
- Anderson, K. Lightning-caused fire occurrences: An overview. In Proceedings of the 6th Western Region Fire Weather Committee Scientific and Technical Seminar, Edmonton, Alberta, 23 March 1992; pp. 27–43. [Google Scholar]
- Latham, D.; Williams, E. Lightning and forest fires. In Forest Fires; Academic Press: Cambridge, MA, USA, 2001; pp. 375–418. [Google Scholar]
- Podur, J.; Martell, D.L.; Csillag, F. Spatial patterns of lightning-caused forest fires in Ontario, 1976–1998. Ecol. Model. 2003, 164, 1–20. [Google Scholar] [CrossRef]
- Wang, J.; Li, Q.; Wang, J.; Cai, L.; Su, R.; Zhou, M.; Fan, Y. Two successive bidirectional leaders propagated in triggered lightning channel. Sci. Rep. 2022, 12, 9235. [Google Scholar] [CrossRef] [PubMed]
- Lowke, J.J.; Szili, E.J. Toward a theory of ‘stepped-leaders’ in lightning. J. Phys. D Appl. Phys. 2023, 56, 045201. [Google Scholar] [CrossRef]
- Ding, Z.; Rakov, V.A. Toward a better understanding of negative lightning stepped leaders. Electr. Power Syst. Res. 2022, 209, 108043. [Google Scholar] [CrossRef]
- Shi, D.; Wang, D.; Wu, T.; Takagi, N. Correlation between the first return stroke of negative CG lightning and Its preceding discharge processes. J. Geophys. Res. Atmos. 2019, 124, 8501–8510. [Google Scholar] [CrossRef]
- Kašpar, P.; Kolmašová, I.; Santolík, O. Model of the First Lightning Return Stroke Using Bidirectional Leader Concept. J. Geophys. Res. Atmos. 2022, 127, e2022JD037459. [Google Scholar] [CrossRef]
- Anderson, K. A model to predict lightning-caused fire occurrences. Int. J. Wildland Fire 2002, 11, 163. [Google Scholar] [CrossRef]
- Pineda, N.; Montanyà, J.; van der Velde, O.A. Characteristics of lightning related to wildfire ignitions in Catalonia. Atmos. Res. 2014, 135–136, 380–387. [Google Scholar] [CrossRef]
- Huang, H.; Wang, D.; Wu, T.; Takagi, N. Progression features of dart leaders in natural negative cloud-to-ground lightning flashes. J. Geophys. Res. Atmos. 2019, 124, 11143–11154. [Google Scholar] [CrossRef]
- Su, R.; Wang, J.; Cai, L.; Zhou, M.; Fan, Y.; Cao, J.; Wang, F.; Wang, J. Characteristics of dart leader and attempted leader in a triggered lightning. Electr. Power Syst. Res. 2023, 214, 108812. [Google Scholar] [CrossRef]
- Fuquay, D.M.; Baugham, R.G.; Latham, D.J. A Model for Predicting Lightning-Fire Ignition in Wildland Fuels. 1979. Available online: https://digitalcommons.usu.edu/govdocs_wfires (accessed on 1 August 2023).
- Fuquay, D.M.; Taylor, A.R.; Hawe, R.G.; Schmid, C.W. Lightning discharges that caused forest fires. J. Geophys. Res. 1972, 77, 2156–2158. [Google Scholar] [CrossRef]
- Larjavaara, M.; Pennanen, J.; Tuomi, T. Lightning that ignites forest fires in Finland. Agric. For. Meteorol. 2005, 132, 171–180. [Google Scholar] [CrossRef]
- Darveniza, M.; Zhou, Y. Lightning-initiated fires: Energy absorbed by fibrous materials from impulse current arcs. J. Geophys. Res. 1994, 99, 10663–10670. [Google Scholar]
- Latham, D.J.; Schlieter, J.A. Ignition Probabilities of Wildland Fuels Based on Simulated Lightning Discharges; Forgotten Books: London, UK, 1989. [Google Scholar]
- Zhang, H.; Guo, P.; Chen, H.; Liu, N.; Qiao, Y.; Xu, M.; Zhang, L. Lightning-induced smoldering ignition of peat: Simulation experiments by an electric arc with long continuing current. Proc. Combust. Inst. 2023, 39, 4185–4193. [Google Scholar] [CrossRef]
- Feng, J.; Shen, H.; Liang, D. Investigation of lightning ignition characteristics based on an impulse current generator. Ecol. Evol. 2019, 9, 14234–14243. [Google Scholar] [CrossRef]
- Sun, L.; Zhou, X.; Mahalingam, S.; Weise, D.R. Comparison of burning characteristics of live and dead chaparral fuels. Combust. Flame 2006, 144, 349–359. [Google Scholar] [CrossRef]
- Tihay-Felicelli, V.; Santoni, P.-A.; Barboni, T.; Leonelli, L. Autoignition of Dead Shrub Twigs: Influence of Diameter on Ignition. Fire Technol. 2016, 52, 897–929. [Google Scholar] [CrossRef]
- Ahmad, A.D.; Abubaker, A.M.; Salaimeh, A.; Akafuah, N.K.; Finney, M.; Forthofer, J.M.; Saito, K. Ignition and burning mechanisms of live spruce needles. Fuel 2021, 304, 121371. [Google Scholar] [CrossRef]
- Grootemaat, S.; Wright, I.J.; van Bodegom, P.M.; Cornelissen, J.H.C.; Cornwell, W.K. Burn or rot: Leaf traits explain why flammability and decomposability are decoupled across species. Funct. Ecol. 2015, 29, 1486–1497. [Google Scholar] [CrossRef]
- McAllister, S.; Weise, D.R. Effects of season on ignition of live wildland fuels using the forced ignition and flame spread test apparatus. Combust. Sci. Technol. 2017, 189, 231–247. [Google Scholar] [CrossRef]
- Viegas, D.X.; Almeida, M.; Raposo, J.; Oliveira, R.; Viegas, C.X. Ignition of Mediterranean fuel beds by several types of firebrands. Fire Technol. 2014, 50, 61–77. [Google Scholar] [CrossRef]
- Engstrom, J.D.; Butler, J.K.; Smith, S.G.; Baxter, L.L.; Fletcher, T.H. Ignition behavior of live California Chaparal leaves. Combust. Sci. Tech 2004, 176, 1577–1591. [Google Scholar] [CrossRef]
- Prince, D.R.; Fletcher, T.H. Differences in burning behavior of live and dead leaves, Part 1: Measurements. Combust. Sci. Technol. 2014, 186, 1844–1857. [Google Scholar] [CrossRef]
- Bianchi, L.O.; Oddi, F.J.; Muñoz, M.; Defossé, G.E. Comparison of leaf moisture content and ignition characteristics among native species and exotic conifers in Northwestern Patagonia, Argentina. For. Sci. 2018, 65, 375–386. [Google Scholar] [CrossRef]
- Podschwit, H.; Cullen, A. Patterns and trends in simultaneous wildfire activity in the United States from 1984 to 2015. Int. J. Wildland Fire 2020, 29, 1057–1071. [Google Scholar] [CrossRef]
- Prat-Guitart, N.; Rein, G.; Hadden, R.M.; Belcher, C.M.; Yearsley, J.M. Propagation probability and spread rates of self-sustained smouldering fires under controlled moisture content and bulk density conditions. Int. J. Wildland Fire 2016, 25, 456–465. [Google Scholar] [CrossRef]
- Pineda, N.; Altube, P.; Alcasena, F.J.; Casellas, E.; Segundo, H.S.; Montanyà, J. Characterising the holdover phase of lightning-ignited wildfires in Catalonia. Agric. For. Meteorol. 2022, 324, 109111. [Google Scholar] [CrossRef]
- Marino, E.; Dupuy, J.-L.; Pimont, F.; Guijarro, M.; Hernando, C.; Linn, R. Fuel bulk density and fuel moisture content effects on fire rate of spread: A comparison between FIRETEC model predictions and experimental results in shrub fuels. J. Fire Sci. 2012, 30, 277–299. [Google Scholar] [CrossRef]
- Weise, D.R.; Biging, G.S. Effects of wind velocity and slope on fire behavior. Fire Saf. Sci.-Proc. Fourth Int. Symp. 1994, 4, 1041–1051. [Google Scholar] [CrossRef]
- Dahale, A.; Ferguson, S.; Shotorban, B.; Mahalingam, S. Effects of distribution of bulk density and moisture content on shrub fires. Int. J. Wildland Fire 2013, 22, 625–641. [Google Scholar] [CrossRef]
- Fernandes, P.M.; Santos, J.A.; Castedo-Dorado, F.; Almeida, R. Fire from the Sky in the Anthropocene. Fire 2021, 4, 13. [Google Scholar] [CrossRef]
- Fargeon, H.; Pimont, F.; Martin-StPaul, N.; De Caceres, M.; Ruffault, J.; Barbero, R.; Dupuy, J.-L. Projections of fire danger under climate change over France: Where do the greatest uncertainties lie? Clim. Chang. 2020, 160, 479–493. [Google Scholar] [CrossRef]
- Boyer, E.W.; Wagenbrenner, J.W.; Zhang, L. Wildfire and hydrological processes. Hydrol. Process. 2022, 36, e14640. [Google Scholar] [CrossRef]
- Pérez-Invernón, F.J.; Huntrieser, H.; Moris, J.V. Meteorological conditions associated with lightning ignited fires and long-continuing-current lightning in Arizona, New Mexico and Florida. Fire 2022, 5, 96. [Google Scholar] [CrossRef]
- Cruz, M.G.; Alexander, M.E. The 10% wind speed rule of thumb for estimating a wildfire’s forward rate of spread in forests and shrublands. Ann. For. Sci. 2019, 76, 44. [Google Scholar] [CrossRef]
- D’este, M.; Ganga, A.; Elia, M.; Lovreglio, R.; Giannico, V.; Spano, G.; Colangelo, G.; Lafortezza, R.; Sanesi, G. Modeling fire ignition probability and frequency using Hurdle models: A cross-regional study in Southern Europe. Ecol. Process. 2020, 9, 54. [Google Scholar] [CrossRef]
- Mansoor, S.; Farooq, I.; Kachroo, M.M.; Mahmoud, A.E.D.; Fawzy, M.; Popescu, S.M.; Alyemeni, M.; Sonne, C.; Rinklebe, J.; Ahmad, P. Elevation in wildfire frequencies with respect to the climate change. J. Environ. Manag. 2022, 301, 113769. [Google Scholar] [CrossRef] [PubMed]
- Jain, P.; Castellanos-Acuna, D.; Coogan, S.C.P.; Abatzoglou, J.T.; Flannigan, M.D. Observed increases in extreme fire weather driven by atmospheric humidity and temperature. Nat. Clim. Chang. 2022, 12, 63–70. [Google Scholar] [CrossRef]
- Huang, X.; Ding, K.; Liu, J.; Wang, Z.; Tang, R.; Xue, L.; Wang, H.; Zhang, Q.; Tan, Z.-M.; Fu, C.; et al. Smoke-weather interaction affects extreme wildfires in diverse coastal regions. Science 2023, 379, 457–461. [Google Scholar] [CrossRef]
- Pereira, M.G.; Parente, J.; Amraoui, M.; Oliveira, A.; Fernandes, P.M. The role of weather and climate conditions on extreme wildfires. In Extreme Wildfire Events and Disasters: Root Causes and New Management Strategies; Elsevier: Amsterdam, The Netherlands, 2019; pp. 55–72. [Google Scholar]
- Mohammadi, Z.; Lohmander, P.; Kašpar, J.; Berčák, R.; Holuša, J.; Marušák, R. The effect of climate factors on the size of forest wildfires (case study: Prague-East district, Czech Republic). J. For. Res. 2022, 33, 1291–1300. [Google Scholar] [CrossRef]
- Flannigan, M.D.; Wotton, B.M.; Marshall, G.A.; de Groot, W.J.; Johnston, J.; Jurko, N.; Cantin, A.S. Fuel moisture sensitivity to temperature and precipitation: Climate change implications. Clim. Chang. 2016, 134, 59–71. [Google Scholar] [CrossRef]
- Madadgar, S.; Sadegh, M.; Chiang, F.; Ragno, E.; AghaKouchak, A. Quantifying increased fire risk in California in response to different levels of warming and drying. Stoch. Environ. Res. Risk Assess. 2020, 34, 2023–2031. [Google Scholar] [CrossRef]
- Dobrowski, S.Z.; Abatzoglou, J.T.; Greenberg, J.A.; Schladow, S. How much influence does landscape-scale physiography have on air temperature in a mountain environment? Agric. For. Meteorol. 2009, 149, 1751–1758. [Google Scholar] [CrossRef]
- Kane, V.R.; Lutz, J.A.; Cansler, C.A.; Povak, N.A.; Churchill, D.J.; Smith, D.F.; Kane, J.T.; North, M.P. Water balance and topography predict fire and forest structure patterns. For. Ecol. Manag. 2015, 338, 1–13. [Google Scholar] [CrossRef]
- Ireland, G.; Petropoulos, G.P. Exploring the relationships between post-fire vegetation regeneration dynamics, topography and burn severity: A case study from the Montane Cordillera Ecozones of Western Canada. Appl. Geogr. 2015, 56, 232–248. [Google Scholar] [CrossRef]
- Zhou, X.; Weise, D.; Mahalingam, S. Experimental measurements and numerical modeling of marginal burning in live chaparral fuel beds. Proc. Combust. Inst. 2005, 30, 2287–2294. [Google Scholar] [CrossRef]
- Silvani, X.; Morandini, F.; Dupuy, J.-L. Effects of slope on fire spread observed through video images and multiple-point thermal measurements. Exp. Therm. Fluid Sci. 2012, 41, 99–111. [Google Scholar] [CrossRef]
- Morandini, F.; Silvani, X.; Honoré, D.; Boutin, G.; Susset, A.; Vernet, R. Slope effects on the fluid dynamics of a fire spreading across a fuel bed: PIV measurements and OH* chemiluminescence imaging. Exp. Fluids 2014, 55, 1788. [Google Scholar] [CrossRef]
- Morandini, F.; Silvani, X.; Dupuy, J.-L.; Susset, A. Fire spread across a sloping fuel bed: Flame dynamics and heat transfers. Combust. Flame 2018, 190, 158–170. [Google Scholar] [CrossRef]
- Li, H.; Liu, N.; Xie, X.; Zhang, L.; Yuan, X.; He, Q.; Viegas, D.X. Effect of Fuel Bed Width on Upslope Fire Spread: An Experimental Study. Fire Technol. 2021, 57, 1063–1076. [Google Scholar] [CrossRef]
- Yang, Z.; Zhang, H.; Zhang, L.; Chen, H. Experimental study on downslope fire spread over a pine needle fuel bed. Fire Technol. 2018, 54, 1487–1503. [Google Scholar] [CrossRef]
- Lecina-Diaz, J.; Alvarez, A.; Retana, J. Extreme fire severity patterns in topographic, convective and wind-driven historical wildfires of Mediterranean pine forests. PLoS ONE 2014, 9, e85127. [Google Scholar] [CrossRef] [PubMed]
- Touge, Y.; Shi, K.; Nishino, T.; Sun, C.; Sekizawa, A. Spatial-temporal characteristics of more than 50,000 wildfires in Japan from 1995 to 2020. Fire Saf. J. 2024, 142, 104025. [Google Scholar] [CrossRef]
- Oliveira, S.; Oehler, F.; San-Miguel-Ayanz, J.; Camia, A.; Pereira, J.M. Modeling spatial patterns of fire occurrence in Mediterranean Europe using multiple regression and random forest. For. Ecol. Manag. 2012, 275, 117–129. [Google Scholar] [CrossRef]
- Jiao, Z.; Zhang, Y.; Xin, J.; Mu, L.; Yi, Y.; Liu, H.; Liu, D. A deep learning based forest Fire detection approach using UAV and YOLOv3. In Proceedings of the 2019 1st International Conference on Industrial Artificial Intelligence (IAI), Shenyang, China, 23–27 July 2019; pp. 1–8. [Google Scholar]
- Jain, P.; Coogan, S.C.P.; Subramanian, S.G.; Crowley, M.; Taylor, S.W.; Flannigan, M.D. A review of machine learning applications in wildfire science and management. Environ. Rev. 2020, 28, 478–505. [Google Scholar] [CrossRef]
- Bera, B.; Shit, P.K.; Sengupta, N.; Saha, S.; Bhattacharjee, S. Forest fire susceptibility prediction using machine learning models with resampling algorithms, Northern part of Eastern Ghat Mountain range (India). Geocarto Int. 2022, 37, 11756–11781. [Google Scholar] [CrossRef]
- Alkhatib, R.; Sahwan, W.; Alkhatieb, A.; Schütt, B. A brief review of machine learning algorithms in forest fires science. Appl. Sci. 2023, 13, 8275. [Google Scholar] [CrossRef]
- Virupaksha Gouda, R.; Anoop, R.; Sameerna, J.; Basha, A.; Gali, S. Forest fire prediction using machine learning. Int. J. Res. Appl. Sci. Eng. Technol. 2023, 11, 792–797. [Google Scholar]
- Pourghasemi, H.R.; Beheshtirad, M.; Pradhan, B. A comparative assessment of prediction capabilities of modified analytical hierarchy process (M-AHP) and Mamdani fuzzy logic models using Netcad-GIS for forest fire susceptibility mapping. Geomat. Nat. Hazards Risk 2016, 7, 861–885. [Google Scholar] [CrossRef]
- Amatulli, G.; Peréz-Cabello, F.; de la Riva, J. Mapping lightning/human-caused wildfires occurrence under ignition point location uncertainty. Ecol. Model. 2007, 200, 321–333. [Google Scholar] [CrossRef]
- Saleh, A.; Zulkifley, M.A.; Harun, H.H.; Gaudreault, F.; Davison, I.; Spraggon, M. Forest fire surveillance systems: A review of deep learning methods. Heliyon 2024, 10, e23127. [Google Scholar] [CrossRef] [PubMed]
- Singh, S.S.; Jeganathan, C. Using ensemble machine learning algorithm to predict forest fire occurrence probability in Madhya Pradesh and Chhattisgarh, India. Adv. Space Res. 2023, 73, 2969–2987. [Google Scholar] [CrossRef]
- Arpaci, A.; Malowerschnig, B.; Sass, O.; Vacik, H. Using multi variate data mining techniques for estimating fire susceptibility of Tyrolean forests. Appl. Geogr. 2014, 53, 258–270. [Google Scholar] [CrossRef]
- Barmpoutis, P.; Stathaki, T.; Dimitropoulos, K.; Grammalidis, N. Early fire detection based on aerial 360-degree sensors, deep convolution neural networks and exploitation of fire dynamic textures. Remote Sens. 2020, 12, 3177. [Google Scholar] [CrossRef]
- Rodrigues, M.; De la Riva, J. An insight into machine-learning algorithms to model human-caused wildfire occurrence. Environ. Model. Softw. 2014, 57, 192–201. [Google Scholar] [CrossRef]
- Lin, H.; Liu, X.; Wang, X.; Liu, Y. A fuzzy inference and big data analysis algorithm for the prediction of forest fire based on rechargeable wireless sensor networks. Sustain. Comput. Informatics Syst. 2018, 18, 101–111. [Google Scholar] [CrossRef]
- Menezes, L.S.; de Oliveira, A.M.; Santos, F.L.; Russo, A.; de Souza, R.A.; Roque, F.O.; Libonati, R. Lightning patterns in the Pantanal: Untangling natural and anthropogenic-induced wildfires. Sci. Total. Environ. 2022, 820, 153021. [Google Scholar] [CrossRef]
- Neto, O.P.; Pinto, I.R.C.A.; Junior, O.P.; Williams, E.R. Evidence of a link between Amazon fires and lightning. J. Atmos. Sol. Terr. Phys. 2023, 249, 106095. [Google Scholar] [CrossRef]
- Evett, R.R.; Mohrle, C.R.; Hall, B.L.; Brown, T.J.; Stephens, S.L. The effect of monsoonal atmospheric moisture on lightning fire ignitions in southwestern North America. Agric. For. Meteorol. 2008, 148, 1478–1487. [Google Scholar] [CrossRef]
- Hessilt, T.D.; Abatzoglou, J.T.; Chen, Y.; Randerson, J.T.; Scholten, R.C.; van der Werf, G.; Veraverbeke, S. Future increases in lightning ignition efficiency and wildfire occurrence expected from drier fuels in boreal forest ecosystems of western North America. Environ. Res. Lett. 2022, 17, 054008. [Google Scholar] [CrossRef]
- Krawchuk, M.A.; Cumming, S.G. Disturbance history affects lightning fire initiation in the mixed wood boreal forest: Observations and simulations. For. Ecol. Manag. 2009, 257, 1613–1622. [Google Scholar] [CrossRef]
- Calef, M.P.; Varvak, A.; McGuire, A.D. Differences in human versus lightning fires between urban and rural areas of the boreal forest in interior Alaska. Forests 2017, 8, 422. [Google Scholar] [CrossRef]
- MacNamara, B.R.; Schultz, C.J.; Fuelberg, H.E. Flash characteristics and precipitation metrics of western U.S. lightning-initiated wildfires from 2017. Fire 2020, 3, 5. [Google Scholar] [CrossRef]
- Li, Y.; Mickley, L.J.; Liu, P.; Kaplan, J.O.; Paulson, J.A. Trends and spatial shifts in lightning fires and smoke concentrations United States. Atmos. Chem. Phys. 2020, 20, 8828–8838. [Google Scholar] [CrossRef]
- Cha, D.; Wang, X.; Kim, J.W. Assessing lightning and wildfire hazard by land properties and cloud to ground lightning data with association rule mining in Alberta, Canada. Sensors 2017, 17, 2413. [Google Scholar] [CrossRef]
- Chen, B.; Jin, Y. Spatial patterns and drivers for wildfire ignitions in California. Environ. Res. Lett. 2022, 17, 055004. [Google Scholar] [CrossRef]
- Coogan, S.C.P.; Cai, X.; Jain, P.; Flannigan, M.D. Seasonality and trends in human-and lightning-caused wildfires ≥ 2 ha in Canada, 1959–2018. Int. J. Wildland Fire 2020, 29, 473–485. [Google Scholar] [CrossRef]
- Abatzoglou, J.T.; Kolden, C.A.; Balch, J.K.; Bradley, B.A. Controls on interannual variability in lightning-caused fire activity in the western US. Environ. Res. Lett. 2016, 11, 045005. [Google Scholar] [CrossRef]
- Pérez-Invernón, F.J.; Gordillo-Vázquez, F.J.; Huntrieser, H.; Jöckel, P. Variation of lightning-ignited wildfire patterns under climate change. Nat. Commun. 2023, 14, 739. [Google Scholar] [CrossRef]
- Fill, J.M.; Davis, C.N.; Crandall, R.M. Climate change lengthens southeastern USA lightning-ignited fire seasons. Glob. Chang. Biol. 2019, 25, 3562–3569. [Google Scholar] [CrossRef] [PubMed]
- Prestemon, J.P.; Shankar, U.; Xiu, A.; Talgo, K.; Yang, D.; Dixon, E.; McKenzie, D.; Abt, K.L. Projecting wildfire area burned in the south-eastern United States, 2011–2060. Int. J. Wildland Fire 2016, 25, 715–729. [Google Scholar] [CrossRef]
- Brey, S.J.; Barnes, E.A.; Pierce, J.R.; Wiedinmyer, C.; Fischer, E.V. Environmental conditions; ignition type, and air quality impacts of wildfires in the Southeastern and Western United States. Earth’s Futur. 2018, 6, 1442–1456. [Google Scholar] [CrossRef]
- Aftergood, O.S.R.; Flannigan, M.D. Identifying and analyzing spatial and temporal patterns of lightning-ignited wildfires in Western Canada from 1981 to 2018. Can. J. For. Res. 2022, 52, 1399–1411. [Google Scholar] [CrossRef]
- Pineda, N.; Rigo, T. The rainfall factor in lightning-ignited wildfires in Catalonia. Agric. For. Meteorol. 2017, 239, 249–263. [Google Scholar] [CrossRef]
- Pineda, N.; Peña, J.C.; Soler, X.; Aran, M.; Pérez-Zanón, N. Synoptic weather patterns conducive to lightning-ignited wildfires in Catalonia. Adv. Sci. Res. 2022, 19, 39–49. [Google Scholar] [CrossRef]
- Ordóñez, C.; Saavedra, A.; Rodríguez-Pérez, J.; Castedo-Dorado, F.; Covián, E. Using model-based geostatistics to predict lightning-caused wildfires. Environ. Model. Softw. 2012, 29, 44–50. [Google Scholar] [CrossRef]
- Müller, M.M.; Vacik, H.; Diendorfer, G.; Arpaci, A.; Formayer, H.; Gossow, H. Analysis of lightning-induced forest fires in Austria. Theor. Appl. Clim. 2013, 111, 183–193. [Google Scholar] [CrossRef]
- Müller, M.M.; Vacik, H. Characteristics of lightnings igniting forest fires in Austria. Agric. For. Meteorol. 2017, 240–241, 26–34. [Google Scholar] [CrossRef]
- Moris, J.V.; Conedera, M.; Nisi, L.; Bernardi, M.; Cesti, G.; Pezzatti, G.B. Lightning-caused fires in the Alps: Identifying the igniting strokes. Agric. For. Meteorol. 2020, 290, 107990. [Google Scholar] [CrossRef]
- Sari, F. Identifying anthropogenic and natural causes of wildfires by maximum entropy method-based ignition susceptibility distribution models. J. For. Res. 2022, 34, 355–371. [Google Scholar] [CrossRef]
- Zong, X.; Tian, X.; Liu, J. A fire regime zoning system for China. Front. For. Glob. Chang. 2021, 4, 717499. [Google Scholar] [CrossRef]
- Zhang, Q.; Homayouni, S.; Yao, H.; Shu, Y.; Li, M.; Zhou, M. Joint analysis of lightning-induced forest fire and surface influence factors in the Great Xing’an Range. Forests 2022, 13, 1867. [Google Scholar] [CrossRef]
- Hu, T.; Zhou, G. Drivers of lightning- and human-caused fire regimes in the Great Xing’an Mountains. For. Ecol. Manag. 2014, 329, 49–58. [Google Scholar] [CrossRef]
- Bates, B.C.; McCaw, L.; Dowdy, A.J. Exploratory analysis of lightning-ignited wildfires in the Warren Region, Western Australia. J. Environ. Manag. 2018, 225, 336–345. [Google Scholar] [CrossRef] [PubMed]
- Bates, B.C.; Dowdy, A.J.; McCaw, L. A Bayesian approach to exploring the influence of climate variability modes on fire weather conditions and lightning-ignited wildfires. Clim. Dyn. 2021, 57, 1207–1225. [Google Scholar] [CrossRef]
- Dorph, A.; Marshall, E.; Parkins, K.A.; Penman, T.D. Modelling ignition probability for human- and lightning-caused wildfires in Victoria, Australia. Nat. Hazards Earth Syst. Sci. 2022, 22, 3487–3499. [Google Scholar] [CrossRef]
- Clarke, H.; Gibson, R.; Cirulis, B.; Bradstock, R.A.; Penman, T.D. Developing and testing models of the drivers of anthropogenic and lightning-caused wildfire ignitions in south-eastern Australia. J. Environ. Manag. 2019, 235, 34–41. [Google Scholar] [CrossRef]
- Nampak, H.; Love, P.; Fox-Hughes, P.; Watson, C.; Aryal, J.; Harris, R.M.B. Characterizing spatial and temporal variability of lightning activity associated with wildfire over Tasmania, Australia. Fire 2021, 4, 10. [Google Scholar] [CrossRef]
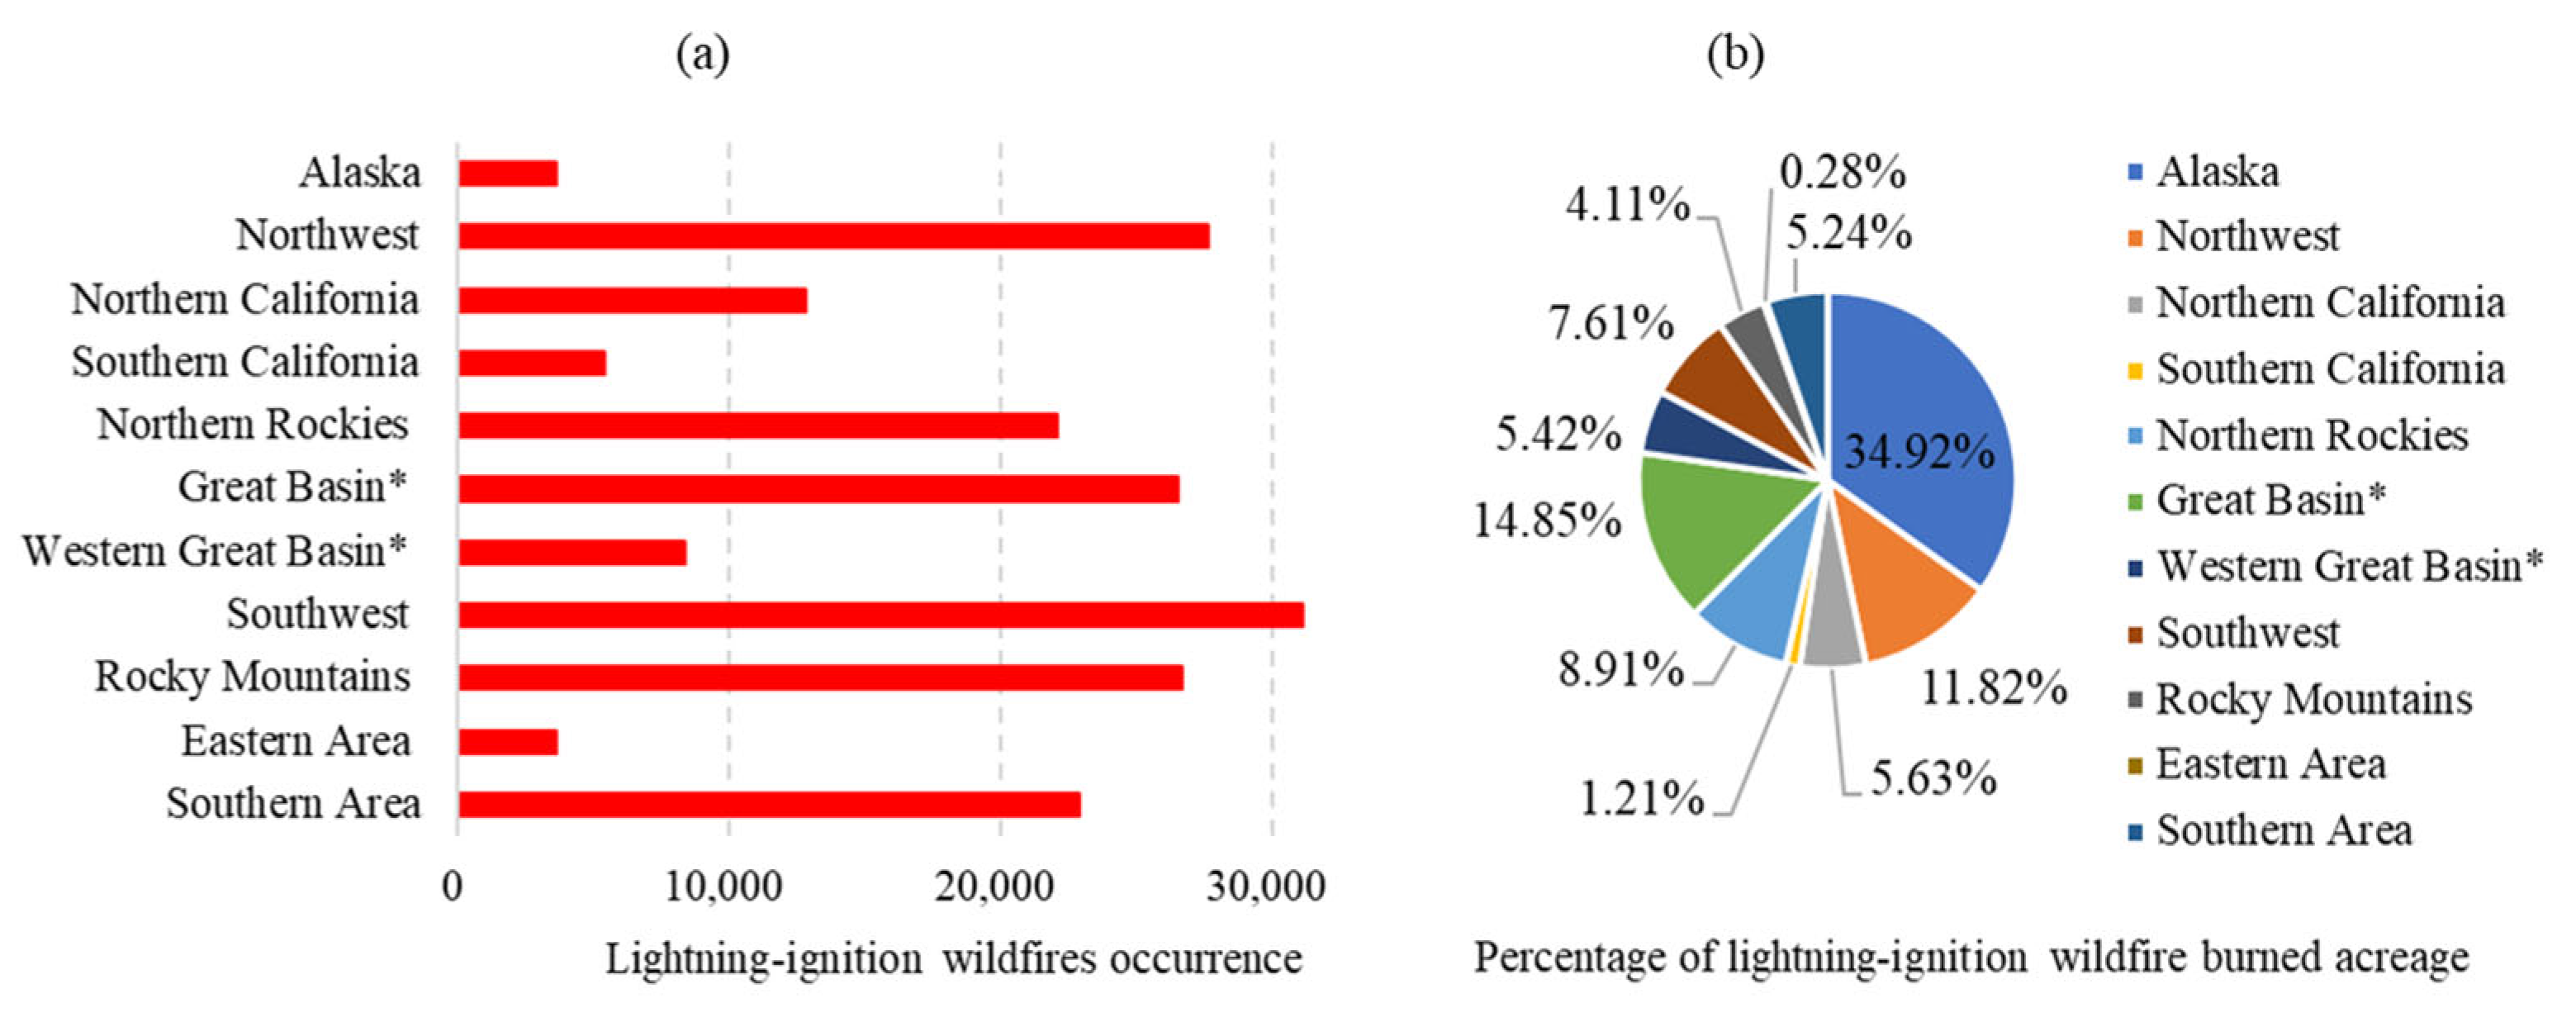
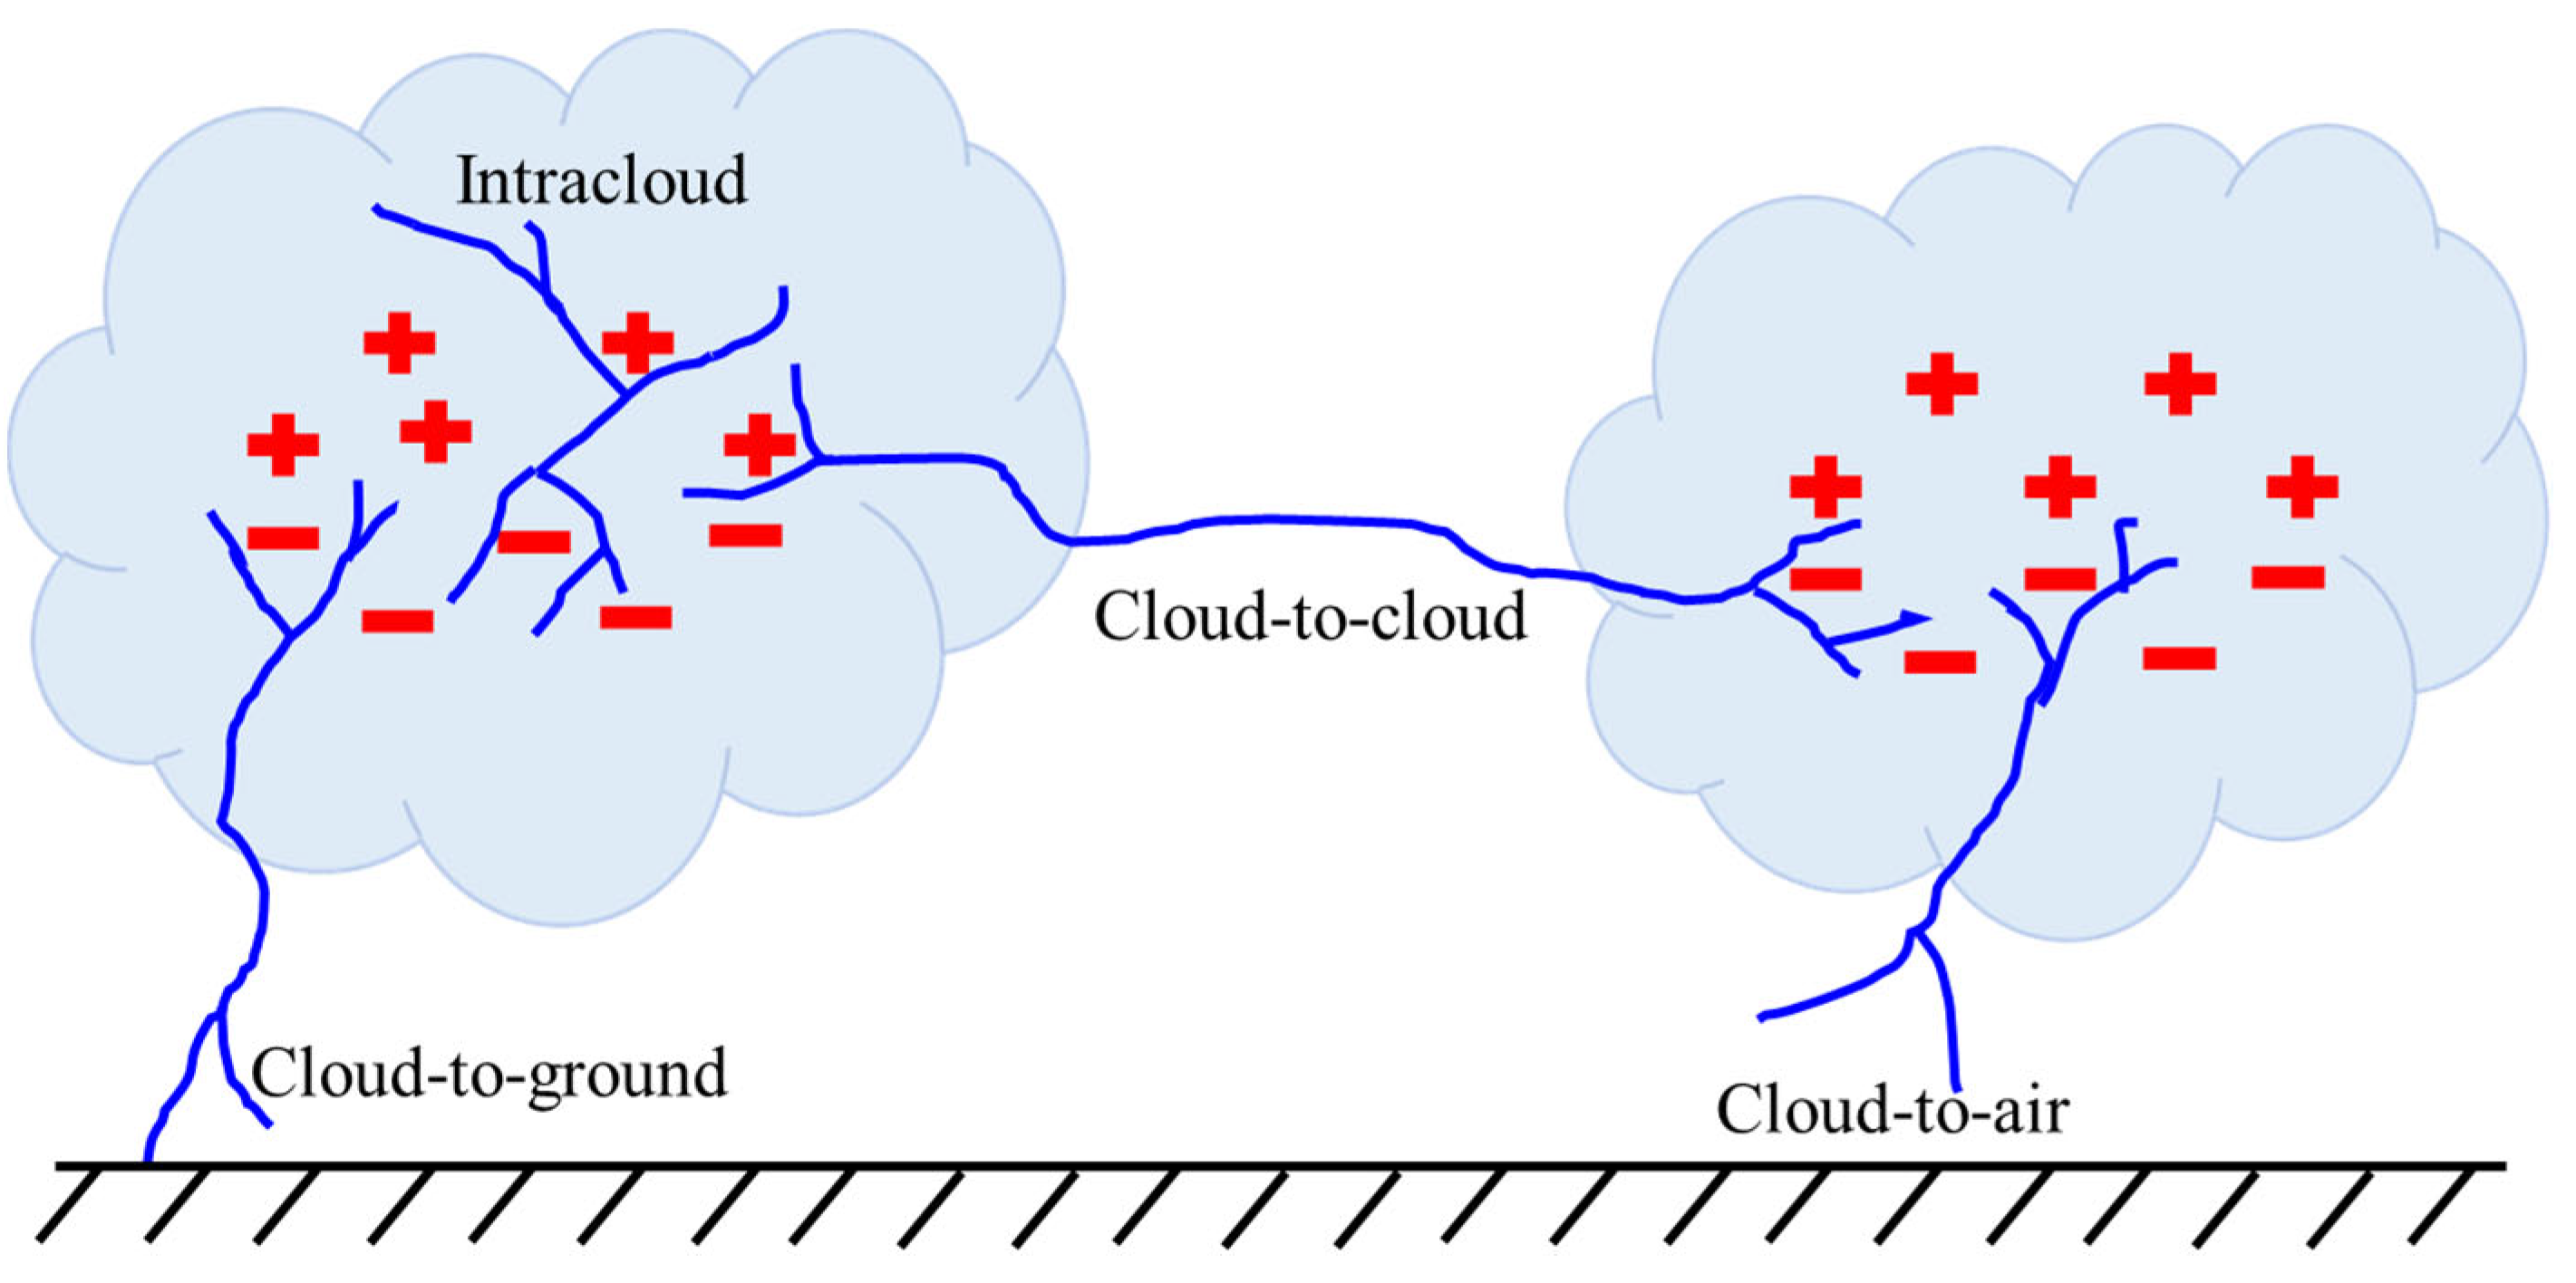
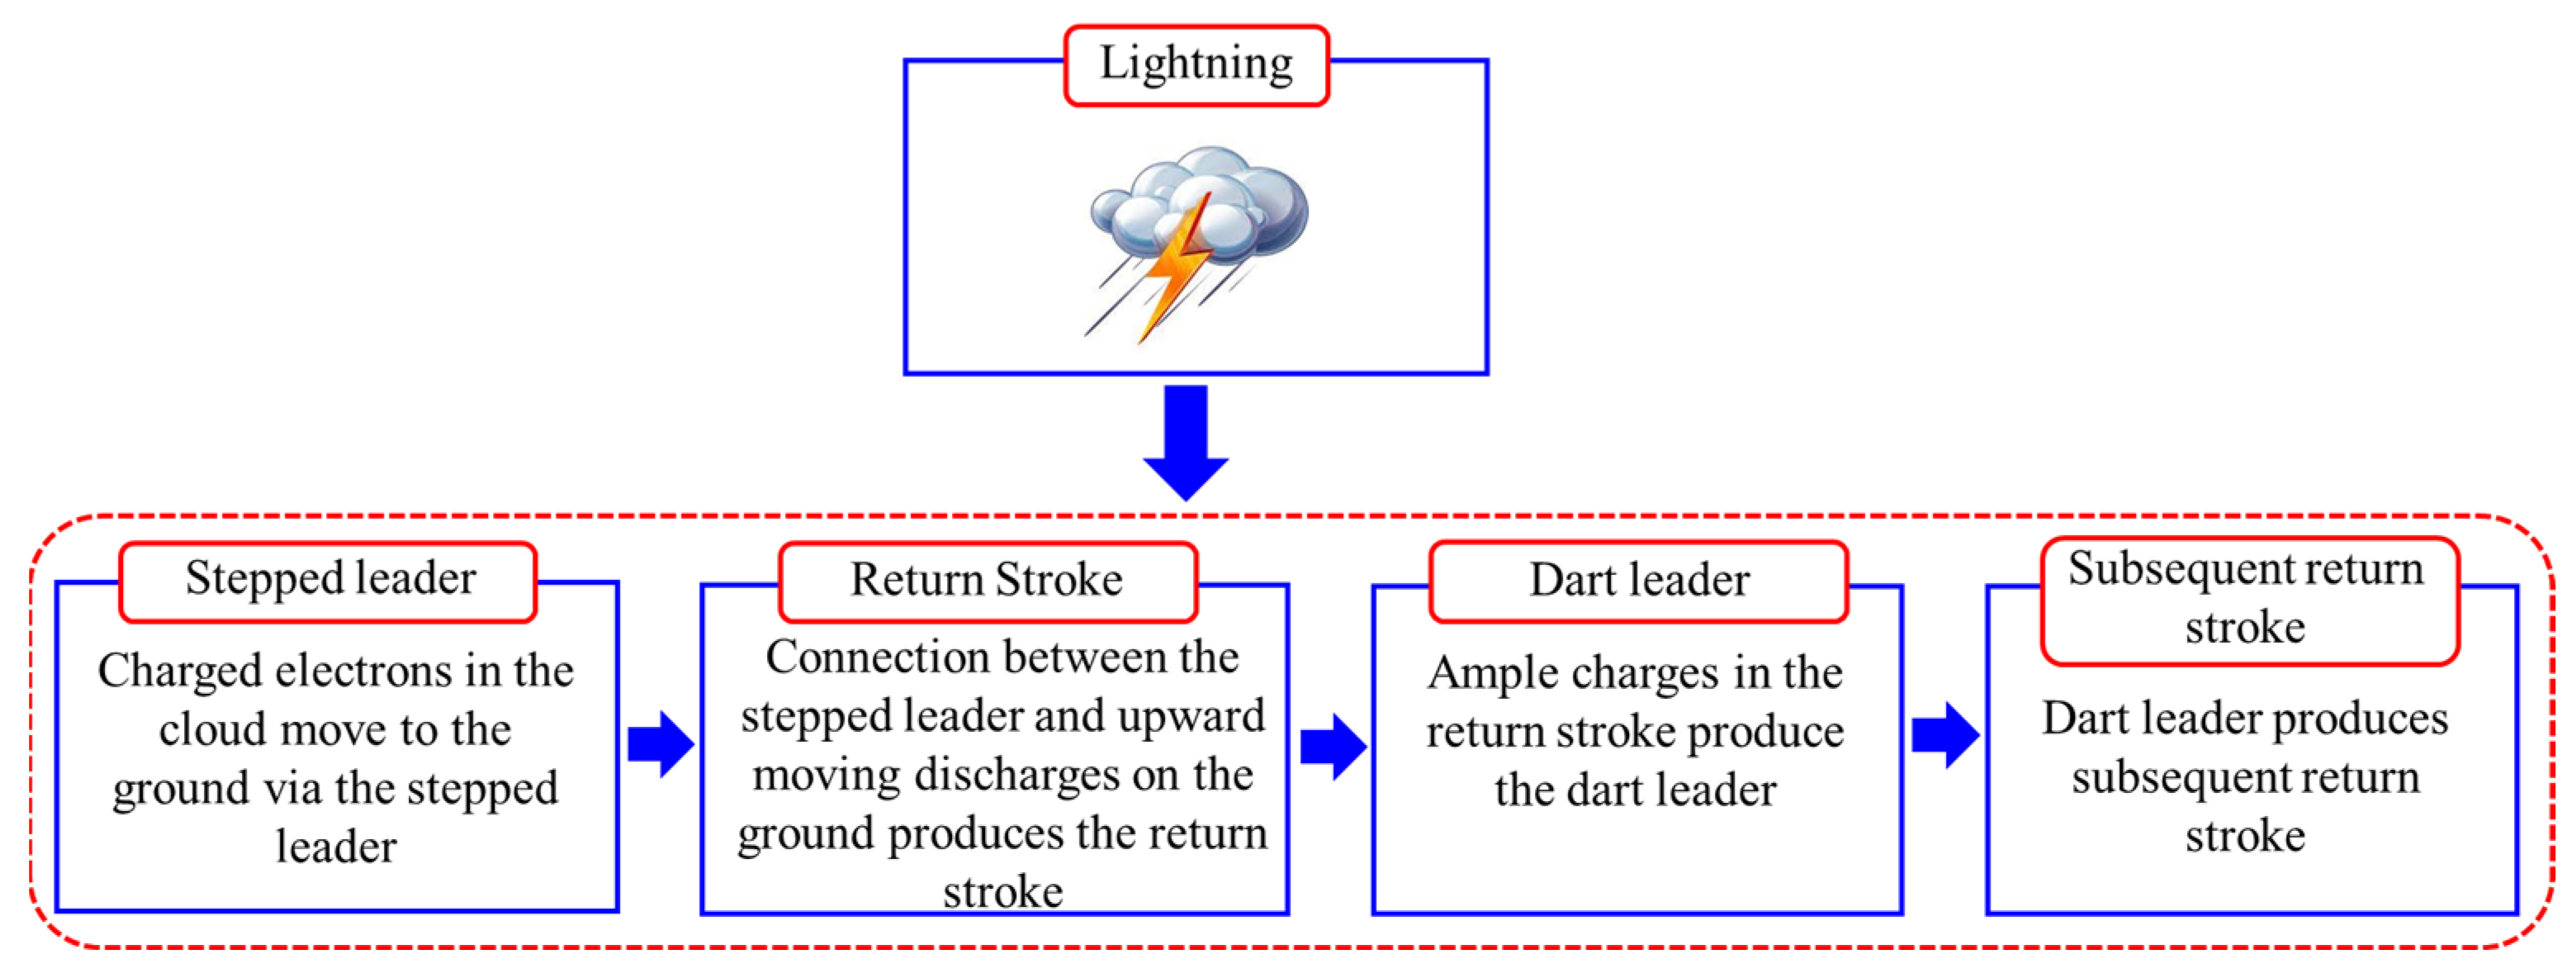
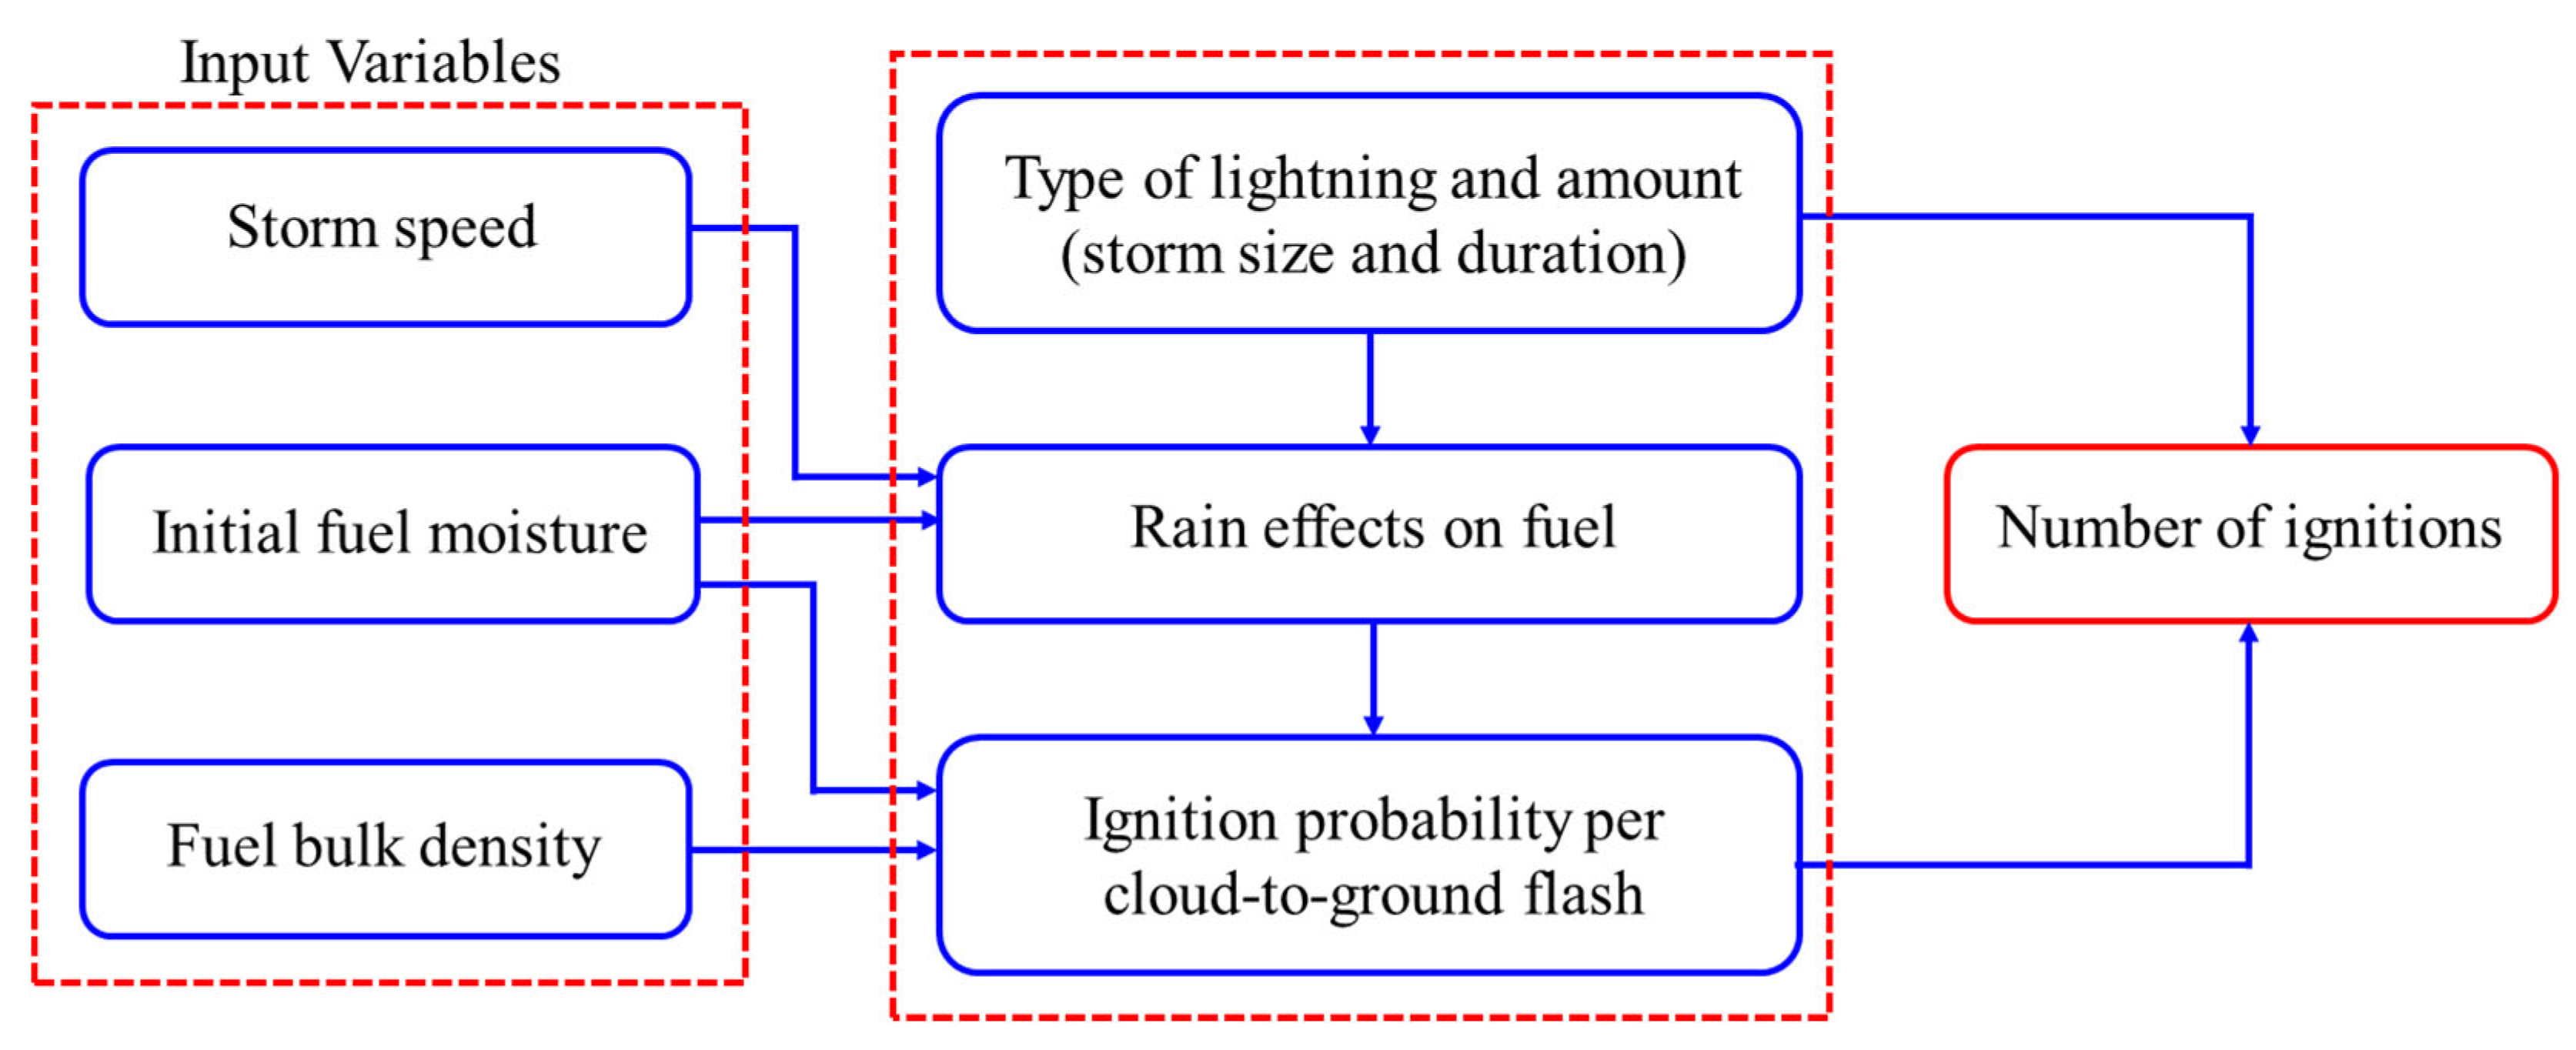


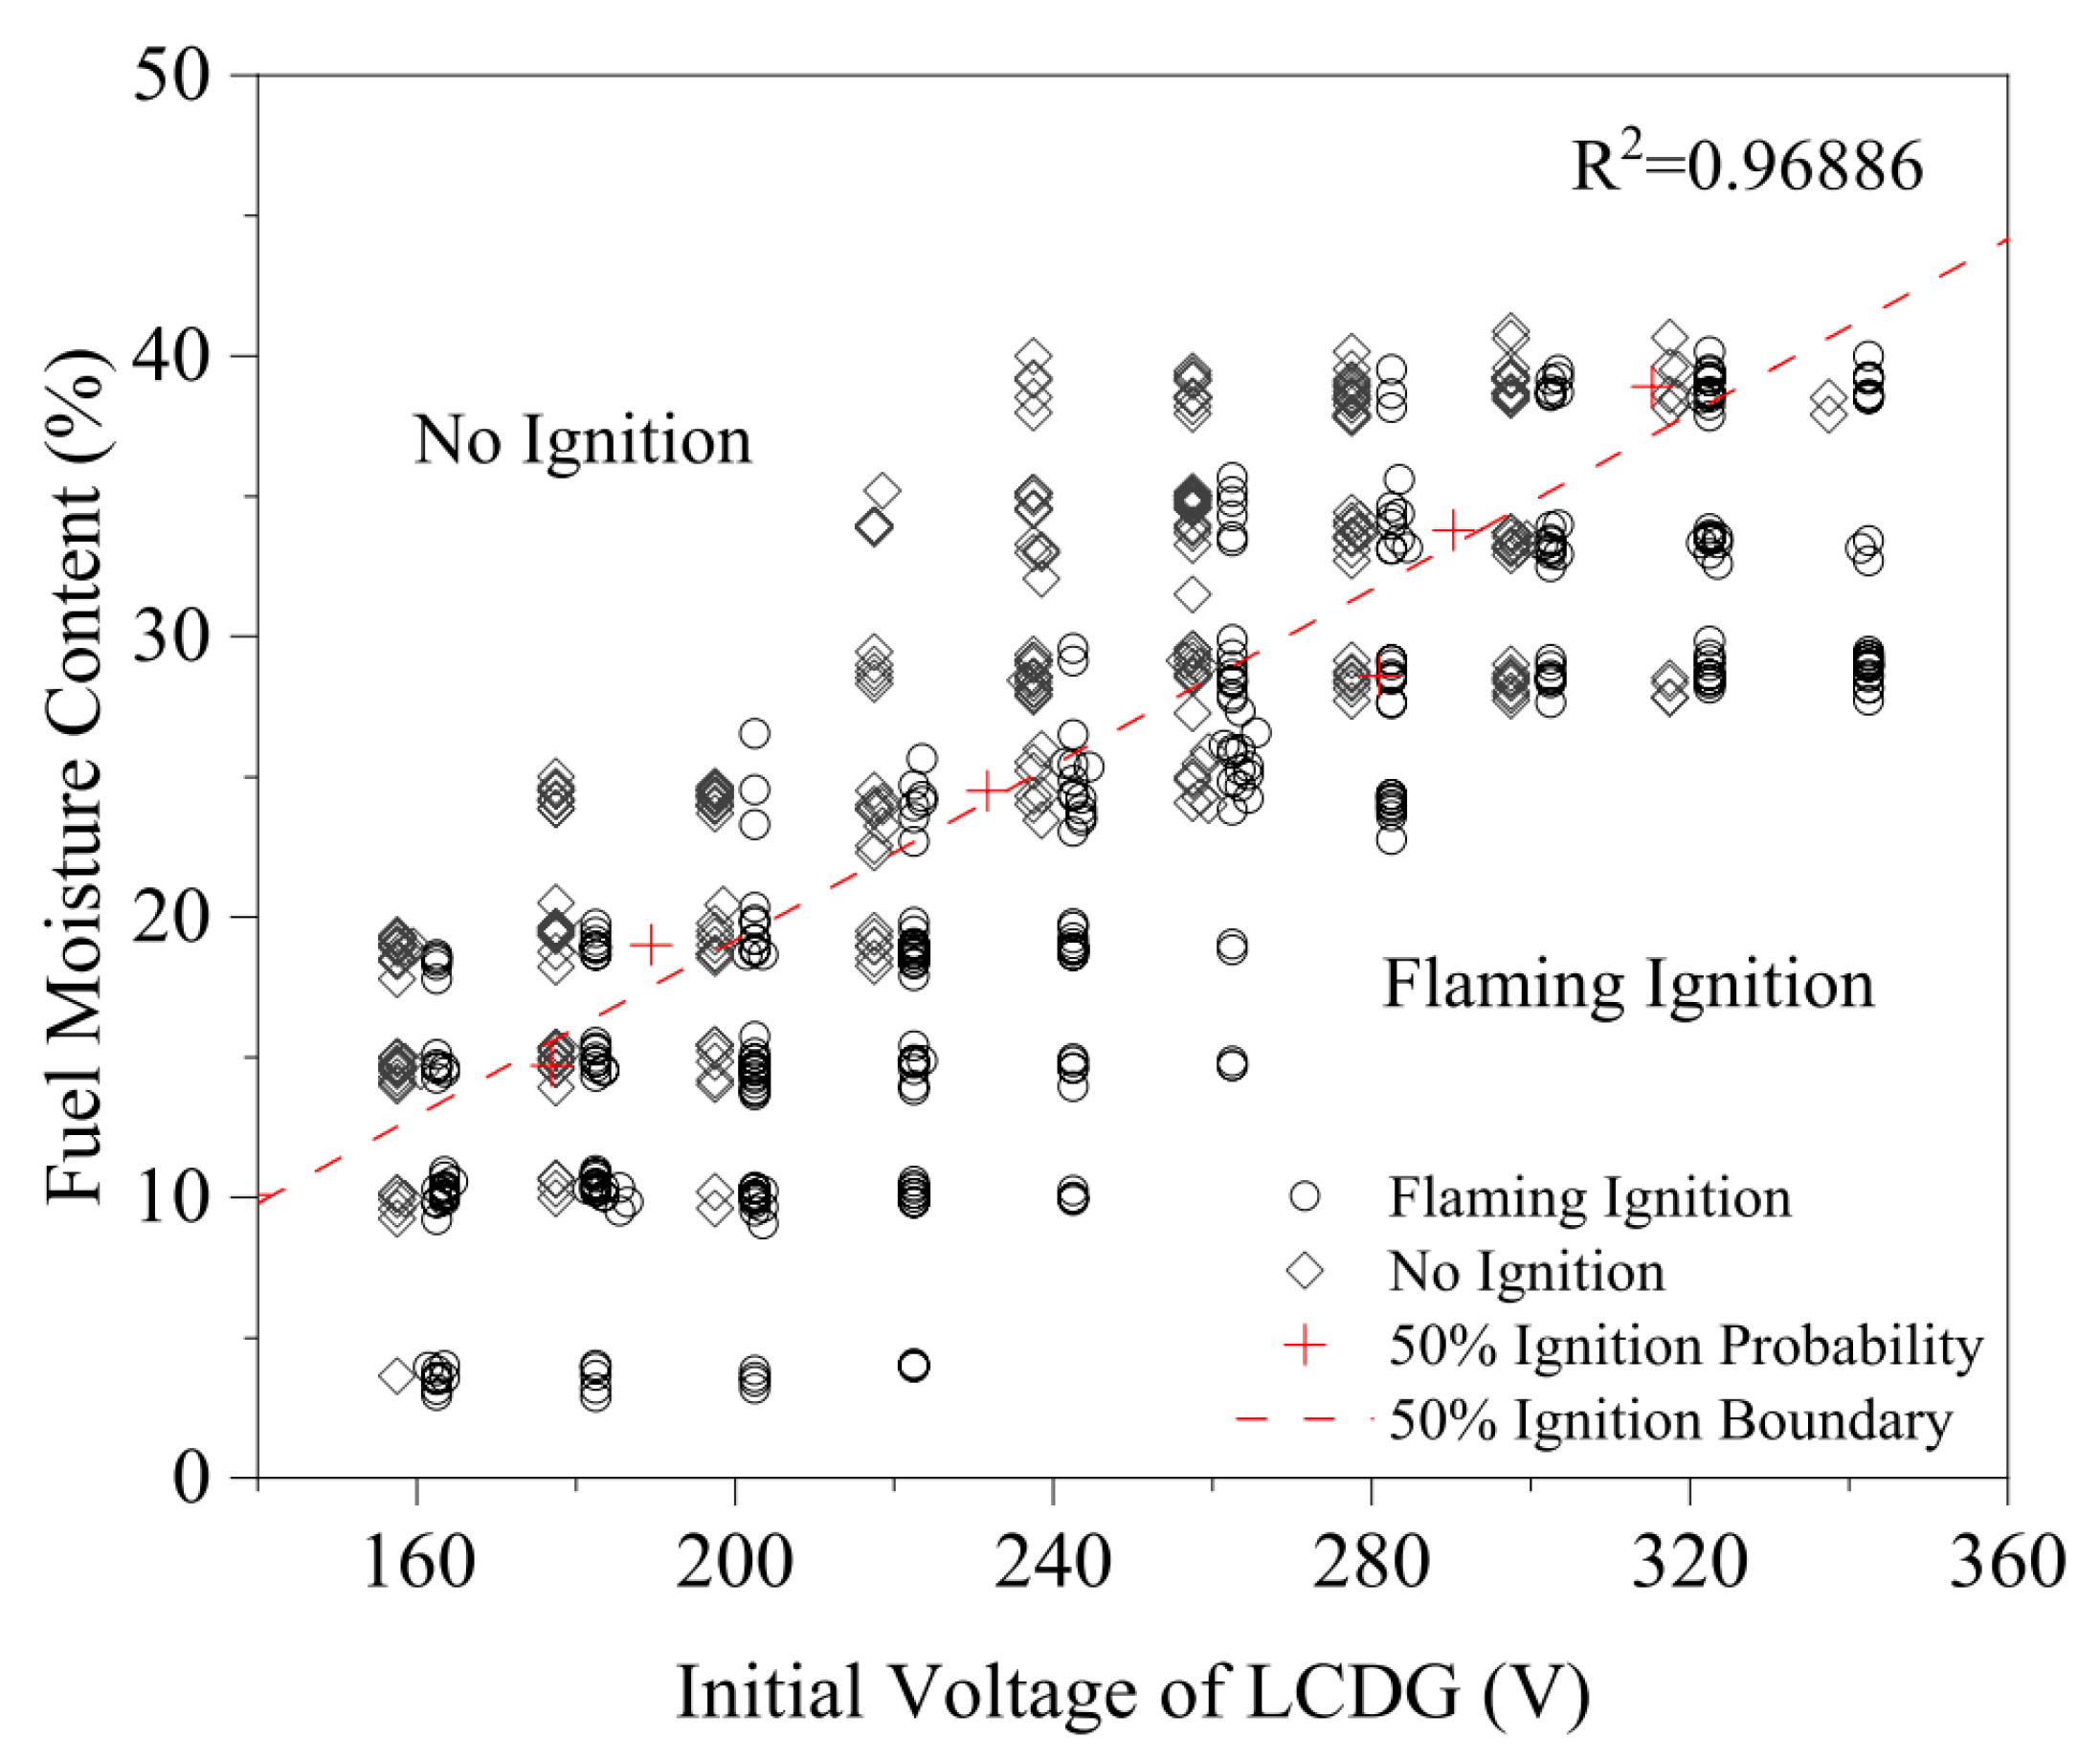
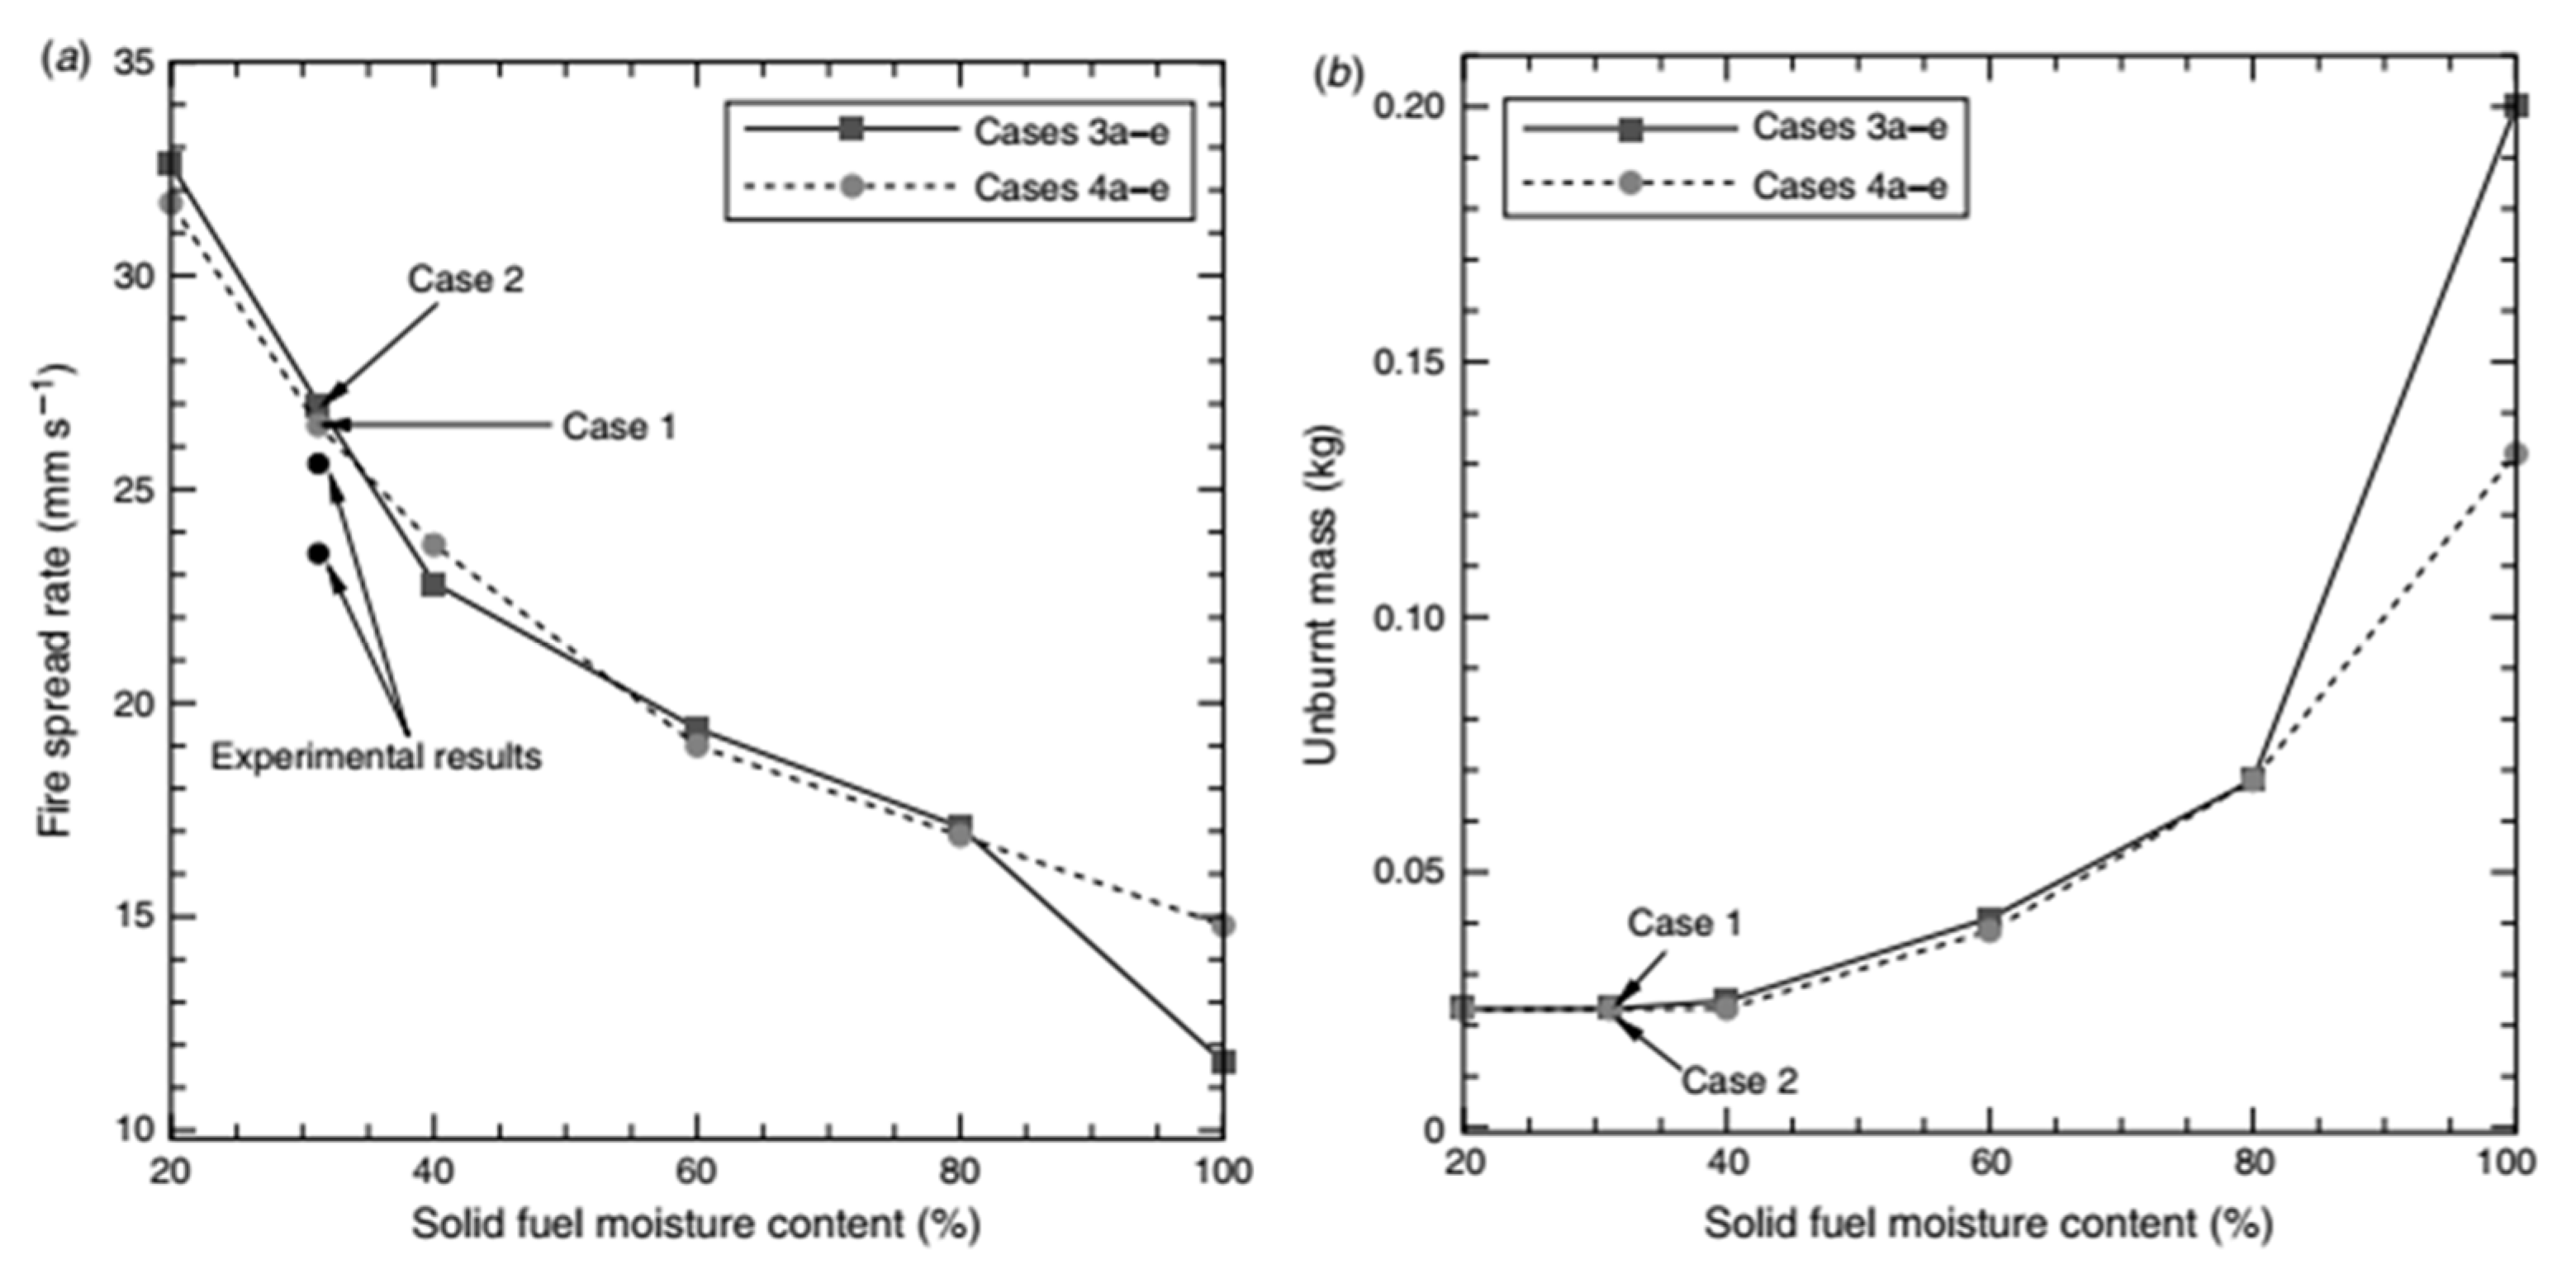
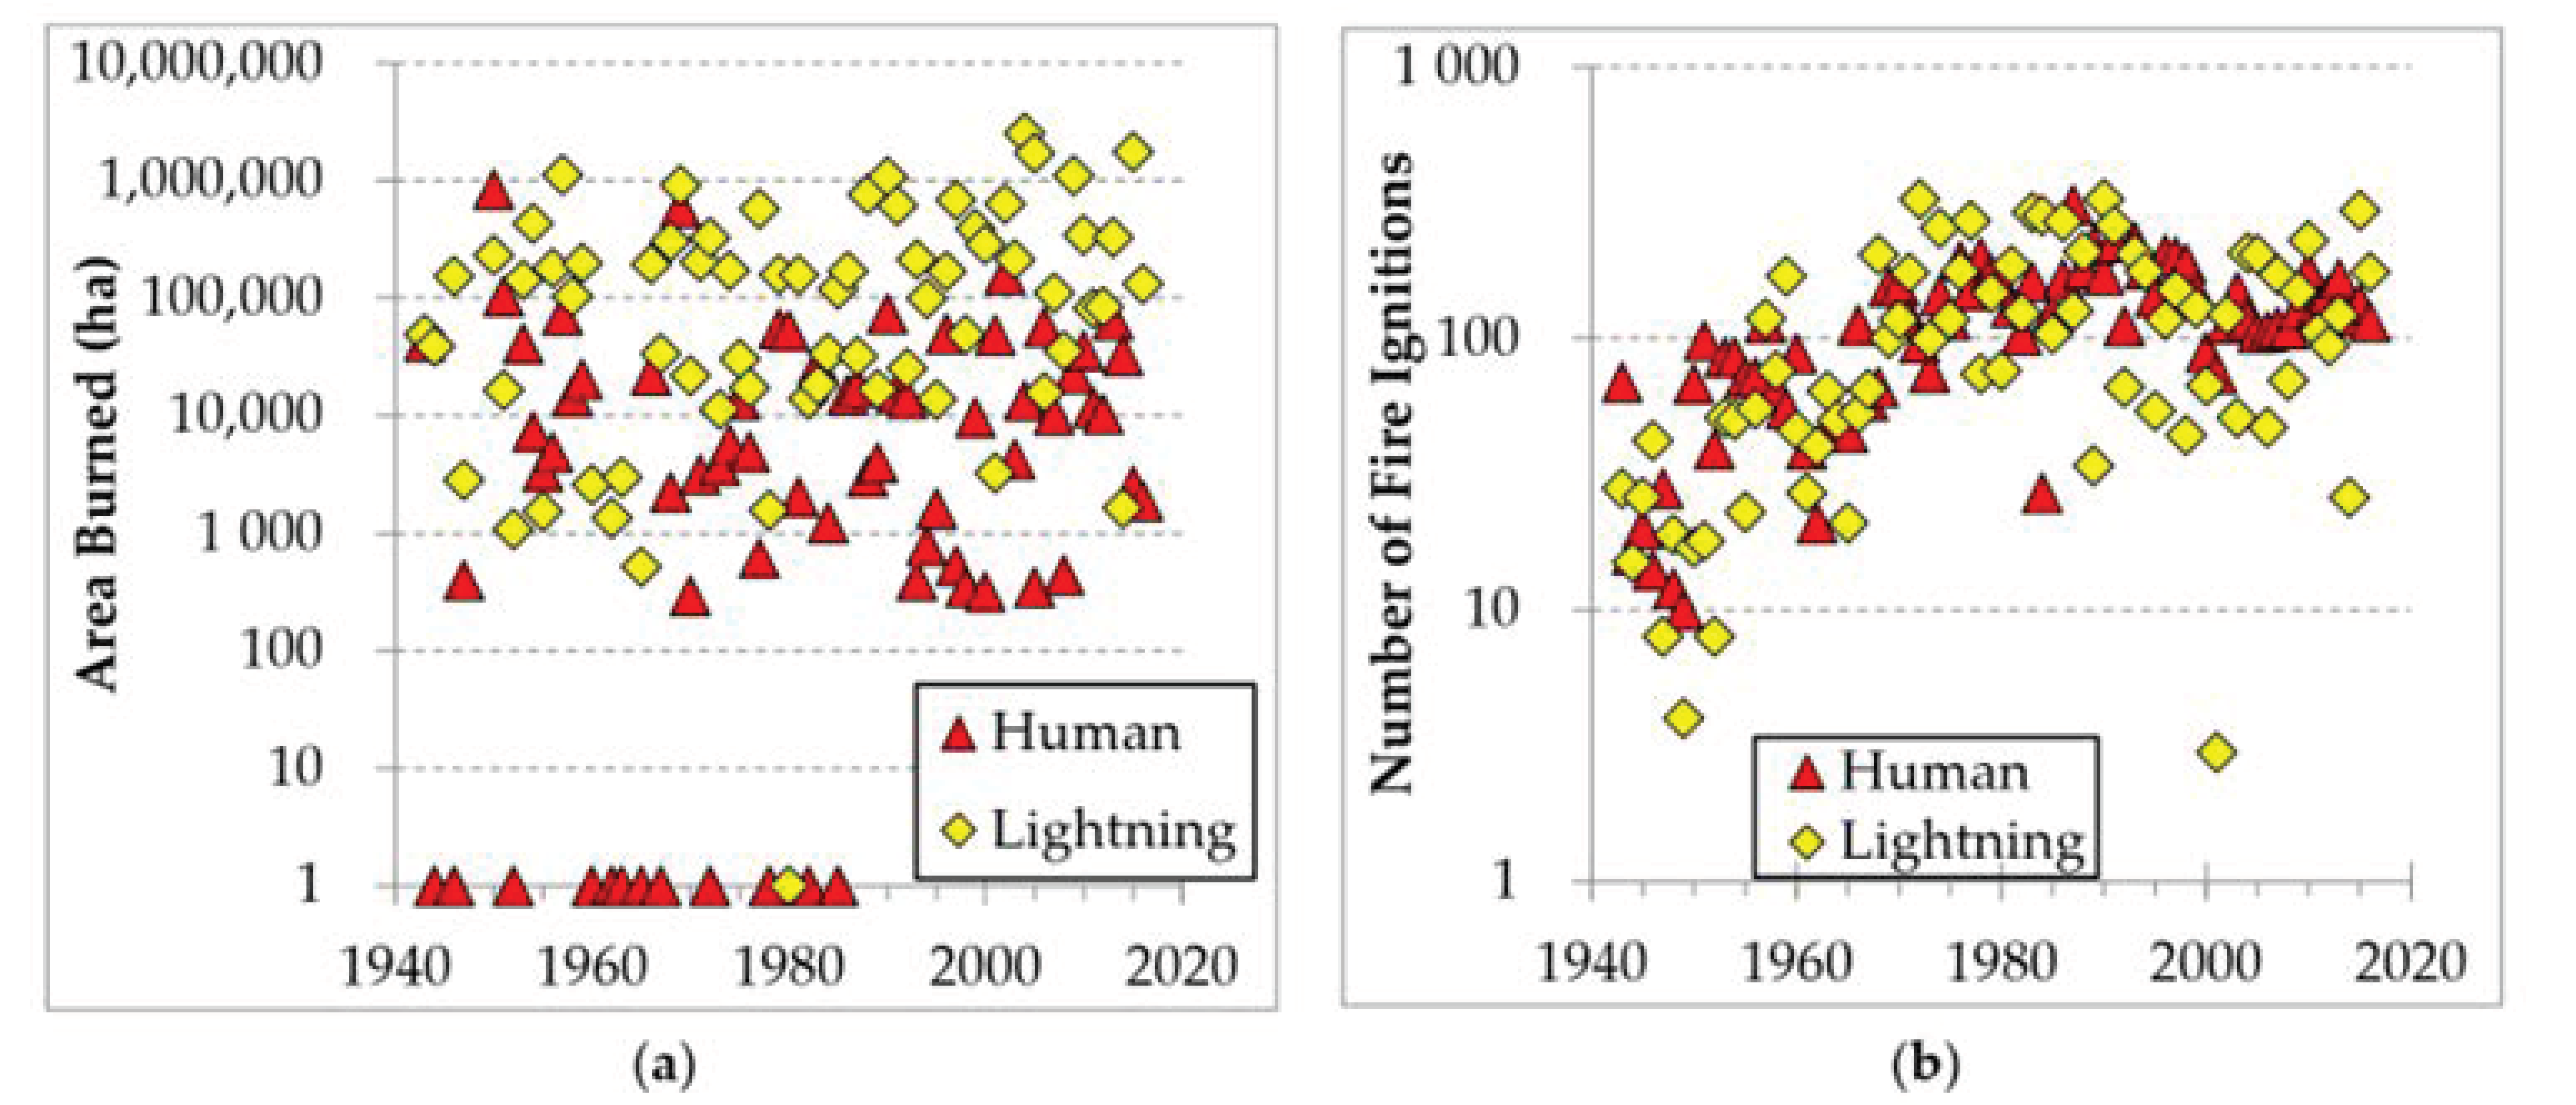
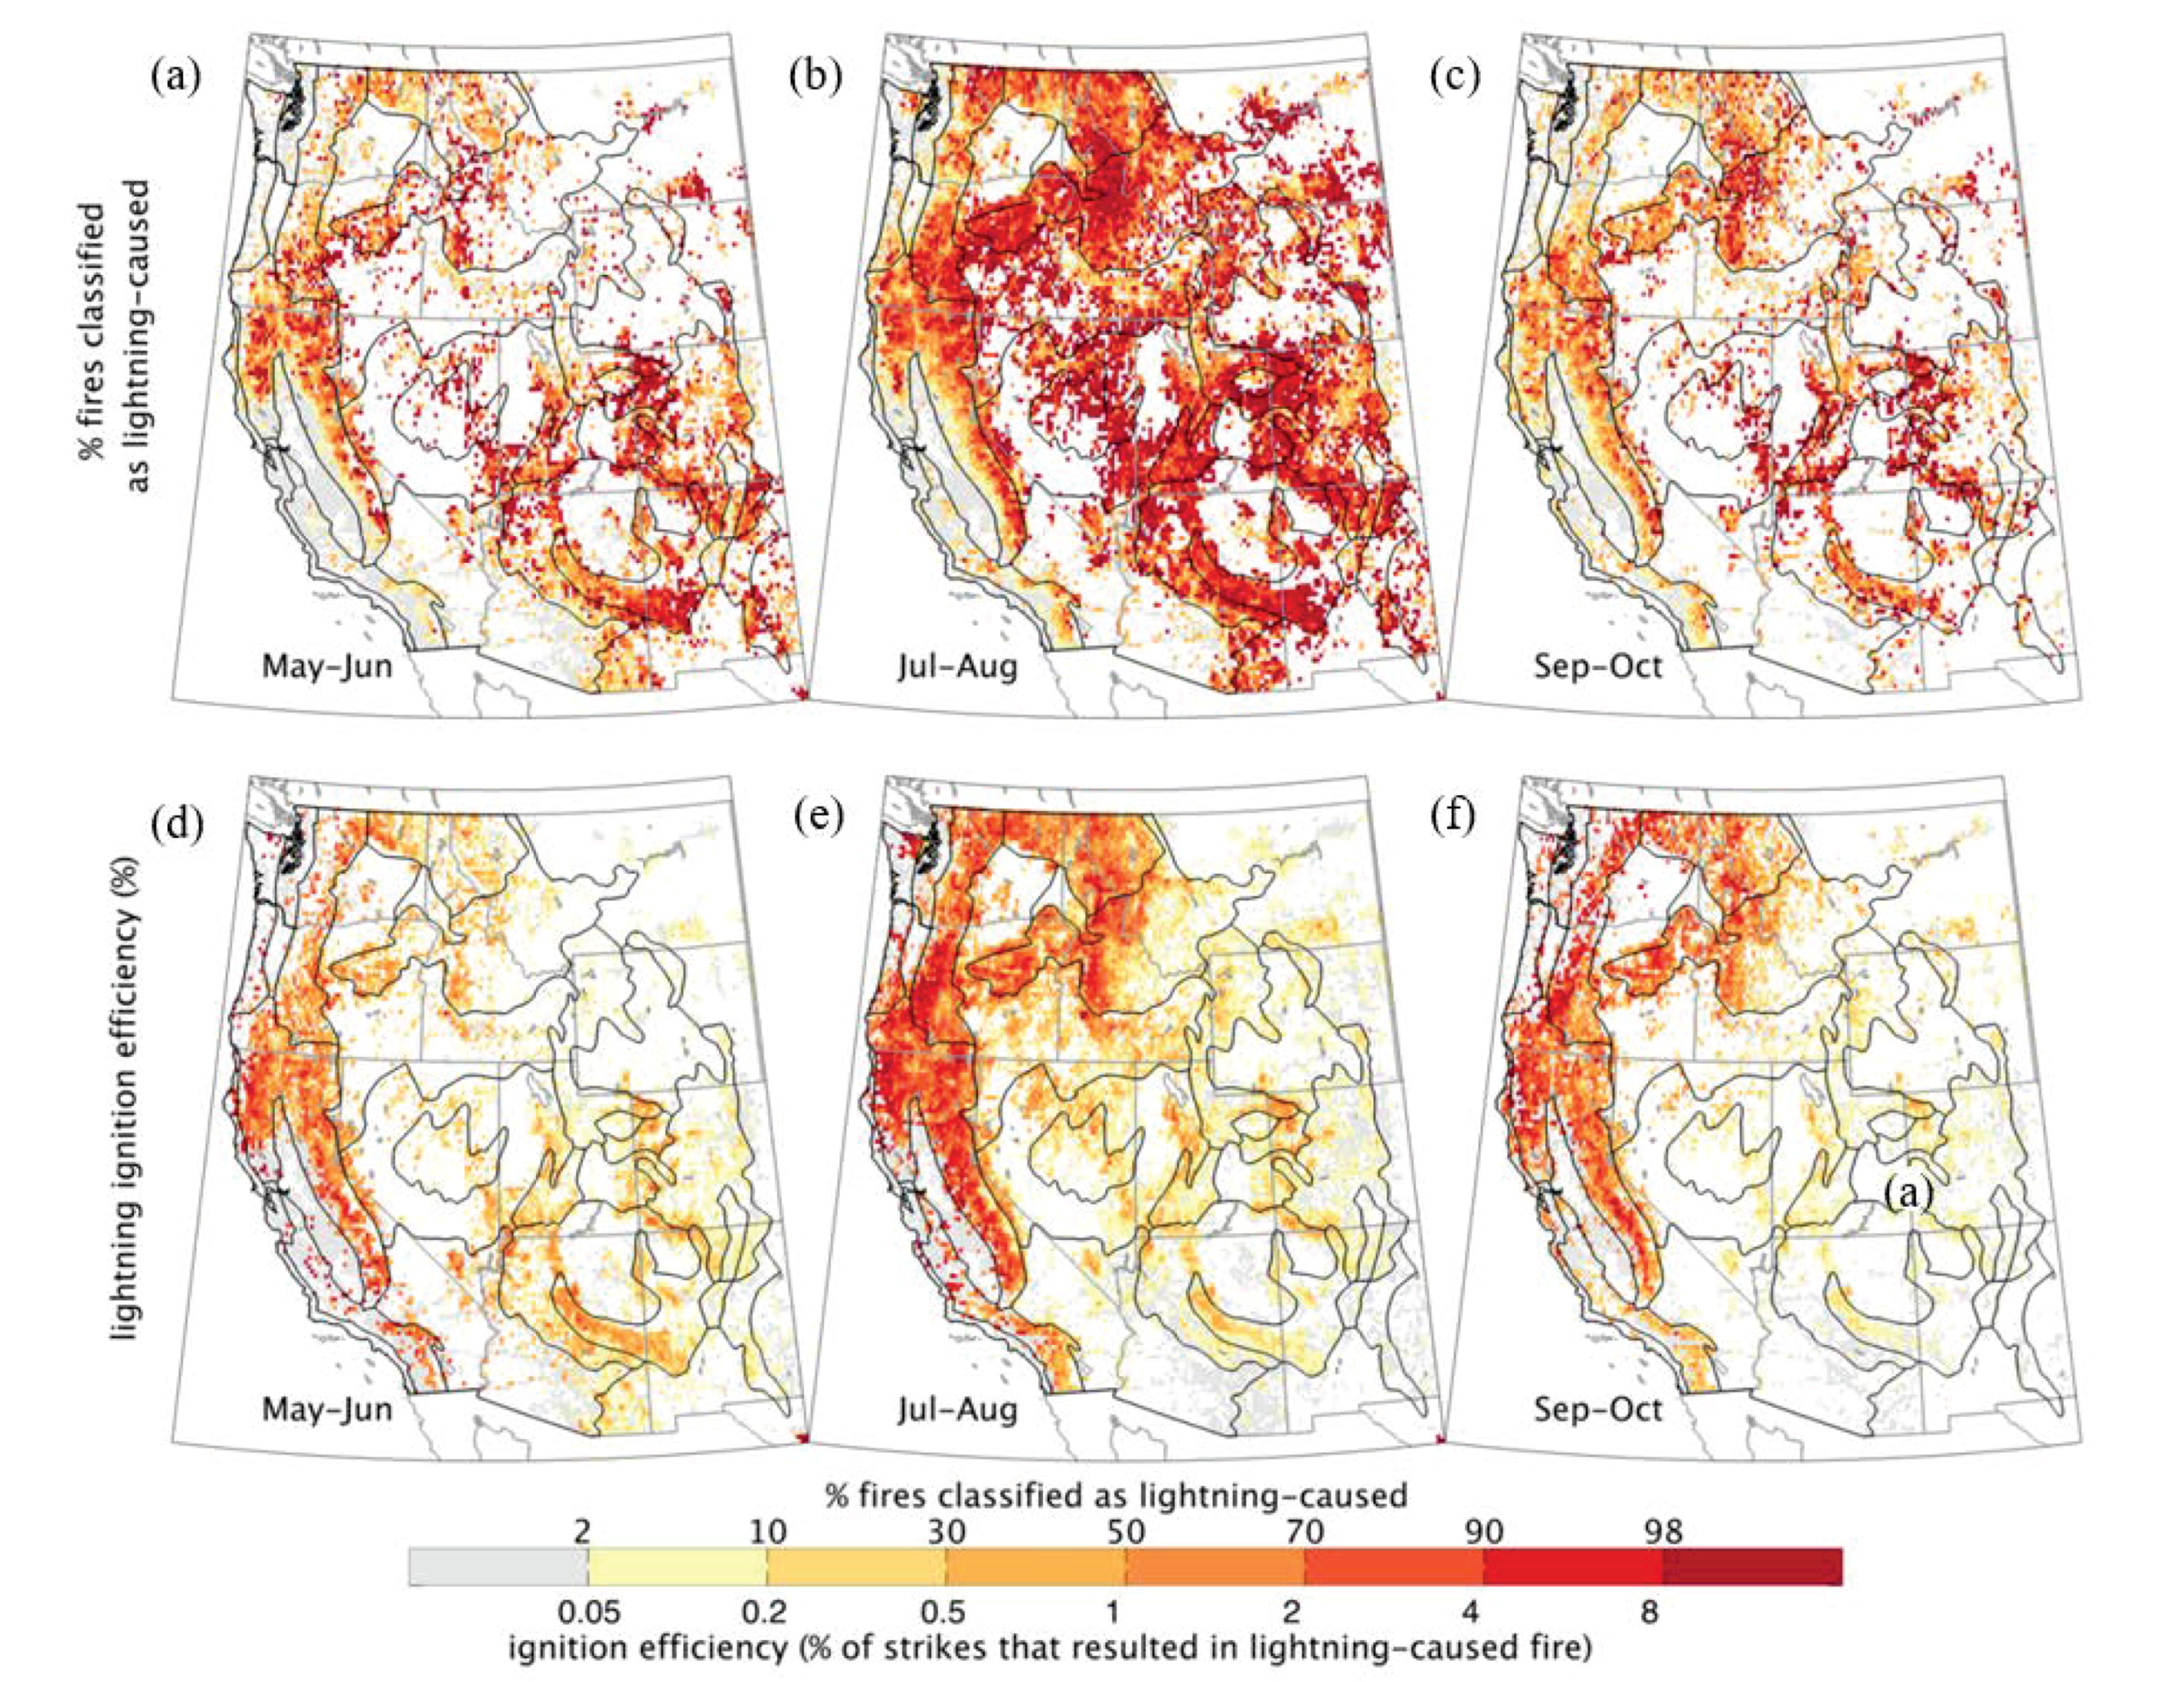
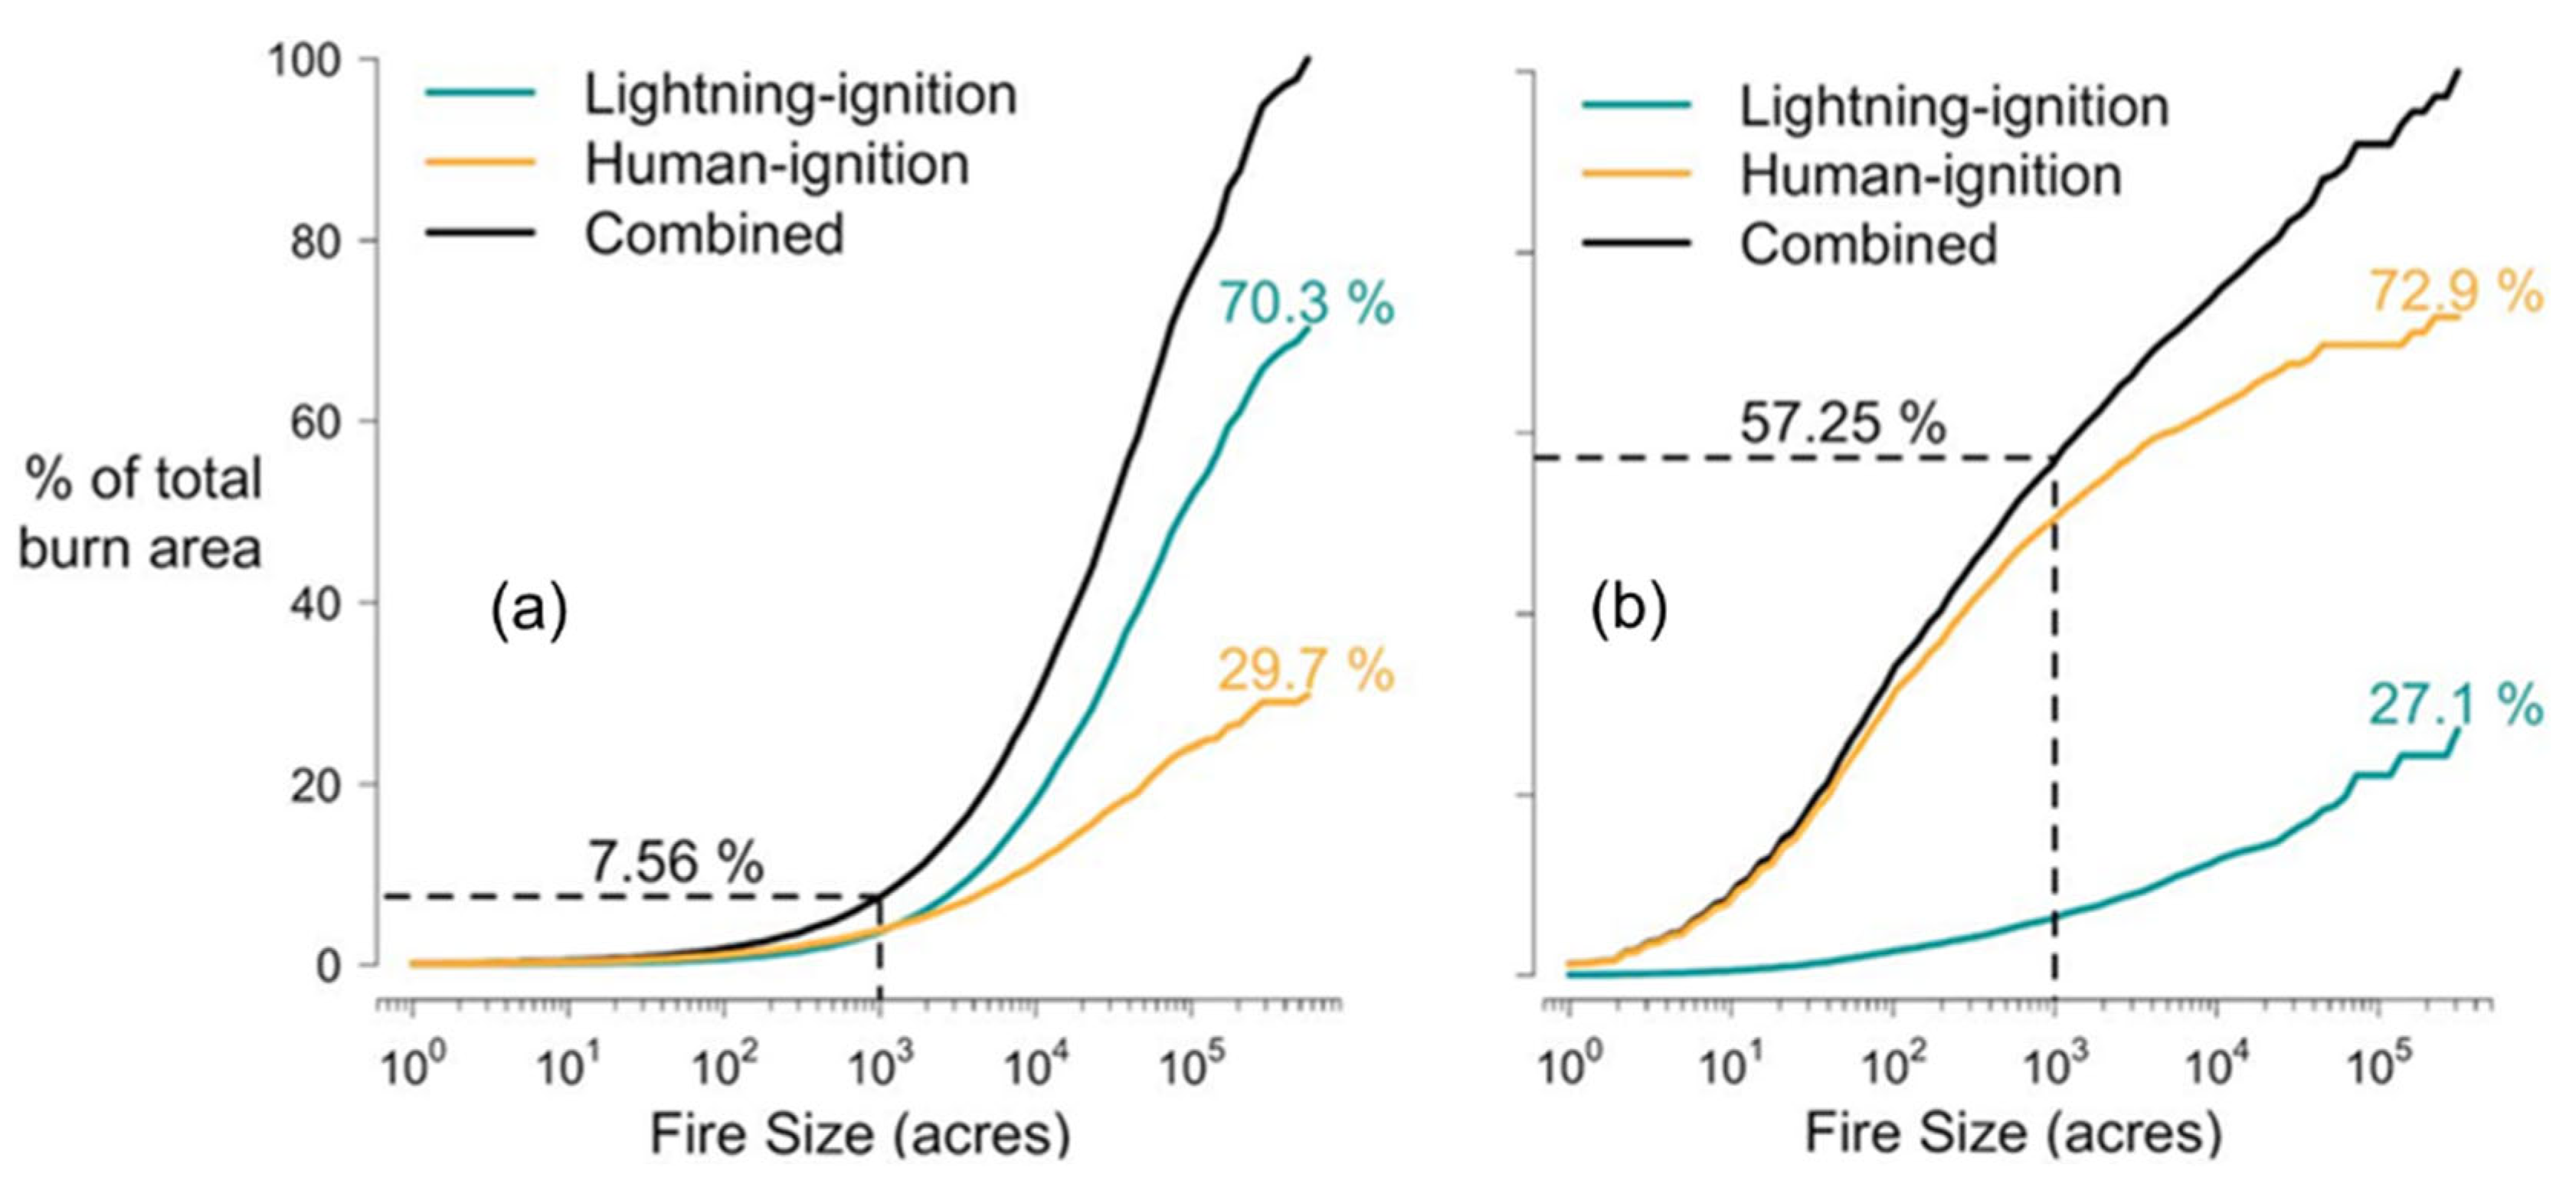
Disclaimer/Publisher’s Note: The statements, opinions and data contained in all publications are solely those of the individual author(s) and contributor(s) and not of MDPI and/or the editor(s). MDPI and/or the editor(s) disclaim responsibility for any injury to people or property resulting from any ideas, methods, instructions or products referred to in the content. |
© 2024 by the authors. Licensee MDPI, Basel, Switzerland. This article is an open access article distributed under the terms and conditions of the Creative Commons Attribution (CC BY) license (https://creativecommons.org/licenses/by/4.0/).