Abstract
Although wildfires are a common disturbance factor to the environment, some of them can cause significant environmental and socioeconomic losses, affecting ecosystems and people worldwide. The wildfire identification and assessment of their effects on damaged forest areas is of great importance for provision of effective actions on their management and preservation. Forest regrowth after a fire is a continuously evolving and dynamic process, and the accuracy assessment of different remote sensing indices for its evaluation is a complicated task. The implementation of this task cannot rely on the standard procedures. Therefore, we suggested a method involving delineation of dynamic boundaries between conditional categories within burnt forest areas by application of spectral reflectance characteristics (SRC). This study compared the performance of firmly established for fire monitoring differenced vegetation indices—Normalized Difference Vegetation Index (dNDVI) and Normalized Burn Ratio (dNBR) and tested the capabilities of tasseled cap-derived differenced Disturbance Index (dDI) for post-fire monitoring purposes in different forest environments (Boreal Mountain Forest (BMF), Mediterranean Mountain Forest (MMF), Mediterranean Hill Forest (MHF)). The accuracy assessment of the tree indices was performed using Very High Resolution (VHR) aerial and satellite data. The results show that dDI has an optimal performance in monitoring post-fire disturbances in more difficult-to-be-differentiated classes, whereas, for post-fire regrowth, the more appropriate is dNDVI. In the first case, dDI has an overall accuracy of 50%, whereas the accuracy of dNBR and dNDVI is barely 35% and 36%. Moreover, dDI shows better performance in 16 accuracy metrics (from 17). In the second case, dNDVI has an overall accuracy of 59%, whereas those of dNBR and dDI are 55% and 52%, and the accuracy metrics in which dNDVI shows better performance than the other two indices are 11 (from 13). Generally, the studied indices showed higher accuracy in assessment of post-fire disturbance rather than of the post-fire forest regrowth, implicitly at test areas—BMF and MMF, and contrary opposite result in the accuracy at MHF. This indicates the relation of the indices’ accuracy to the heterogeneity of the environment.
1. Introduction
Wildfires are a common disturbance factor to the environment. However, under particular conditions, some of them can turn into extreme wildfire events, causing a disproportionate amount of losses [1] and environmental damage, including land degradation and biodiversity loss. The detection of disturbances and post-fire regrowth monitoring is vital for ecological research and management purposes. Forest regrowth after a fire is a dynamic process, and it is a challenging task to provide an effective, easy-to-use, and cost-effective tool for monitoring and evaluating such a process. Field surveys are expensive, time-consuming, and focused on a specific fire-affected area. In the current climate change conditions and constantly increasing number and frequency of wildfires, our society and different stakeholder organizations need a universal tool for monitoring post-fire regrowth in various environments, in easily accessible or hard-to-reach areas.
Remote-sensing data and methods are successfully used to monitor post-fire forest recovery [2]. Many researchers consider forest recovery the intensity of the subsequent regrowth process (i.e., the return of vegetation and initiation of successional processes) [3,4]. Traditionally, in the context of remote sensing, for classification and mapping forest regrowth dynamics, spectral vegetation indices (VIs) are being used. VIs indirectly assess the changes occurred in the biophysical characteristics of the vegetation after a fire. Most often, these characteristics are Leaf Area Index, photosynthetic activity, water content, and moisture stress [5,6], and the indices used for their assessments are Normalized Difference Vegetation Index (NDVI) [7,8,9,10] and Normalized Burn Ratio (NBR) [9,10,11,12]. These indices involve the spectral reflectance characteristics (SRC) of vegetation in the Red and Near-infrared (NIR) bands for NDVI calculation and in the NIR and Short-wave infrared (SWIR) bands for NBR calculation to provide information on vegetation status. The spectral reflectance in the Red, NIR, and SWIR bands is affected to varying degrees when the vegetation is under stress or as a consequence of catastrophic events (e.g., wildfire). Due to the loss of vegetation, exposure, and drying of the underlying soil, the largest post-fire changes occur in the NIR and SWIR regions of the electromagnetic spectrum [13,14], whereas the visible bands show measurable changes [15]. Although the reflectance in the Red, NIR, and SWIR bands could be influenced by various biophysical factors [16], the behavior of NBR and NDVI is quite similar [17]. The healthy and green vegetation, characterized by high biomass, induce strongly positive indices values, while values close to zero indicate that vegetation is sparse, under stress, or dead. Conversely, the negative values indicate bare soils and no vegetation cover [13,18].
NBR can be used to reliably assess the burn severity in different parts of the fire-affected territories–the lower the NBR values, the greater the damage [14]. NDVI has been primarily used for short-term recovery assessments [4], while NBR could be used to characterize recovery both in short-term and long-term assessments [3,19]. The changes in forest vegetation cover can be measured using imageries captured in pre-fire and post-fire dates and calculation of differenced indices values (dNDVI and dNBR) [13]. However, the vegetation response to fire and post-fire recovery differs noticeably depending on pre-fire vegetation status, vegetation type, and biogeographical region [20]. The methods calculating dNDVI and dNBR support the study of forest ecosystem disturbance, however, they are not accurate enough to study the recovery in forest ecosystems after a fire. The main reasons are the differences in fire disturbances, species diversity, undergrowth characteristics, and different regenerative abilities of forests with various environmental conditions. In the academic literature, ambivalent reports exist on the effectiveness of spectral indices for monitoring post-fire vegetation regrowth [21,22]. None of the spectral indices has better performance in various ecosystems, scale, and time lag conditions in assessing post-fire disturbances and regrowth [23].
In recent publications, Disturbance Index (DI) [24] was proven as a relatively effective approach for detecting forest disturbance and monitoring its change [25,26,27]. The application of DI is considered a more accurate technique, compared to the standard monitoring methods, using VIs to assess the recovery of undergrowth [28]. The high accuracy of the index is based on linear orthogonal transformation of multispectral satellite images—Tasseled Cap Transformation (TCT) [29,30], which increases the degree of identification of the three main components changing during fire—soil, vegetation, and moisture [31]. Healey et al. [24] calculated DI, which is a linear combination of the three TC indices—Brightness (TCB), Greenness (TCG), and Wetness (TCW). The concept of DI assumes that burnt forests are usually characterized by higher values of TCB and lower values of TCG and TCW compared to unaffected forest areas. The areas affected by the fire have high positive TCB values and low negative TCG and TCW values, therefore, displaying high DI values, and vice versa, unaffected forest areas show low DI values [24]. The DI highlights the unvegetated spectral signatures associated with stand-replacing disturbance and separates them from all other forest signatures. When viewed sequentially, the time series of DI images provide a direct way to highlight pixels that changed from the average to a disturbed forest condition [24]. Different transformation matrices exist adjusted to the type of satellite sensor and its data [32,33,34]. Compared to Landsat, Sentinel-2 has a better spatial, spectral, and temporal resolution. It can be assumed that the DI using Sentinel-2 data would be with higher accuracy in forest recovery assessments.
The objectives of this study were to compare the reliability of dNDVI, dNBR, and dDI to assess forest disturbances and regrowth dynamics after a fire in three different forest environments. This goal was achieved by applying linear regression analyses for thematic accuracy assessment and introducing a method involving delineation of dynamic boundaries for spatial accuracy assessment. Very High Resolution (VHR) aerial or satellite images and multispectral satellite images were used as reference data in the accuracy assessment procedure (AAP).
2. Test Sites and Preliminary Assessment of the Character of the Fire Events
The assessment of indices performance for forest disturbance and post-fire regrowth monitoring was performed on tree test sites within different forest environments. They were selected based on fire characteristics, the degree of forest ecosystems disturbances, and the landscape characteristics of the natural environment. The selected test sites are Boreal Mountain Forest (BMF), Mediterranean Mountain Forest (MMF), and Mediterranean Hill Forest (MHF) and are located next to Bistritsa, Ardino, and Perperek, Bulgaria (Figure 1).
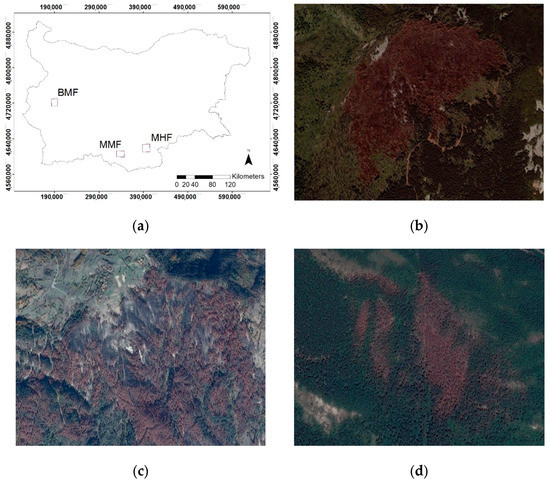
Figure 1.
Overall view of the test site locations on the territory of Bulgaria (a) and the test sites: BMF—8/2012 (b), MMF—10/2016, (c) and MHF—06/2016 (d). Background images source: Google Earth high-resolution image [35].
2.1. Boreal Mountain Forest (BMF)
The Boreal Mountain Forest test site (1430–1760 m above sea level (a.s.l.)) (Figure 1b) is situated on the northeastern slope of Vitosha Mountain, close to the capital city—Sofia, in one of the first nature reserves in Bulgaria—Bistrishko Branishte. Over 50% of its area is predominantly covered by 100 to 120 years old spruce trees. In 2001 a strong storm (tornado) fell 75.4 ha of the spruce trees. As a consequence, a bark beetle outbreak encompassed separated small areas in 2004, causing 600 ha of dead trees. On 1 July 2012, a fire broke out in the reserve. It affected 70 ha of predominantly dry and dead forest vegetation [36]. The slopes in this test site are steep (mean value of slope inclination 21°, maximum 33°), which condition the development of highly erodible shallow soils (Leptosols) with shallow depth to bedrock. The climate is mountainous, and the slopes predominantly have northwest and north exposures, defining cold and wet conditions for vegetation development. According to the Köppen climate classification, the climate belongs to the Continental (Boreal) type [37].
2.2. Mediterranean Mountain Forest (MMF)
The Mediterranean Mountain Forest test site (660–990 m a.s.l.) is situated in the southeastern part of the Rhodope Mountains, near Ardino town, where a significant fire occurred on 29 July 2016 (Figure 1c). The affected area is 100 ha with main tree species—Scots pine (Pinus sylvestris L.) and Black pine (Pinus nigra Arn.). The native vegetation in the region refers to the Thracian province of the European deciduous forest area. However, due to extensive erosion processes in the 1950s and the expansion of bare lands, large-scale afforestation with coniferous species has been performed [38]. The mean value of slope inclination is 16°, and the maximum is 27°. Soils are shallow Luvisols. The climate is Continental-Mediterranean, modified by the mountainous conditions. The winters are mild, and summers are dry and hot. The slopes have predominantly east, southeast, and south exposures and define warm and dry conditions for vegetation development. According to the Köppen climate classification, the climate belongs to the hot-summer Mediterranean climate type [26].
2.3. Mediterranean Hill Forest (MHF)
The Mediterranean Hill Forest test site (360–440 m a.s.l.) is situated in the northeastern part of the Rhodope Mountains, near Perperek village (Figure 1d). A fire occurred on 21 November 2015 and affected an area of 30 ha with mixed and coniferous forests. The mixed forests consist of Turkey oak (Quercus cerris L.), hornbeam (Quercus frainetto T e n), and Oriental hornbeam (Carpinus orientalis M i l l.) with Mediterranean elements. Similarly to the MMF, due to expanded erosion, afforestation with Black pine (Pinus nigra Arn.) has been performed [38]. The climate is Continental-Mediterranean. The soils are Chromic Cambisols. The Mediterranean Hill Forest has a lower altitude and gentler slopes (mean value of slope inclination of 10° and maximum 17°) than the other test sites. The slopes are with northeast exposures. The climate conditions for vegetation development are similar to those of the MMF site (hot-summer Mediterranean climate type) [37]. However, the character of the relief and gentler slopes define lower vulnerability to soil erosion and more favorable conditions for vegetation regrowth.
2.4. Preliminary Assessment of the Character of the Fire Events
The ecosystems most affected by the fire forest were those of the Boreal Mountain Forest. The pre-fire forest state here was the worst, with completely dry forest stands, which served as a perfect fuel for the wildfire, additionally favored by the climatic conditions in the summer. The steep slopes influenced the rapid spread of the fire and hindered its suppression. As a result, the forest was destroyed.
In the Mediterranean Mountain Forest, the fire occurred in the mid-summer under hot and dry climatic conditions. Due to frequent and prolonged droughts, the forest ecosystems in this part of Bulgaria have been under stress in the recent summers [39,40]. The topography influenced the wildfire as well, but the forest was not entirely damaged, as it was in the Boreal Mountain Forest.
The fire in the Mediterranean Hill Forest occurred during winter. The cold and humid conditions, the higher moisture content in the forest ecosystems, and the comparatively gentler slopes determined the lower intensity of the fire and affected forest ecosystems less.
The Mediterranean forests differ from the boreal ones in their management policy. After the fires, the damaged forest stands were removed by sanitary loggings in 2017 (MHF) and 2018 (MMF).
3. Methodology and Data Used
The general methodological approach considers assessment of indices performance, aiming at their comparison of pre- and post-fire events at the test sites. The essence of the comparison of indices performance consists of their accuracy evaluation in assessing forest damage and subsequent forest regrowth in different forest environments.
In terms of post-fire monitoring (i.e., regrowth and disturbance), a variety of acquisitions available was utilized, which constitutes Sentinel-2 and Landsat family satellite optical data, as well as VHR aerial and satellite optical data.
3.1. Data and Data Processing
3.1.1. Classified Data
The differenced spectral indices (dDI, dNBR, and dNDVI) were considered as classified raster thematic maps. The images used were acquired between 2012 and 2022 (Table A1). The data processing of multispectral satellite images included basic operations, such as georeferencing, resampling, subsetting, etc. Resampling was required because of the difference in the spatial resolution of the used Landsat 7 ETM +, Landsat 8 OLI, and Sentinel-2 data. The spatial and spectral characteristics of the individual sensors are presented in Table A4 [41]. The classified output rasters are with a spatial resolution of 20 m. Erdas Imagine 2014, Version 14, Madison, AL, USA, and Quantum GIS, Version 3.16, Beaverton, OR, USA software were used for the purpose of data processing operations. Statistical analyses were performed on SigmaPlot, Version 14.5, San Jose, CA, USA software. Landsat and Sentinel satellite data are freely available through the online platform of the U.S. Geological Survey—Earth Explorer [42], and Sentinel data only—through the Copernicus Open Access Hub [43].
3.1.2. Reference Data
VHR Aerial and Satellite Data
The VHR satellite data used are from World View (WV) (2/3) and GeoEye (GE) (1) sensors of MAXAR technologies (Table A2). The processing of the optical data was performed via the extensive cloud-based Earth Observation platform—Sentinel-Hub (c)—SH, provided by “Synergise” (Slovenia). Imageries with zero cloud cover were selected over the test sites, dated before and after the fire events. As a result, four processed image output data products were generated: NDVI RGB pseudo color integer and NDVI rasters, both with 2.0 m spatial resolution, PAN-sharpened, multi-band imagery with 0.6 m spatial resolution, and three-band imagery consisting of the infra-red channels only with 2.0 m spatial resolution.
In addition to the VHR satellite data, aerial images acquired in 2013, 2016, and 2017 (Table A2) were used in the AAP. Their spatial resolution is ≤0.4 m. The aerial images were validated with ground reference and control points—ground reference points—at least 1 point every 30 km2, control points—at least 1 point every 100 km2. Root Mean Square of the ground reference points <0.5 m. The aerial images were orthorectified using standard algorithms and procedures for the orthogonalization of aero-photos. The aerial images were also radiometrically corrected. Both individual alignment of one photo and block alignment of all photos were performed (Table A2).
Multispectral Landsat and Sentinel data
Landsat and Sentinel-2 images acquired between 2013 and 2022 were also used as reference data in the AAP (Table A3) for the purpose of generation /extraction of SRC profiles.
3.2. Spectral Indices Used for Post-Fire Monitoring
Table 1 presents the vegetation indices formulas.

Table 1.
Spectral indices used for classified raster thematic maps.
DI calculation was based on TCT applied on stacked multi-band images. The outputs from this procedure were TCT multi-band images containing three layers—TCB, TCG, and TCW. Decomposition was applied on each of them. The next step was the calculation of the normalized values of the TC components—the mean and standard deviations (SD) calculation and the normalized values of the TC components. These spectral normalization steps were taken to normalize the radiometric change. The normalization was conducted as follows:
where E{TCB}, E{TCG}, and E{TCW} represent the mean TC Brightness, Greenness, and Wetness of the mature forest class, respectively. SD (TCB), SD (TCG), and SD (TCW) are the corresponding standard deviations within the mature forest class, and hence nTCB, nTCG, and nTCW indicate the Brightness, Greenness, and Wetness normalized by the statistics of a “mature forest” class, respectively. The “mature forest” class was identified using Corine High-Resolution Layers [45]. After the normalization, the three component indices were combined linearly to acquire DI [24] as follows:
nTCW = (TCW − E{TCW})/(St.Dev(TCW))
nTCB = (TCB − E{TCB})/(St.Dev(TCB))
nTCG = (TCG − E{TCG})/(St.Dev(TCG))
DI = nTCB − (nTCG + nTCW)
3.3. Accuracy Assessment Procedure (AAP)
In this study, the accuracy assessment procedure (AAP) includes an evaluation of the indices’ thematic accuracy and their spatial accuracy.
3.3.1. Thematic Accuracy Assessment
For the purposes of thematic accuracy, we used regression analyses between the forest regrowth output maps, calculating dDI and traditionally used dNDVI and dNBR. The rationale behind this approach is that dNBR and dNDVI have already been proven in monitoring fire disturbance and regrowth [5,17], and dDI is unknown and unexplored for these purposes. In the regression analysis, we calculated the standard error of estimate (SEE) and the coefficient of determination (Rsqr).
3.3.2. Spatial Accuracy Assessment
The spatial AAP consists of several steps presented in Figure 2.
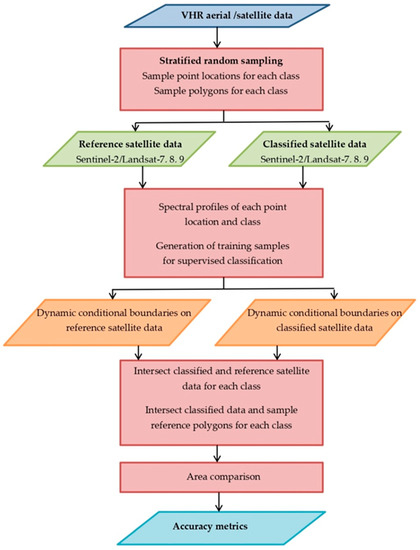
Figure 2.
Schematic representation of spatial AAP.
The post-fire disturbance classes include: (i) Unaffected (UA), slightly affected (SA), moderately affected (MA), and highly affected (HA) by the fire event areas, and the post-fire regrowth classes are (ii) areas with low regrowth intensity (LRI), moderate regrowth intensity (MRI), and high regrowth intensity (HRI). The post-fire classes indicate the forest regrowth dynamics a few years after the fire event. However, due to the severe damage to the forest vegetation after the fire event, the differentiation of the post-fire classes was very difficult for the Boreal Mountain Forest test site. For that reason, that area was divided into two categories: Vegetated areas (VA) and non-vegetated areas (NVA) (See Section 4 and Section 5). The differentiation of the individual classes is based on the SRCs of each of them. The SRCs are determined by the combined use of VHR aerial and/or satellite data and independent multispectral satellite data. The spatial resolution of the VHR data ranges between 0.5 and 2 m and, in this study, substitutes the field survey of the affected areas. Using VHR images instead of field data has been imposed as a standard practice in Earth Observation [46,47,48,49]. In this study, VHR data were used for the individual disturbance and regrowth categories identification in different point locations, and multispectral satellite data—for generation of SRCs of these categories and delineation of dynamic boundaries based on supervised classifications. Supervised classifications were performed on the independent multispectral satellite images and on the output indices rasters. The independent satellite images could be Landsat 7, 8, 9, or Sentinel-2 images, depending on the satellite source used in the indices’ generation. Indices utilizing Sentinel-2 image for their calculation used Landsat image in the AAP as independent multispectral satellite data, and vice versa. If the output index raster is Landsat-based, the independent data are Sentinel-2-based.
Two sample types, representative of each of the individual categories, were used in the spatial AAP: Sample points and sample polygons. Table 2 and Table 3 summarize the number of sample points and the area of sample polygons. In sampling, we aimed to have a sufficient number of point samples and large enough areas of polygon samples. However, due to intra-categorical heterogeneity for some categories, the number and area of samples differ. More samples were used for the categories with a possibility of error in interpretation.
Table 2.
Number of the sample points and area of the sample polygons used for each individual post-fire disturbance category in the different test sites (VA, vegetated area; NVA, non-vegetated area; UA, unaffected; SA, slightly affected; MA, moderately affected; HA, highly affected).
Table 3.
Number of the sample points and area of the sample polygons used for each individual post-fire regrowth category in the different test sites (LRI, low regrowth intensity; MRI, moderate regrowth intensity; HRI, high regrowth intensity).
Figure 3, Figure 4 and Figure 5 show the VHR data used for categorization of affected by wildfires test sites (a and b; g and h), the sample point locations for generation of spectral profiles of the individual categories, and training samples for supervised classifications applied on multispectral reference data (c; i), and the output indices rasters obtained after spatial AAP (d,f,g; j,k,l).
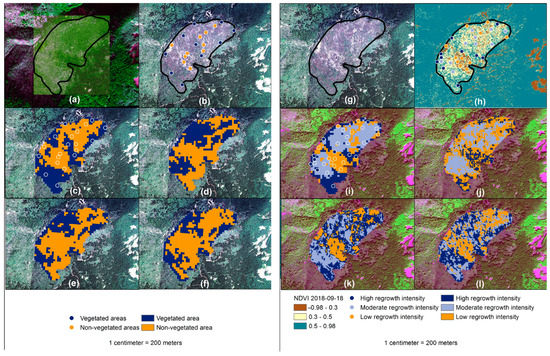
Figure 3.
Boreal Mountain Forest test site: Input VHR data used for categorization of affected by wildfires test sites (a,b; g,h), output rasters from unsupervised classifications on multispectral satellite composite images (c,i), and output indices rasters obtained after spatial AAP (d,e,f; j,k,l).
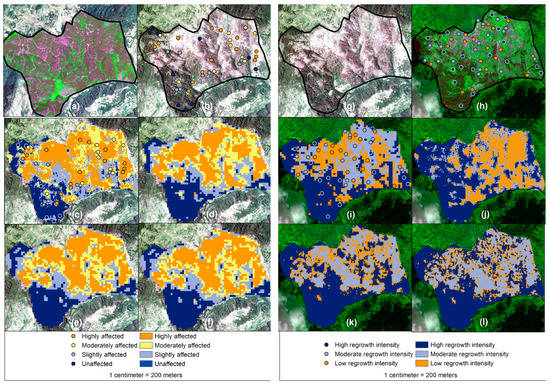
Figure 4.
Mediterranean Mountain Forest test site: Input VHR data used for categorization of affected by wildfires test sites (a,b; g,h), output rasters from unsupervised classifications on multispectral satellite composite images (c,i), and output indices rasters obtained after spatial AAP (d,e,f; j,k,l).
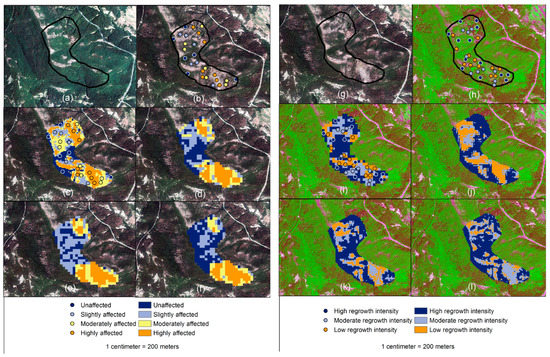
Figure 5.
Mediterranean Hill Forest test site: Input VHR data used for categorization of affected by wildfires test sites (a,b; g,h), output rasters from unsupervised classifications on multispectral satellite composite images (c,i), and output indices rasters obtained after spatial AAP (d,e,f; j,k,l).
Due to the disaster events that had previously occurred (tornado and bark beetle outbreak) and destroyed almost entirely the coniferous forest vegetation, the differentiation of the individual disturbance categories after the fire was difficult in the Boreal Mountain Forest test site. The only possible differentiation in disturbance categories was the division of the territory into vegetated and non-vegetated areas. Figure 3a shows the state of the Boreal Mountain Forest test site at the end of November 2011, represented on WV2 pan-sharpened satellite image in band combination Green-Blue-Red (in the polygon boundaries). Figure 3b shows the post-fire state in 2013, presented in an aerial image. As a reference, a multispectral satellite image for spectral profiles generation of the sample point locations was used Ls7ETM+ image, acquired on 19/08/2013 (Figure 3c). The output indices rasters were calculated for the period between 29/06/2012 and 19/08/2013. They are shown in Figure 3 as follows: dDI (d), dNBR (e), and dNDVI (f).
The differentiation of post-fire forest regrowth was done using the aerial image from 2013 as a basis (Figure 3g) and NDVI raster, calculated on the WV2 image acquired on 18/09/2018 (Figure 3h). The spectral profiles of point locations were generated using Ls8 OLI image, acquired on 04/09/2016 (Figure 3i). The categorized indices rasters are shown in Figure 3j–l. They represent the vegetation regrowth to 13/07/2016.
The post-fire disturbance categories for the Mediterranean Hill Forest test site were differentiated using a GE1 pan-sharpened image with band combination Blue-NIR-Red, acquired on 19/05/2013 (in the polygon boundaries) and an aerial image from 2017 (Figure 4a,b). The applied band combination was preferred as it distinguishes the individual types of forest vegetation precisely (Figure 4a). The deciduous species are presented in bright green, and the coniferous species—in dark green. The spectral profiles were generated on Sentinal-2A image acquired on 15/07/2017 (Figure 4c). The locations of sample points are presented on Figure 4 b and c. The output categorized indices rasters were calculated using Landsat 8 OLI images, acquired on 16/05/2013 and 20/05/2017 (Figure 4d–f).
The forest regrowth categories were differentiated using the aerial image from 2017 (Figure 4g) and a WV2 pan-sharpened image acquired on 04/08/2021 (Figure 4h). The spectral profiles were generated on Landsat 8 OLI image, acquired on 18/07/2021 (Figure 4i). The locations of sample points are presented on Figure 4 h and i. The output indices rasters were calculated using Sentinel 2A images acquired on 15/07/2017 and 03/08/2021 (Figure 4j–l).
The post-fire forest disturbance categories for the Mediterranean Hill Forest test site were differentiated using aerial images acquired in 2013 and 2017 (Figure 5a,b). The spectral profiles for the point locations were generated on Sentinel 2A image, acquired on 10/07/2016 (Figure 5c). The output indices rasters were calculated using Landsat 8 OLI images acquired on 12/07/2013 and 21/08/2016 (Figure 5d–f).
The forest regrowth categories were differentiated using the aerial image from 2017 (Figure 5g) and a WV3 pan-sharpened image acquired on 17/06/2022 (Figure 5h). The spectral profiles were generated on Landsat 9 OLI-2 image acquired on 04/07/2022 (Figure 5i). The output indices rasters were calculated on Sentinel 2A images acquired on 24/08/2017 and 14/06/2022 (Figure 5j–l).
3.4. Error Matrix and Accuracy Metrics
The accuracy metrics were calculated using confusion (error) matrices for each test site and for each period of observation. The confusion matrices compare the classified output indices rasters and categorized reference data in two ways: For the entire territory of the test sites and for the territory of sample polygones only. The Error matrix consists of an N × N array where N is the number of classes (categories) in the data. The columns represent the reference data or the ground truth, and the rows represent the mapped categories generated based on remotely sensed data [50].
Overall accuracy (OA) shows the proportion of correctly mapped reference data. Overall accuracy is traditionally expressed as a percentage with 100% accuracy being a perfect classification where all reference sites were classified correctly [50].
Errors of omission (EO) refer to reference sites (the real class or category), and Errors of commission (EC) refer to the classified results. EO and EC are calculated by reviewing the reference and classified sites for incorrect classifications. Separate EO and EC are calculated for each class/category. The sum of incorrect EO classifications accounted in the columns of the error matrix is divided by the total number of reference sites, and the sum of incorrect EC accounted in the rows of the error matrix is divided by the total number of classified sites [50].
Producer’s Accuracy (PA) represents the map accuracy from the perspective of the map producer, and User’s Accuracy (UA)—from the perspective of the map user. PA shows how often the real features on the ground (the reference data) are correctly illustrated on the classified map, and UA represents how often the class on the map is actually presented on the ground. PA is calculated as the number of reference sites classified accurately divided by the total number of reference sites for that class. The UA is calculated by dividing the total number of correct classifications for a particular class by the total of mapped classes [50].
4. Results
4.1. Thematic Accuracy Assessment
Thematic accuracy assessment was performed by application of statistical regression analysis between the output maps of forest regrowth using dDI and traditionally used differenced dNDVI and dNBR indices (Table 4). The linear regression analysis encompasses both—pre-fire and post-fire periods for the three test sites. Results showed a stronger dependency between dDI and dNBR, compared with the dependency between dDI and dNDVI, especially for the post-fire monitoring period. There are also differences between the observed dependencies between individual test areas. That indicates the influence of local environmental conditions on the indices’ performance and, respectively, on their thematic relatedness. The highest observed dependency is between dDI and dNBR for the Mediterranean Mountain Forest test site and the weakest for the Boreal Mountain Forest. The dependency between dDI and dNDVI was highest for the Mediterranean Hill Forest in the pre-fire period (Table 4).
Table 4.
SEE, Rsqr, and N values derived for linear regression analyses between dDI and dNBR and between dDI and dNDVI.
The test sites, having greater intra-territorial differences (MMF and MHF), were distinguished by higher standard error of estimate (SEE) values. Moreover, the SEE increased with the increase of intra-territorial differences. Assessing post-fire disturbance (soon after the fires), the values of SEE were lower than in the post-fire regrowth (a few years after the fires). A few years after the fires, the intra-territorial differences increased due to differences in vegetation development patterns within the territory. The lowest observed SEE was the Boreal Mountain Forest test site, where the intra-territorial differences were the weakest due to the landscapes’ characteristics and slower vegetation regrowth. The SEE in the Boreal Mountain Forest test site slightly increased a few years after the fire due to post-fire regrowth.
Figure 6 and Figure 7 graphically present the linear regression analyses between dDI and dNBR and between dDI and dNDVI for post-fire disturbance and post-fire regrowth processes. The graphs clearly show the stronger linear dependence between the indices soon after the fires (in the post-fire disturbance assessments) (Figure 6). In the post-fire regrowth period, the linear dependence decreased (Figure 7). In general, the dependencies between the individual indices followed the expected pattern: dDI values increased when dNBR values increased, while in terms of dNDVI, the tendency is the opposite—higher dNDVI values corresponded to lower dDI values.
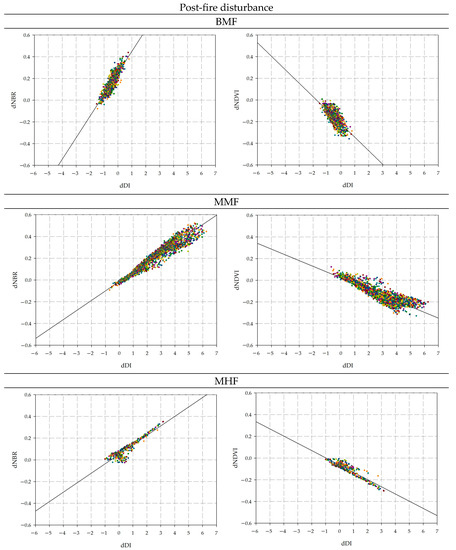
Figure 6.
Linear regression graphs, showing the dependence pattern between dDI and dNBR and between dDI and dNDVI for post-fire disturbance.
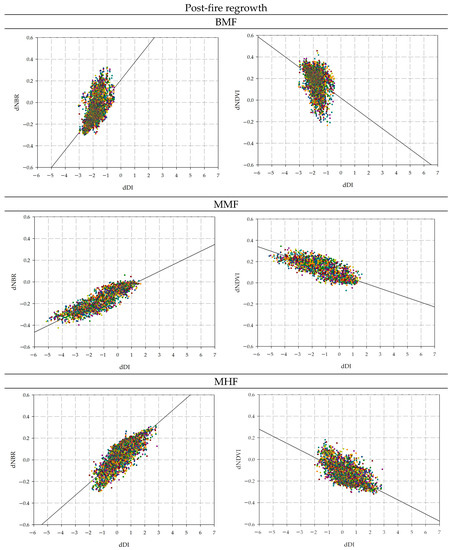
Figure 7.
Linear regression graphs showing the dependence pattern between dDI and dNBR and between dDI and dNDVI for post-fire regrowth.
4.2. Accuracy Metrics
dNDVI was distinguished as the index with the highest accuracy and lowest percentage of errors for post-fire disturbance in the Boreal Mountain Forest test site, whereas dDI was the index with the worst performance. The results for post-fire regrowth accuracy were similar. However, the overall accuracy in this case was comparatively low (50–55%). dNDVI showed better performance in the two extreme categories, especially in those showing high regrowth intensity. dNBR, on the contrary, has better performance in the category showing low regrowth intensity. The optimal performance for the moderate regrowth intensity was dDI (Table 5).
Table 5.
Accuracy metrics, calculated for dDI, dNBR, and dNDVI for the BMF test site, for post-fire disturbance and post-fire regrowth raster outputs, on the basis of the entire fire area (using multispectral satellite image as reference data) and on the basis of key areas of the fire (using sample polygons as reference data). OA—Overall accuracy; EO—Error of omission; EC—Error of commission; PA—Producer’s accuracy; User’s accuracy; VA—Vegetated area; NVA—Non-vegetated area; LRI—Low regrowth intensity; MRI—Moderate regrowth intensity; HRI—High regrowth intensity. The values indicating best performance are marked with red color.
The spectral reflectance curves for the regrowth categories showed strong convergence between the categories with high regrowth intensity and moderate regrowth intensity. It could be noticed that dDI was distinguished with better accuracy metrics in the category with moderate regrowth intensity comparing these two categories. dNBR and dNDVI showed worse performance in the category with high regrowth intensity, but in general, the differences between these two indices were lower than dDI (Figure 8b).
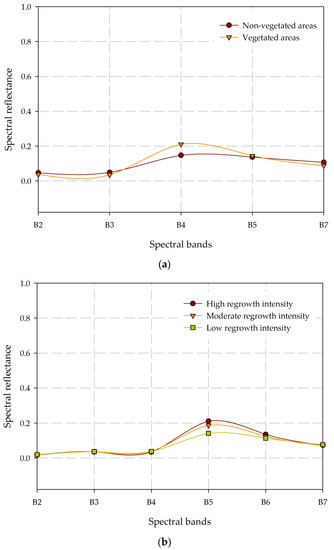
Figure 8.
Spectral curves for the individual categories differentiated in the BMF test site: (a) Post-fire disturbance (Ls7 ETM+, 19/08/2013) and (b) post-fire regrowth (Ls8 OLI, 04/09/2016).
dDI showed optimal performance in post-fire disturbance assessment in the Mediterranean Mountain Forest and in the Mediterranean Hill Forest test sites. dDI has higher overall, producer’s, and user’s accuracy and the lowest percentage of errors. The advantages of dDI were indisputable, especially in the Mediterranean Hill Forest test site.
The OA was higher in the Mediterranean Mountain Forest test site. It ranged between 58% and 76% for the individual indices. The OA of dDI was between 61% and 76%, depending on the approach used in the AAP (entire area or key areas of the test site involved in the AAP). dNBR and dNDVI had an equal performance in post-fire disturbance assessment in the Mediterranean Mountain Forest and Mediterranean Hill Forest test sites (Table 6).
Table 6.
Accuracy metrics, calculated for dDI, dNBR, and dNDVI for the MMF and MHF test sites for post-fire disturbance raster outputs on the basis of the entire fire area (using multispectral satellite image as a reference data) and on the basis of key areas of the fire (using sample polygons as reference data). OA—Overall accuracy; EO—Error of omission; EC—Error of commission; PA—Producer’s accuracy; User’s accuracy; UA—Unaffected; SA—Slightly affected; MA—Moderately affected; HA—Highly affected. The values indicating best performance are marked with red color.
Analysis of the spectral curves showed better differentiations of the unaffected (UA) by the fire territories in the Mediterranean Mountain Forest test site and strong convergence of the other three forest disturbance categories (Figure 9). The differentiation of the individual forest disturbance categories was clearer in the Mediterranean Hill Forest test site. The most distinguishable were the moderately affected and highly affected territories. Stronger convergence was observed in the less affected areas (unaffected (UA) and slightly affected (SA)) (Figure 9b). There was very little difference in the accuracy metrics’ values between the individual indices for the unaffected areas in the Mediterranean Mountain Forest. However, dDI had slightly better performance. In the remaining three categories, which are more difficult to distinguish, dDI had better performance by several percentages, reaching up to 10% difference for the EO for the MA category (Table 6).
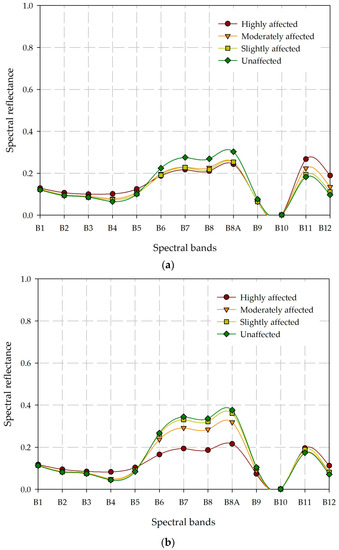
Figure 9.
Spectral curves for the individual post-fire disturbance categories differentiated in (a) the MMF (S2A, 15/07/2017) and (b) MHF (S2A, 10/07/2016) test sites.
The dDI showed a significant advantage over dNBR and dNDVI in the hard-to-differentiate disturbance categories (unaffected (UA) and slightly (SA)) in the Mediterranean Hill Forest test site. That was especially noticeable for the category UA. The difference in accuracy between dDI and the other two indices ranged between 5% and 50%. dDI had 50% better performance for the Error of Omission and the Producer’s Accuracy of the category UA. dNDVI percentage difference for the same accuracy metrics was 18%. The difference in the Error of Omission and User’s accuracy for the category UA between dDI and the other two indices was 28% (Table 6).
The OA for the post-fire regrowth assessments ranged between 44% and 69% for the individual indices in the Mediterranean Mountain Forest and Mediterranean Hill Forest test sites. These values also depend on the approach applied for accuracy calculation. The highest OA (69%) had dNDVI in the Mediterranean Hill Forest. dNDVI was also distinguished with optimal performance in the Mediterranean Hill Forest (Table 7). The analysis of the forest regrowth categories spectral curves showed there was almost complete convergence between the three categories in the Mediterranean Hill Forest, while in the Mediterranean Mountain Forest, there was albeit a weak differentiation (Figure 10). dNDVI had between 11% and 38% better accuracy metrics when assessing the accuracy for the low regrowth intensity and (LRI) and moderate regrowth intensity (MRI) categories. Clearly distinguishable was the difference with dDI. The difference between those indices was 38% for the LRI and 27% for the MRI categories.
Table 7.
Accuracy metrics, calculated for dDI, dNBR, and dNDVI for MMF and MHF test sites for post-fire regrowth raster outputs on the basis of the entire fire area (using multispectral satellite image as a reference data) and on the basis of key areas of the fire (using sample polygons as reference data). OA—Overall accuracy; EO—Error of omission; EC—Error of commission; PA—Producer’s accuracy; User’s accuracy; LRI—Low regrowth intensity; MRI—Moderate regrowth intensity; HRI—High regrowth intensity. The values indicating best performance are marked with red color.
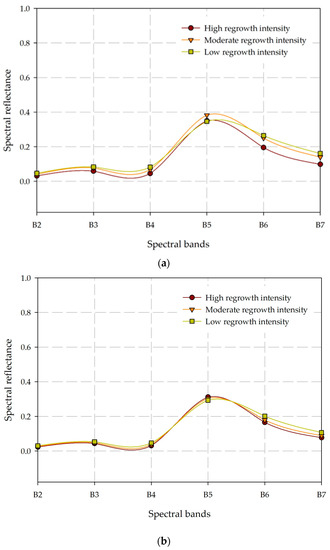
Figure 10.
Spectral curves for the individual post-fire regrowth categories differentiated in the (a) MMF (Ls8 OLI, 18/07/2021) and (b) MHF (Ls9 OLI-2, 04/07/2022) test sites.
5. Discussion
5.1. Baseline Principles for Assessment of Indices Performance
The thematic validation of classified dynamic processes was performed by comparing the classified map with independent reference products illustrating similar processes and/or related to them indicators and application of statistical regression analysis as a proven good practice for thematic validation of map models and products based on remotely sensed data [51]. The evaluation of spatial accuracy, however, is a far more challenging task. The quantitative assessment of spatial accuracy imposes a spatial constraint on dynamic processes, their categorization, and delineation of boundaries between these categories. For that reason, we suggested a method involving delineation of dynamic boundaries between conditional categories within the affected by fire forest areas. We call the boundaries dynamic because they change over time and depend on the current state of the studied object. Fire creates heterogeneity in the landscape, which impacts the dynamic of the forest regrowth process [13]. Moreover, the regional biophysical characteristics, such as topography, climate, hydrography, soil, and vegetation, also affect the regrowth process, creating specific intra-system dynamics. Consequently, the classification of such a process should not be categorical (i.e., low recovery, moderate recovery, or high recovery) but have to account quantitatively for the process dynamics. However, for the purposes of the AAP only, we suggested the division of the affected test sites into conditional categories with dynamic boundaries, delineated for each individual site and each individual monitoring period—soon after fire for assessment of post-fire disturbance and mid-term after fire for assessment of post-fire regrowth. In potential future monitoring, the boundaries will change their location again, depending on the impact of the natural environment. The spread of the conditional categories will also differ.
The differentiation of the individual categories was based on the SRCs of each of them and application of supervised classification. This procedure involved the entire test area and was initiated to avoid subjectivity in the determination of threshold indices values for the individual land cover change categories. Determination of threshold indices values is a standard practice in remote sensing monitoring but setting identical threshold indices values in monitoring dynamic processes, such as forest regrowth would be illogical and irrelevant. The involvement of supervised classifications in the process of delineation of dynamic boundaries for the individual categories is a fundamental principle in the proposed methodology. The application of supervised classifications on each of the newly involved satellite imagery enables the dynamic normalization of natural processes—forest disturbance or forest regrowth.
The traditional approaches for accuracy assessment of thematic maps require a selection of sample units of a thematic map, which have to be further compared thematically and spatially to reference or ground truth data (e.g., field observations, aerial images, other independent data sources) [50,52]. The sample units could be pixels, a block of pixels, or a map polygon. Furthermore, the sample units and, generally, the sampling process should be designed in a manner guaranteeing the reliability of the accuracy assessment [50]. The validation of thematic maps using sample units is a general requirement when mapping large territories. However, the selected test sites for validation and accuracy assessment in this study are between 10 and 100 ha. The large wildfires taking place in Bulgaria rarely exceed this area. Taking this into consideration, we assumed that a more appropriate approach was to involve the entire test area in the process (i.e., 100% of the classified map to be compared to 100% of the reference raster), taking into account the differences induced by the relief and topography. The proposed approach involves stratified random sampling dividing the studied area into smaller groups, or strata, based on shared characteristics. In this paper, the stratification objects were the conditional categories, but rather the sample selection to be performed after the classified map generation [50], the categories were defined in advance based on the spectral reflectance of sample point locations and polygons selected on VHR aerial/satellite data. In this procedure, the same sample point locations for both classified and reference rasters were used. The categorization of indices was based on the indices’ values in these point locations. The categorization of multispectral reference data, on the other hand, was based on the SRC in the point locations, verified using VHR data.
However, we assume that the approach for automatic generation of the individual categories in the reference data increases the probability of error in the categorization itself. For that reason, in addition to the suggested approach using supervised classifications of the entire area, we proposed a second approach that uses stratified sample polygons instead. The area of sample polygons is large enough to be considered a representative sample of the individual categories. In both approaches, the final steps consisted of intersecting the categorized indices rasters (classified data) and categorized reference satellite or polygon data. The AAP was finalized with an estimation of class-specific and overall accuracy measures and their associated uncertainties based on independent reference data.
5.2. Performance of dNDVI, dNBR, and dDI for Post-Fire Monitoring
Various post-fire monitoring studies have reported differences in spectral vegetation indices performance that depend on the vegetation state in the observed ecosystems. The differences in post-fire vegetation state are determined primarily by the temporal pattern of the observation (immediate post-fire observation, one and/or several years of post-fire observations), vegetation type pattern, seasonal differences, and environmental conditions [21,53,54]. These results confirm the conclusions obtained in the present study. The three test sites are distinguished by both environmental conditions and management practices. Due to the landscape characteristics of the area: The wetter and colder habitat, steep slopes, and shallow soils, where erosion processes are more pronounced, the Boreal Mountain Forest test site had the slowest post-fire vegetation regrowth among the three test sites resulting in fragmented and less-developed vegetation.
The Mediterranean Hill Forest test site was distinguished with optimal conditions after the fire and with the lowest damage. The sanitary logging in this test site was not significant. Burnt trees in a small territory have been removed (Figure 5b). This fact, as well as the characteristics of the terrain, does not favor the development of intensive erosion processes, and the vegetation has better conditions to recover. Amongst the three test sites, the Mediterranean Hill Forest had the optimal environmental condition for vegetation regrowth.
The Mediterranean Mountain Forest test site was significantly affected by the fire, which was also the reason for sanitary logging of a large part of the forest vegetation (Figure 4b). This fact, as well as the landscape characteristics (steep terrain and soil erosion, slopes exposure, heat-moisture ratio), determines less favorable conditions for vegetation regrowth than those in Pereper-ek, yet better than in the Boreal Mountain Forest test site.
The results demonstrating the influence of the post-fire environment actual state of the forest’s regrowth confirm the results of Chen et al., 2022 [27]. Using DI as a factor re-moving phenological interference within the area of observation, they assessed the impact of local forest ecology on the post-fire vegetation regrowth and found a clear correlation between the index and various topographic and climatic factors. Amongst the studied factors, elevation, and slope exposure, through their influence on the heat-moisture ratio, stand out as factors with the highest impact on forest vegetation regrowth. In mountainous areas, colder habitats distinguish with lower recovery rates than warmer ones [27], creating conditions for weaker intra-territorial differences.
As a complementary, the comparison of SEE from linear regression between dDI and dNBR illustrates the intra-territorial differences between test sites, as well as the related sensitivity of the indices in terms of regrowth and disturbance (Figure 11). Thus, it is absolutely clear that the accuracy of the method depends on the homogeneity of the considered natural environment. In areas where dense forest area is present pre-fire but completely burned post-fire, accuracy will increase (as in MMF test site). Despite that, any heterogeneous pixels (e.g., water, houses, roads, and bare areas at pre-fire but shrubs at post-fire) will decrease it. That is why at the MMF test site, the SEE is highest for both post-fire disturbance and post-fire regrowth.
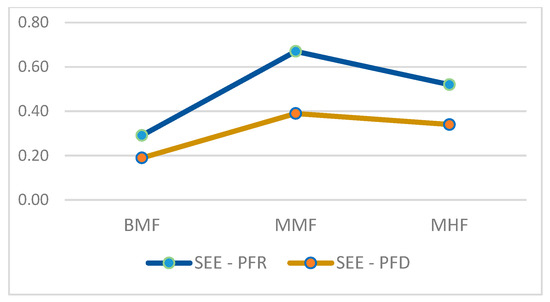
Figure 11.
Comparison of the SEE as output from linear regression (i.e., dDI ~ dNBR), illustrating intra-territorial differences between test sites, as well as the method sensitivity to the post-fire regrowth (PFR) and post-fire disturbances (PFD).
The thematic validation, performed by linear regression analyses, showed the most significant dependency between dDI and dNBR, developed for monitoring burned areas. The spatial accuracy assessment also confirmed this trend in dDI performance. In assessing post-fire disturbances, the index showed a distinct advantage over the other two indices. That is especially valid when studying disturbance processes in more difficult-to-differentiate disturbance classes in more forested areas (such as MHF) (Table 6 and Figure 9b) and regrowth processes in less forested areas (such as BMF test site) (Table 5, Figure 8b). dNDVI showed to be more appropriate to assess forest regrowth in more forested areas. This index had a better performance in more difficult-to-be-differentiated regrowth classes, namely in such areas (such as MHF) (Table 7 and Figure 10b).
As shown in the present study, the spectral vegetation indices are suitable for fire-affected territories differentiation. Due to their sensitivity to forest structure and moisture content, spectral indices integrating SWIR bands demonstrate to be more suitable for long-term vegetation regrowth rather than immediate post-fire monitoring [24]. On the contrary, spectral indices involving only visible and near-infrared bands in their calculation are more appropriate for post-fire monitoring immediately after a fire, when the magnitude of change in vegetation’s chlorophyll content is highest [4,23,55]. However, in some post-fire monitoring studies of areas with drier conditions, NBR and dNBR exhibit better performance in the assessment of immediate disturbances [55].
The accuracy of dNBR decreases with increasing time distance from the fire and with the progress of vegetation regrowth [54] when the differentiation of individual vegetation regrowth categories becomes more challenging. As the obtained results in this study showed, the involvement of a larger range of spectral information, applying TCT-based indices instead of limited band ratios increases the accuracy when assessing fire impact on vegetation [29,55,56,57]. Although TCT-based indices show to be suitable for post-fire monitoring soon after a fire, the traditional approach for the accuracy assessment of their performance, relying on a static threshold to separate burned from unburned areas, increases the rate of error when assessing post-fire effects at a longer time distance from the fire [23]. The limitations of accuracy assessment procedures based on static indices threshold were reported in other studies as well [58,59]. According to Chu and Guo (2014) [59], the differences provoked by environmental variation and vegetation stratification should be considered when suggesting a reasonable operating model for post-fire monitoring. Therefore, post-fire monitoring of environments with high landscape variability should adopt a flexible approach, taking into account specific adjustments for each landscape type [58]. Although considering particular threshold indices values for different ecosystems, aiming to avoid misclassification, to be established practice [53,60], the limitations of this approach for more general and automated post-fire monitoring applications are obvious. Establishing reliable automatic methods for various environments normalization so they could be equally evaluated at all different sites is a challenging task [58]. The proposed approach for AAP, involving delineation of dynamic boundaries based on the particular SRC of all studied environments (three test sites and their current state during two periods of observation), demonstrated its potential for assessment of the performance of individual spectral indices for monitoring of dynamic processes, such as post-fire vegetation regrowth. The results clearly showed the advantages of TCT-based dDI over the indices involving separate band ratios (dNBR and dNDVI).
A follow-up comparison shows that, interestingly, the performance of indices at test site MHF is the opposite, where the dNDVI and dNBR outperforms much better for forest regrowth, rather than the forest disturbances (Figure 12). Although the dDI keeps, it is a trend with better performance at forest disturbances. This observation is in agreement with the results obtained during the spatial accuracy assessment. The change at MHF is related with the test site characteristics (e.g., more forested areas), where the environmental conditions are the most favorable for vegetation regrowth amongst the studied forest environments. As mentioned before, that is the reason the OA of dNDVI for forest regrowth to be much higher for MHF, rather than for the other two test areas. The significant difference in the OA between forest regrowth and disturbances at the MMF test site may also be a result of the severe logging activities at the post-fire conditioning greater heterogeneity in this forest environment.
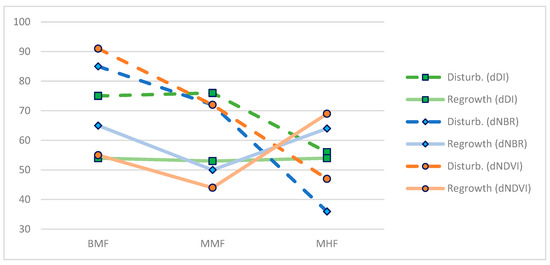
Figure 12.
Comparison of estimated OA for forest disturbance and forest regrowth of the three difference indices. The graph shows higher accuracy of the forest disturbance rather than the forest regrowth, implicitly at test areas—BMF and MMF, despite the contrary result in accuracy at MHF.
These observations confirm the results obtained in the AAP and the suitability of the proposed methodology to assess the performance of the selected indices with respect to the environmental characteristics of the studied area.
6. Conclusions
Monitoring post-fire processes occurring in various ecosystems is an important and complex task that needs to consider the impact of different environmental factors. It is widely accepted that there is no spectral index that can effectively estimate post-fire disturbances or regrowth processes in every environment, scale, and time lag condition [23]. This statement was confirmed in the present study as well. For this reason, the focus should be directed toward simple but effective techniques for the normalization of environmental differences. In this regard, the proposed approach for dynamic categorization of post-fire processes could be a helpful tool. Based on it, the capabilities of dNDVI, dNBR, and dDI for-post-fire monitoring in different forest environments were tested, and several outcomes stand out:
- dDI showed to be more appropriate to distinguish intermediate classes in less forested areas, with slow processes of forest vegetation regrowth (such as BMF test site).
- dDI had an optimal performance in monitoring post-fire disturbances. dDI showed to be suitable for studying disturbances in more difficult-to-be-differentiated classes in more forested areas (such as MHF).
- dNDVI showed to be more appropriate for assessing forest regrowth in more forested areas. This index had better performance in more difficult-to-be-differentiated regrowth classes (such as MHF).
However, the proposed approach is still in the experimental phase. In order to be refined, the method should be upgraded with the inclusion of additional spectral indices, and more fires occurring in various environments to be studied. In addition, the obtained in this study results should be further validated by applying the proposed approach for dynamic categorization of post-fire processes on sites with similar environmental characteristics. A relevant improvement would be a suggestion of a technique on how to reduce the level of uncertainty in the interpretation of spectral indices. Regular field measurements of the actual fire impact on various ecosystems would bring valuable information for more accurate specifications of the SRCs and limitations of uncertainty in the interpretation of spectral indices. For that reason, despite the advantages of the proposed approach, the obtained results should be interpreted cautiously.
Author Contributions
Conceptualization, D.A.; methodology, D.A.; software, D.A., N.S. and Z.D.; validation, D.A. and Z.D.; formal analysis, D.A. and N.S.; investigation, D.A. and N.S.; resources, D.A.; N.S. and Z.D.; data curation, D.A., N.S. and Z.D.; writing—original draft preparation, D.A. and N.S.; writing—review and editing, D.A. and N.S.; visualization, D.A. and N.S.; supervision, D.A.; project administration, D.A.; funding acquisition, D.A., N.S. and Z.D. All authors have read and agreed to the published version of the manuscript.
Funding
This research was partly funded by the European Space Agency under the ESA Contract No. 4000134290/21/NL/CBi and project “Forest Disturbance Inventory using Remote Sensing (FoReS)”. The project was supported by ESA Network of Resources Initiative.
Institutional Review Board Statement
Not applicable.
Informed Consent Statement
Not applicable.
Data Availability Statement
Research data can be provided upon request.
Acknowledgments
We thank also for the provided sponsorship and access to data and services through Sentinel Hub platform; to Maxar and European Space Imaging for provision of WorldView high resolution optical imagery; to U.S. Geological Survey and European Space Agency for the free access to Landsat and Sentinel 2 satellite data; to the Ministry of Agriculture of Republic of Bulgaria for the VHR aerial imagery.
Conflicts of Interest
The authors declare no conflict of interest.
Appendix A
Table A1.
Data used for calculation of dDI, dNBR and dNDVI for the purposes of AAP.
Table A1.
Data used for calculation of dDI, dNBR and dNDVI for the purposes of AAP.
| BMF | MMF | MHF | |
|---|---|---|---|
| Landsat 7 ETM+ & Landsat 8 OLI | 29/06/2012 | 16/05/2013 | 12/07/2013 |
| 19/08/2013 | 20/05/2017 | 21/08/2016 | |
| Sentinel 2A | 13/07/2016 | 15/07/2017 | 24/08/2017 |
| 03/08/2021 | 14/06/2022 |
Table A2.
VHR aerial/satellite (WV02; WV03, and GE01) reference data.
Table A2.
VHR aerial/satellite (WV02; WV03, and GE01) reference data.
| Aerial Images | SATELLITE DATA | ||||||||
|---|---|---|---|---|---|---|---|---|---|
| Test Site | Date of Fire | 2013 | 2016 | 2017 | 2011 | 2013 | 2018 | 2021 | 2022 |
| BMF | 1 July 2012 | ✓ | ✓ | 21 Nov. | 18 Sep. | ||||
| MMF | 29 July 2016 | ✓ | 19 May | 4 Aug. | |||||
| MHF | 21 Nov. 2015 | ✓ | ✓ | 17 June | |||||
Table A3.
Multispectral satellite images used as reference data in AAP.
Table A3.
Multispectral satellite images used as reference data in AAP.
| BMF | MMF | MHF | |
|---|---|---|---|
| Landsat ETM+ | 19/08/2013 | ||
| Landsat 8 OLI | 04/09/2016 | 18/07/2021 | |
| Landsat 9 OLI-2 | 04/07/2022 | ||
| Sentinel 2A | 15/07/2017 | 10/07/2016 | |
Appendix B
Table A4.
Spatial and spectral characteristics of the sensors used for spectral indices calculation. The spectral resolution of Landsat data ranges between the indicated wavelengths [41], whereas the spectral resolution of Sentinel-2 data is centered at the indicated wavelength [61].
Table A4.
Spatial and spectral characteristics of the sensors used for spectral indices calculation. The spectral resolution of Landsat data ranges between the indicated wavelengths [41], whereas the spectral resolution of Sentinel-2 data is centered at the indicated wavelength [61].
| Landsat 7 ETM+ | Landsat 8 OLI | Sentinel 2 | ||||
|---|---|---|---|---|---|---|
| Band | Spectral Resolution | Spatial Resolution | Spectral Resolution | Spatial Resolution | Spectral Resolution | Spatial Resolution |
| B1 | 0.45–0.52 | 30 | 0.443 | 60 | ||
| B2 | 0.52–0.60 | 30 | 0.45–0.51 | 30 | 0.49 | 10 |
| B3 | 0.63–0.69 | 30 | 0.53–0.59 | 30 | 0.56 | 10 |
| B4 | 0.77–0.90 | 30 | 0.64–0.67 | 30 | 0.665 | 10 |
| B5 | 1.55–1.75 | 30 | 0.85–0.88 | 30 | 0.705 | 20 |
| B6 | 1.57–1.65 | 30 | 0.74 | 20 | ||
| B7 | 2.08–2.35 | 30 | 2.11–2.29 | 30 | 0.783 | 20 |
| B8 | 0.842 | 10 | ||||
| B8a | 0.865 | 20 | ||||
| B9 | 0.94 | 60 | ||||
| B10 | 1.375 | 60 | ||||
| B11 | 1.61 | 20 | ||||
| B12 | 2.19 | 20 | ||||
References
- Tedim, F.; Leone, V.; Coughlan, M.; Bouillon, C.; Xanthopoulos, G.; Royé, D.; Correia, F.J.; Ferreira, C. Extreme wildfire events: The definition. In Extreme Wildfire Events and Disasters; Chapter 1; Elsevier: Amsterdam, The Netherlands, 2020; pp. 3–29. [Google Scholar]
- Stankova, N.; Nedkov, R.; Ivanova, I.; Avetisyan, D. Modeling of forest ecosystems recovery after fire based on orthogonalization of multispectral satellite data. In Proceedings of the SPIE, Earth Resources and Environmental Remote Sensing/GIS Applications IX, 10790, Berlin, Germany, 10–13 September 2018. [Google Scholar] [CrossRef]
- Kennedy, R.E.; Yang, Z.; Cohen, W.B.; Pfaff, E.; Braaten, J.; Nelson, P. Spatial and Temporal Patterns of Forest Disturbance and Regrowth within the Area of the Northwest Forest Plan. Remote Sens. Environ. 2012, 122, 117–133. [Google Scholar] [CrossRef]
- Pickell, P.D.; Hermosilla, T.; Frazier, R.J.; Coops, N.C.; Wulder, M.A. Forest recovery trends derived from Landsat time series for North American boreal forests. Int. J. Remote Sens. 2016, 37, 138–149. [Google Scholar] [CrossRef]
- Viedma, O.; Meliá, J.; García-Haro, J.; Segarra, D. Monitoring forest regeneration rates after fires with multitemporal Landsat TM imagery. EARSeL Adv. Remote Sens. 1996, 4, 146–154. [Google Scholar]
- Crabtree, R.; Potter, C.; Mullen, R.; Sheldon, J.; Huang, S.; Harmsen, J.; Rodman, A.; Jean, C. A modeling and spatio-temporal analysis framework for monitoring environmental change using NPP as an ecosystem indicator. Remote Sens. Environ. 2009, 113, 1486–1496. [Google Scholar] [CrossRef]
- Rouse, J.; Haas, R.; Schell, J.; Deering, D. Monitoring Vegetation Systems in the Great Plains with ERTS. In Proceedings of the Third Earth Resources Technology Satellite-1 Symposium, Greenbelt, MD, USA, March 1973; pp. 309–317. [Google Scholar]
- Tucker, C.J. Red and Photographic Infrared Linear Combinations for Monitoring Vegetation. Remote Sens. Environ. 1979, 8, 127–150. [Google Scholar] [CrossRef]
- Pérez-Cabello, F.; Montorio, R.; Borini Alves, D. Remote sensing techniques to assess post-fire vegetation recovery. Curr. Opin. Environ. Sci. Health 2021, 21, 100251. [Google Scholar] [CrossRef]
- Kim, Y.; Jeong, M.-H.; Youm, M.; Kim, J.; Kim, J. Recovery of Forest Vegetation in a Burnt Area in the Republic of Korea: A Perspective Based on Sentinel-2 Data. Appl. Sci. 2021, 11, 2570. [Google Scholar] [CrossRef]
- Key, C.; Benson, N. The Normalized Burn Ratio (NBR): A Landsat TM Radiometric Measure of Burn Severity. 2003. Available online: https://www.frames.gov/catalog/5860 (accessed on 28 July 2023).
- McKenna, P.; Phinn, S.; Erskine, P.D. Fire Severity and Vegetation Recovery on Mine Site Rehabilitation Using WorldView-3 Imagery. Fire 2018, 1, 22. [Google Scholar] [CrossRef]
- Key, C.H.; Benson, N.C. Landscape Assessment (LA): Sampling and Analysis Methods. In FIREMON: Fire Effects and Monitoring Inventory System; Lutes, D.C., Keane, R.E., Caratti, C.H., Key, C.H., Sutherland, S., Eds.; USDA Forest Service: Fort Collins, CO, USA, 2006; pp. LA-1–LA-55. [Google Scholar]
- Dimitrov, P.; Gikov, A. Identification and evaluation of traces of fires in Rila mountain using spectral indices from Landsat data. In Proceedings of the SENS, Fifth Scientific Conference with International Participation, Sofia, Bularia, 2–4 November 2009; pp. 142–149. [Google Scholar]
- Gupta, V.; Reinke, K.; Jones, S. Changes in the Spectral Features of Fuel Layers of an Australian Dry Sclerophyll Forest in Response to Prescribed Burning. Int. J. Wildland Fire 2013, 22, 862–868. [Google Scholar] [CrossRef]
- Jensen, J.R. Remote Sensing of the Environment an Earth Perspective, 2nd ed.; Pearson Education Limited: London, UK, 2014. [Google Scholar]
- Stankova, N.; Nedkov, R. Monitoring forest regrowth with different burn severity using aerial and Landsat data. In Proceedings of the Geoscience and Remote Sensing Symposium (IGARSS), 2015 IEEE International, Milano, Italy, 26–31 July 2015; pp. 2166–2169. [Google Scholar] [CrossRef]
- Robichaud, P.R.; Lewis, S.A.; Laes, D.Y.M.; Hudak, A.T.; Kokaly, R.F.; Zamudio, J.A. Postfire Soil Burn Severity Mapping with Hyperspectral Image Unmixing. Remote Sens. Environ. 2007, 108, 467–480. [Google Scholar] [CrossRef]
- White, J.C.; Wulder, M.A.; Hermosilla, T.; Coops, N.C.; Hobart, G.W. A nationwide annual characterization of 25 years of forest disturbance and recovery for Canada using Landsat time series. Remote Sens. Environ. 2017, 194, 303–321. [Google Scholar] [CrossRef]
- French, N.H.F.; Kasischke, E.S.; Hall, R.J.; Murphy, K.A.; Verbyla, D.L.; Hoy, E.E.; Allen, J.L. Using Landsat Data to Assess Fire and Burn Severity in the North American Boreal Forest Region: An Overview and Summary of Results. Int. J. Wildl. Fire 2008, 17, 443–462. [Google Scholar] [CrossRef]
- Chen, W.; Moriya, K.; Sakai, T.; Koyama, L.; Cao, C. Monitoring of post-fire forest recovery under different restoration modes based on time series Landsat data. Eur. J. Remote Sens. 2014, 47, 153–168. [Google Scholar] [CrossRef]
- Qiu, J.; Wang, H.; Chen, W.; Zhang, Y.; Su, H.; Li, M. Quantifying Forest Fire and Post-Fire Vegetation Recovery in the Daxin’anling Area of Northeastern China Using Landsat Time-Series Data and Machine Learning. Remote Sens. 2021, 13, 792. [Google Scholar] [CrossRef]
- Fornacca, D.; Ren, G.; Xiao, W. Evaluating the Best Spectral Indices for the Detection of Burn Scars at Several Post-Fire Dates in a Mountainous Region of Northwest Yunnan, China. Remote Sens. 2018, 10, 1196. [Google Scholar] [CrossRef]
- Healey, S.; Cohen, W.; Yang, Z.; Krankina, O. Comparison of Tasseled Cap-based Landsat data structures for use in forest disturbance detection. Remote Sens. Environ. 2005, 97, 301–310. [Google Scholar] [CrossRef]
- Thayn, J.B. Using a remotely sensed optimized Disturbance Index to detect insect defoliation in the Apostle Islands, Wisconsin, USA. Remote Sens. Environ. 2013, 136, 210–217. [Google Scholar] [CrossRef]
- Avetisyan, D.; Velizarova, E.; Filchev, L. Post-Fire Forest Vegetation State Monitoring through Satellite Remote Sensing and In Situ Data. Remote Sens. 2022, 14, 6266. [Google Scholar] [CrossRef]
- Chen, X.; Chen, W.; Xu, M. Remote-Sensing Monitoring of Postfire Vegetation Dynamics in the Greater Hinggan Mountain Range Based on Long Time-Series Data: Analysis of the Effects of Six Topographic and Climatic Factors. Remote Sens. 2022, 14, 2958. [Google Scholar] [CrossRef]
- Velizarova, E.; Radeva, K.; Stoyanov, A.; Georgiev, N.; Gigova, I. Post-fire forest disturbance monitoring using remote sensing data and spectral indices. In Proceedings of the SPIE, Seventh International Conference on Remote Sensing and Geoinformation of the Environment (RSCy2019), Paphos, Cyprus, 18–21 March 2019; Volume 11174. [Google Scholar]
- Kauth, R.; Thomas, G. The Tasseled Cap—A graphic description of the spectral-temporal development of agricultural crops as seen by Landsat. In Symposium on Machine Processing of Remotely Sensed Data; West Lafayette’ Purdue University Lab.: West Lafayette, IN, USA, 1976. [Google Scholar]
- Crist, E.; Cicone, R. A physicaly-based transformation of Thematic Mapper data—The TM Tasseled Cap. IEEE Trans. Geosci. Remote Sens. 1984, 22, 256–263. [Google Scholar] [CrossRef]
- Crist, E.; Kauth, R. The Tasseled Cap de-mystified. Photogramm. Eng. Remote Sens. 1986, 52, 81–86. [Google Scholar]
- Nedkov, R. Orthogonal transformation of segmented images from the satellite Sentinel-2. C. R. L’acad’emie Bulg. Sci. 2017, 70, 687–692. [Google Scholar]
- Huang, C.; Wylie, B.; Homer, C.; Zylstra, G. Derivation of a tasseled cap transformation based on Landsat 7 at-satellite reflectance. Int. J. Remote Sens. 2002, 23, 1741–1748. [Google Scholar] [CrossRef]
- Baig, M.; Zhang, L.; Shuai, T.; Tong, Q. Derivation of a tasseled cap transformation based on Landsat 8 at-satellite reflectance. Remote Sens. Lett. 2014, 5, 423–431. [Google Scholar] [CrossRef]
- Google Earth. Available online: https://earth.google.com/ (accessed on 15 May 2021).
- Executive Environment Agency (ExEA). Register of Protected Areas in Bulgaria. Available online: http://pdbase.government.bg/zpo/en/index.jsp (accessed on 15 May 2021).
- Topliisky, D. Climate of Bulgaria; Amstels: Sofia, Bulgaria, 2006; pp. 298–309. (In Bulgarian) [Google Scholar]
- Assenov, A. Biogeography and Natural Capital of Bulgaria; University Press St. Kliment Ohridski: Sofia, Bulgaria, 2021. (In Bulgarian) [Google Scholar]
- Avetisyan, D.; Velizarova, E.; Nedkov, R.; Borisova, D. Assessment and mapping of the current state of the landscapes in Haskovo region (Southeastern Bulgaria) in relation to ecosystem services using remote sensing and GIS. In Proceedings of the SPIE, Sixth International Conference on Remote Sensing and Geoinformation of the Environment (RSCy2018), Paphos, Cyprus, 26–29 March 2018; Volume 10073. [Google Scholar] [CrossRef]
- Avetisyan, D.; Nedkov, R. Application of remote sensing and GIS for determination of predicted status of the ecosystem/landscape services in changing environmental conditions. In Proceedings of the SPIE, Seventh International Conference on Remote Sensing and Geoinformation of the Environment (RSCy2019), Paphos, Cyprus, 18–21 March 2019. [Google Scholar] [CrossRef]
- USGS. Available online: https://www.usgs.gov/landsat-missions/ (accessed on 22 October 2022).
- USGS. Earth Explorer. Available online: https://earthexplorer.usgs.gov/ (accessed on 22 October 2022).
- Copernicus Open Access Hub. Available online: https://scihub.copernicus.eu/ (accessed on 22 October 2022).
- Mazek, J.G.; Huang, C.; Wolf, R.; Cohen, W.; Hall, F.; Kutler, J.; Nelson, P. North American forest disturbance mapped from a decadal Landsat record. Remote Sens. Environ. 2008, 112, 2914–2926. [Google Scholar] [CrossRef]
- Copernicus Land Monitoring Services. Available online: https://land.copernicus.eu/pan-european/high-resolution-layers (accessed on 2 November 2022).
- Duporge, I.; Isupova, O.; Reece, S.; Macdonald, D.W.; Wang, T. Using very-high-resolution satellite imagery and deep learning to detect and count African elephants in heterogeneous landscapes. Remote Sens. Ecol. Conserv. 2020, 7, 369–381. [Google Scholar] [CrossRef]
- Höschle, C.; Cubaynes, H.C.; Clarke, P.J.; Humphries, G.; Borowicz, A. The Potential of Satellite Imagery for Surveying Whales. Sensors 2021, 21, 963. [Google Scholar] [CrossRef] [PubMed]
- Curtis, P.G.; Slay, C.M.; Harris, N.L. Classifying drivers of global forest loss. Science 2018, 361, 1108–1111. [Google Scholar] [CrossRef] [PubMed]
- Schepaschenko, D.; See, L.; Lesiv, M. Recent Advances in Forest Observation with Visual Interpretation of Very High-Resolution Imagery. Surv. Geophys. 2019, 40, 839–862. [Google Scholar] [CrossRef]
- Olofsson, P.; Foody, G.M.; Herold, M.; Stehman, S.V.; Woodcock, C.E.; Wulder, M.A. Good practices for estimating area and assessing accuracy of land change. Remote Sens. Environ. 2014, 148, 42–57. [Google Scholar] [CrossRef]
- Adagbasa, E.G.; Adelabu, S.A.; Okello, T.W. Development of post-fire vegetation response-ability model in grassland mountainous ecosystem using GIS and remote sensing. ISPRS J. Photogramm. Remote Sens. 2020, 164, 173–183. [Google Scholar] [CrossRef]
- Tempfli, K.; Kerle, N.; Huurneman, G.C.; Janssen, L.L.F. (Eds.) Principles of Remote Sensing, 4th ed.; ITC Educational Textbook Series, 2; The International Institute for Geo-Information Science and Earth Observation (ITC): Enschede, The Netherlands, 2009. [Google Scholar]
- Tran, B.N.; Tanase, M.A.; Bennett, L.T.; Aponte, C. Evaluation of Spectral Indices for Assessing Fire Severity in Australian Temperate Forests. Remote Sens. 2018, 10, 1680. [Google Scholar] [CrossRef]
- Picotte, J.J.; Robertson, K. Timing constraints on remote sensing of wildland fire burned area in the southeastern US. Remote Sens. 2011, 3, 1680–1690. [Google Scholar] [CrossRef]
- Hislop, S.; Jones, S.; Soto-Berelov, M.; Skidmore, A.K.; Haywood, A.; Nguyen, T. Using Landsat Spectral Indices in Time-Series to Assess Wildfire Disturbance and Recovery. Remote Sens. 2018, 10, 460. [Google Scholar] [CrossRef]
- Kennedy, R.E.; Yang, Z.; Cohen, W.B. Detecting trends in forest disturbance and recovery using yearly Landsat time series: 1. LandTrendr-Temporal segmentation algorithms. Remote Sens. Environ. 2010, 114, 2897–2910. [Google Scholar] [CrossRef]
- Mbow, C.; Goïta, K.; Bénié, G.B. Spectral indices and fire behavior simulation for fire risk assessment in savanna ecosystems. Remote Sens. Environ. 2004, 91, 1–13. [Google Scholar] [CrossRef]
- De Carvalho Júnior, O.A.; Guimarães, R.F.; Silva, C.R.; Gomes, R.A.T. Standardized Time-Series and Interannual Phenological Deviation: New Techniques for Burned-Area Detection Using Long-Term MODIS-NBR Dataset. Remote Sens. 2015, 7, 6950–6985. [Google Scholar] [CrossRef]
- Chu, T.; Guo, X. Remote sensing techniques in monitoring post-fire effects and patterns of forest recovery in boreal forest regions: A review. Remote Sens. 2014, 6, 470–520. [Google Scholar] [CrossRef]
- Loboda, T.; O’Neal, K.J.; Csiszar, I. Regionally adaptable dNBR-based algorithm for burned area mapping from MODIS data. Remote Sens. Environ. 2007, 109, 429–442. [Google Scholar] [CrossRef]
- Sentinel Online. Available online: https://sentinels.copernicus.eu/web/sentinel/user-guides/sentinel-2-msi/resolutions/spatial (accessed on 2 November 2022).
Disclaimer/Publisher’s Note: The statements, opinions and data contained in all publications are solely those of the individual author(s) and contributor(s) and not of MDPI and/or the editor(s). MDPI and/or the editor(s) disclaim responsibility for any injury to people or property resulting from any ideas, methods, instructions or products referred to in the content. |
© 2023 by the authors. Licensee MDPI, Basel, Switzerland. This article is an open access article distributed under the terms and conditions of the Creative Commons Attribution (CC BY) license (https://creativecommons.org/licenses/by/4.0/).