Abstract
The current study primarily aimed to simulate detonation initiation via turbulent jet flame acceleration in partial-premixed H2-air mixtures. Different vertical concentration gradients were generated by varying the duration of hydrogen injection (diffusion time) within an enclosed channel filled with air. H2-air mixtures with average hydrogen concentrations of 22.5% (lean mixture) and 30% (near stoichiometric mixture) were investigated at diffusion times of 3, 5, and 60 s. Numerical results show that the vertical concentration gradient significantly influences the early stage of flame acceleration (FA). In the stratified lean mixture, detonation began at all the diffusion times, and comparing the flame-speed graphs showed that a decrease in the diffusion time and an increase in the mixture inhomogeneity speeded up the flame propagation and the jet flame-to-detonation transition occurrence in the channel. In the stratified H2-air mixture with an average hydrogen concentration of 30%, the transition from a turbulent jet flame to detonation occurred in all the cases, and the mixture inhomogeneity weakened the FA and delayed the detonation initiation.
1. Introduction
In the event of a hypothetical accident in a pressurized water reactor (PWR), there is the potential for a substantial release of hydrogen gas. This hydrogen can result from the oxidation of metals, either present in the reactor’s basement during the phase of molten corium interacting with concrete or within the corium recovery pool. The H2-air mixture can create a flammable mixture, creating an explosion hazard. Local ignition of this flammable mixture can give rise to slowly propagating flames. The occurrence of the acceleration of a subsonic flame or deflagration transitioning to detonation depends on the turbulence level, mixture composition, and geometry. Hydrogen combustion, including detonation, could pose a significant threat to the reactor building and the integrity of the containment vessel in the event of an accident at a nuclear power station. Detonation events generate temperature peaks, shock waves, large pressure gradients, and high-pressure pulses, all of which have the potential to cause severe damage to specific equipment, internal walls, and containment components [1].
Some research in the field of detonation is focused on the fundamental problem of the deflagration-to-detonation transition (DDT) [2,3]. Nguyen et al. [4] conducted a numerical examination of the impacts of the equivalence ratio of ethylene fuel to air on the onset of detonation. They proposed a relationship between the equivalence ratio and the flame speed as a function of mixture fraction, pressure, and temperature.
In recent years, numerous researchers have conducted studies focused on detonation, with hydrogen serving as a fuel source [5,6,7,8]. Dorofeev et al. [9] analyzed the data from FA experiments in-depth. The data cover a wide range of tube scales, obstacle configurations, and mixture compositions. Temperatures and pressures were at normal and elevated levels. The suggested critical conditions for effective FA were presented in the form of correlations between the critical expansion ratio () and the dimensionless effective activation energy.
Considerable research has been dedicated to expediting the DDT process [10,11]. Placing solid obstacles in the channel is a recognized method for reducing the DDT distance and time. This is achieved by enhancing turbulence within the flow and increasing the interaction between the shock wave and the flame. Consequently, this approach enlarges the flame area and accelerates the release of the reaction heat rate. Ogawa et al. [12] conducted a comprehensive study on FA and DDT within a stoichiometric H2-air mixture using a two-dimensional array of obstacles. A flame is ignited at the center of the obstacle array and propagates outward in all directions. Notably, their research highlighted the significant influence of flame propagation direction on both FA rate and DDT run-up distance. Breitung et al. [13] investigated the behavior of turbulent flames in H2-air mixtures through a series of experimental studies. It was observed that within tubes featuring various obstacle arrangements, a clear distinction in flame behavior between slow, subsonic, and fast-moving flames can be noted. Ciccarelli and Dorofeev [14] provided an overview of the FA process and discussed the mechanism of flame propagation in obstructed and unobstructed tubes with uniform H2-air mixtures. Porowski et al. [15] employed the ddtFoam solver running on OpenFOAM and examined the impacts of obstacles on the onset of detonation in tubes with a stoichiometric H2-air mixture. They noted that the ddtFoam solver had industrial safety applications. Their results showed that the flame needs a high blockage ratio (BR) with broad obstacle spacing or a lower BR with narrow gaps between subsequent rows of obstacles to obtain the shortest run-up distance. Pinos and Ciccarelli [16] found that staggered obstacles noticeably enhance the average flame speed in the quasi-detonation regime compared to inline obstacles. Xiao and Oran [17] used numerical simulations to reveal the mechanism behind the detonation transition in staggered obstacle arrays, demonstrating that it involves shock focusing on the flame. They also explored various obstacle shapes, such as circular, square, left triangular, and right triangular, and their distinct effects on FA and DDT [18]. Han et al. also conducted experimental DDT examinations in obstructed channels [19]. They investigated the mechanisms of FA in syngas air in a closed tube. They also studied the effects of the distance of obstacles from the ignition source and hydrogen volume fractions on pressure dynamics and FA. Their results showed that reducing the distance of obstacles from the ignition source affects the velocity and acceleration of the flame and maximizes overpressure. They described two processes contributing to FA: (1) the unburned gas pushes the flame front because its burns are delayed behind the flame front, and (2) the obstacles transition the laminar flame front to a turbulent flame or intensify the turbulence rate. Baiwei et al. [20] conducted a numerical study of the transition from a turbulent jet flame to detonation in an H2-air pre-mixed gas within a pipeline. The results revealed that the proportion of heat losses within the total heat release continuously increased before the flame crossed obstacles. However, as the flame advanced through the obstacles, it steadily decreased.
When hydrogen is released into an air-filled duct, specific behaviors occur. Hydrogen tends to rise to the top of the duct, creating an initially stratified mixture. This inhomogeneity results from the interplay between diffusion forces and buoyancy. Consequently, the mixture establishes a vertical concentration gradient, with hydrogen concentrations higher toward the top of the duct. Over time, this concentration gradient evens out, and the mixture becomes more uniform globally. In the case of a large volume, like a reactor containment, this process can extend over several hours before achieving a fully uniform state. Despite this realistic scenario, research on the combustion of mixtures with non-uniform concentrations has been relatively limited.
Given that an initially non-uniform fuel distribution more accurately represents the initial state of the H2-air mixture in an accident scenario [21], it is crucial to consider this factor in safety-related combustion studies. Ishii and Kojima [22] focused on detonation propagation in mixtures with vertical concentration gradients in a horizontal tube. Their results demonstrated that the local deflection angle increases with the local concentration gradient. Bleyer et al. [23] investigated flame propagation with a vertical hydrogen gradient in a vertical tube. Their results demonstrated that the flame propagates upward, away from the igniter, into a gradually richer or leaner mixture, depending on the concentration gradient. Also, they showed that the concentration at the ignition source significantly influences flame development. Song et al. [24] conducted numerical investigations into self-sustaining detonation modes within heterogeneous hydrogen-oxygen mixtures. They observed that concentration gradients were pivotal in alternating between multi-head and single-head detonation modes.
Saied et al. [25] investigated DDT in uniform and stratified mixtures with 15% and 30% hydrogen concentrations. They found that DDT occurred only in stratified conditions in the lean mixture (15% hydrogen). They also showed that reducing obstacle spacing caused DDT earlier in time and space. Luan et al. [26] performed numerical simulations of 2D rotating detonations. They discovered that the wave number progressively increased with higher equivalent ratios in stratified environments. Jiang et al. [27] examined the impact of concentration gradients on detonation and re-initiation behavior within oxygen-containing mixed gases in bifurcation ducts. Their study revealed that the second reflection plays a crucial role in successfully re-initiating detonation in mixtures with concentration gradients. This contrasts with the uniform mixture. Saied et al. [28] conducted a numerical investigation into the effect of hydrogen mixture inhomogeneity on the mechanisms underlying DDT. Their study identified three distinct mechanisms of DDT within a stratified mixture at a concentration of 35%. In the first regime, creating a robust Mach stem among the obstacles results in the direct initiation of detonation in the vicinity of the triple point. In the second regime, reflected shock waves from the obstacles serve as the necessary conditions for DDT. In the third regime, neither the Mach stem nor the reflected shock waves play a substantial role in the onset of detonation.
There has been extensive experimental research on FA and DDT in recent years. However, detonation is a very complex phenomenon with a microsecond time scale, and investigating the details of its occurrence requires advanced and costly techniques. Therefore, as a suitable and accurate tool, numerical simulation of this phenomenon can minimize the need for experimental tests. On the other hand, many of the related studies have focused on the structure of gas detonation, often overlooking the concentration on FA and DDT phenomena. In the last few years, much research has been dedicated to understanding the factors affecting DDT and how to control it. Accurate calculations necessitate more realistic models and appropriate numerical methods. As such, this research has focused on stratified mixtures for more realistic modeling and more detailed investigations. The low density of hydrogen makes it prone to forming non-uniform concentrations when mixed with air in a combustion chamber. This non-uniformity significantly impacts both FA and DDT processes. Therefore, it is essential to conduct research to understand how jet flames influence FA and DDT processes within stratified H2-air premixed gases.
This research has focused on the numerical 2D investigation of the propagation, acceleration, and transition from a turbulent jet flame to detonation. The flame acceleration process comprises both an initial and a final stage. In the first stage, the flame accelerates after the reactions, reaching sound velocity (in reactive materials). In the final stage, the process initiates with the formation of strong pressure waves in front of the flame. As the flame continues to accelerate, its speed approaches the sound velocity in the combustion products, resulting in a choked flame. Several lines of evidence showed that this choked flame speed can be reached in a turbulent flame where hot spots are formed within the channel, ultimately leading to DDT. This research has employed numerical simulations to explore the mechanisms influencing flame acceleration in both the initial and final stages and has also discussed the interaction between combustion and turbulence. Also, this study evaluates the influence of diffusion time, delving into factors that have received less attention in previous research on the transition from a turbulent jet flame to detonation. We have examined how diffusion time affects the fundamental processes responsible for the transition from a turbulent jet flame to detonation through numerical simulations of gas detonation.
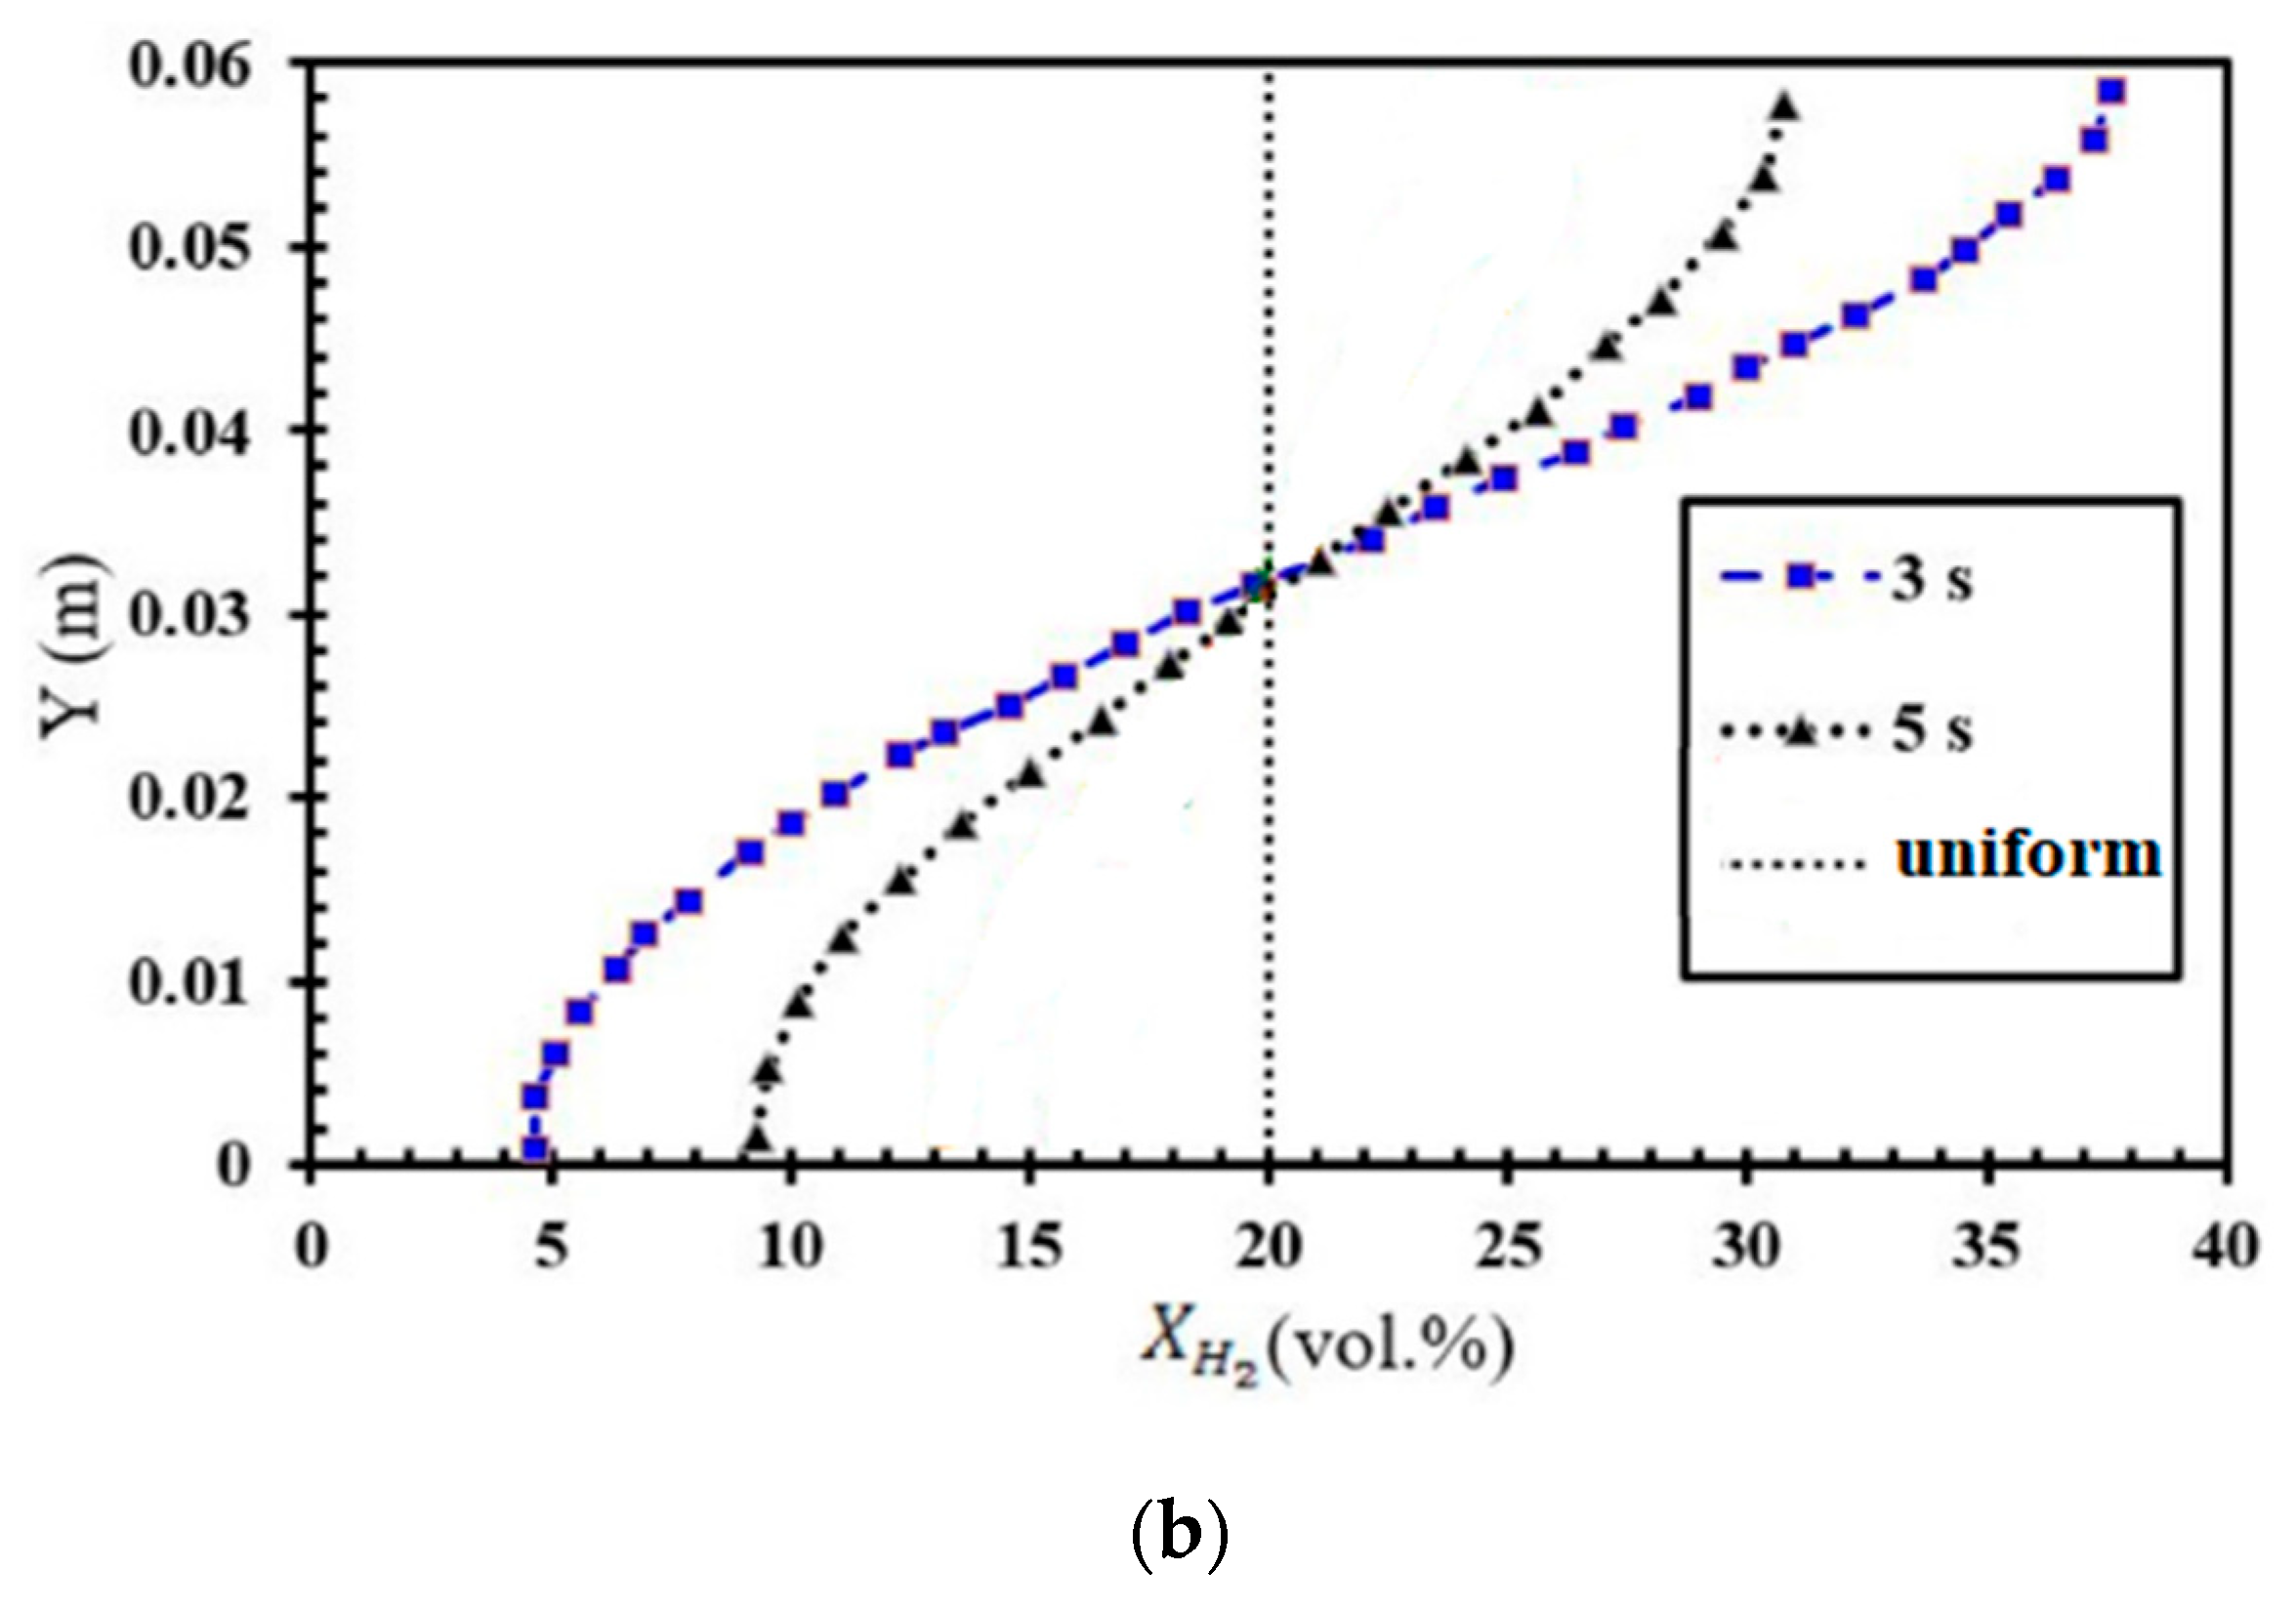
The shape of the flame primarily depends on the gradient. To create well-defined gradient slopes, one should control the diffusion time between hydrogen injection and ignition. When the diffusion time is set to 60 s, the mixture becomes practically homogeneous within the geometry of this study, while 3 and 5 s result in a steep concentration gradient. Very short diffusion times (3 and 5 s) lead to a mixture with a strong vertical concentration gradient, which could result in non-uniform combustion. For safety evaluations, it is essential to comprehend how the local hydrogen concentration affects flame propagation, as this paper discusses. Our study has great scientific value, but it also has practical applications. industrial and safety contexts, knowing how different diffusion times affect combustion can be instrumental in optimizing processes and ensuring safety measures are in place.
2. Governing Equation
The governing equations for the numerical simulations are expressed as follows:
Continuity equation
Momentum equation
Energy equation
Reaction progression variable equation
Mixture fraction equation
Furthermore, the chemical kinetic model used is based on the detailed reaction mechanism of O’Conaire et al. [29], which includes 9 species and 21 reversible chemical reactions, and the transport model for species is based on the Sutherland model.
The Turbulence Models
The mechanism of the explosion is described as a loop with positive feedback. In this process, the flame acceleration and, consequently, the increase in turbulence rate cause the flame to propagate faster. When the ignition occurs in an explosive mixture of fuel and air, the hot gases from combustion exert a force on the forefront of the unburned gases, pushing them into the path of flame propagation. The pressure differential causes the flow to quicken and, when it hits an obstruction, transition into a turbulent regime. The flow’s interaction with the obstructions causes more turbulence mixing. As a consequence, as the combustion process quickens, the response rate increases, and the flow velocity and turbulence rise as well. The whole process periodically repeats itself. Thus, the role of turbulence in modeling DDT is vital. The turbulence model used in this study was the two-equation model of κ−ω SST. It is an improved form of the κ−ω model to achieve more accurate results near all walls in the combustion chamber. In the boundary layer, the κ−ω SST turbulence model outperforms κ−ω in the viscous sub-layer (near the wall). This model can be used as a low Reynolds turbulence model without any additional damping function. In the κ−ω SST model, the turbulence relations in the free-flow are turned into relations of the κ-ε model; however, the κ−ω SST model does not have κ-ε problems, such as sensitivity to the properties of input free-flow, the lack of sensitivity to adverse pressure gradients, and numerical stiffness of the equations when integrated via the viscous sub-layer. The κ−ω SST turbulence model based on RANS is written as follows:
In the above equations, the turbulent kinetic energy , specific turbulent dissipation rate , and model coefficients and [30].
3. Numerical Method
In the present numerical simulation, the ddtFoam solver [31] was used to simulate FA and DDT in the H2-air mixture. The computation of the flame’s characteristics and the macroscopic properties of shock propagation constituted the primary objective. DDT is a complex gas dynamic phenomenon characterized by instabilities in the flame and flame-turbulence interactions. It is virtually impossible to resolve all microscopic details of the flow in industry-scale geometries with current resources and capabilities. Moreover, not all microscopic-scale phenomena are necessary for simulating macroscopic DDT events. A coarse grid size was used. Using under-resolved grids serves two purposes: it enables computational scalability for larger domains and facilitates the study of FA and DDT within a limited timeframe. To simulate flame propagation in large three-dimensional geometries without resolving the microstructure of the flow within the Computational Fluid Dynamics (CFD) cell, a combination of the PISO solver and the ddtFoam solver [32] was employed. The PISO solver is well-suited for Mach numbers less than 0.3, while the ddtFoam solver is activated when the Mach number exceeds 0.3. This combined approach serves as a foundation for studying FA and the initiation of detonation processes.
The Unsteady Reynolds-Averaged Navier-Stokes (URANS) modeling approach was chosen. This selection was motivated by its computational efficiency, which permits using a comparatively larger mesh size. Furthermore, URANS modeling offers reasonably accurate estimations of macroscopic parameters, making it a suitable option for the research objectives. The ddtFoam is a solver to simulate partial-premixed combustion flows with a two-equation model of κ−ω SST. The combustion model in this solver is a two-equation model of c-Ξ Weller, which is one type of Flamelet model. Here, c indicates the mass fraction of products (the indication of the reaction progress), and Ξ represents the flame surface wrinkle. Instead of solving separate transport equations for the individual chemical species reactions, a unified transport equation was created and resolved for the variable c. The auto-ignition delay time (tign) was determined using Arrhenius equations, relying on the comprehensive reaction scheme described by O’Conaire et al. [29]. The mixture composition is explained by the mixture fraction (fH), which indicates the hydrogen amount that would be found if the cell were completely unburned. To avoid repetitive recalculations of local ignition delay times, a table of tign based on temperature (T), pressure (P), and mixture fraction (fH) was generated using Cantera [33]. Throughout the numerical solutions, for each computational cell, the local ignition delay time was determined by searching this tabulated data. An additional energy equation pertaining to the unburned mixture was resolved using this solver. The determination of the enthalpy and solution of this equation allowed for the calculation of the thermodynamic properties of the unburned gases, including temperature, density, and dynamic viscosity.
In the ddtFoam solver, the detonation process involving DDT and the effects of auto-ignition are described by the detonative source term () in the transport equation of the reaction progress variable. If a gas mixture ignites spontaneously without any ignition source, auto-ignition has occurred. The mixture composition, pressure (P), and local temperature (T) control the auto-ignition delay. A sub-model is implemented in this solver, which improves the coarse grid accuracy of the auto-ignition model. Auto-ignition may transpire as a result of shock-induced heating; thus, this sub-model is introduced. Providing that the model predicts the auto-ignition based on average pressure and temperature, incorrect results can be obtained. The transition to detonation was modeled using the auto-ignition source term as follows:
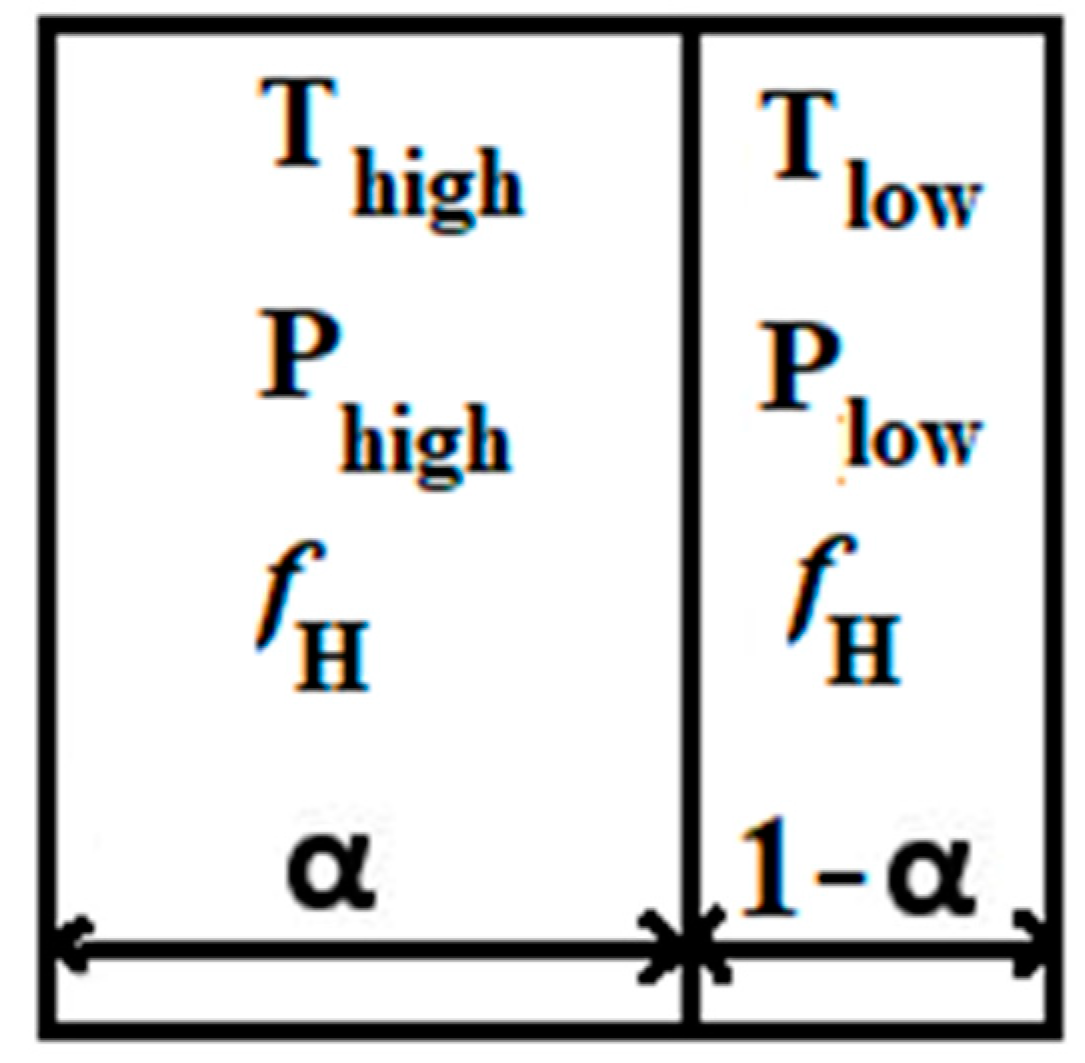
The mixture is ignited when the ignition variable reaches unity. Nevertheless, when the ignition delay time has not yet passed ( < ign), there is no effect on the properties of the flow. The local ignition delay time is a function of local pressure p, local temperature T, and mixture composition. This ignition delay time of a mixture is calculated using lookup tables obtained from isochoric explosion calculations, which are calculated using a detailed reaction mechanism and Cantera. While the mean temperature might be sufficient to trigger automatic ignition, the thermal impact that caused the increase in temperature might not have completely permeated the entire computational cell. Therefore, the computational cell can be split into two segments, one with a volume fraction of α and the other with a volume fraction of 1 − α (as illustrated in Figure 1). In one segment, the temperature and pressure are denoted as and , while in the other segment, they are represented as and , respectively. These values are calculated based on the properties of the surrounding computational cells. The mean pressure within the computational cell is denoted as , and the volume fraction is determined using the following equation:
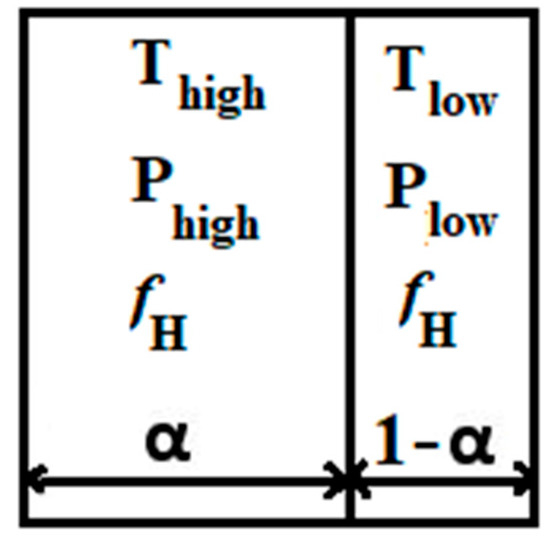
Figure 1.
Shock wave divided by a computational cell into volume fractions α and 1 − α.
The values and can be computed using dynamic shock relations for an ideal gas with a specific heat ratio represented by γ [34]. This model enables the distinct calculation of the ignition delay time across the shock within the computational cell and applies to the entire computational domain, even in regions where no shock is present.
In every grid cell, the process of auto-ignition is individually assessed on both sides of the discontinuity. By solving transport equations for τhigh and τlow, mixing and transport consequences are accounted for.
If = 1 (the critical value) is reached on one side of the discontinuity (i.e., τhigh = 1 or τlow = 1), only the corresponding volume fraction of a computational cell is ignited. Therefore, the source term of auto-ignition will be calculated as shown in [35]:
In computational simulations, it is crucial to use a grid resolution of 30–50 grid points within the flame thickness region to accurately capture the propagation of the flame. However, this finer resolution can significantly increase computational costs. The ddtFoam solution was created specially to simulate unintentional explosions in nuclear power plants in order to overcome this difficulty. It determines the auto-ignition delay time inside each cell using the volume fraction approach, which produces satisfactory and accurate results even on coarser grids. The ddtFoam solver is versatile and can be effectively applied to problems involving detonation diffraction and various time-dependent extreme combustion scenarios. It offers the advantage of providing relatively quick results while maintaining an acceptable level of accuracy, making it a valuable tool for analysis and design purposes. The material properties were chosen from the Chemkin database through look-up tables. The Sutherland correlation was used to evaluate the molecular transport coefficients. The problem was a transient mode and was solved with the explicit Euler scheme for time discretization. In spatial discretization for the diffusion terms, second-order schemes were used to obtain higher accuracy. A tolerance of 10−6 was set for all solution algorithms, and the initial time step size was also set to 2 × 10⁻⁵.
3.1. Characteristics of Combustion Geometry
The numerical investigation of FA in stratified mixtures was carried out within a closed duct measuring 5.1 m in length (Figure 2a). The duct had a rectangular cross-section with a height of 60 mm and a width of 300 mm. Inside the duct, a turbulence-inducing obstacle was installed. In this particular configuration, the blockage ratio was set at 0.9, and the obstacle was positioned at a distance of 1 m from the ignition source, which was mounted on one of the end plates of the tube. The placement of the ignition kernel was seen on the left wall of the channel, where it was thought to be a hot semi-circular region with a radius of 25.4 mm. This region was characterized by a reaction progress variable of 1, and the temperature inside this region was estimated to be 2440 K. Furthermore, the dimensions of this duct are identical to those of the Gravent facility [36]; however, the Gravent facility features seven obstacles. All cases were conducted with an H2-air mixture at an initial pressure of 1 atm and an initial temperature of 293 K. Since Gaathaug et al. [10] experimentally examined the turbulent jet flame in a channel with one obstacle at a 1 m distance and blockage ratios of 0.9 and 0.92, respectively, this study placed the obstacle 1 m away from the spark location and examined the effects of different diffusion times at a blockage ratio of 0.9. These simulations are beneficial for future experimental studies, and this research is aimed at streamlining and optimizing future experimental efforts. The vertical concentration gradient achieved depends on the diffusion time, which is defined as the time between the end of hydrogen injection and ignition. Gradients with a predetermined slope can be created by regulating the diffusion time (td) between H2 injection and ignition. Figure 2b provides an initial visualization of concentration gradients.

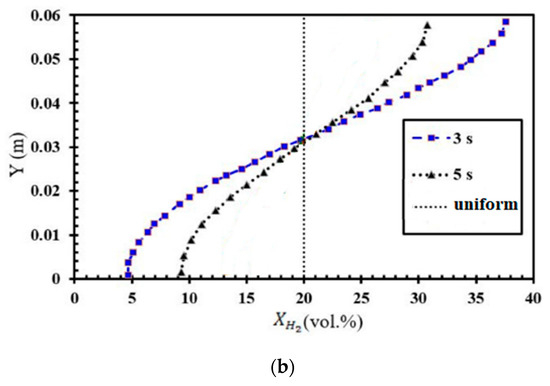
Figure 2.
(a) Schematic view of the combustion chamber. (b) The uniform and stratified transverse distribution profile of hydrogen with average concentrations of 20% [32].
3.2. Mesh Sensitivity Analysis
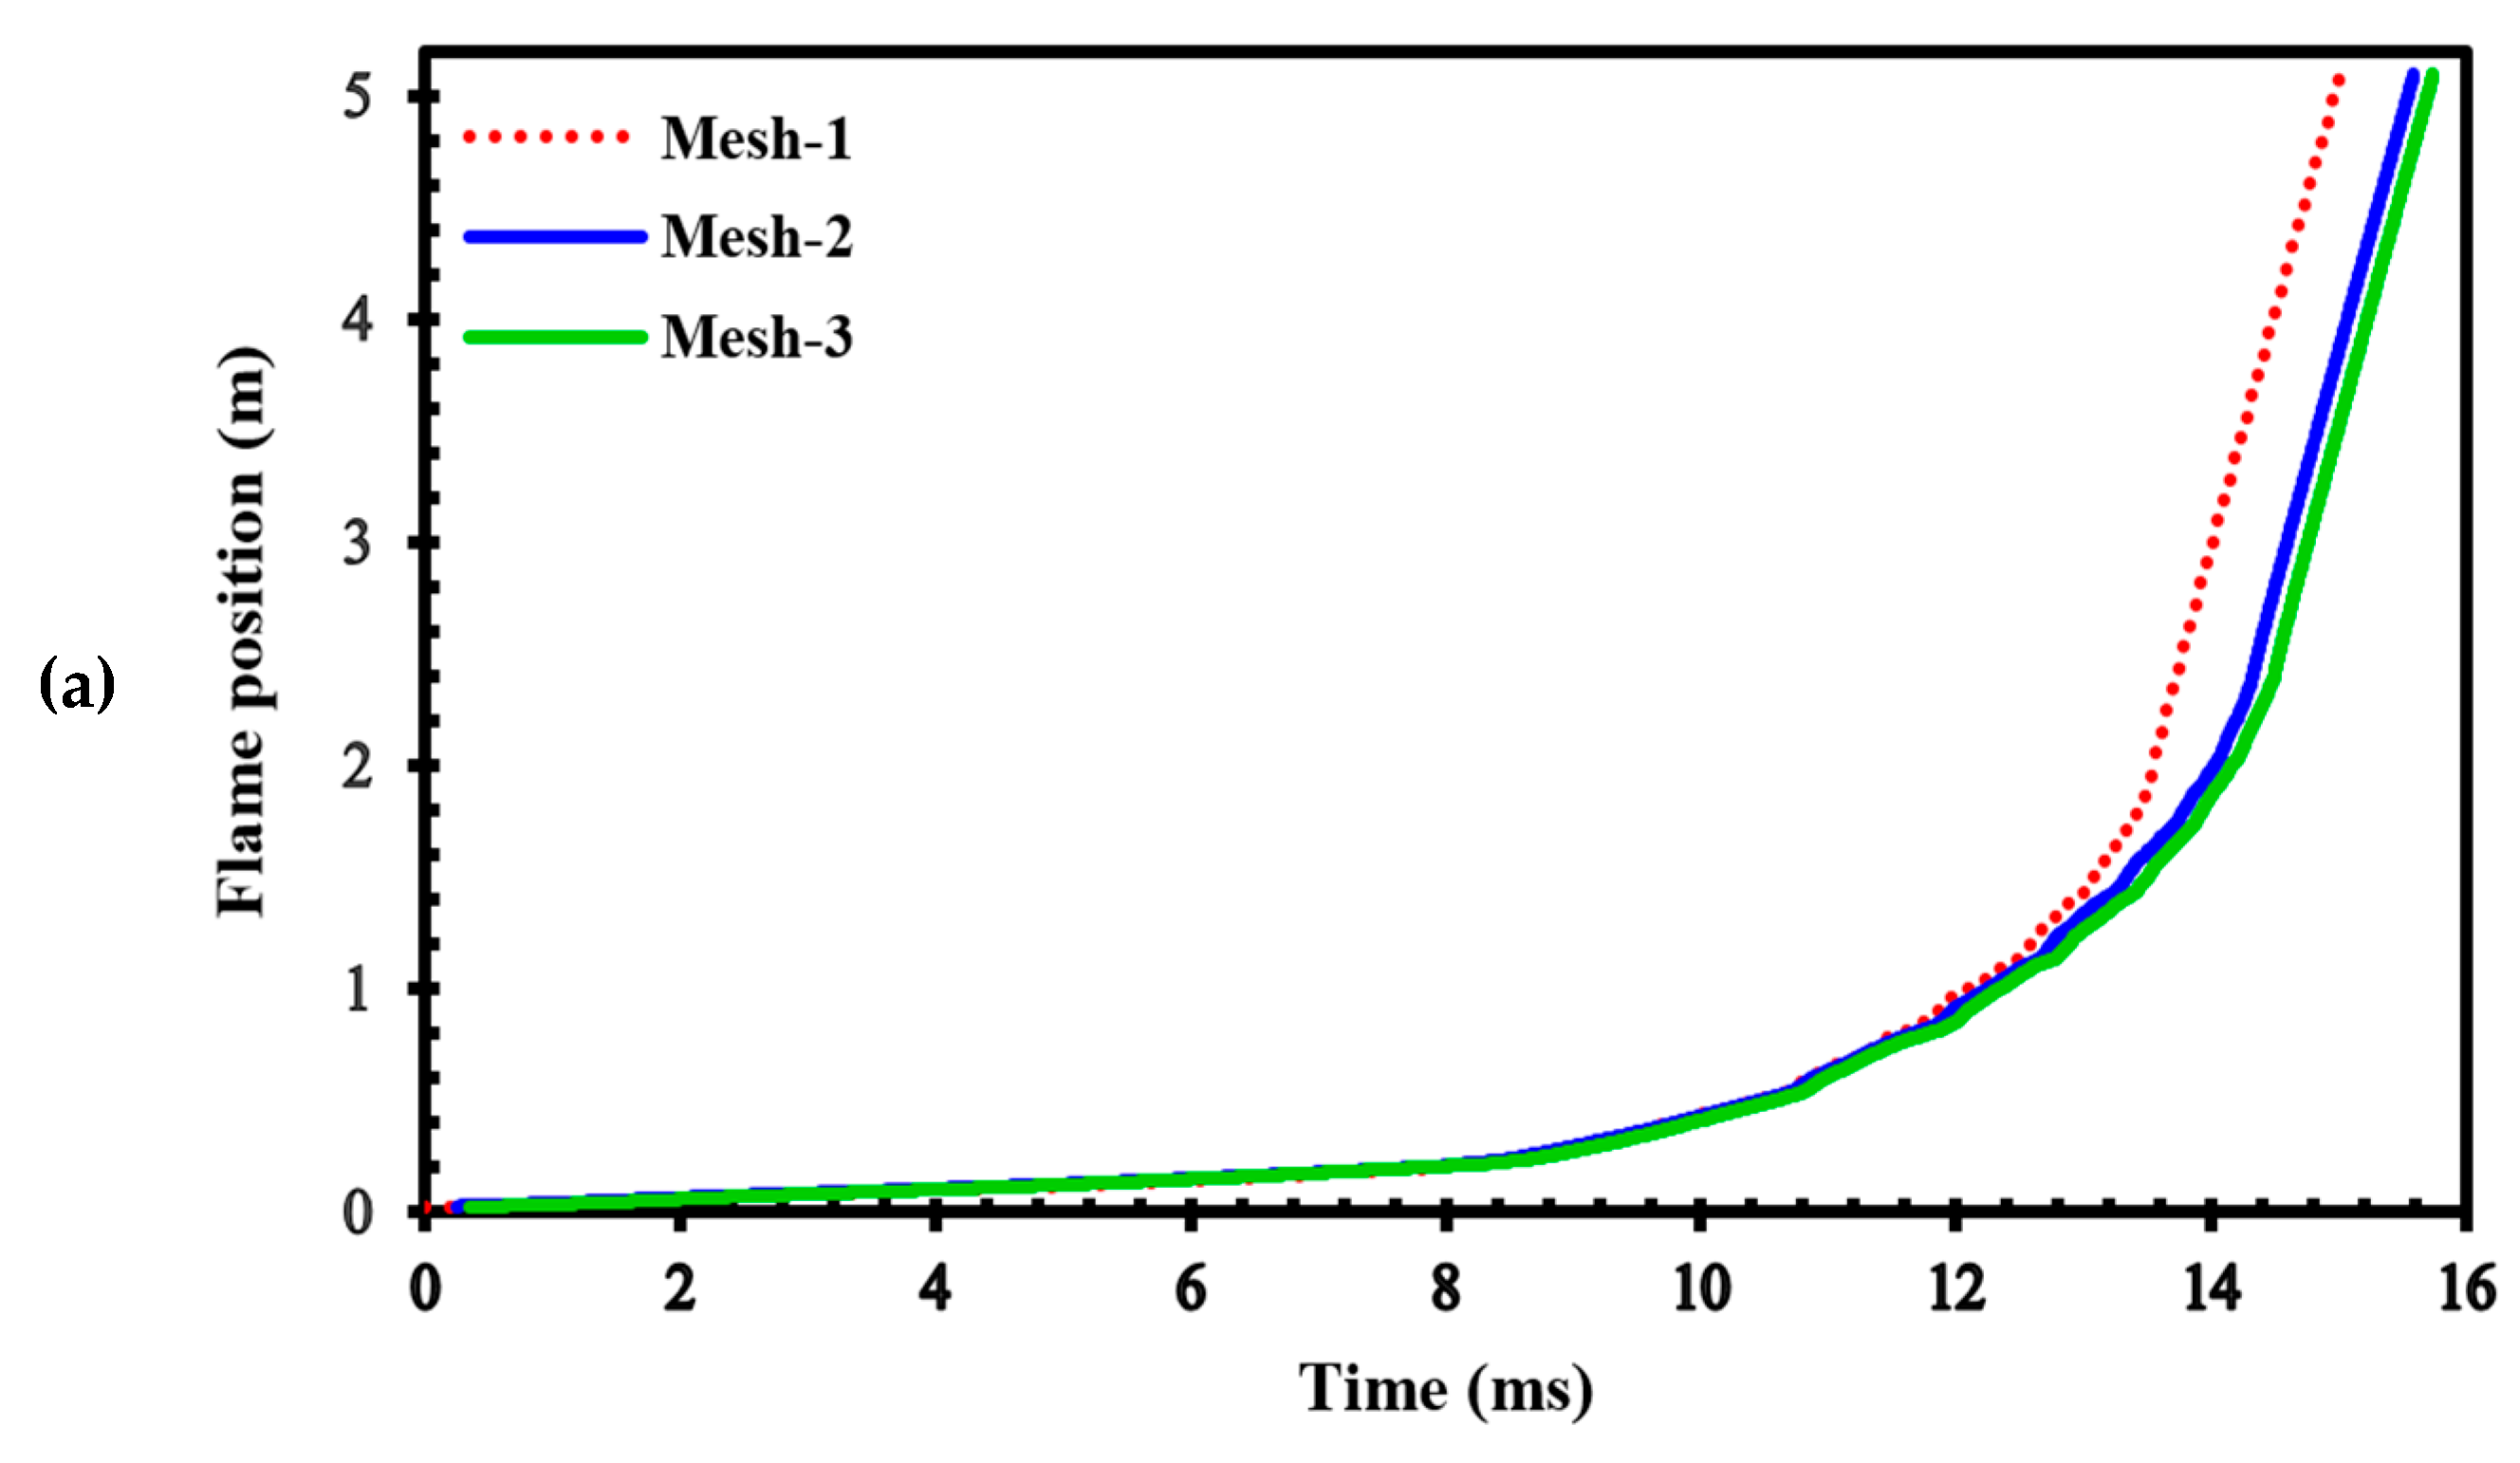
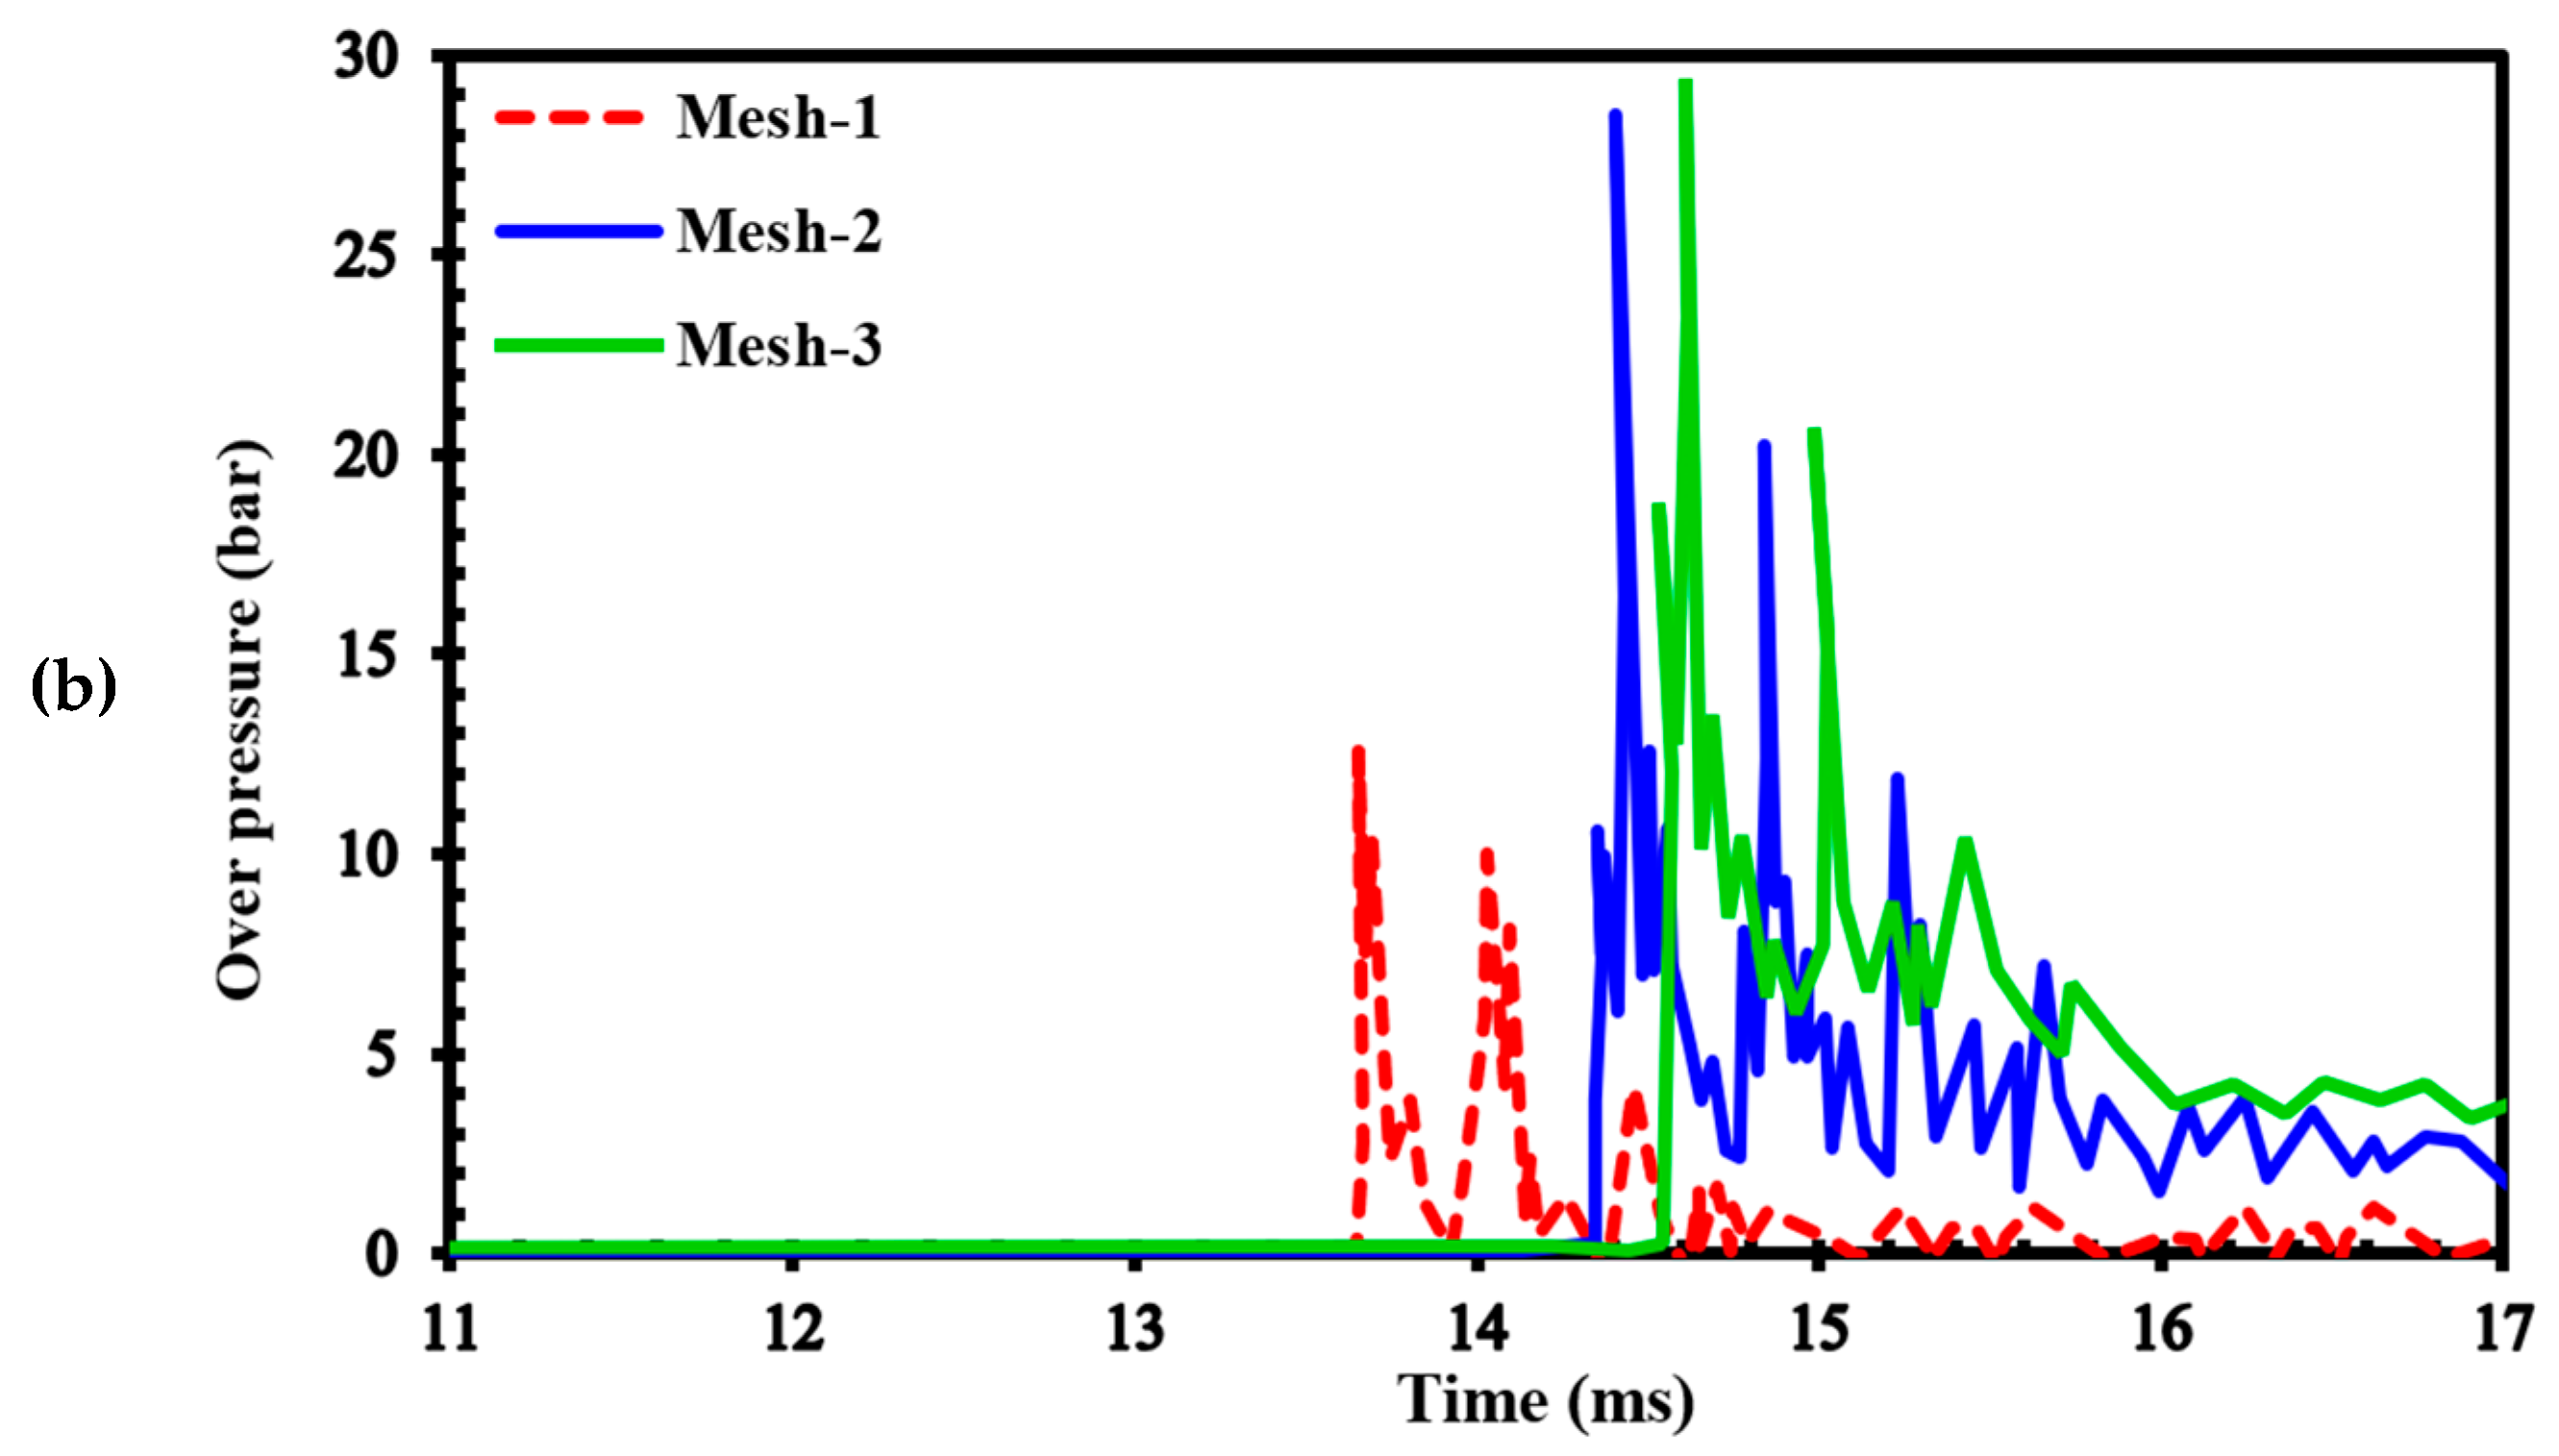
To assess the sensitivity of the results to grid size, we generated three different computational grids in the GraVent facility [36] (Figure 3) with cell sizes of 4 mm (mesh-1), 1 mm (mesh-2), and 0.5 mm (mesh-3). The ignition source was considered a hot, semi-circular area with a 25.4 mm radius. Figure 4a demonstrates the effects of different grids on the position of the flame front at different times. In Figure 4b, the channel pressure history recorded at x = 2.4 m over time for these three grids is shown. These simulations were conducted using a stratified mixture of 20% hydrogen with a diffusion time of 3 s. Thus, our analysis revealed no significant differences between cell sizes of 1 mm (mesh-2) and 0.5 mm (mesh-3).

Figure 3.
Schematic of the GraVent facility.
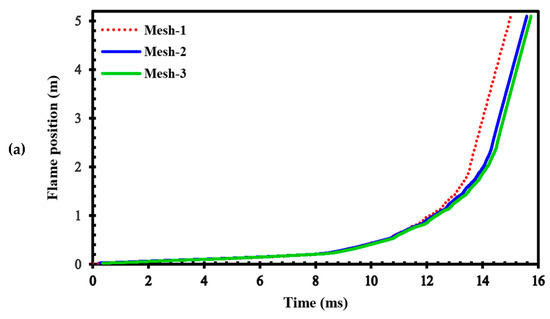
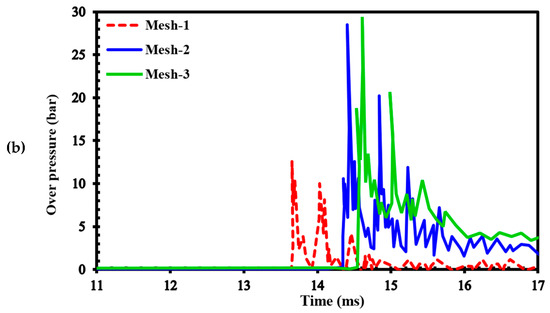
Figure 4.
(a) Flame front position; (b) Channel pressure history recorded at location x = 2.4 m in a stratified mixture of 20% hydrogen with a diffusion time of 3 s for different computational grids.
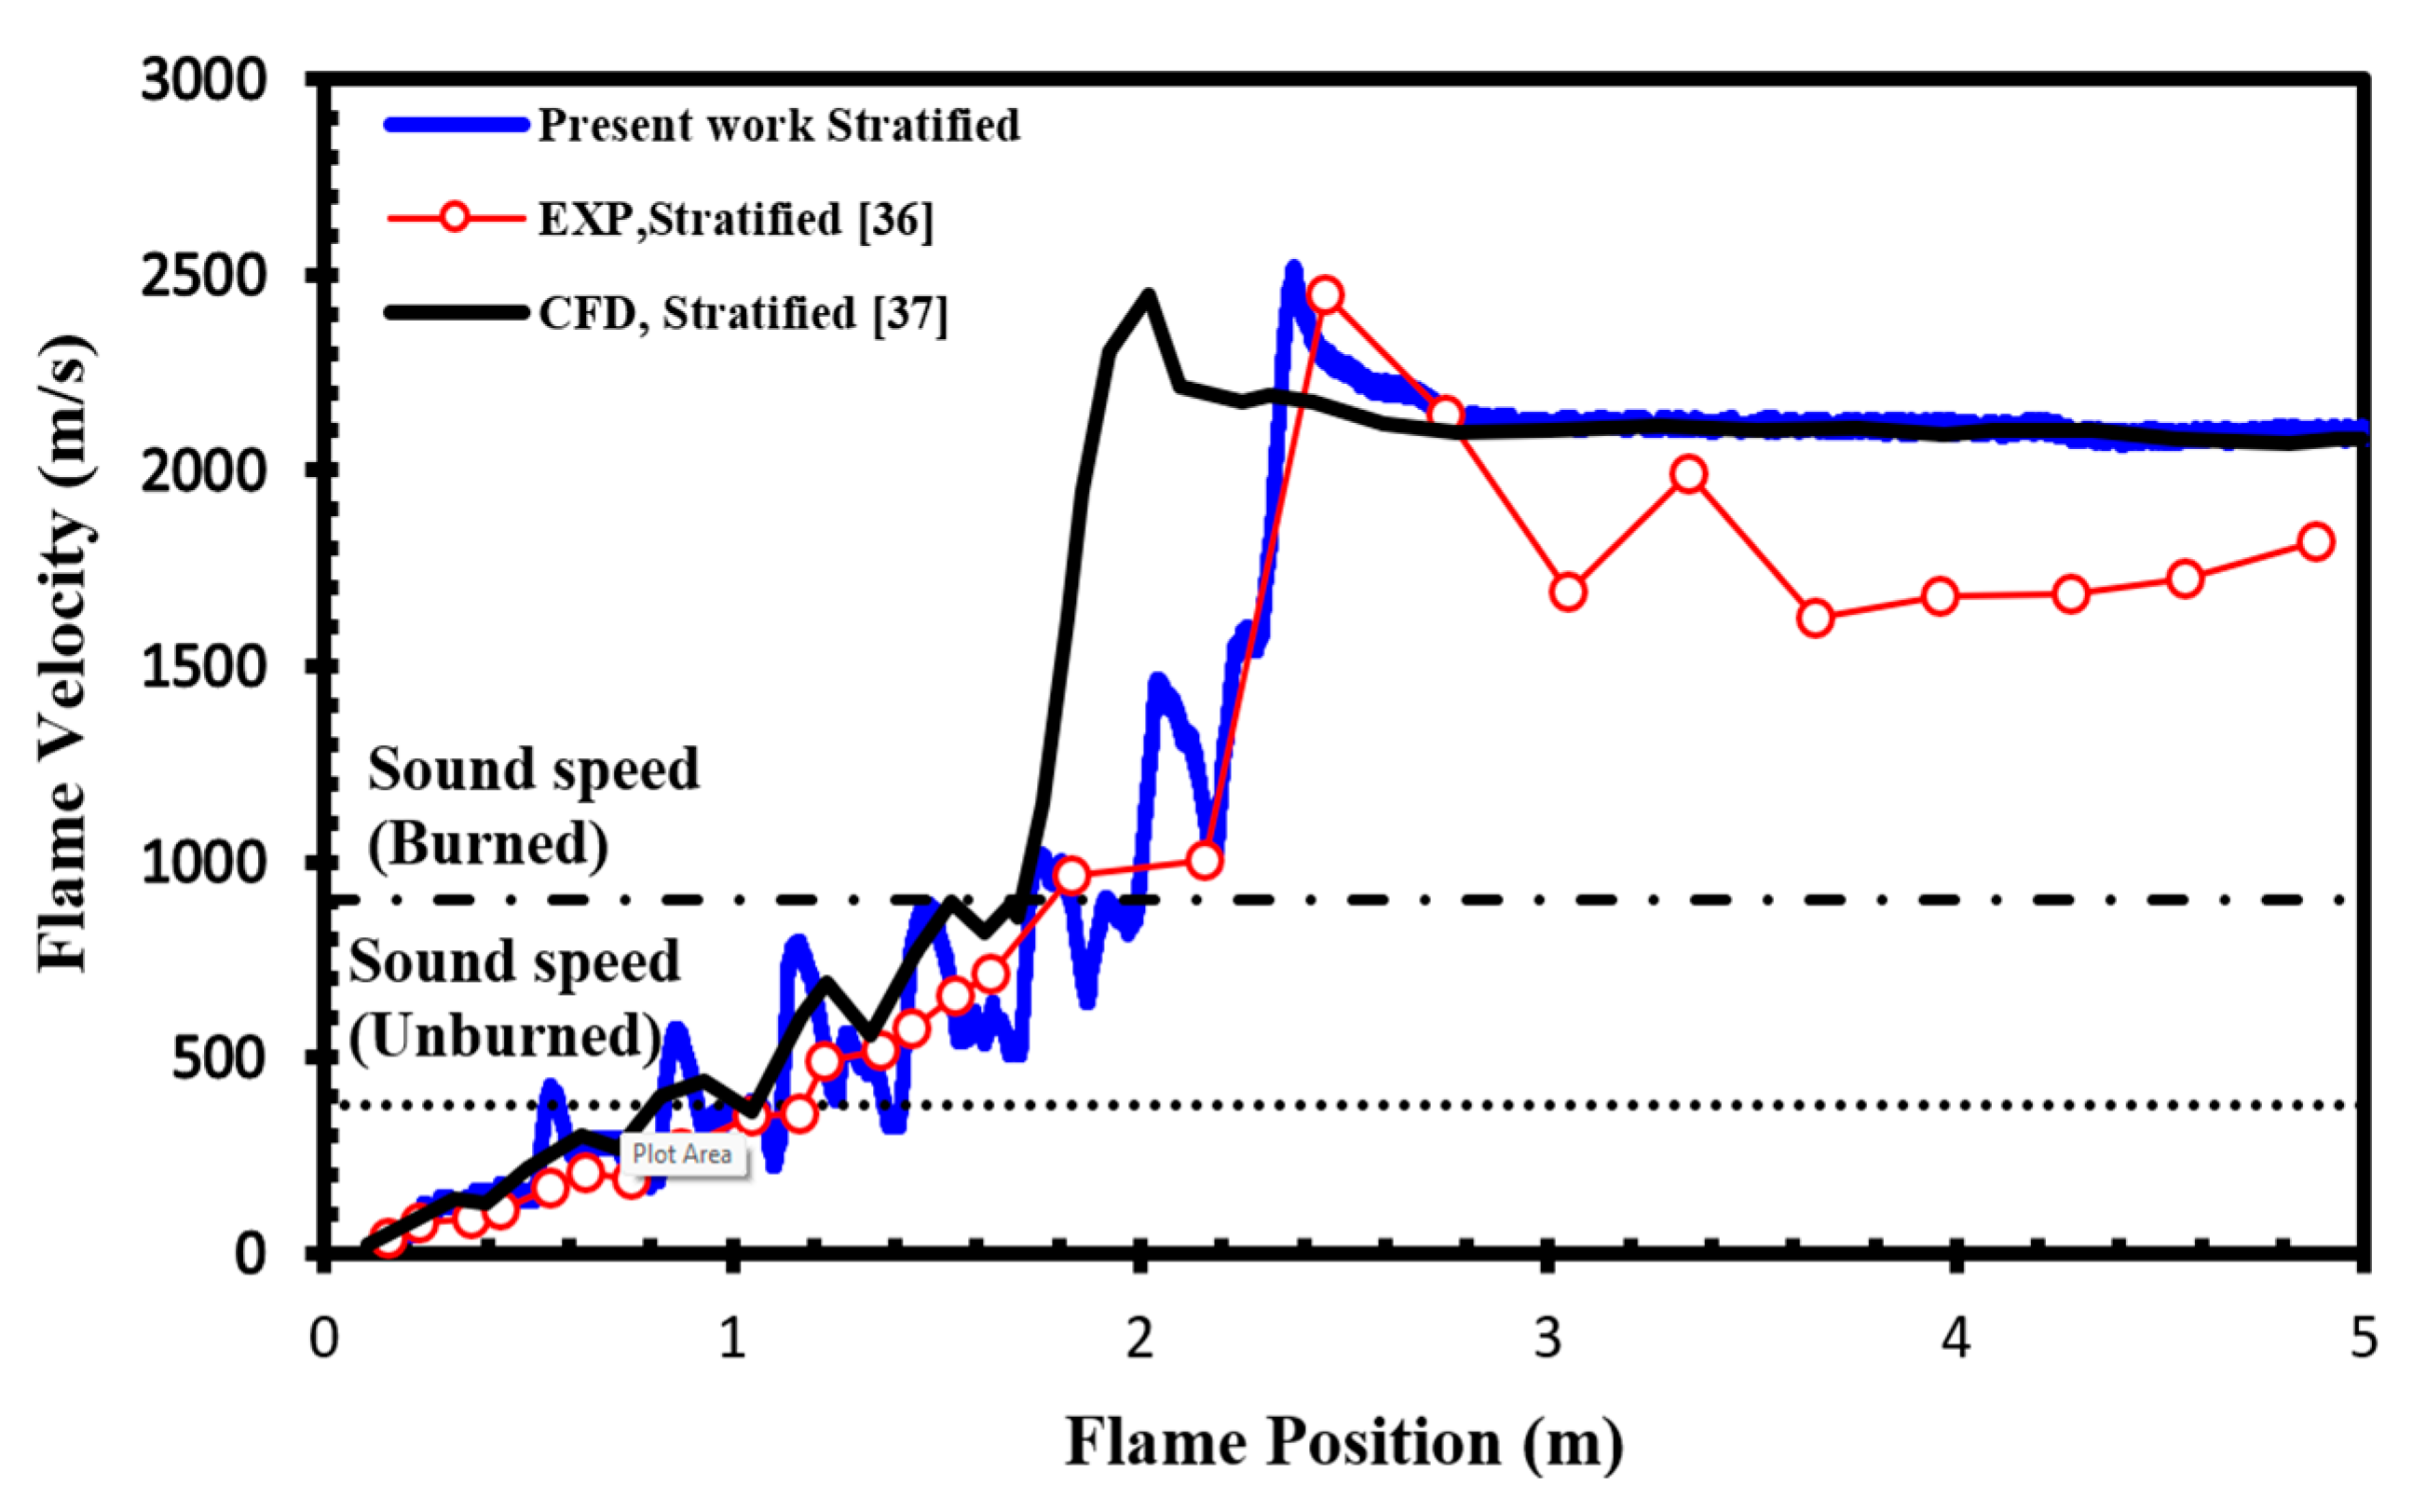
To validate our current simulations, we compared our numerical results with the experimental observations conducted by Boeck et al. [36] and those obtained by Karanam et al. [37] in the GraVent facility. The flame velocity, featuring a diffusion time of 3 s and an average hydrogen concentration of 20%, is depicted in Figure 5. The graph illustrates a notable concurrence between the simulation outcomes and the empirical findings, thereby validating the solver’s capacity to faithfully represent characteristics including turbulent and laminar flame velocities as well as the rate of unsteady detonation propagation in stratified mixtures.
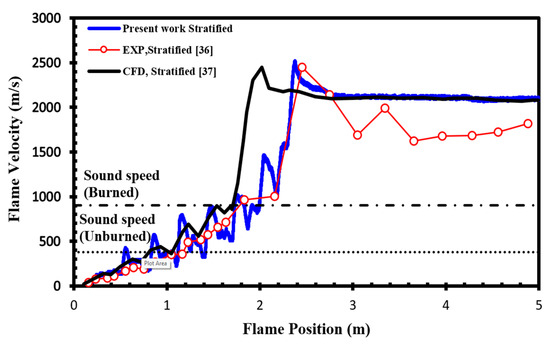
Figure 5.
Flame velocity as a function of position in a stratified H2-air mixture with an average concentration of 20% for a diffusion time of 3 s.
3.3. Numerical Validation
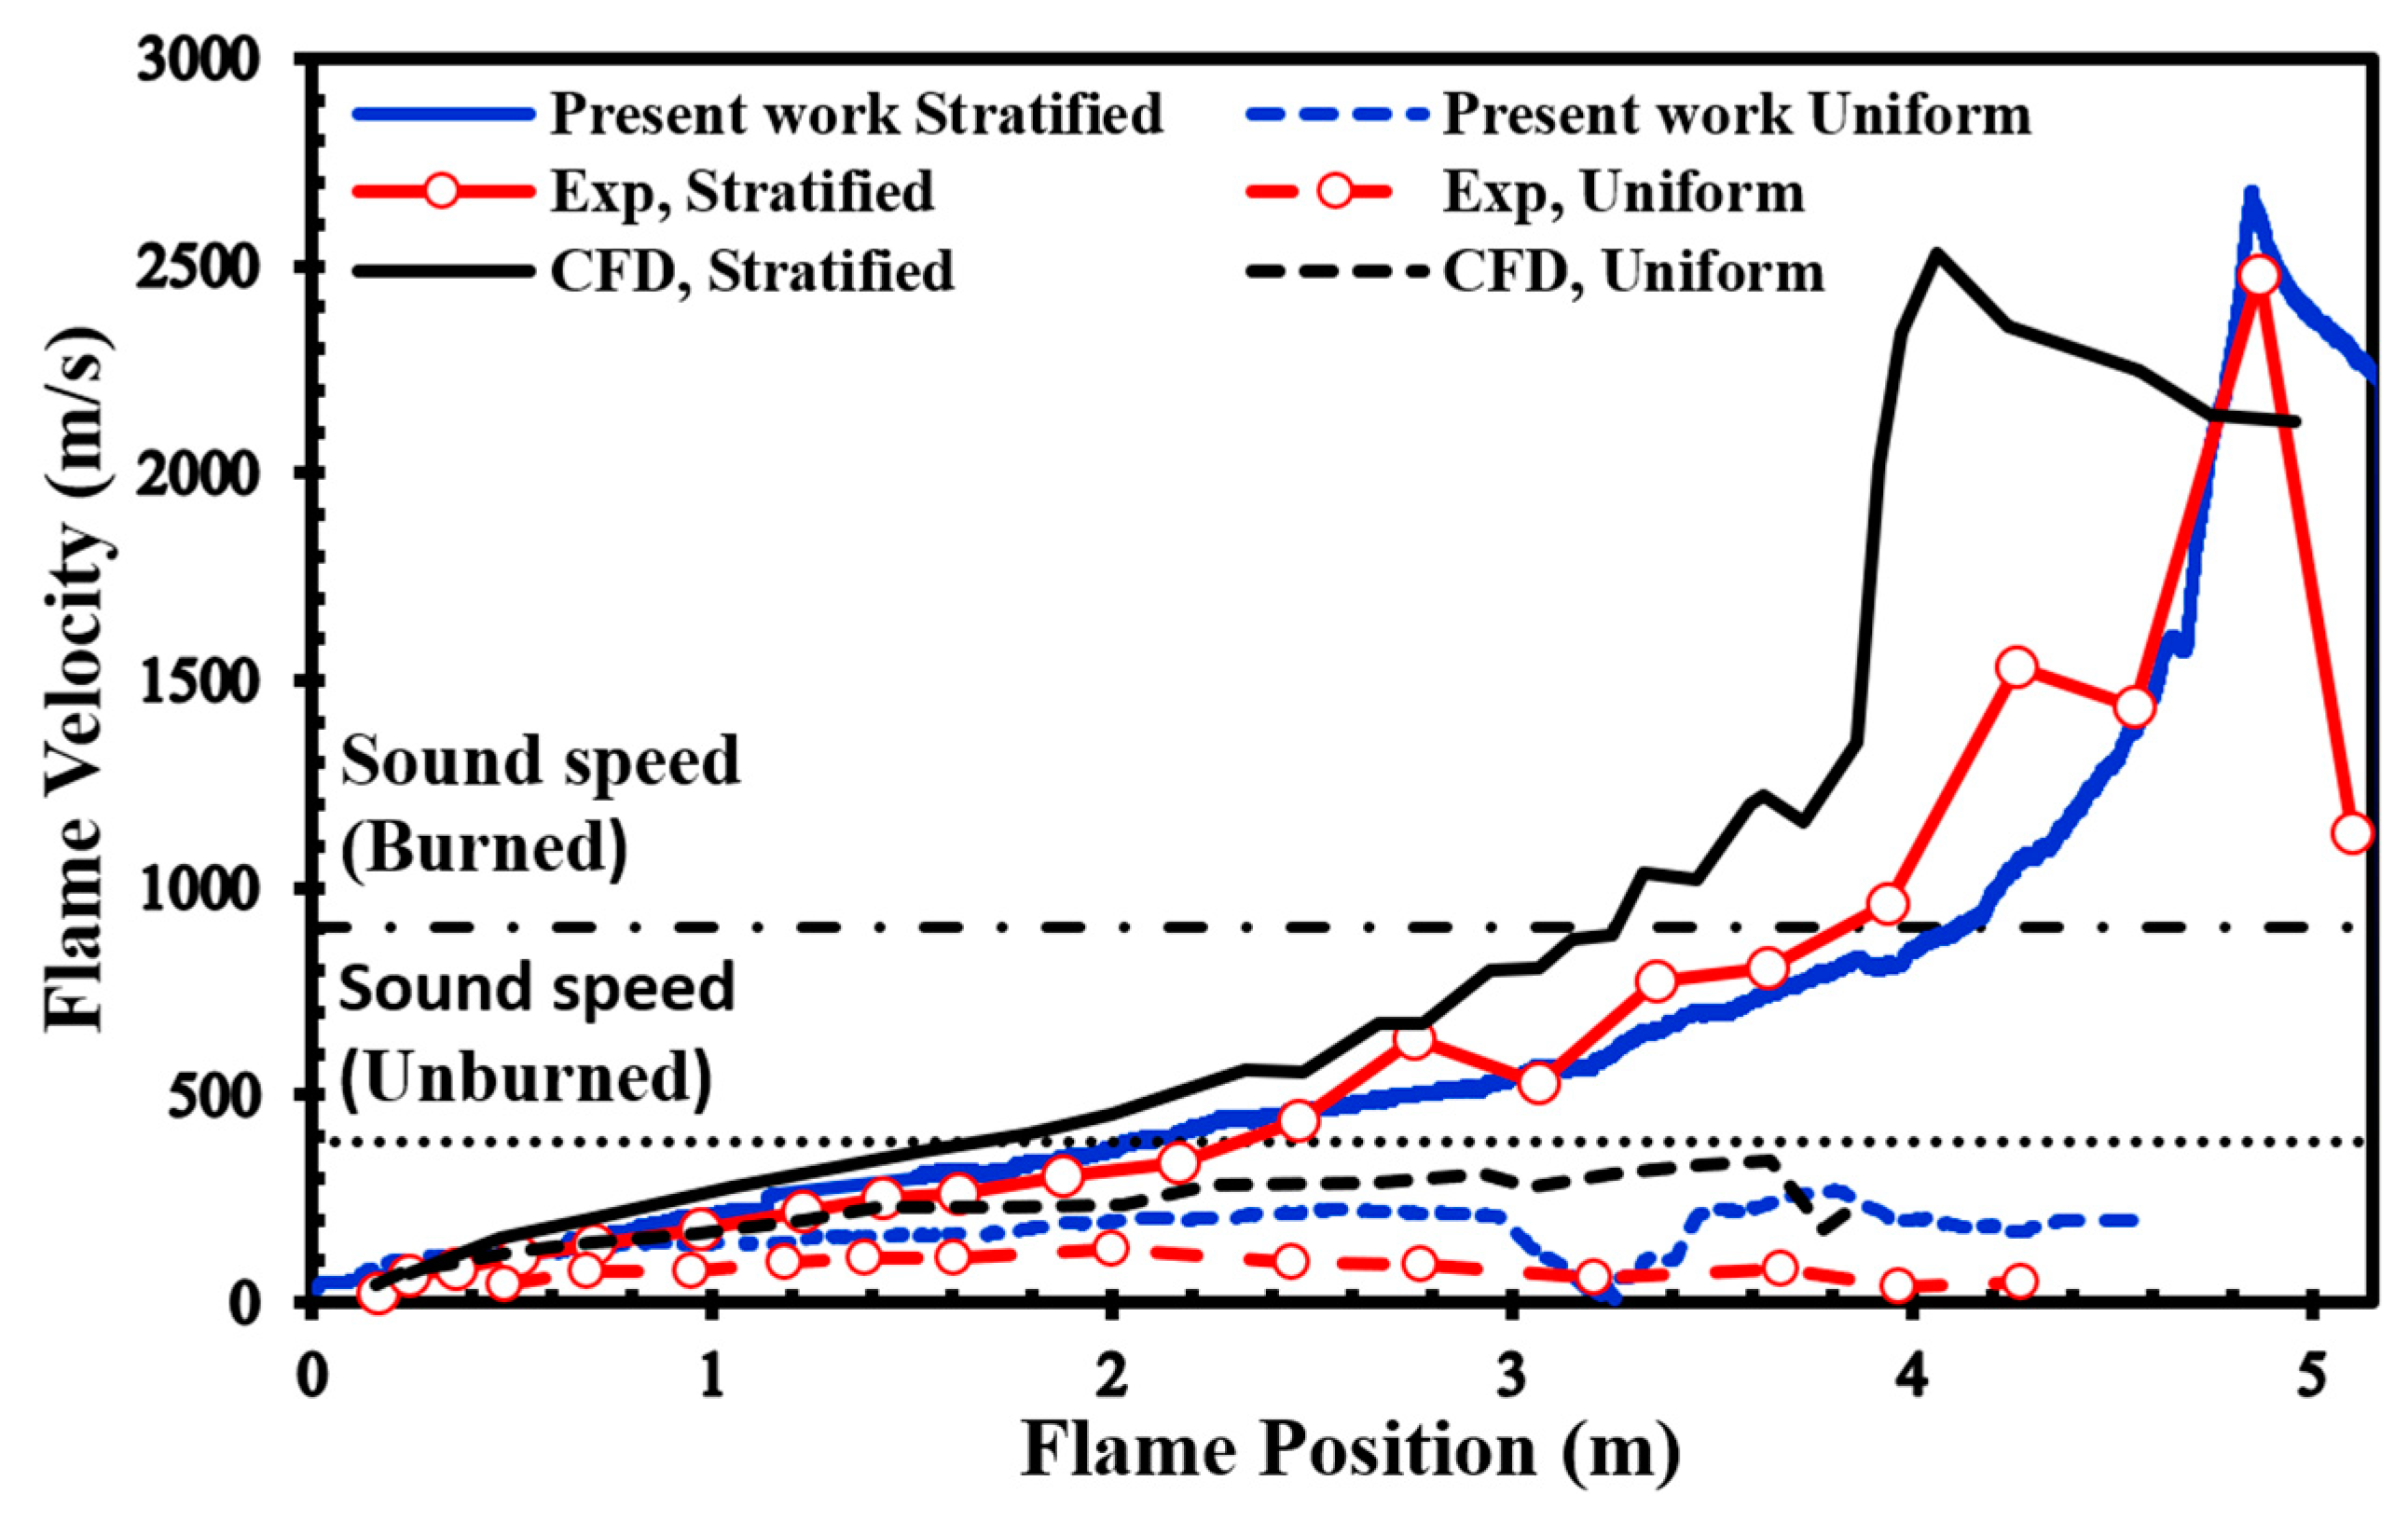
In our simulations, we used a uniformly structured grid within a 2D computational domain. The smallest cell size was set to 1 mm, following a similar methodology as the simulations carried out in the previous section and as described in the work by Saeid et al. [28]. No-slip and adiabatic boundary conditions were imposed on the walls of the channel, and the spark zone was represented as a hot spherical region with a radius (R) of 25.4 mm, where the reaction progress variable reached 1 and the temperature reached 2440 K. We surveyed the unobstructed version of the channel shown in Figure 2 to verify the validity of our present simulations since there are no previously published simulations or experimental findings for the channel displayed in Figure 2. Figure 6 presents a comparison between our simulation results and the experimental data provided by Boeck et al. [38]. Our numerical simulations closely match the overall trend observed in the experimental data. Furthermore, when we compare our results to those presented by Karanam et al. [39], it becomes evident that our calculated results are in strong agreement with their outcomes. This collective evidence underscores the satisfactory performance of our model, yielding qualitatively acceptable results for simulating both deflagration and DDT phenomena.
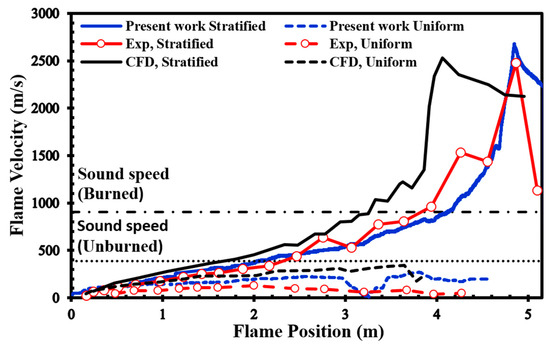
Figure 6.
Flame front speed in 22.5% average-concentration uniform and stratified H2-air mixtures, plus the results of experimental [38] and numerical [39].
4. Results
4.1. Effects of Inhomogeneity on the FA and DDT in Lean Mixtures
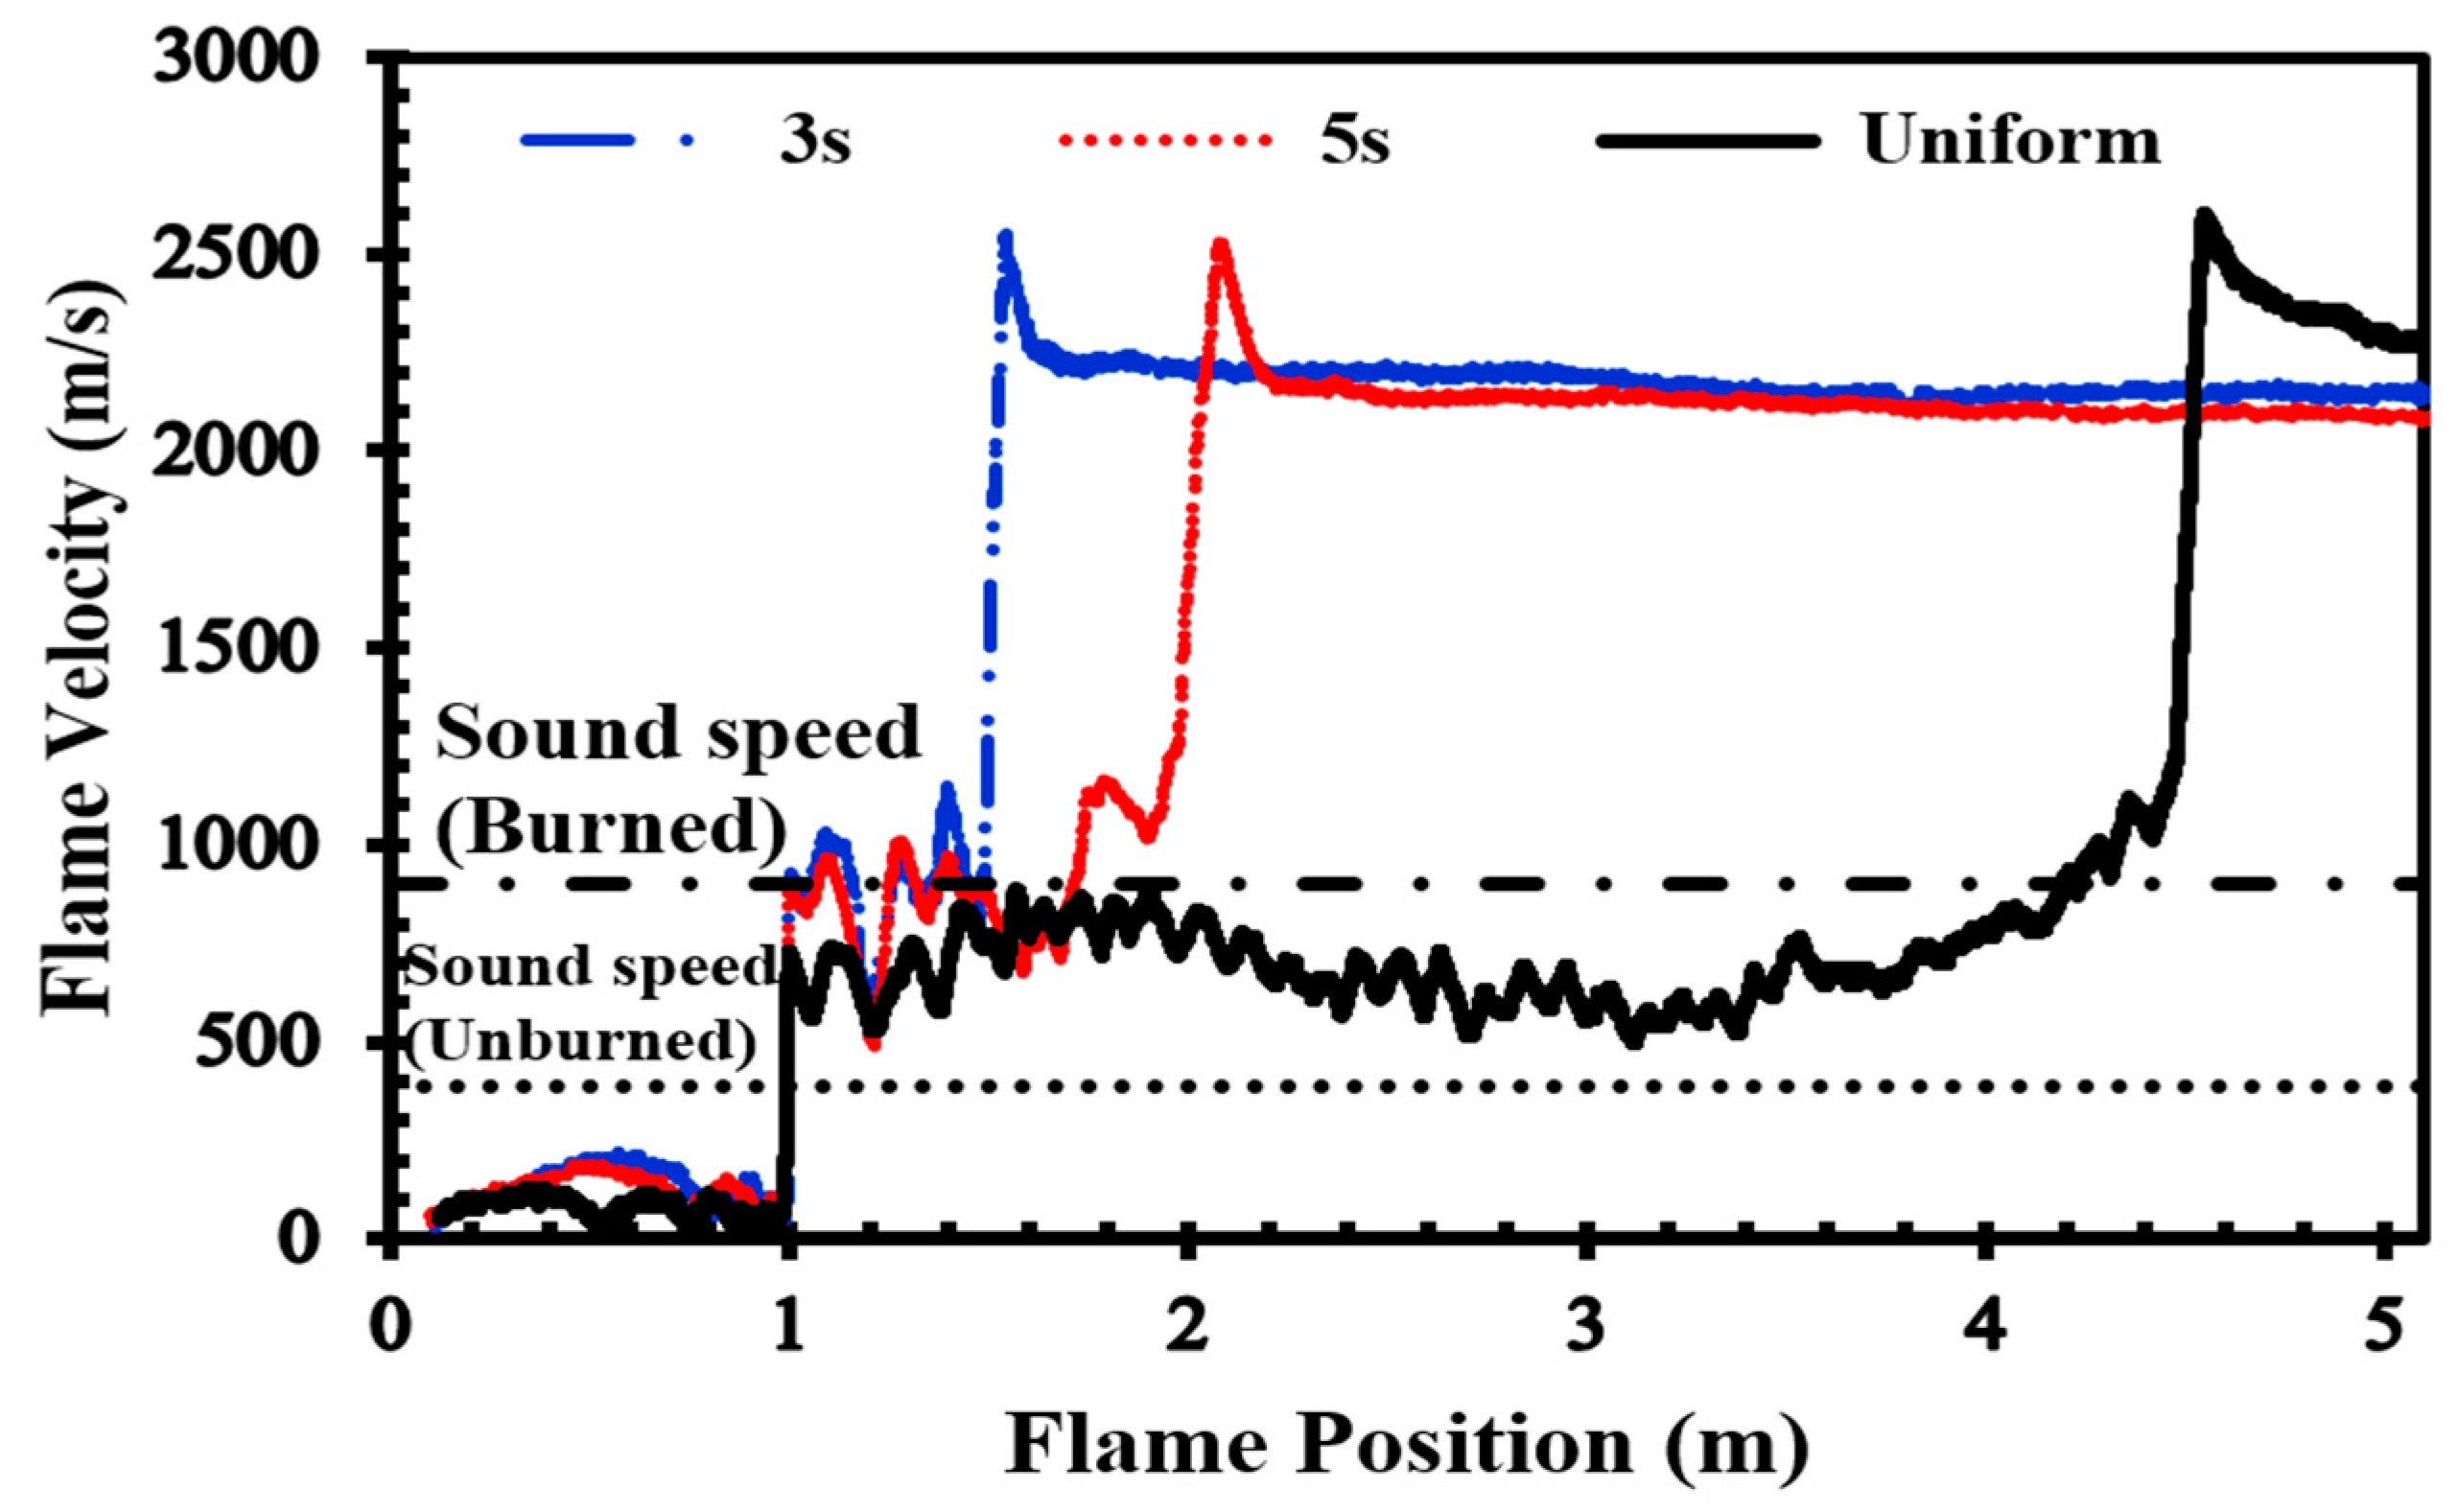
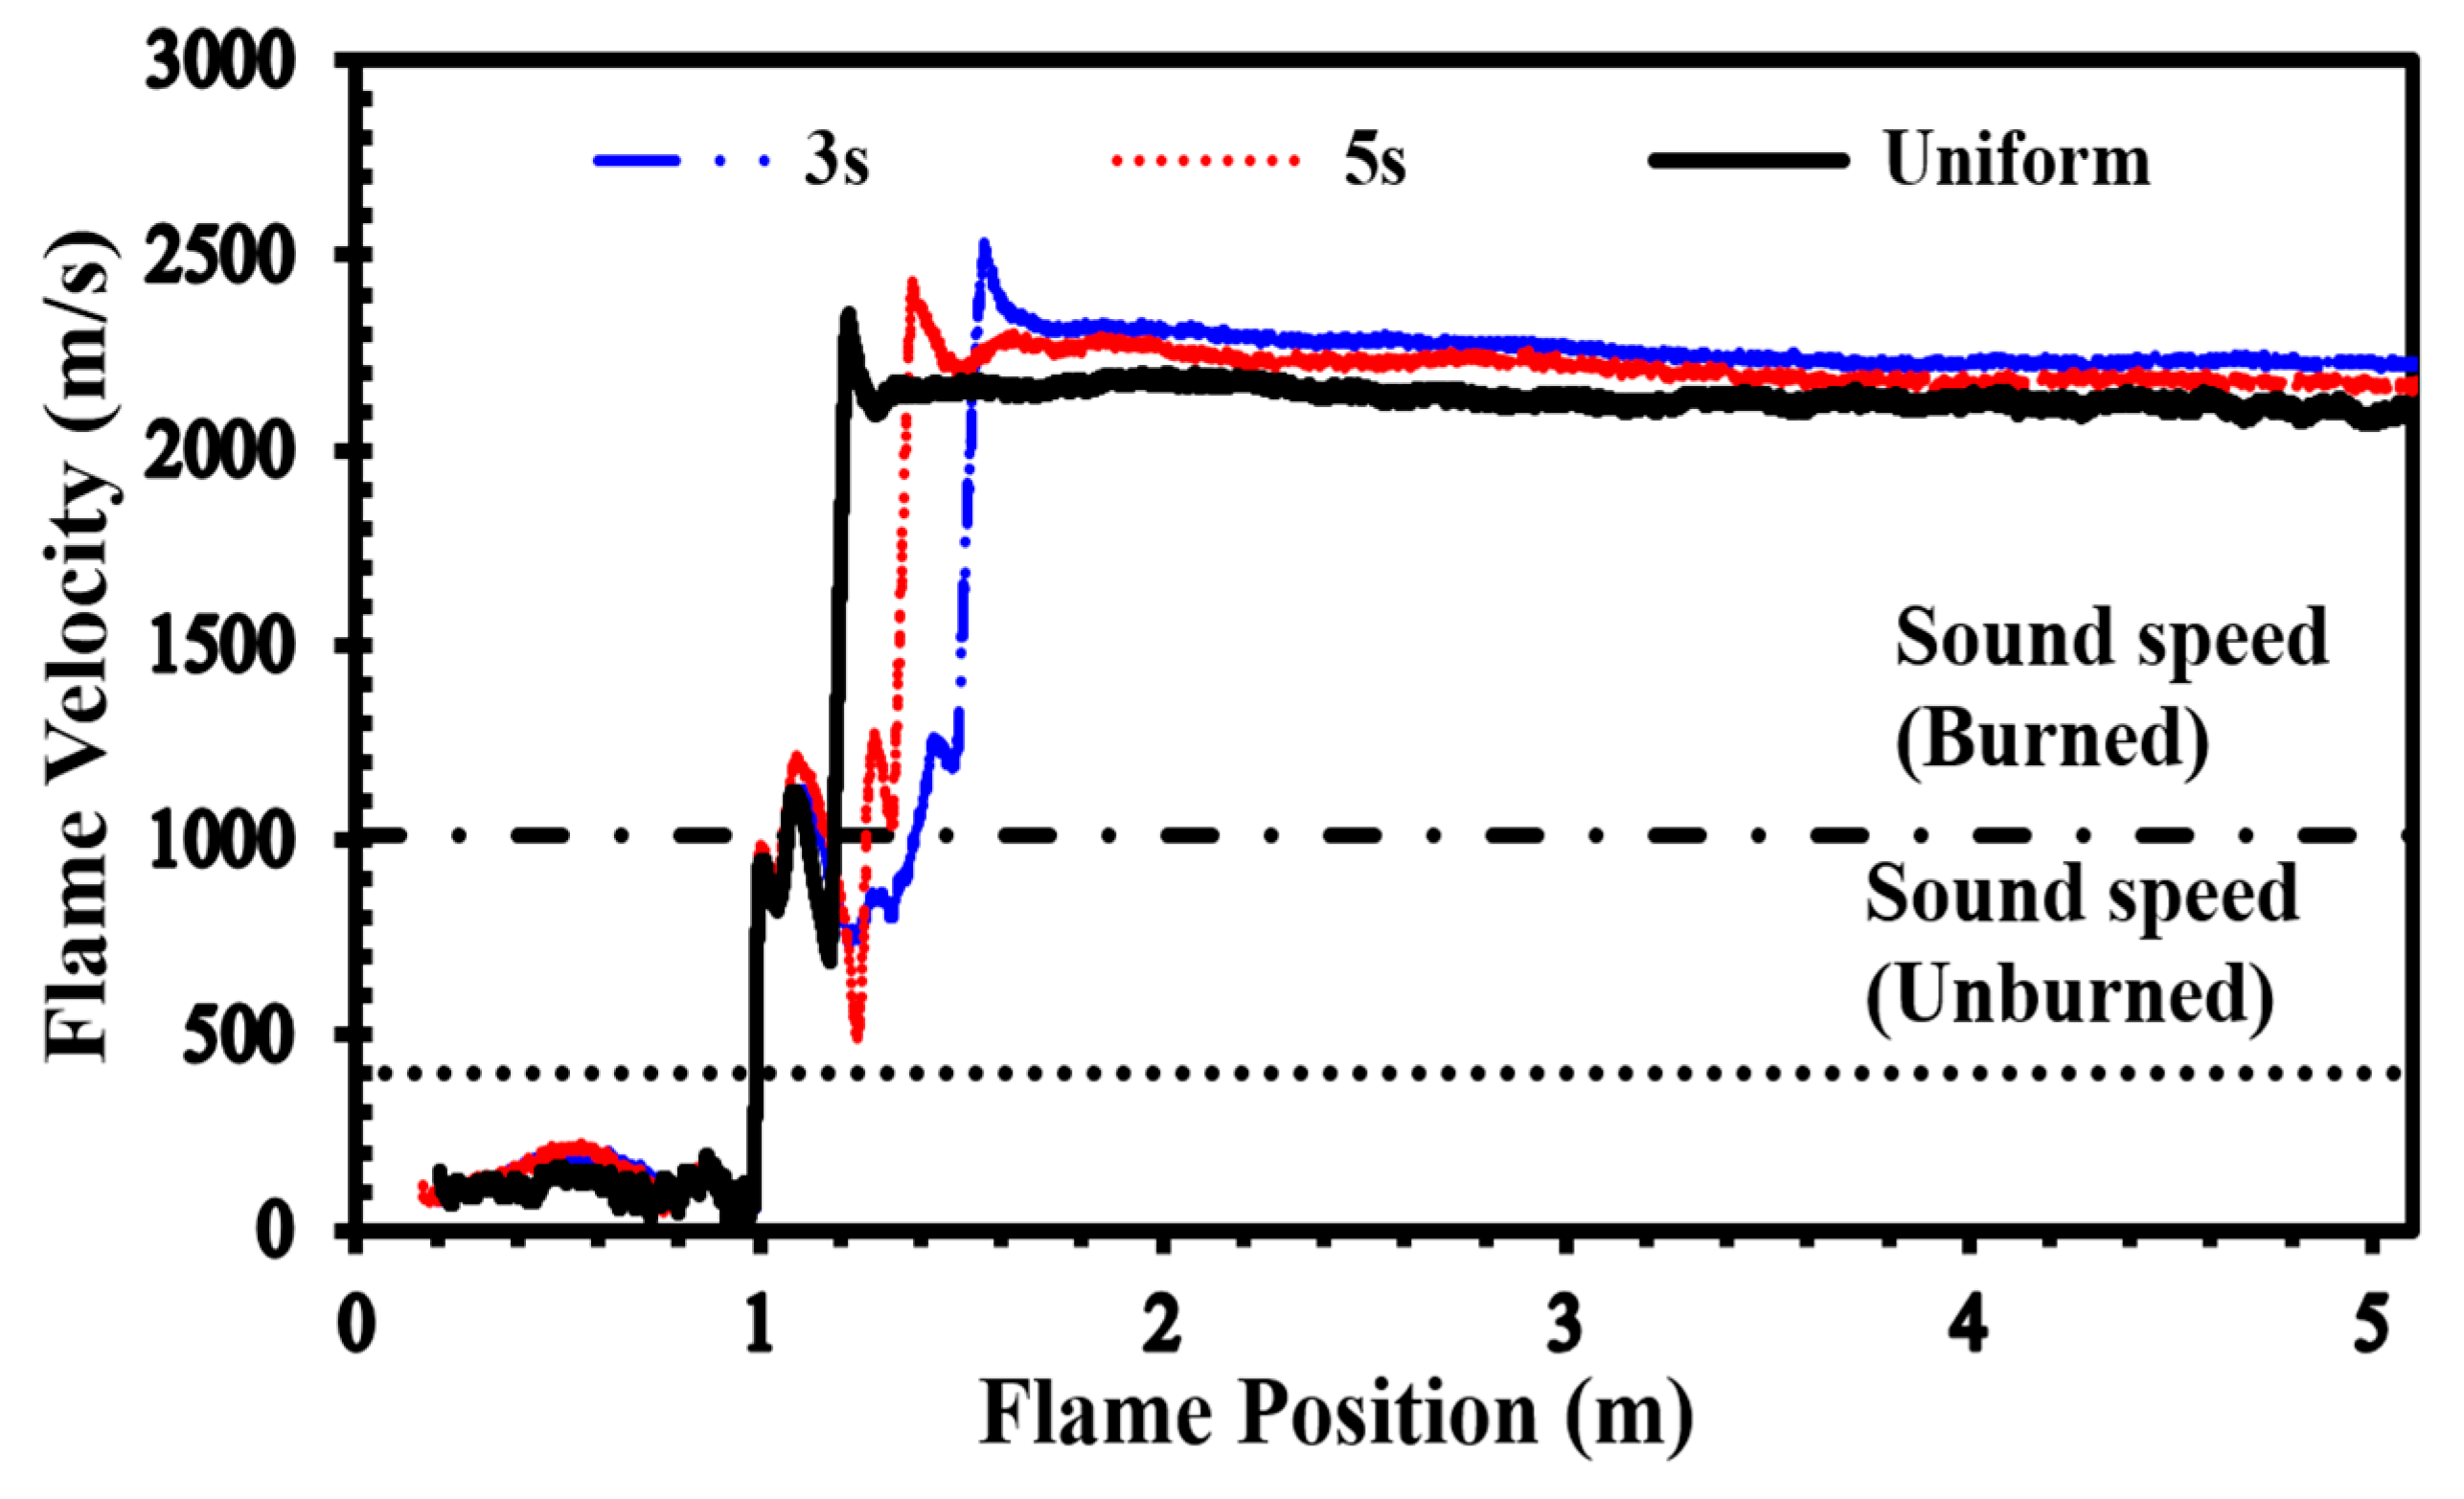
In Figure 7, which shows the effects of inhomogeneity on the flame speed in the channel depicted in Figure 2, for an H2-air mixture with an average concentration of 22.5%, when the mixture is uniform, DDT occurs at the channel’s end. However, when its inhomogeneity increases (diffusion time reduces to 3 s), the run-up distance of DDT occurrence decreases.
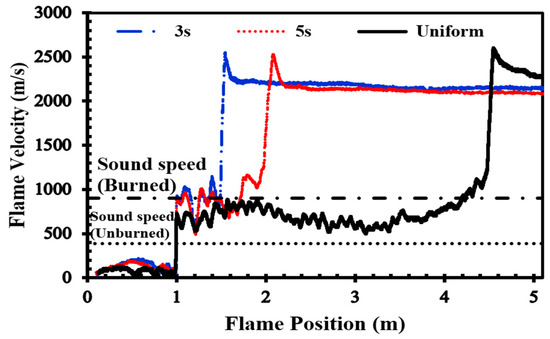
Figure 7.
Flame front velocity in uniform and stratified H2-air mixtures with an average concentration of 22.5% and diffusion times of 3 s and 5 s.
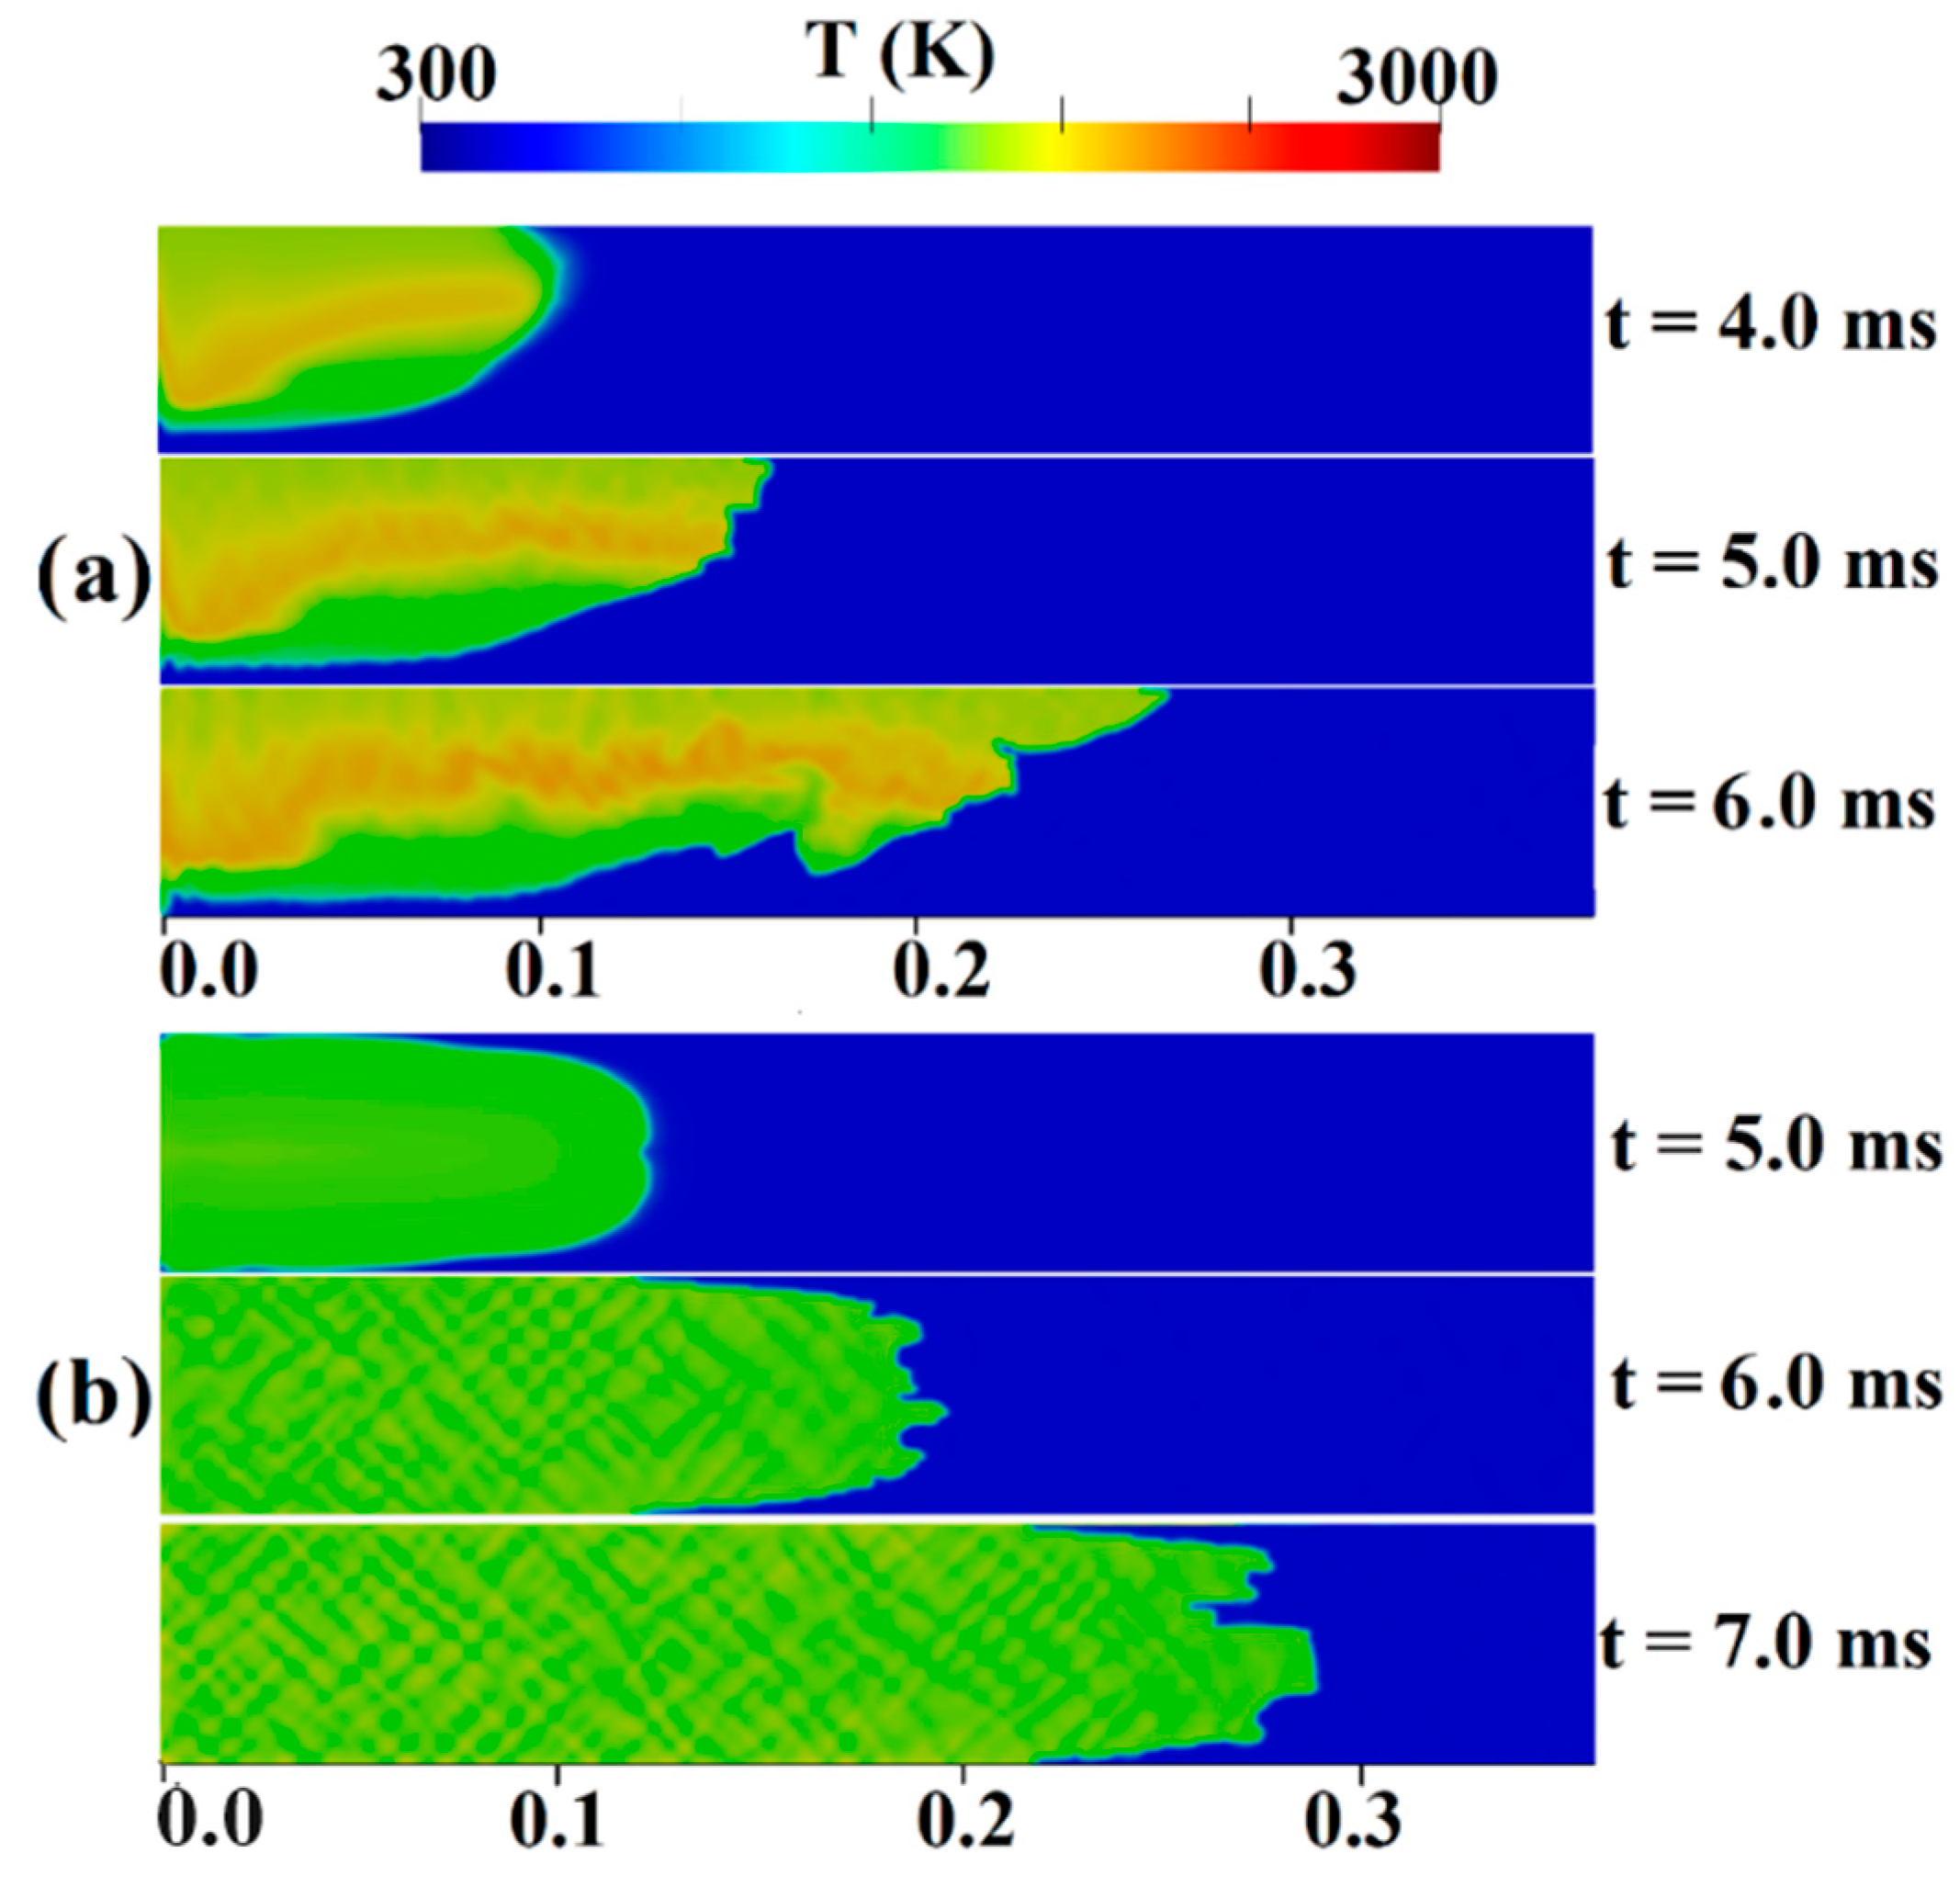
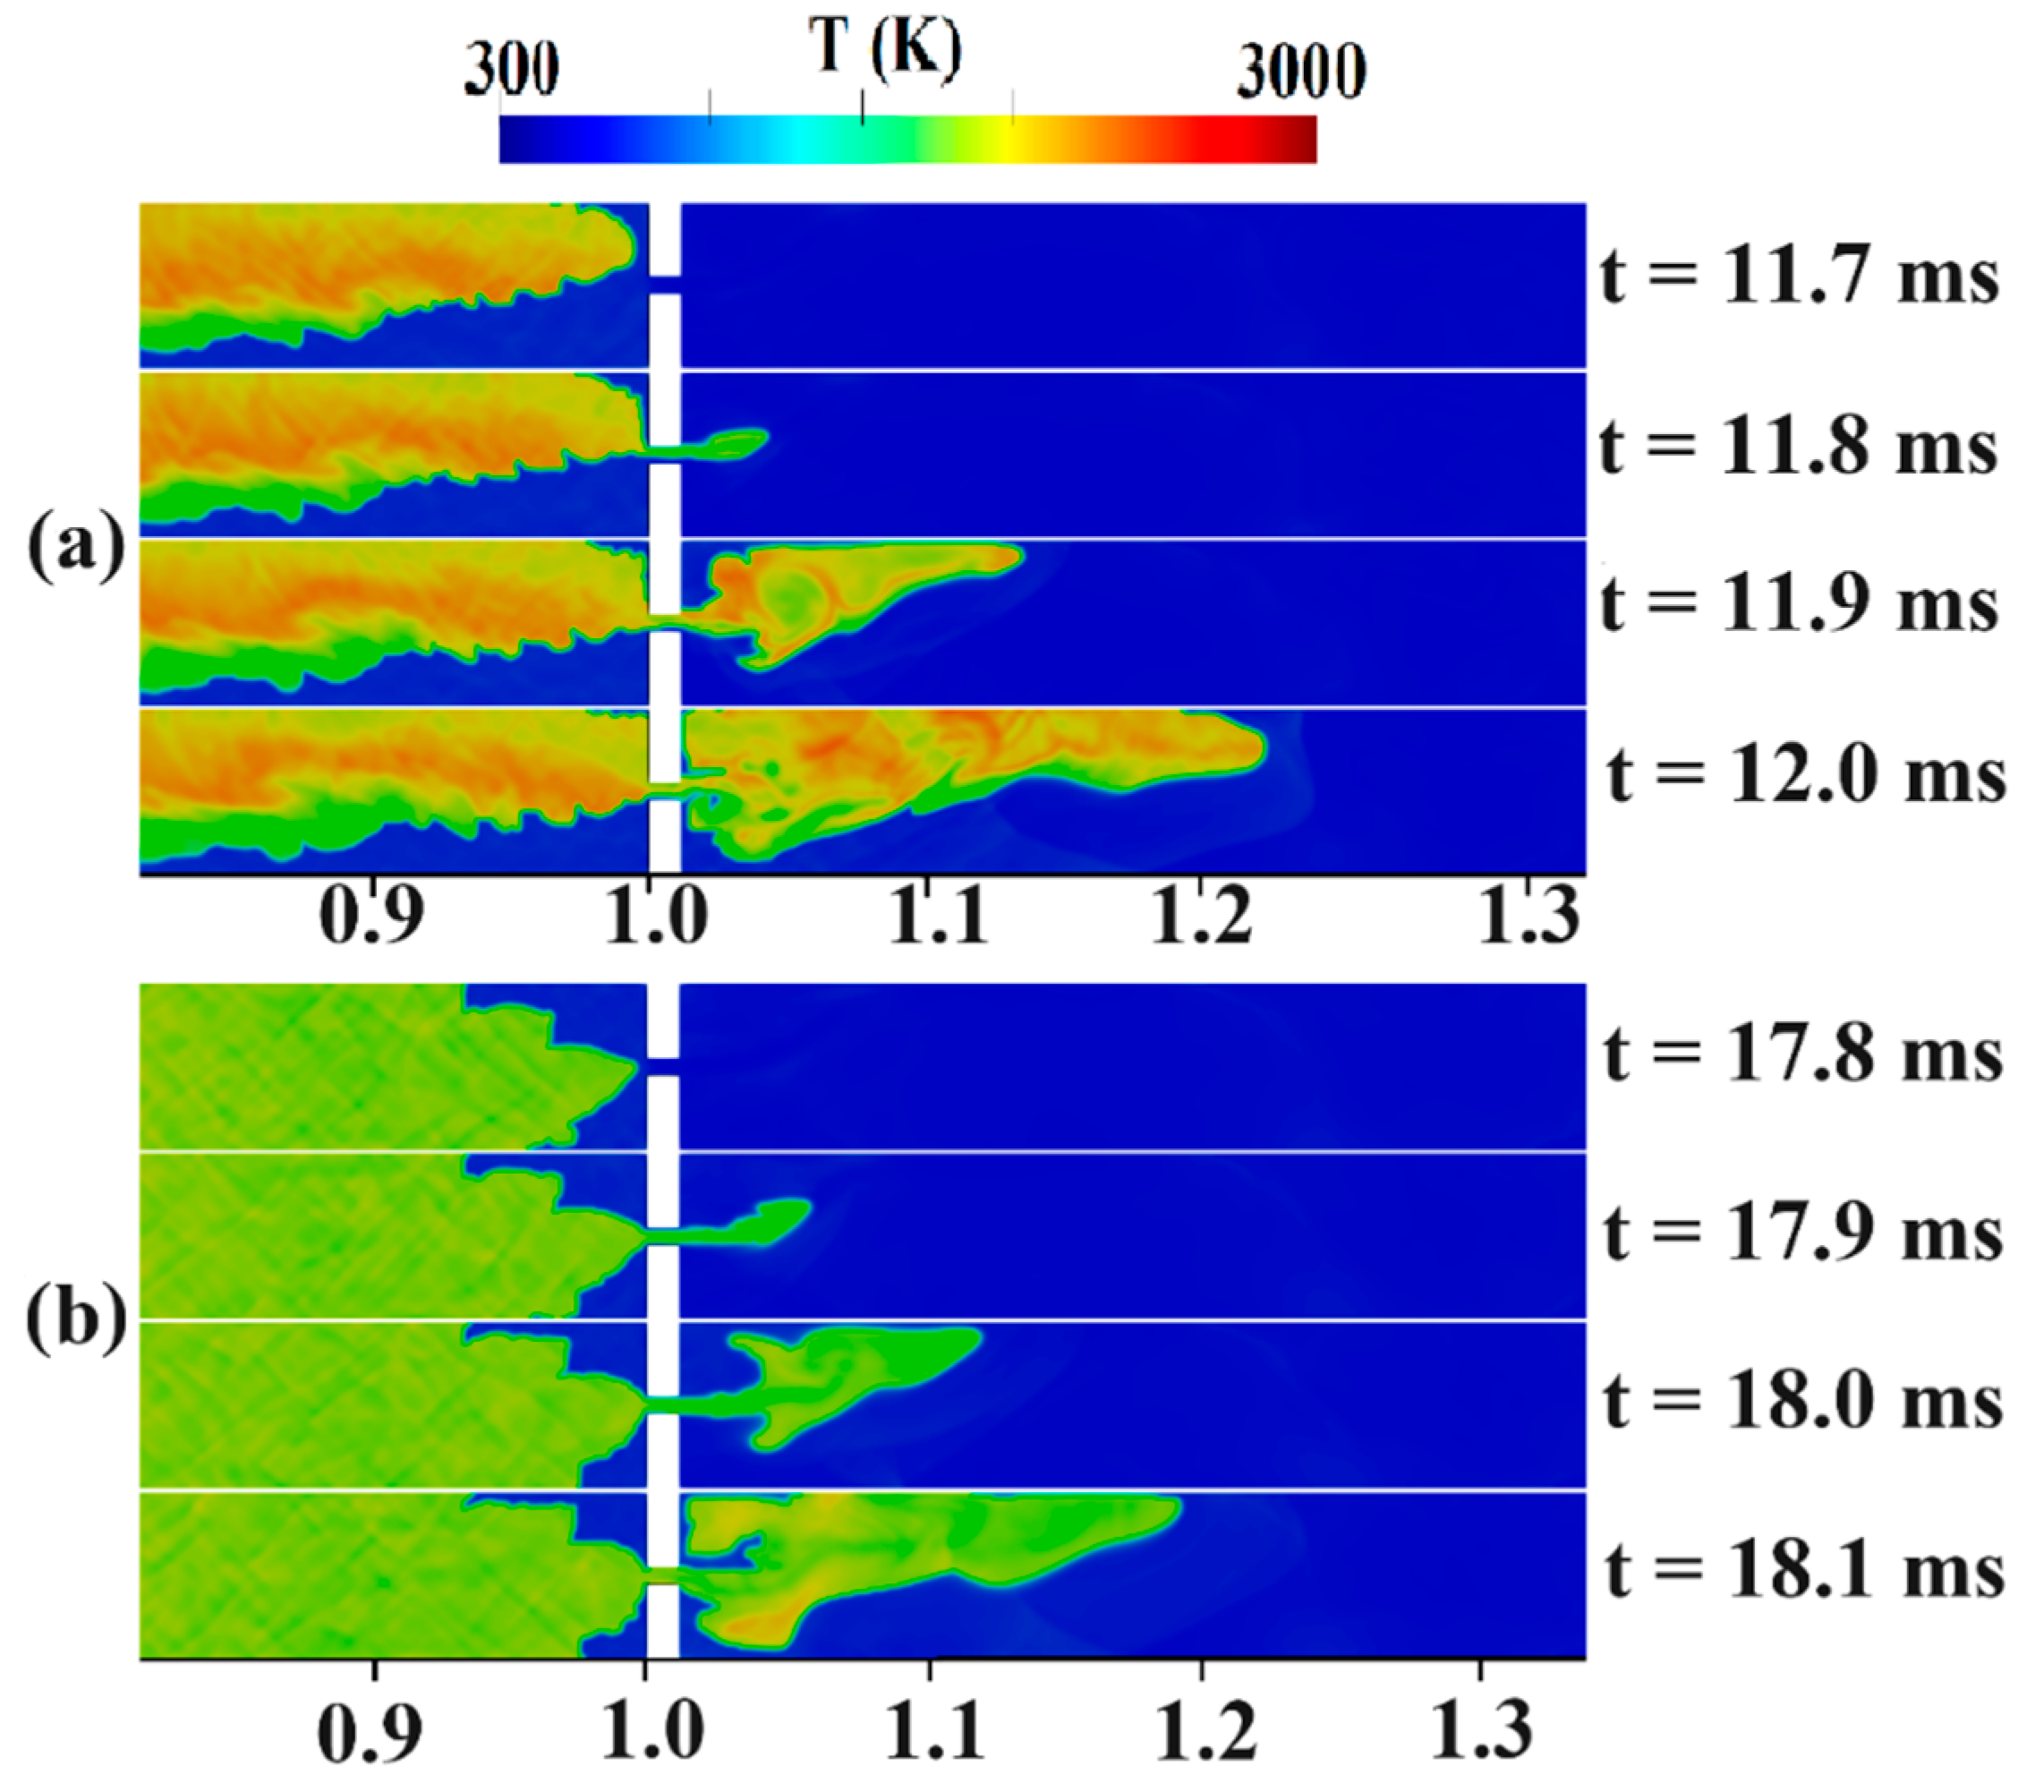
Figure 8 and Figure 9 show temperature contours within a channel featuring a 0.9 blockage ratio, filled with a stratified and uniform H2-air mixture with an average hydrogen concentration of 22.5%. These figures provide insights into the two distinctive stages of FA:
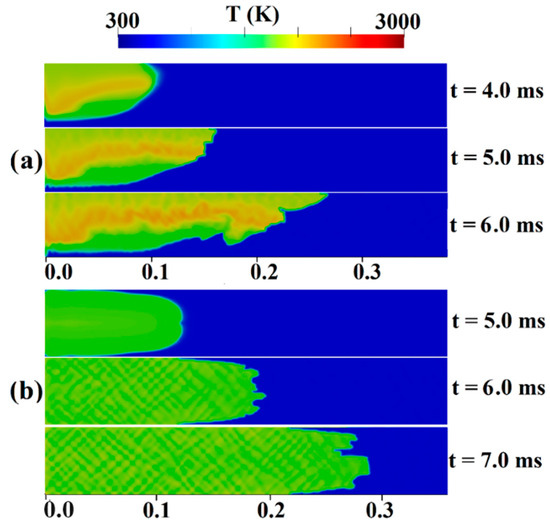
Figure 8.
Temperature contours for the channel containing H2-air mixture with an average hydrogen concentration of 22.5% (a) stratified (b) uniform.
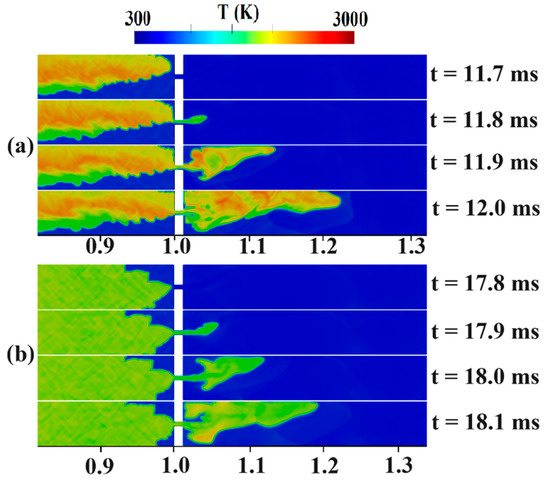
Figure 9.
Temperature contours for the channel containing an H2-air mixture with an average hydrogen concentration of 22.5% (a) stratified (b) uniform.
- (1)
- Initial flame propagation stage:
In Figure 8, we observe the initial stages of ignition and flame propagation. In the stratified mixture (Figure 8a), during the first 4.0 ms, the ignition zone gradually expands. The flame front undergoes wrinkle formation due to natural flame instability in lean mixtures, leading to an increase in surface area around t = 5.0 ms. As time progresses, the hydrogen moves to the upper region of the channel due to the higher hydrogen concentration there compared to the duct floor. Comparable findings were found in the experiments carried out by Boeck et al. [40] and the simulations by Karanam et al. [39]. Based on their respective findings, both studies concluded that the flame spreads faster in the top part of the channel due to a greater hydrogen content. In a uniform mixture (as shown in Figure 8b), it is evident that the flame shape continuously changes during its propagation. Initially, at t = 5.0 ms, the flame exhibits laminar behavior, expanding in a symmetric shape. However, at t = 7.0 ms, the flame undergoes significant wrinkling and propagates towards an obstacle. Furthermore, in the simulation by Wang et al. [41], during the initial flame propagation stage of a uniform mixture, numerous wrinkles emerged on the flame surface in terms of the influence of turbulent disturbances and Landau–Darrieus (L-D) instability. In the stratified mixture, as the flame surface becomes increasingly elongated, it is anticipated that flame acceleration will be enhanced in the direction of propagation. This elongation directly affects flame speed by increasing the flame’s surface area and, consequently, boosting the rate of combustion. Consequently, FA in stratified mixtures is expected to be higher than in uniform mixtures.
- (2)
- Jet flame passing through the obstacle stage:
Figure 9 captures the jet flame stage for stratified and uniform mixtures. In Figure 9a, at t = 11.7 ms, the flame’s behavior can be observed, showing a preference for propagating towards the upper regions of the domain, where the hydrogen concentration is higher. At t = 11.8 ms, the flame successfully passes through the obstacle, giving rise to a jet-like flame on the right side. At t = 11.9 ms, the effects of vortices create an unburned zone in front of the obstacle. The shape and surface area of the flame may be used to explain the notable variation in flame propagation between the uniform and stratified configurations. Figure 9b shows that the uniform arrangement causes the flame to rise because of the buoyancy force in the top half of the duct, with an essentially symmetrical flame front at a constant axial position at t = 17.8 ms. As the flame continues, it expands and burns, leading to the formation of a relatively not-so-strong compression wave at t = 18.1 ms, just ahead of the advancing flame front.
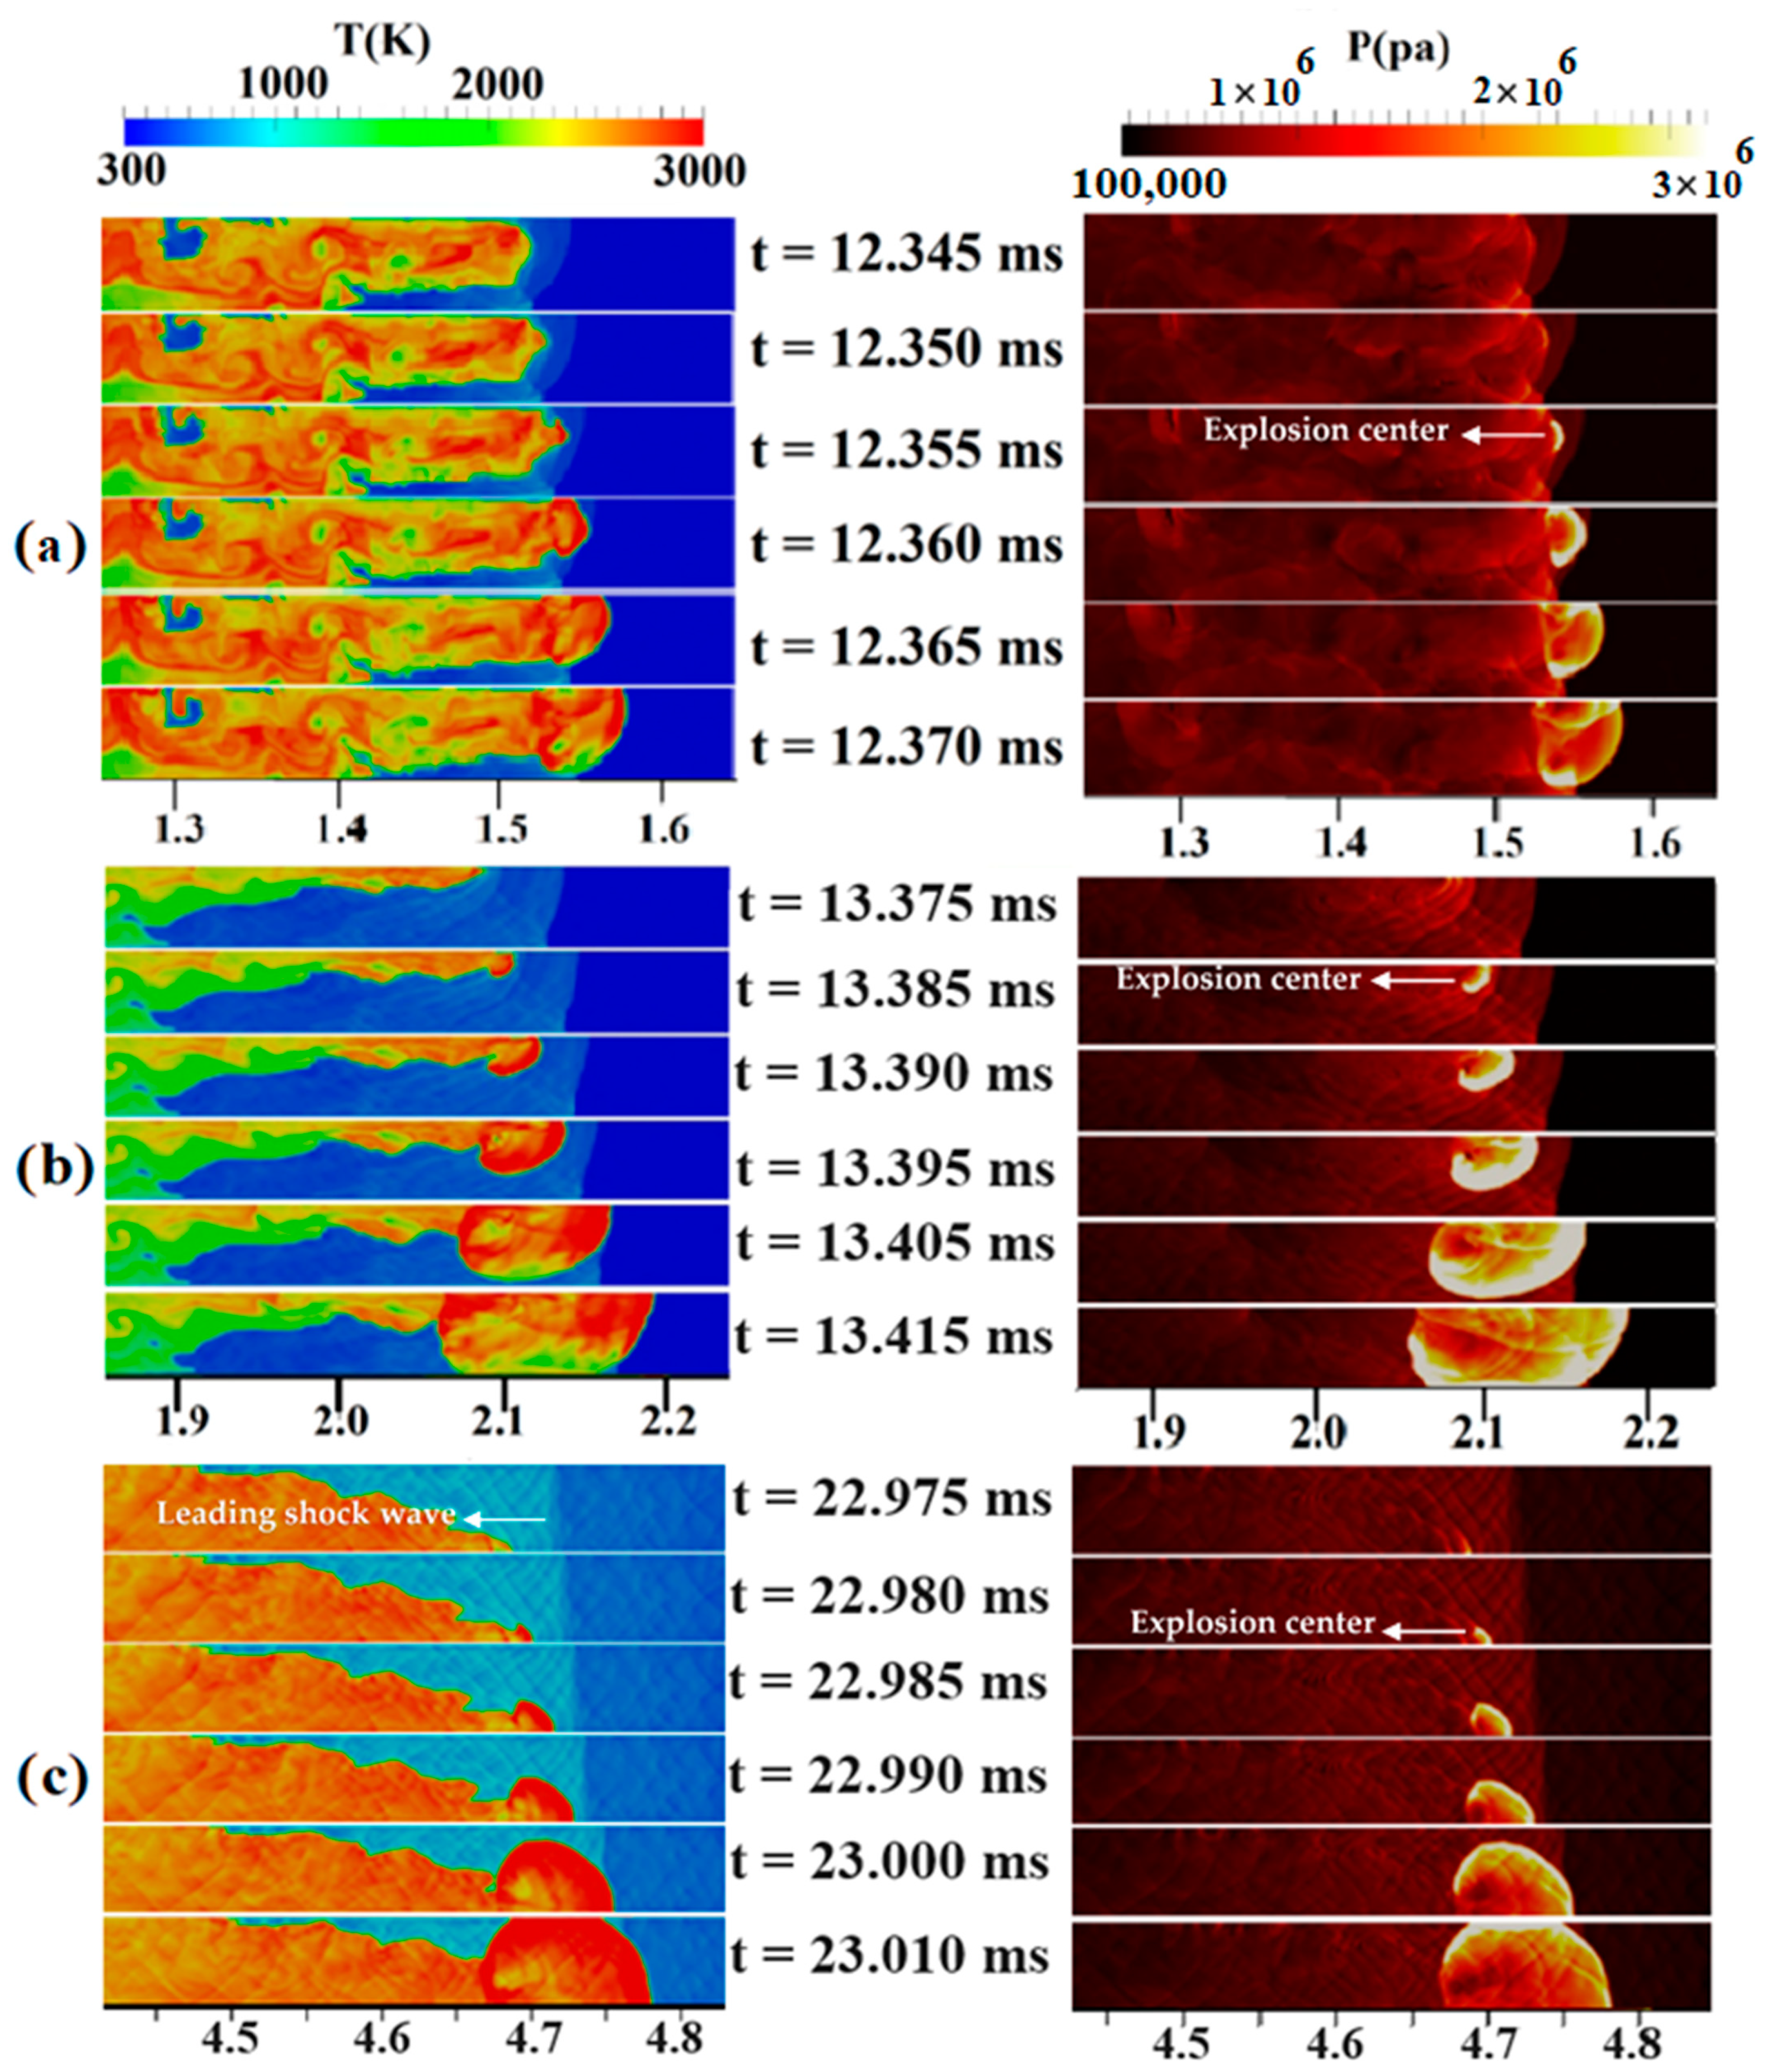
Now, the jet flame to detonation transition mechanism is addressed in uniform and stratified H2-air mixtures with diffusion times of 3 and 5 s inside a duct with a blockage ratio of 0.9. The contours of the temperature and pressure in Figure 10a belong to a 3-s diffusion-time stratified mixture. In this figure, a hot region was formed upstream of the obstacle at 12.355 ms, causing an explosion center to form. Subsequently, due to the concentration of pressure waves, a detonation wave is formed, gradually occupying the channel width. In Figure 10b, which shows the temperature/pressure contours for a 5-s diffusion time, the preheated area in the temperature contour at 13.375 ms lies ahead of the flame front. Hence, the upper-wall shock reflection creates a hot spot at 13.385 ms, which, over time, causes a detonation to begin. The new, detonation-induced combustion wave moves fast, and, finally, the detonation wave due to the local explosion and the leading shock wave merge. This mechanism behind DDT can be similar to the one described by Wang et al. [42]. They observed the formation of a hot spot at the flame tip, which promptly consumed the surrounding premixed gases, leading to the initiation of a detonation. In Figure 10c, which shows the temperature/pressure contours at the channel end for a fully uniform mixture, its flame front is symmetrical before reaching the obstacle but becomes asymmetric after passing it. This flame front asymmetry in a uniform mixture has also been observed in the experimental work of Gaathaug et al. [43]. An explosive center is formed, at about 22.980 ms, behind the leading shock at the lower wall of the channel and moves towards unburned materials as a detonation wave, which gradually covers the entire channel width.
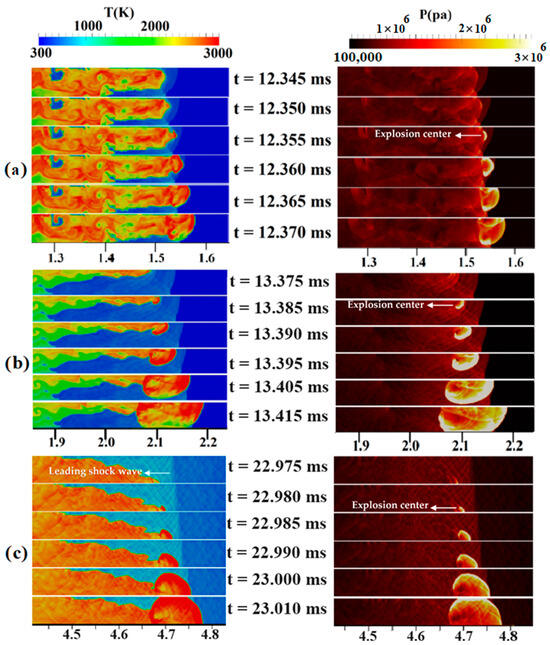
Figure 10.
Temperature/pressure contours for a channel containing a H2-air mixture with an average concentration of 22.5%: (a) 3 s diffusion time; (b) 5 s diffusion time; (c) uniform mixture.
4.2. Effects of Inhomogeneity on FA and DDT in Stoichiometric Mixtures
Figure 11 illustrates the effect of mixture inhomogeneity on flame speed within the channel, represented in Figure 2. This channel contains an H2-air mixture with an average concentration of 30%. As the flame advances towards an obstacle positioned 1 m from the channel’s entrance, it accelerates and attains a higher velocity as it passes through the obstacle, resulting in the formation of a supersonic jet. Later, the interaction of the flame with this jet flow will create a high-speed turbulent flame. The flame’s surface area suddenly increases sharply when it enters this turbulent jet, increasing the energy release rate and, therefore, the flame propagation speed. When compared to earlier circumstances, the flame’s surface area expands dramatically in this situation, which causes a strong shock wave to emerge in front of it. This shock wave causes the flame to undergo a transition to detonation in less than 0.5 m of travel. As depicted in this figure, in contrast to lean mixtures, for stoichiometric mixtures, decreasing the diffusion time (or increasing the mixture’s non-uniformity) diminishes the FA and postpones the transition to detonation. In the uniform mixture DDT event has occurred in the shortest time and at the closest distance from the channel head.
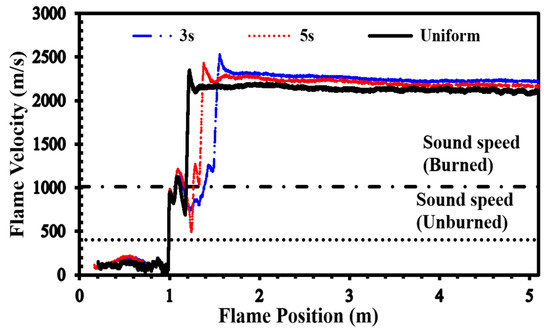
Figure 11.
Flame front velocity in uniform and stratified H2-air mixtures with an average concentration of 30% and diffusion times of 3 s and 5 s.
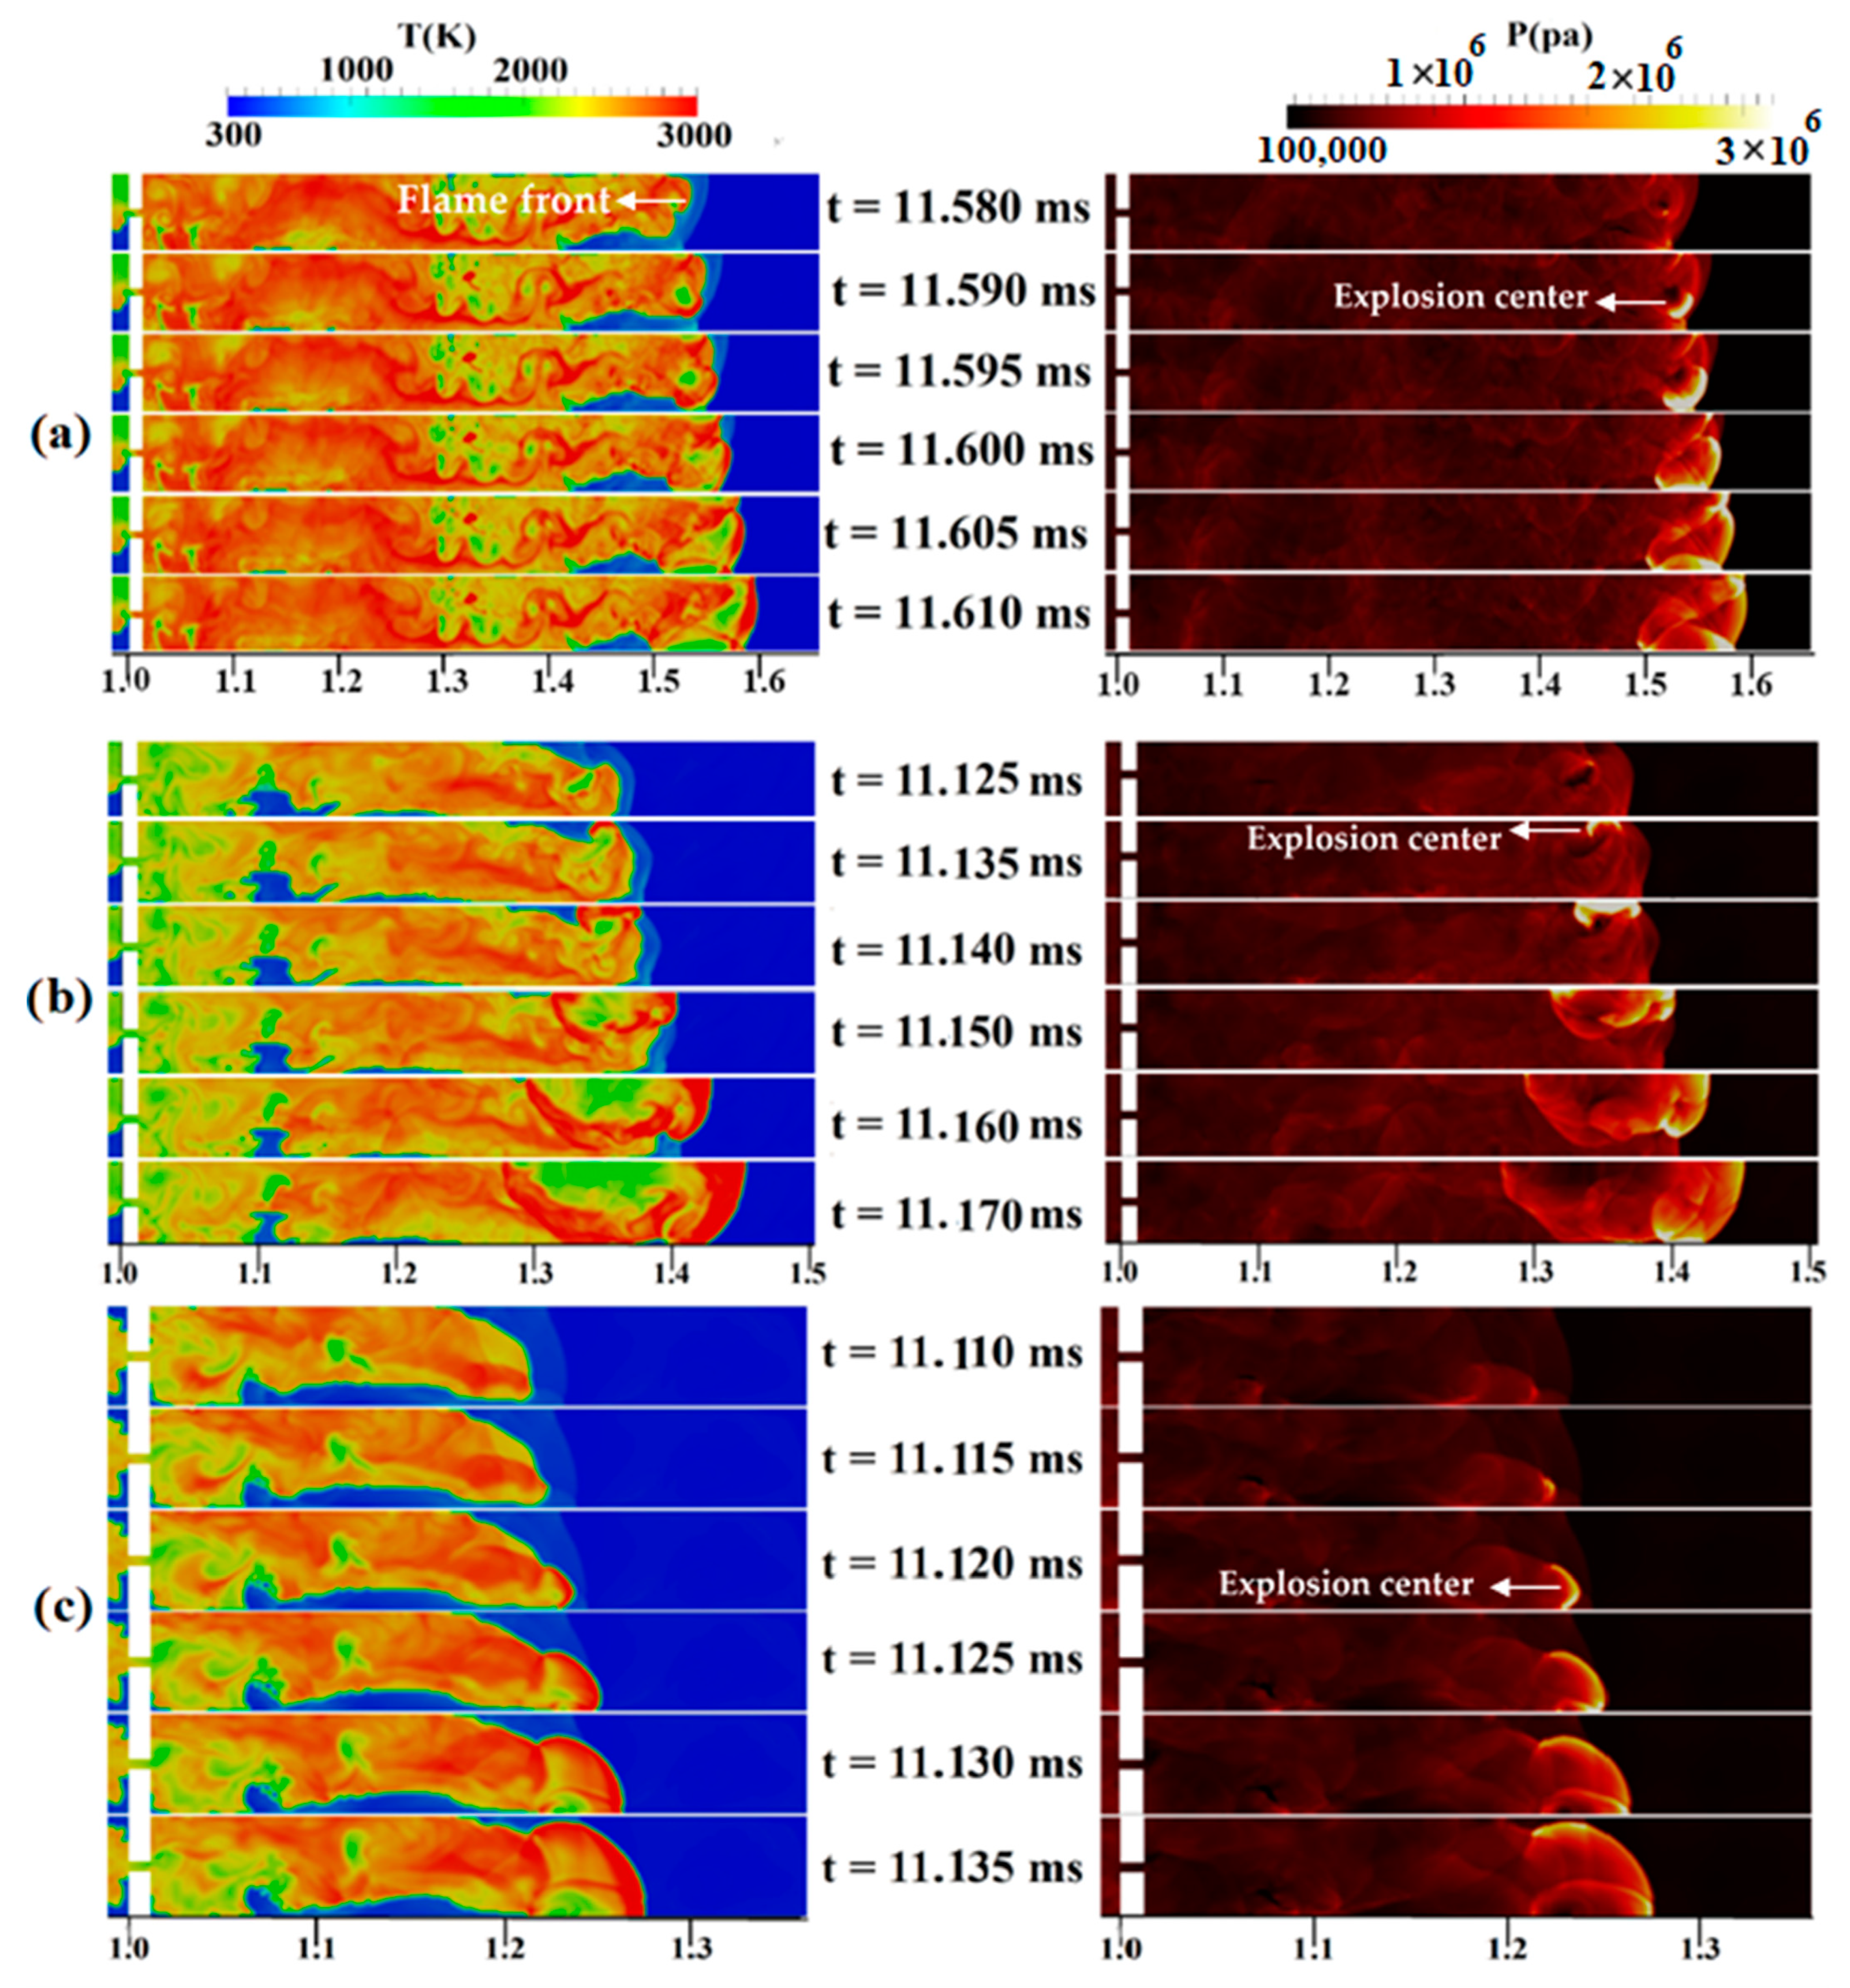
Changing the concentration and diffusion time will change the DDT-process-governing mechanisms. Figure 12a shows the temperature/pressure contours for a stratified mixture with an average concentration of 30%, a diffusion time of 3 s, and a blockage ratio of 0.9. Here, at 11.590 ms, an explosion center occurs in an area containing a lean mixture, which is the place where the reflected shock wave comes from Mach reflection and the flame front collide. This hot spot is the main source of the detonation onset, which gradually occupies the channel width. Figure 12b demonstrates the final steps of the DDT process in a stratified H2-air mixture with a 5-s diffusion time. At 11.135 ms, a high-temperature zone or a hot spot appears in the temperature contour near the upper wall of the channel, which leads, over time, to a local explosion and transition to detonation. Rapidly propagating, these overdriven detonation waves combine with the leading shock wave. In summary, the interaction between the upper wall, leading shocks, and the region with the highest concentration of hydrogen is the cause of DDT. In Figure 12c, which shows the temperature/pressure contours of the DDT process for a uniform mixture, a relatively strong curved shock wave is propagating in front of the flame. At 11.120 ms, a high-temperature area (hot spot) appears in the temperature/pressure contour near the lower wall of the channel in terms of the concentration of the pressure waves near the flame front. With the passage of time, this hot spot leads to a local explosion, causing an overdriven detonation wave to form. This result is similar to the mechanism of local detonation initiation caused by the pressure buildup at the leading edge of the flame, as observed by Zhao et al. [44].
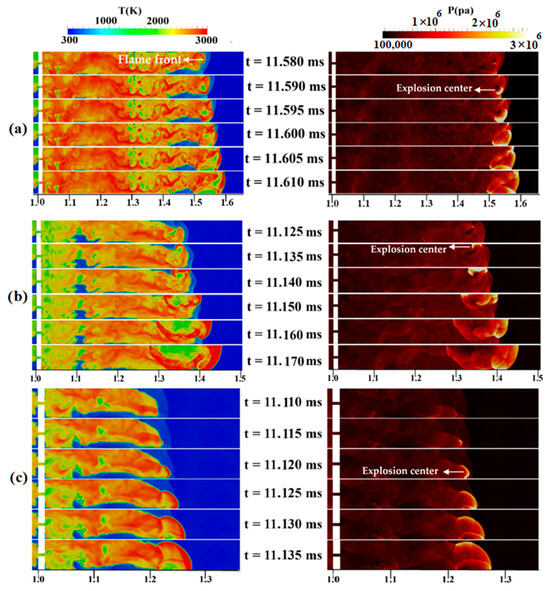
Figure 12.
Temperature/pressure contours for a channel containing a H2-air mixture with an average concentration of 30%: (a) 3 s diffusion time, (b) 5 s diffusion time, (c) uniform mixture.
5. Conclusions
This study examined the effects of the fuel diffusion time on the FA and detonation initiation in uniform and stratified H2-air mixtures with different concentrations in a turbulent jet flame. Based on the results, the diffusion time and concentration of the H2-air mixture are influential factors in the FA and the DDT location.
- In the average 22.5% concentration H2-air mixture, detonation began in all the cases, and comparing the flame speed graphs showed that a decrease in the diffusion time and an increase in the mixture inhomogeneity sped up the flame propagation and the DDT occurrence in the channel.
- In the average 30% concentration H2-air mixture, deflagration to detonation transition occurred in all the cases, and the mixture inhomogeneity weakened the FA and delayed the DDT.
- This research showed that the inhomogeneity behavior differed between lean and stoichiometric mixtures; in the lean mixture, increasing the inhomogeneity reduced the run-up distance to detonation, while in the stoichiometric mixture, increasing the diffusion time (homogeneity) did so.
- A feature of the turbulent jet flame-to-detonation transition study was the formation of a supersonic turbulent jet in the downstream part of the obstacle. At a certain stage of the FA, the speed at the obstacle bottleneck reached that of sound, causing the flame to choke.
In general, since this study considers different physical phenomena, it enables an accurate evaluation of the present code. Precise simulation of the energy generated after the first spark has a significant impact on the form of the developing flame’s core as well as the early phases of flame expansion. Therefore, an accurate modeling of the spark to achieve the times reported in the experimental results is suggested to continue this research in the future.
Author Contributions
Conceptualization, M.H.S.S., J.K., S.E. and C.B.O.; methodology, J.K., S.E. and C.B.O.; software, M.H.S.S.; validation, M.H.S.S., J.K., S.E. and C.B.O.; formal analysis, J.K., S.E. and C.B.O.; investigation, M.H.S.S.; resources, J.K., S.E. and C.B.O.; data curation, J.K., S.E. and C.B.O.; writing—original draft preparation, M.H.S.S.; writing—review and editing, M.H.S.S., J.K., S.E. and C.B.O.; supervision, J.K., S.E. and C.B.O.; project administration, C.B.O.; funding acquisition, C.B.O. All authors have read and agreed to the published version of this manuscript.
Funding
This work was supported by the Korea Institute of Energy Technology Evaluation and Planning (KETEP) grant funded by the Korean government (MOTIE) (20215810100020, Development of Design Technology and Safety Standard on the Protection Wall for Blast Mitigation in Hydrogen Stations).
Institutional Review Board Statement
Not applicable.
Informed Consent Statement
Not applicable.
Data Availability Statement
The datasets obtained during the current study are available on reasonable request.
Conflicts of Interest
The authors declare no conflict of interest.
Nomenclature
| Thermal diffusivity (m2/s) | |
| c | Reaction progress variable |
| Gas diffusion coefficient (m2/s) | |
| et | Total internal energy (J/kg) |
| g | Body force (m2/s) |
| k | Turbulent kinetic energy (J/kg) |
| p | Pressure (Pa) |
| T | Temperature (K) |
| td | Diffusion time (s) |
| tign | Auto-ignition delay time (s) |
| u | Velocity (m/s) |
| fH | Mass fraction of the mixture |
| Greek letters | |
| Average density of the gas mixture (kg/m3) | |
| Kronecker delta | |
| Dynamic viscosity (kg/m s) | |
| Deflagration source term (kg/m3 s) | |
| Ignition source term for reaction progress variable (kg/m3 s) | |
| Specific turbulent dissipation rate (1/s) | |
| ε | Rate of dissipation of turbulent kinetic energy (J/kg s) |
References
- Fickett, W.; Davis, W.C. Detonation; University of California Press: Berkeley, CA, USA, 1979. [Google Scholar] [CrossRef]
- Oran, E.S.; Chamberlain, G.; Pekalski, A. Mechanisms and occurrence of detonations in vapor cloud explosions. Prog. Energy Combust. Sci. 2020, 77, 10084. [Google Scholar] [CrossRef]
- Silambarasan, M.; Sanjay, S.K.; Rajneesh, K. Review of the parameters of obstacles affecting deflagration to detonation transition (DDT) for pulse detonation engine application. In Proceedings of the AIP Conference Proceedings, Jamshedpur, India, 29–30 August 2020. [Google Scholar] [CrossRef]
- Nguyen, V.B.; Li, J.M.; Chang, P.H.; Teo, C.J.; Khoo, B.C. Effect of ethylene fuel/air equivalence ratio on the dynamics of deflagration-to-detonation transition and detonation propagation process. Combust. Sci. Technol. 2018, 190, 1630–1658. [Google Scholar] [CrossRef]
- Emami, S.; Mazaheri, K.; Shamooni, A.; Mahmoudi, Y. Numerical simulation of flame acceleration, and fast deflagrations using artificial thickening flame approach. In Proceedings of the 25th International Colloquium on the Dynamics of Explosions and Reactive Systems (ICDERS), Leeds, UK, 2–7 August 2015; University of Leeds: Leeds, UK, 2015. [Google Scholar]
- Emami, S.; Mazaheri, K.; Shamooni, A.; Mahmoudi, Y. LES of flame acceleration and DDT in hydrogen–air mixture using artificially thickened flame approach and detailed chemical kinetics. Int. J. Hydrogen Energy 2015, 40, 7395–7408. [Google Scholar] [CrossRef]
- Saeid, M.H.S.; Khadem, J.; Emami, S. Mechanisms governing the deflagration to detonation transition in inhomogeneous mixtures of H2-air; A study on the effect of blockage ratio. Fuel Combust. 2021, 14, 21–39. [Google Scholar] [CrossRef]
- Shamsadin Saeid, M.H.; Ghodrat, M. Numerical Simulation of the Influence of Hydrogen Concentration on Detonation Diffraction Mechanism. Energies 2022, 15, 8726. [Google Scholar] [CrossRef]
- Dorofeev, S.; Kuznetsov, M.S.; Alekseev, V.; Efimenko, A.; Breitung, W. Evaluation of limits for effective flame acceleration in hydrogen mixtures. J. Loss Prev. Process Ind. 2001, 14, 583–589. [Google Scholar] [CrossRef]
- Gaathaug, A.V. Experimental Study of Deflagration to Detonation Transition in Hydrogen-Air Mixtures. Doctoral Dissertation, Telemark University College, Porsgrund, Norway, 2015. [Google Scholar]
- Smirnov, N.; Nikitin, V.; Mikhalchenko, E.; Stamov, L. Modeling a Combustion Chamber of a Pulse Detonation Engine. Fire 2023, 6, 335. [Google Scholar] [CrossRef]
- Ogawa, T.; Gamezo, V.N.; Oran, E.S. Flame acceleration and transition to detonation in an array of square obstacles. J. Loss Prev. Process Ind. 2013, 26, 355–362. [Google Scholar] [CrossRef]
- Breitung, W.; Baumann, W.; Bielert, U.; Burgeth, B.; Dorofeev, S.; Kaup, B.; Kotchourko, A.; Necker, G.; Redlinger, R.; Royl, P.; et al. Innovative Methods for Hydrogen Analysis and Control in Reactor Core-Melt Accidents; Technical Report, FZKA 7085; Forschungszentrum Karlsruhe GmbH: Karlsruhe, Germany, 2005. [Google Scholar]
- Ciccarelli, G.; Dorofeev, S. Flame acceleration and transition to detonation in ducts. Prog. Energy Comb. Sci. 2008, 34, 499–550. [Google Scholar] [CrossRef]
- Porowski, R.; Siatkowski, S. Numerical investigation on the effect of obstacles on DDT in hydrogen-air mixture using Open FOAM. Arch. Combust. 2017, 37, 15–24. [Google Scholar]
- Pinos, T.; Ciccarelli, G. Combustion wave propagation through a bank of cross-flow cylinders. Combust. Flame 2015, 162, 3254–3262. [Google Scholar] [CrossRef]
- Xiao, H.; Oran, E.S. Shock focusing and detonation initiation at a flame front. Combust. Flame 2019, 203, 397–406. [Google Scholar] [CrossRef]
- Xiao, H.; Oran, E.S. Flame acceleration and deflagration-to detonation transition in hydrogen-air mixture in a channel with an array of obstacles of different shapes. Combust. Flame 2020, 220, 378–393. [Google Scholar] [CrossRef]
- Han, S.; Yu, M.; Yang, X.; Wang, X. Effects of obstacle position and hydrogen volume fraction on premixed syngas-air flame acceleration. Int. J. Hydrogen Energy 2020, 45, 29518–29532. [Google Scholar] [CrossRef]
- Baiwei, L.; Zekai, G.; Zeping, W.; Bing, W. Numerical Simulation Study of Deflagration-to-Detonation Transition in Hydrogen-Air Premixed Gas within a Pipeline with Obstacles. Available online: https://ssrn.com/abstract=4590798 (accessed on 3 October 2023).
- NEA Group of Experts. State-of-the-Art Report on Containment Thermal-Hydraulics and Hydrogen Distribution; OECD Publishing: Paris, France, 1999. [Google Scholar]
- Ishii, K.; Kojima, M. Behavior of detonation propagation in mixtures with concentration gradients. Shock Waves 2007, 17, 95–102. [Google Scholar] [CrossRef]
- Bleyer, J.; Taveau, J.; Chaumeix, N.; Paillard, C.; Bentaib, A. Comparison between FLACS explosion simulations and experiments conducted in a PWR Steam Generator casemate scale down with hydrogen gradients. Nucl. Eng. Des. 2012, 245, 189–196. [Google Scholar] [CrossRef]
- Song, Q.; Han, Y.; Cao, W. Numerical investigation of self-sustaining modes of 2D planar detonations under concentration gradients in hydrogen-oxygen mixtures. Int. J. Hydrogen Energy 2020, 45, 29606–29615. [Google Scholar] [CrossRef]
- Saeid, M.H.S.; Khadem, J.; Emami, S. Numerical investigation of the mechanism behind the deflagration to detonation transition in homogeneous and inhomogeneous mixtures of H2-air in an obstructed channel. Int. J. Hydrogen Energy 2021, 46, 21657–21671. [Google Scholar] [CrossRef]
- Luan, Z.; Huang, Y.; Gao, S.; You, Y. Formation of multiple detonation waves in rotating detonation engines with inhomogeneous methane/oxygen mixtures under different equivalence ratios. Combust. Flame 2022, 241, 112091. [Google Scholar] [CrossRef]
- Jiang, C.; Pan, J.; Zhu, Y.; Li, J.; Chen, H.; Quaye, E.K. Influence of concentration gradient on detonation re-initiation in a bifurcated channel. Fuel 2022, 307, 121895. [Google Scholar] [CrossRef]
- Saeid, M.H.S.; Khadem, J.; Emami, S.; Ghodrat, M. Effect of diffusion time on the mechanism of deflagration to detonation transition in an inhomogeneous mixture of hydrogen-air. Int. J. Hydrogen Energy 2022, 47, 23411–23426. [Google Scholar] [CrossRef]
- O’Conaire, M.; Curran, H.J.; Simmie, J.M. A comprehensive modeling study of hydrogen oxidation. Int. J. Chem. Kinet. 2004, 36, 603–622. [Google Scholar] [CrossRef]
- Liu, Y.; Yang, X.; Fu, Z.; Chen, P. Numerical simulation of flame acceleration and DDT (deflagration to detonation transition) in hydrogen-air mixtures with concentration gradients. Energy Sources Part A Recover. Util. Environ. Eff. 2021, 1–17, Latest Articles. [Google Scholar] [CrossRef]
- Ettner, F.; Sattelmayer, T. ddtFoam. 2014. Available online: https://sourceforge.net/projects/ddtfoam (accessed on 20 May 2014).
- Ettner, F. Effiziente Numerische Simulation des Deflagrations-Detonations-Ubergangs. Ph.D. Thesis, Technical University of Munich, Munich, Germany, 2013. (In German). [Google Scholar]
- Goodwin, D.G.; Moffat, H.; Speth, R.L. Cantera: An Object-oriented Software Toolkit for Chemical Kinetics, Thermodynamics, and Transport Processes 2016. Available online: http://code.google.com/p/cantera (accessed on 26 January 2016).
- Anderson, J.D. Modern Compressible Flow; McGraw-Hill: New York, NY, USA, 2004. [Google Scholar]
- Ettner, F.; Vollmer, K.G.; Sattelmayer, T. Numerical Simulation of the Deflagration-to-Detonation Transition in Inhomogeneous Mixtures. J. Combust. 2014, 2014, 686347. [Google Scholar] [CrossRef]
- Boeck, L.R.; Hasslberger, J.; Ettner, F.; Sattelmayer, T. Investigation of peak pressures during explosive combustion of inhomogeneous hydrogen-air mixtures. In Proceedings of the 7th International Fire and Explosion Hazards Seminar, Providence, RI, USA, 5–10 May 2013. [Google Scholar] [CrossRef]
- Karanam, A.; Ganju, S.; Chattopadhyay, J. Time scale analysis, numerical simulation and validation of flame acceleration, and DDT in hydrogen air mixtures. Combust. Sci. Technol. 2021, 193, 2217–2240. [Google Scholar] [CrossRef]
- Boeck, L.R.; Katzy, P.; Hasslberger, J.; Kink, A.; Sattelmayer, T. The GraVent DDT database. Shock Waves 2016, 26, 683–685. [Google Scholar] [CrossRef]
- Karanam, A.; Sharma, P.K.; Ganju, S. Numerical simulation and validation of flame acceleration and DDT in hydrogen air mixtures. Int. J. Hydrogen Energy 2018, 43, 17492–17504. [Google Scholar] [CrossRef]
- Boeck, L.R.; Hasslberger, J.; Sattelmayer, T. Flame acceleration in hydrogen/air mixtures with concentration gradients. Combust. Sci. Technol. 2014, 186, 1650–1661. [Google Scholar] [CrossRef]
- Wang, J.; Zhao, X.; Gao, L.; Wang, X.; Zhu, Y. Effect of solid obstacle distribution on flame acceleration and DDT in obstructed channels filled with hydrogen-air mixture. Int. J. Hydrogen Energy 2022, 26, 12759–12770. [Google Scholar] [CrossRef]
- Wang, j.; Zhao, X.; Fan, L.; Pan, J.; Zhu, Y. Effects of the quantity and arrangement of reactive jet obstacles on flame acceleration and transition to detonation: A numerical study. Aerosp. Sci. Technol. 2023, 137, 108269. [Google Scholar] [CrossRef]
- Gaathaug, A.V.; Vaagsaether, K.; Bjerketvedt, D. Experimental and Numerical Investigation of DDT in Hydrogen-Air Behind a Single Obstacle. Int. J. Hydrogen Energy 2012, 37, 17606–17615. [Google Scholar] [CrossRef]
- Zhao, W.; Liang, J.; Cai, X.; Deiterding, R.; Wang, X. Effect of Mach number on the flame acceleration and deflagration-to-detonation transition. In Proceedings of the 28th ICDERS, Napoli, Italy, 19–24 June 2022. [Google Scholar]
Disclaimer/Publisher’s Note: The statements, opinions and data contained in all publications are solely those of the individual author(s) and contributor(s) and not of MDPI and/or the editor(s). MDPI and/or the editor(s) disclaim responsibility for any injury to people or property resulting from any ideas, methods, instructions or products referred to in the content. |
© 2023 by the authors. Licensee MDPI, Basel, Switzerland. This article is an open access article distributed under the terms and conditions of the Creative Commons Attribution (CC BY) license (https://creativecommons.org/licenses/by/4.0/).

