Article

Shock Tube Study of Ignition Delay Times for Hydrogen–Oxygen Mixtures

Institute of Mechanics, Lomonosov Moscow State University, 119992 Moscow, Russia
*
Author to whom correspondence should be addressed.
Fire 2023, 6(11), 435; https://doi.org/10.3390/fire6110435
Submission received: 29 September 2023 / Revised: 26 October 2023 / Accepted: 9 November 2023 / Published: 11 November 2023
(This article belongs to the Special Issue State-of-the-Art on Hydrogen Combustion)

Abstract

:
This paper presents the results of measurements of ignition delay times in hydrogen–oxygen mixtures highly diluted with argon. The experiments were carried out behind an incident shock wave at temperatures from 870 to 2500 K, pressures from 0.5 to 1.5 atm, and equivalence ratios from 0.1 to 2.0. The results obtained were processed in terms of the partial pressure of the combustible mixture stoichiometric part that is consumed in the combustion process. An almost linear dependence of the ignition delay time on the reciprocal value of the partial pressure was found for both rich and lean mixtures. The measured data are compared with calculations based on the previously developed kinetic model and experimental data from other authors.

1. Introduction

Hydrogen plays an important role among gaseous fuels and is the most efficient and pollution-free type of fuel [1]. Hydrogen power engineering is currently considered one of the most promising industries, including road transport, aviation, and various domestic energy needs [2]. On the other hand, the chemistry of hydrogen combustion is an integral part of various kinetic mechanisms of hydrocarbon combustion at all stages of the oxidation process, which makes it the subject of further research [3].
Despite the large number of works previously performed by various authors, studies on the combustion of hydrogen and its mixtures with other types of fuel are currently continued. In particular, numerical analysis of various scenarios of the ignition in the intermediate temperature region and their influence on the induction time is given by Kiverin et al. [4]. Explosive characteristics of inhomogeneous hydrogen–air mixtures with turbulent mixing were analyzed in experiments on measuring ignition delay times at various equivalence factors [5]. Lyu et al. [6] evaluated the effectiveness of the pressure ratio equivalent method in experiments that analyze hydrogen leakage ignition applied to the problem of hydrogen storage and transportation. Böttler et al. [7] developed a novel model based on the flamelet approach, which was used to study the ignition of premixed H2/Air mixtures under stoichiometric conditions. Villenave et al. [8] presented the results of an experimental study of the lean H2/Air mixture ignition in a rapid compression machine at low temperatures and high pressures, which are essential under conditions of fuel combustion in an internal combustion engine. In connection with the ongoing work on the creation of a pulse detonation engine, studies are carried out to determine the characteristics of supersonic hydrogen–air flows in the combustion chamber of such engines [9].
The ignition delay time is the essential parameter that describes the combustion process. This parameter in the high-temperature range (T ≥ 1000 K) is measured in experiments on shock tubes [10]. It should be noted that the bulk of research to determine the ignition delay time was carried out on shock tubes in the regime behind the reflected shock wave [11,12,13,14,15,16]. The determination of this characteristic of the ignition process for a hydrogen–oxygen mixture in experiments behind the incident shock wave was carried out by Pavlov and Shatalov [17]. In this work, a series of additional measurements were carried out, which makes it possible to expand the existing database of experimental data and to improve process understanding.

2. Experimental Procedure

The experimental study of the ignition process in the H2/O2 mixture diluted with Ar was carried out on a single-diaphragm shock tube with an internal diameter of 57 mm. The facility diagram and the pumping and filling systems for tube sections, as well as the corresponding measuring equipment, are shown in Figure 1. The driver section of the facility with a length of 1 m is filled with He. The driven section is filled with a combustible mixture and is separated from the driver section by a copper diaphragm with calibrated notches and has a length of 4.5 m. The diaphragm rupture initiates the formation of a shock wave that propagates along the driven section and heats the combustible mixture to the ignition temperature. The component composition of the initial mixture was determined using the partial pressure method. The gas dynamic parameters of the flow behind the incident shock wave front were estimated using the GASEQ program [18].
The determination of the shock wave velocity VSW, and the gas pressure p profile behind the shock wave was carried out using piezoelectric sensors located along the surface of the driven section. The resonance frequency for piezoelectric sensors is more than 500 kHz. The moment of arrival of the shock wave in measuring section A was also recorded by the pressure sensor. The mixture ignition was recorded by the optical system consisting of the spectrograph, the PMT-100 photomultiplier, and the Agilent 54624A oscilloscope.
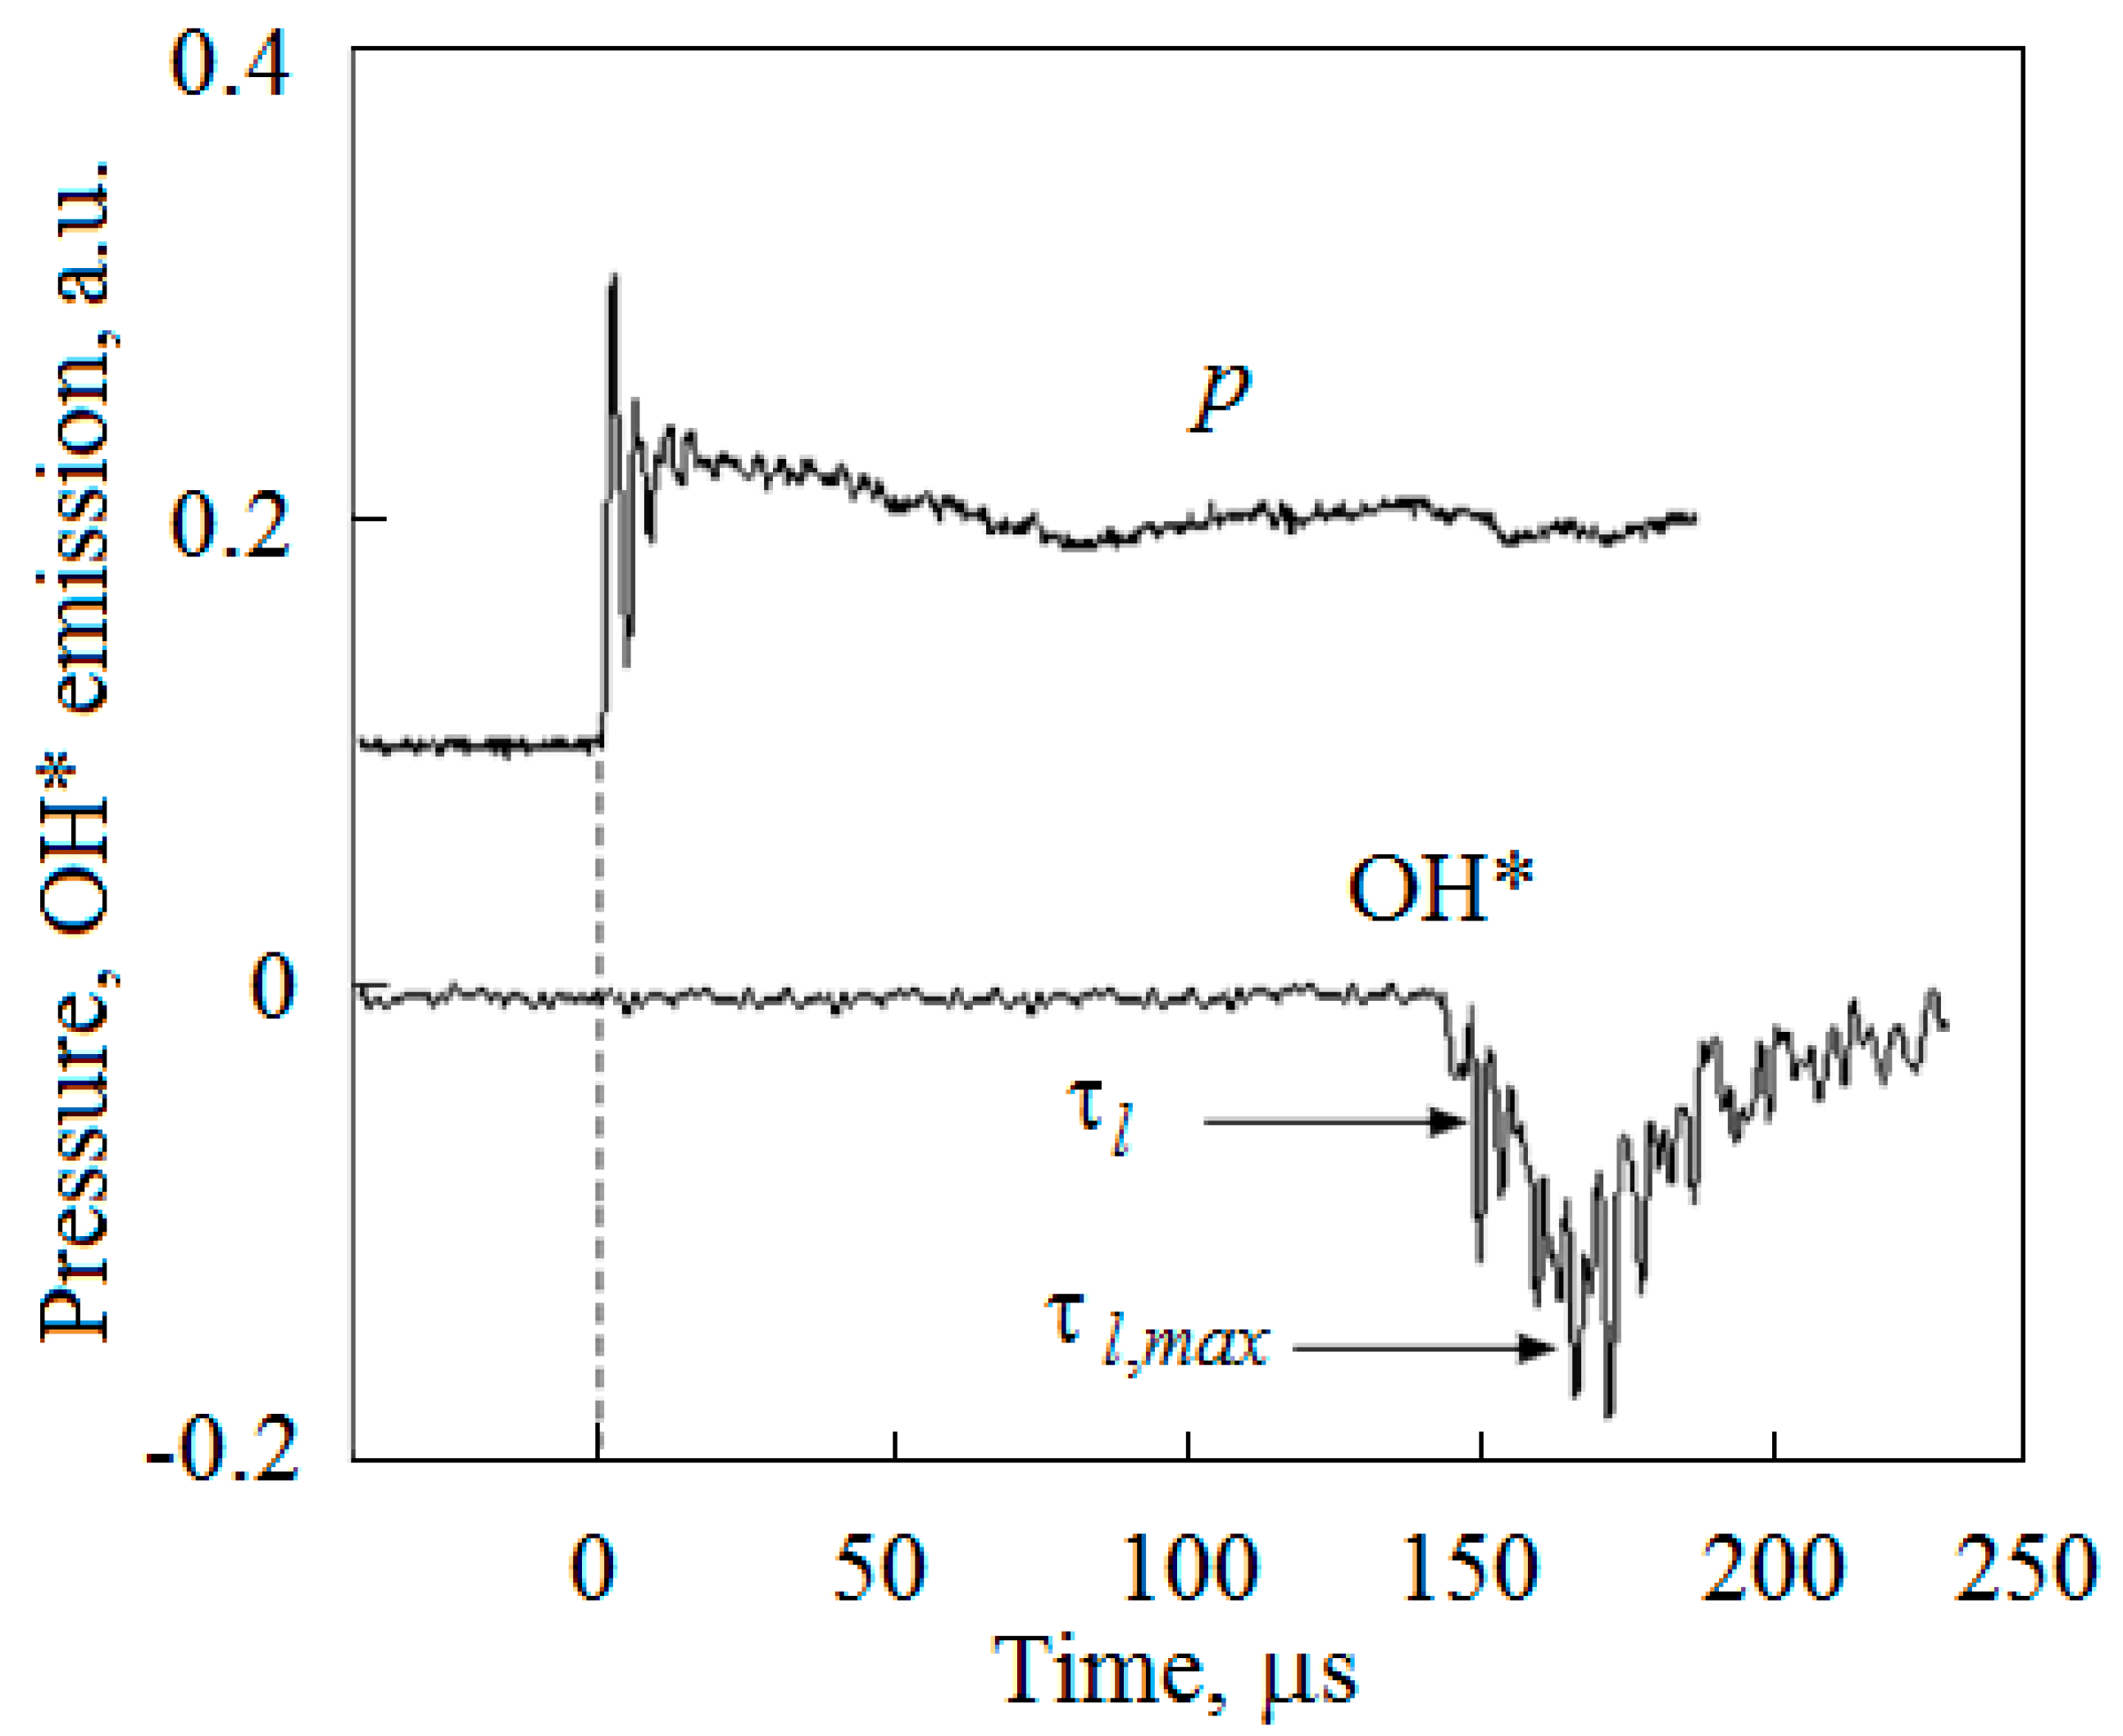
Figure 2 shows a typical oscillogram of signals from the piezoelectric sensor located in measuring section A and the optical system. The optical system records the emission of an electronically excited OH* radical, which is generated at the wavelength λ = 306.8 nm as a result of the A2Σ+ → X2Π transition. These data were obtained for the ignition of a stoichiometric mixture diluted with argon (Ar = 95%) at the shock wave velocity VWS = 1.04 km/s, gas temperature T = 1176 K, and pressure p = 0.74 atm behind the shock wave. It can be seen that the emission starts in τl = 150 µs after the registration of the pressure jump, and the maximum level is reached after τl,max = 170 µs.
The optical system in experiments on the combustible mixture ignition behind an incident shock does not follow the evolution of chemical processes in any one physically infinitesimal volume of gas but registers changes in state in various volumes moving with the gas flow [19]. Therefore, the value of τl presents the laboratory ignition delay time. To obtain the real ignition delay time τ, the laboratory ignition delay time must be multiplied by the ratio of gas densities after and before the wavefront. The ignition delay time τ afterward was determined by the value τl, max, i.e., by the moment when the emission intensity of the OH* radical reaches the maximum level. This was accepted due to the fact that the computer program used in further calculations fixes precisely this parameter that characterizes the ignition of the mixture.

3. Numerical Modeling

The numerical modeling of the H2/O2/Ar mixture ignition was carried out using the detailed kinetic model proposed in Ref. [20]. The model is based on an analysis of the available information on the rate constants of elementary reactions as applied to the combustion of hydrogen–oxygen mixtures [21,22,23,24,25,26]. The rate constants of reverse reactions as well as thermal effects were calculated using the well-known database of thermodynamic data [27]. Calculations were carried out using the CHEMKIN software package [28] under conditions of an adiabatic process at constant pressure.
The use of the emission of OH* radicals to determine the ignition delay time τ is explained by the fact that they are formed at an early stage of the ignition process. Since these radicals are absent in the kinetic model used for calculations, the ignition delay time was taken to be the time when the product of the concentrations of O and H atoms reaches its maximum value. As shown by Hall and Petersen [29], O and H atoms are the main components leading to the formation of the OH* radical.

4. Results and Discussion

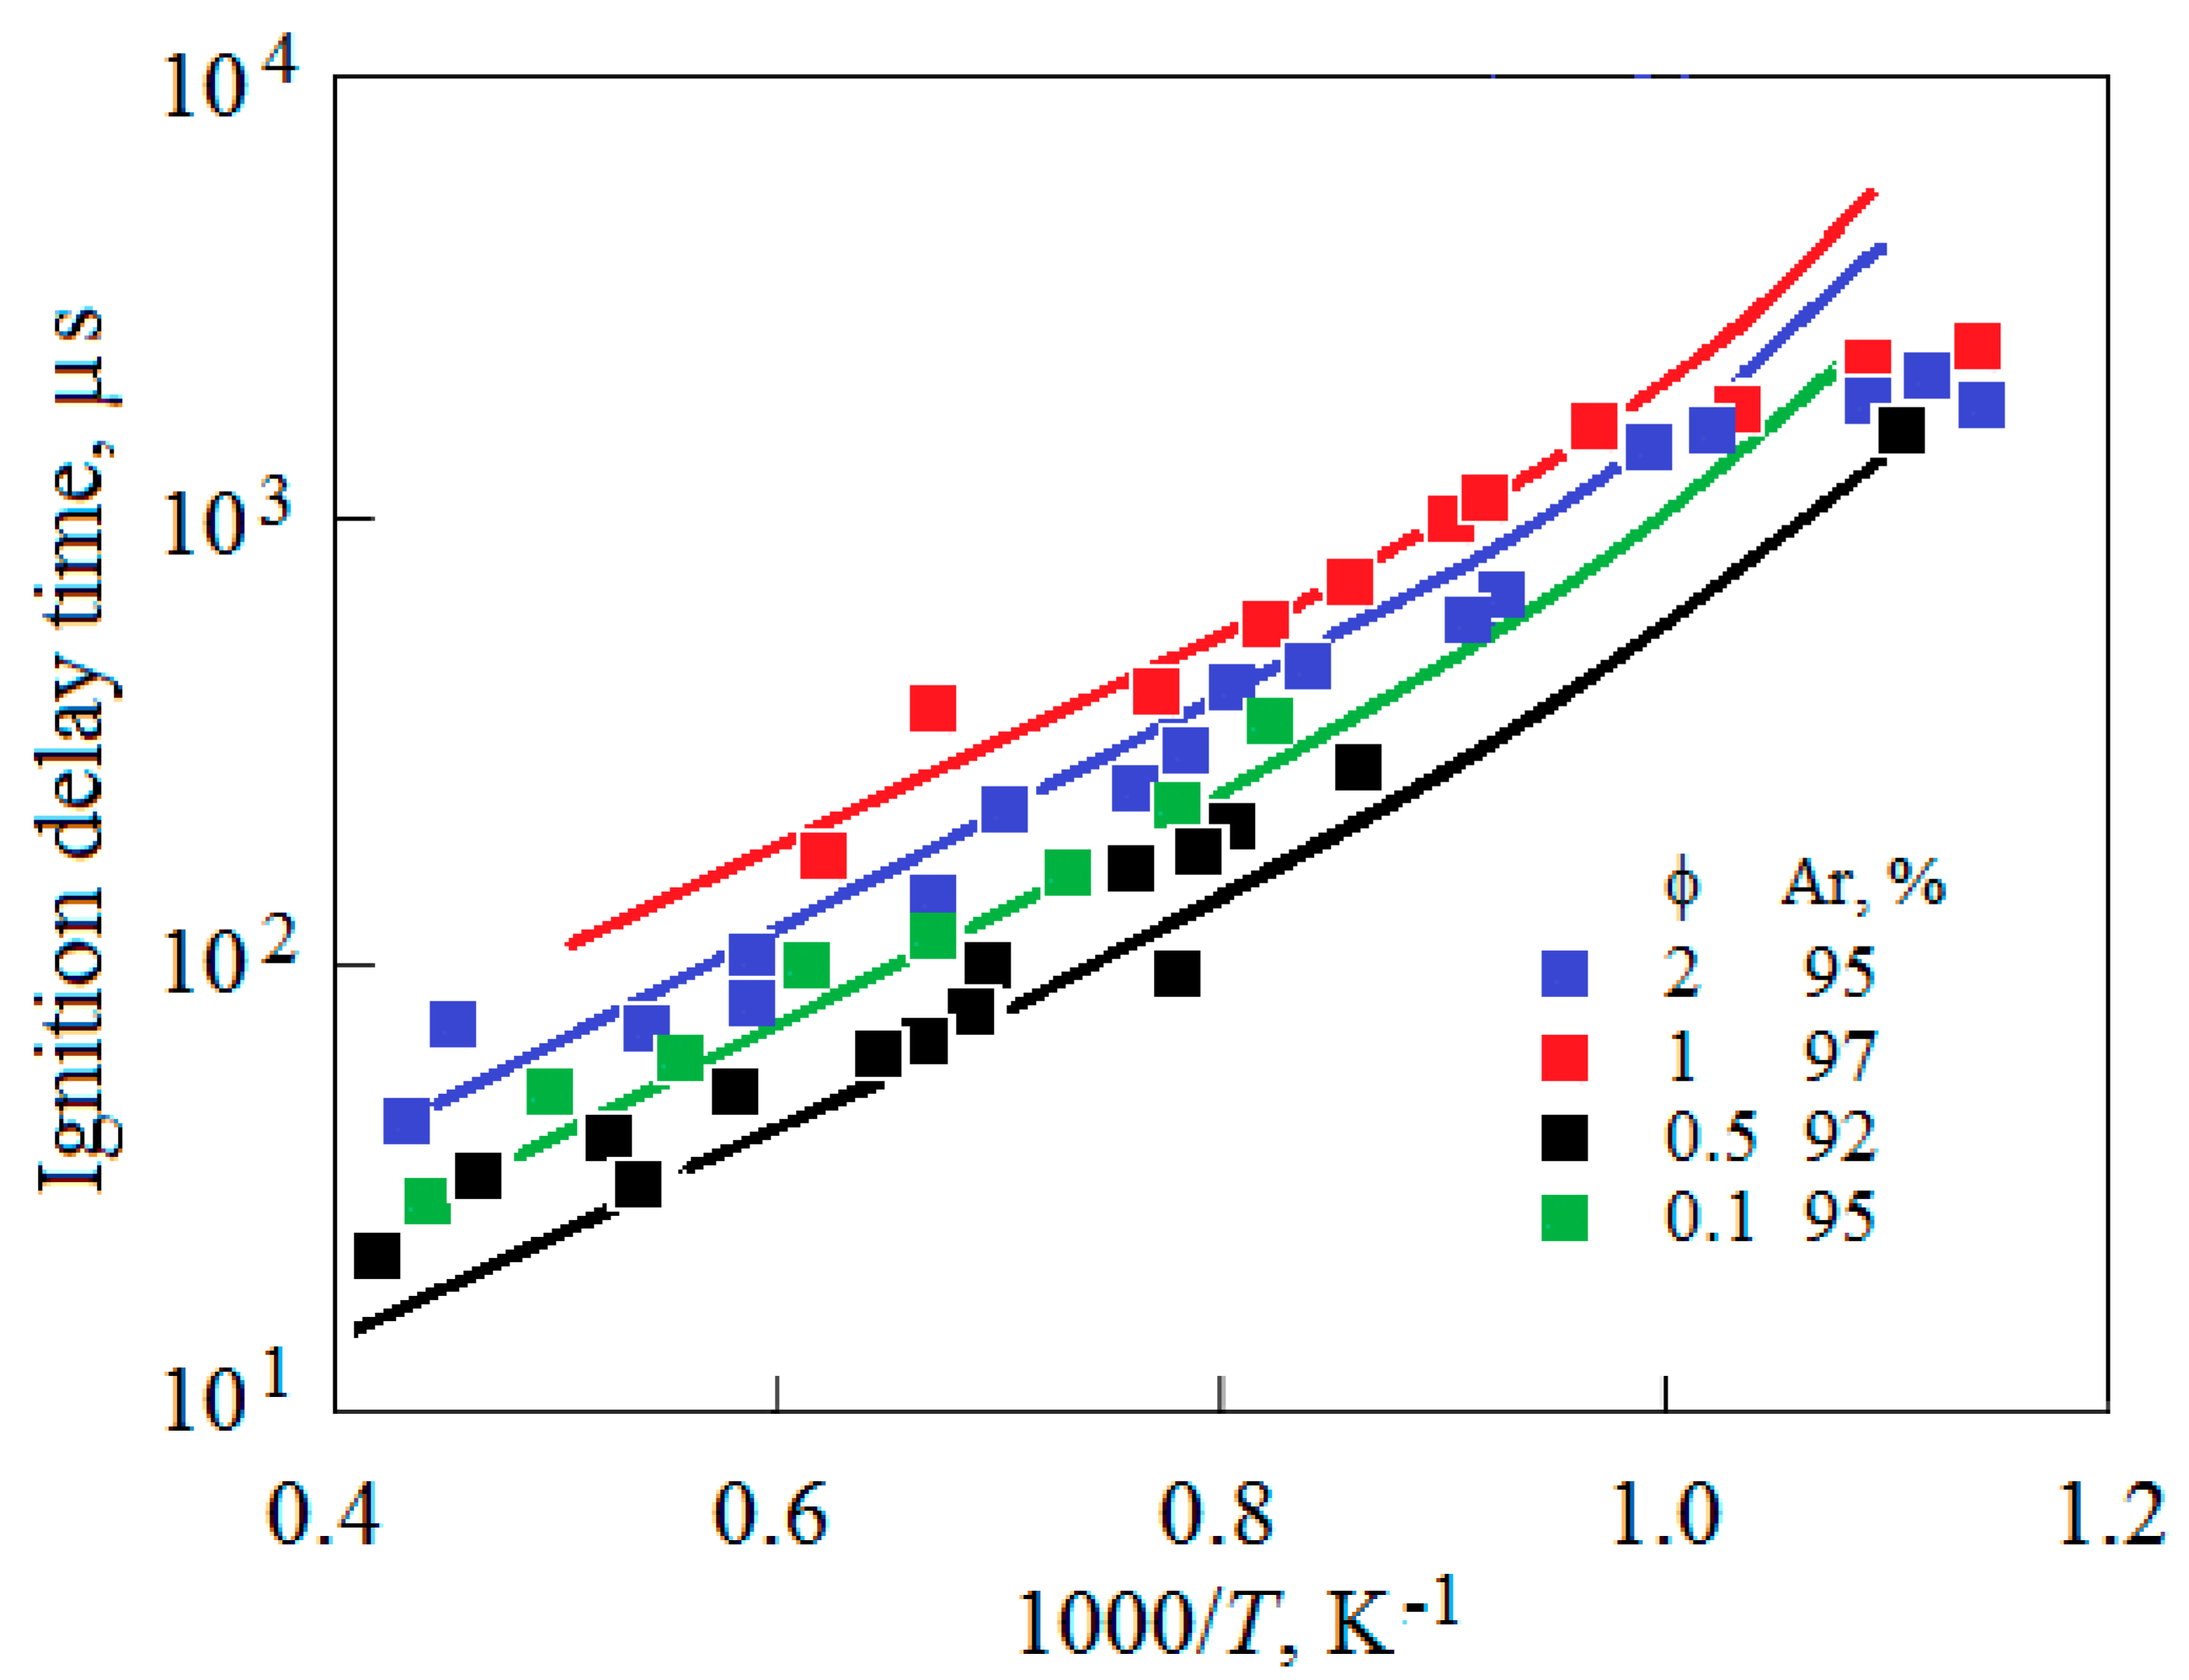
The ignition delay times τ were measured behind the front of the incident shock wave at gas temperatures T = 870 ÷ 2500 K and pressures p = 0.5 ÷ 1.5 atm. The degree of the hydrogen–oxygen mixture dilution with argon varied from 89 to 97%. The equivalence ratio ϕ varied from 0.1 (fuel-lean mixture) to 2.0 (fuel-rich mixture). Some measurement results are shown in Figure 3. Experimental data were obtained at pressures behind the shock wave of the order of 1 atm. The lines show the results of numerical simulations under the corresponding experimental conditions.
An analysis of Figure 3 shows that the value of τ at temperatures T > 1000 K does not greatly depend on the equivalent ratio ϕ. In particular, experimental points with Ar = 95% and ϕ = 2 (blue squares) are located in close proximity to experimental points with ϕ = 0.1 (green squares). In other words, both fuel-rich and fuel-lean mixtures have approximately the same dependences τ = τ(T) at the same argon content in the mixture. Contrariwise, the value of τ increases greatly with increasing argon concentration. This is illustrated by the experimental points obtained at Ar = 92% (black squares) and Ar = 97% (red squares), which differ in absolute value by approximately half an order of magnitude. The numerical simulation of the ignition process reproduces the behavior of experimental points quite well.
The calculated curves τ = τ(T) upon transition to the low-temperature range (T < 1000 K) cease to correctly describe the experimentally measured values of τ, as can be seen in Figure 3. Volumetric self-ignition of the mixture in this temperature range can be considered as its rapid local heating in the turbulent boundary layer behind the shock wave with the formation of a flame and its propagation inside the shock tube. The time of the deflagration process in this case can be taken as the induction time. As estimates show, this time increases with decreasing temperature much more slowly than the self-ignition time and better describes experimental data in the low-temperature range [30]. A detailed study of this process was carried out in Ref. [31].
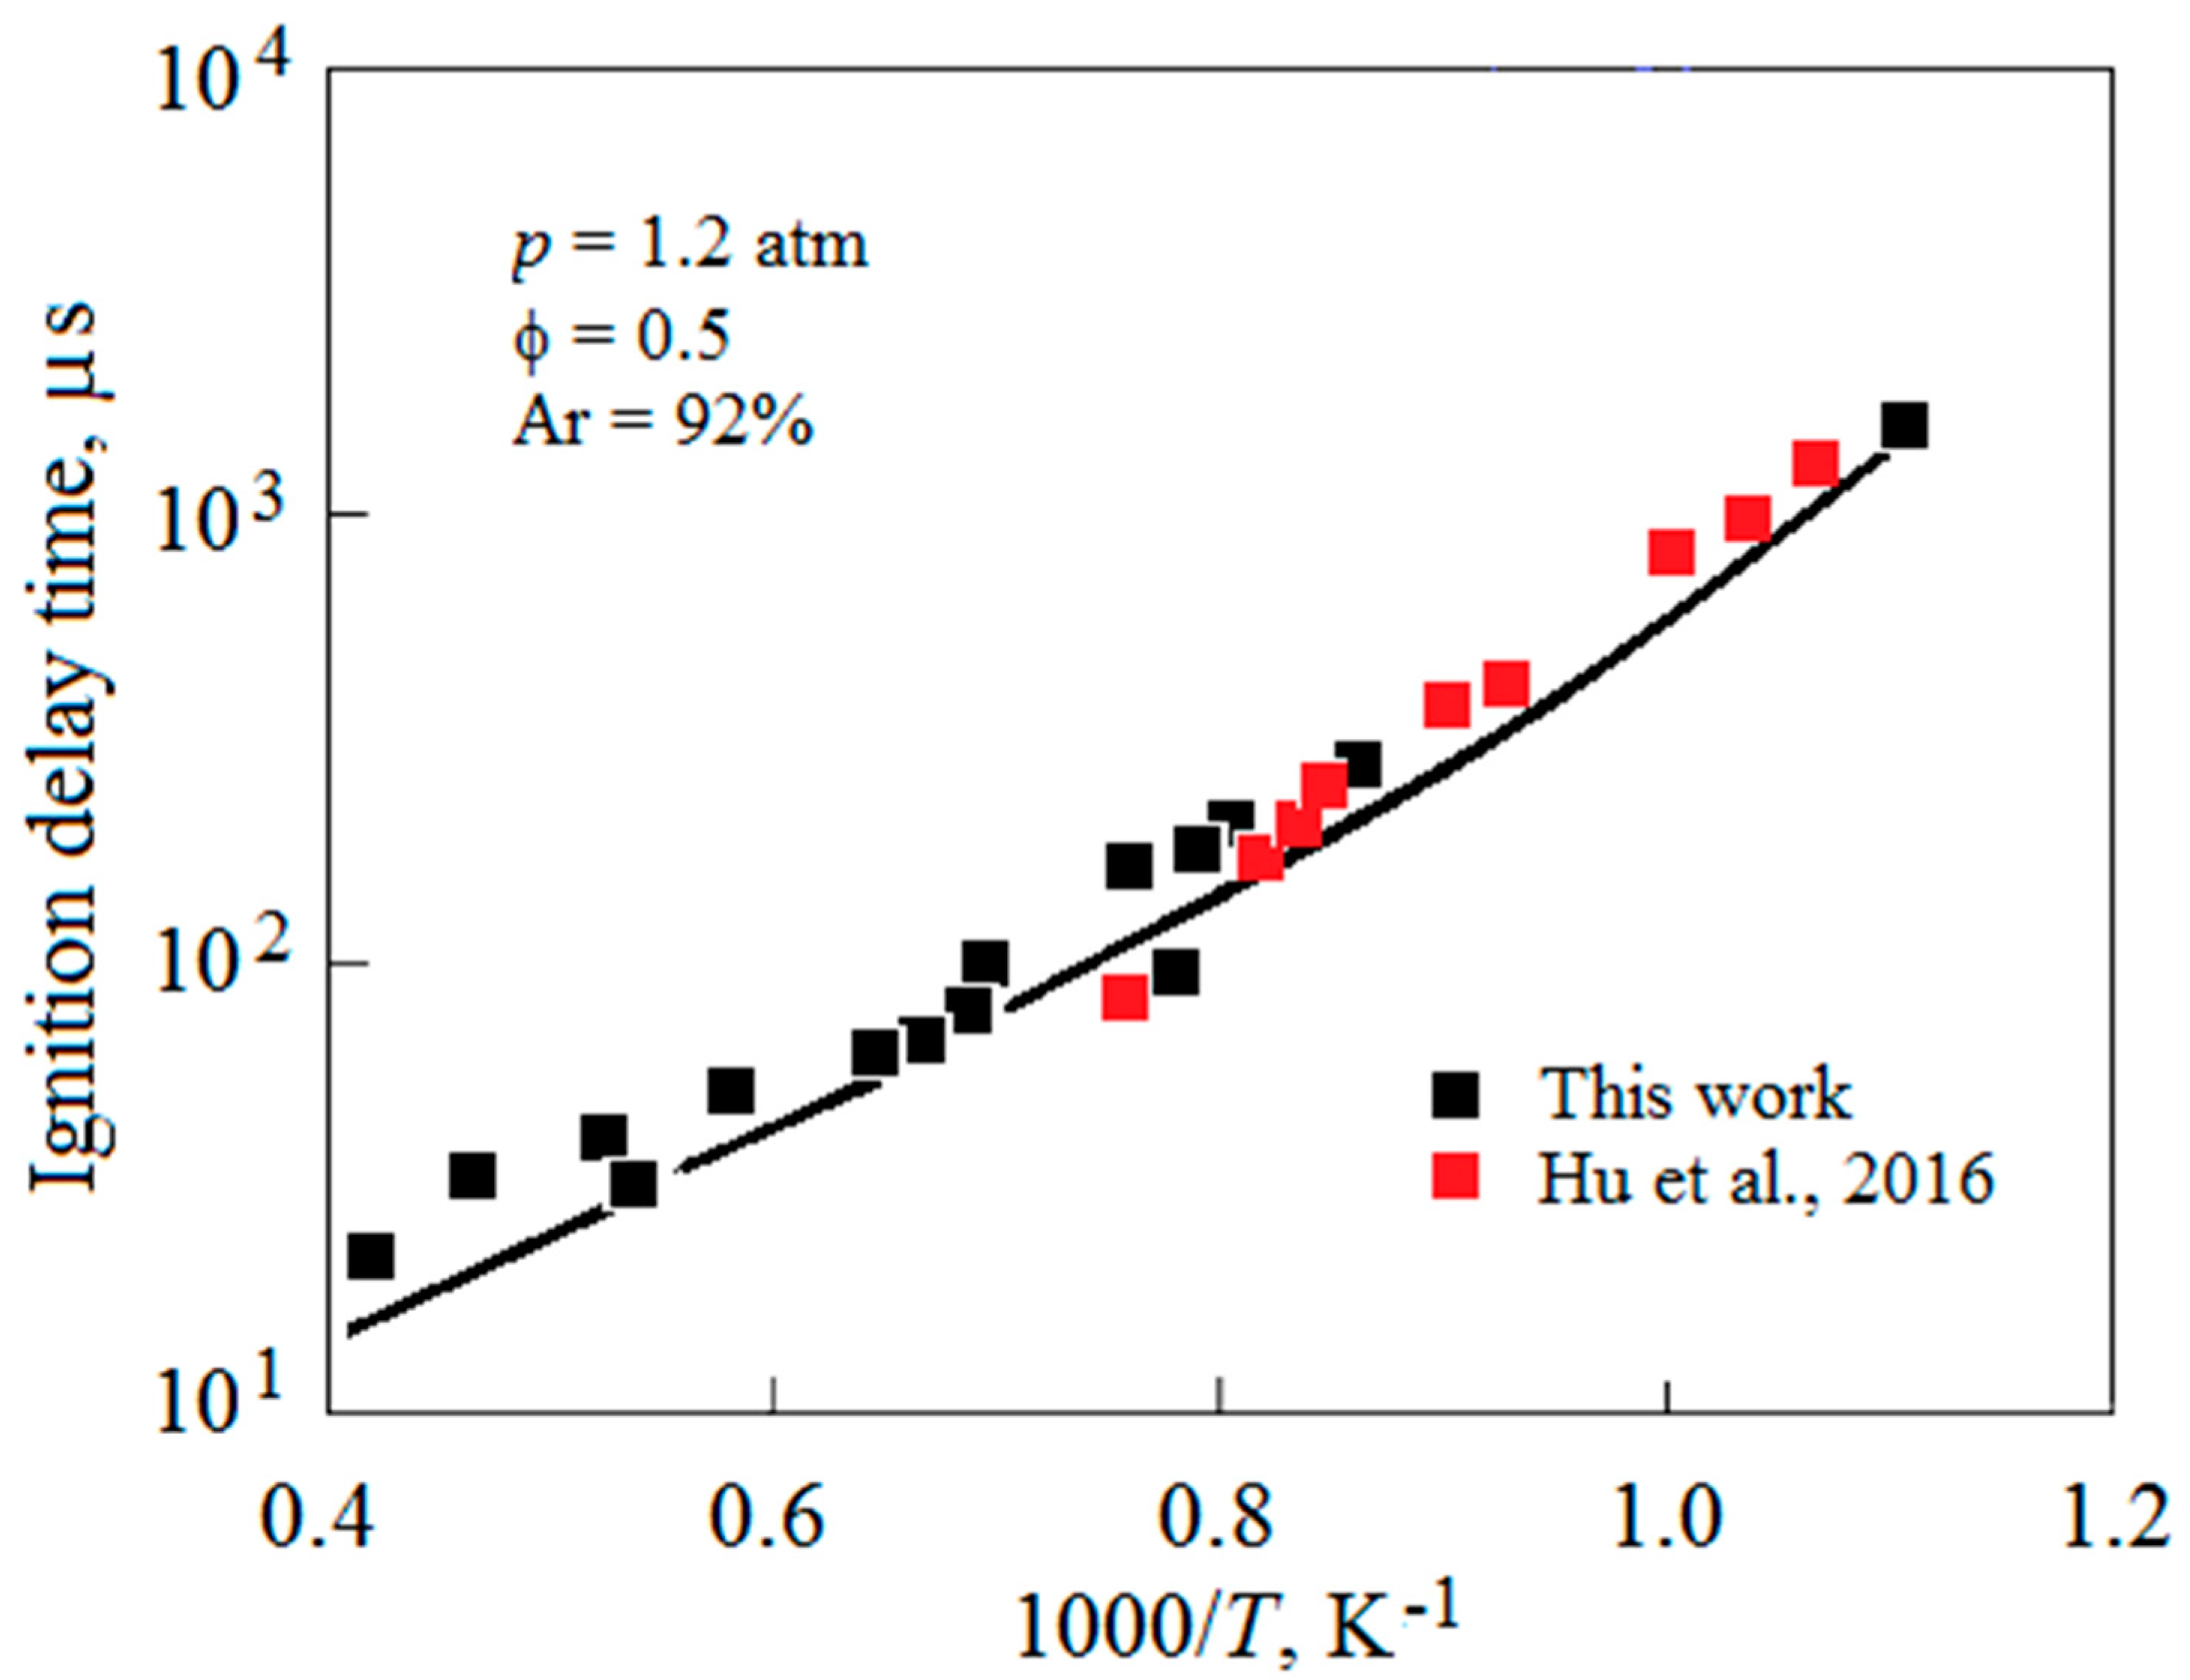
A comparison of the results of measuring the ignition delay time τ obtained in this work with the experimental data of other authors is shown in Figure 4 and Figure 5, where the lines represent the results of a numerical simulation using the detailed kinetic model proposed in ref. [20]. As can be seen in Figure 4, the data of Hu et al. [15], obtained under the same conditions as the data in this work, agree quite well with each other and with the calculated curve. At a given concentration of argon in the mixture (Ar = 92%), the results of numerical modeling describe the experimental points not only in the high-temperature range but also in the low-temperature range down to a temperature of T = 850 K.
A comparison of the results of this work with the data obtained by Ryu et al. [32] is shown in Figure 5. It is clear that at the same argon content in the mixture (Ar = 95%), the experimental data coincide with each other and with the calculated curve. When the argon concentration increases to 97.5%, an increase in the value of τ is observed. This may be explained by the reduced efficiency of Ar as a third particle in the trimolecular chemical reaction initiating the ignition of a combustible mixture, which is several times lower than the corresponding efficiency of H2 and O2 molecules [20]. The effect of increasing the value of τ with an increasing concentration of Ar in the mixture was also noted in the analysis of the results shown in Figure 3.
The measurement of the ignition delay time τ was carried out in this work at the gas pressure of the order of 1 atm, and in different experiments, it could vary from 0.5 to 1.5 atm. The results of measurements carried out at other pressures show that the value of τ strongly depends on the gas pressure p, and in the high-temperature range, an almost linear dependence of τ on (1/p) is observed for identical mixtures [13]. On the other hand, the value of τ also depends on the mixture composition, including both the equivalence ratio ϕ and the degree of dilution with argon, as can be seen in the analysis of the experimental data shown in Figure 3.
The initial stage of combustion of the H2/O2 mixture diluted with argon can be considered as the ignition of only its stoichiometric part. In this case, excess hydrogen in a fuel-rich mixture or excess oxygen in a fuel-lean mixture will act simultaneously with argon as a neutral diluent. In this regard, it can be assumed that the ignition delay time τ in the high-temperature region depends linearly on the reciprocal value of the partial pressure pS of the stoichiometric part of the combustible mixture. In other words, there must be a dependence: τpS = τpS(T). A comparison of the values of τpS measured in this work for mixtures with the same values of the equivalence ratio ϕ, but with different degrees of dilution with argon and at different pressures, confirms this dependence. To determine the partial pressure pS, it is necessary to isolate the stoichiometric part of the mixture and multiply its mole fraction by the gas pressure p behind the shock wave front. In particular, the mole fraction of the stoichiometric part for a mixture of 4%H2 + 4%O2 + 92% Ar is equal to 0.06. In this case, the value of pS is equal to 0.12 atm at a gas pressure p = 2 atm.
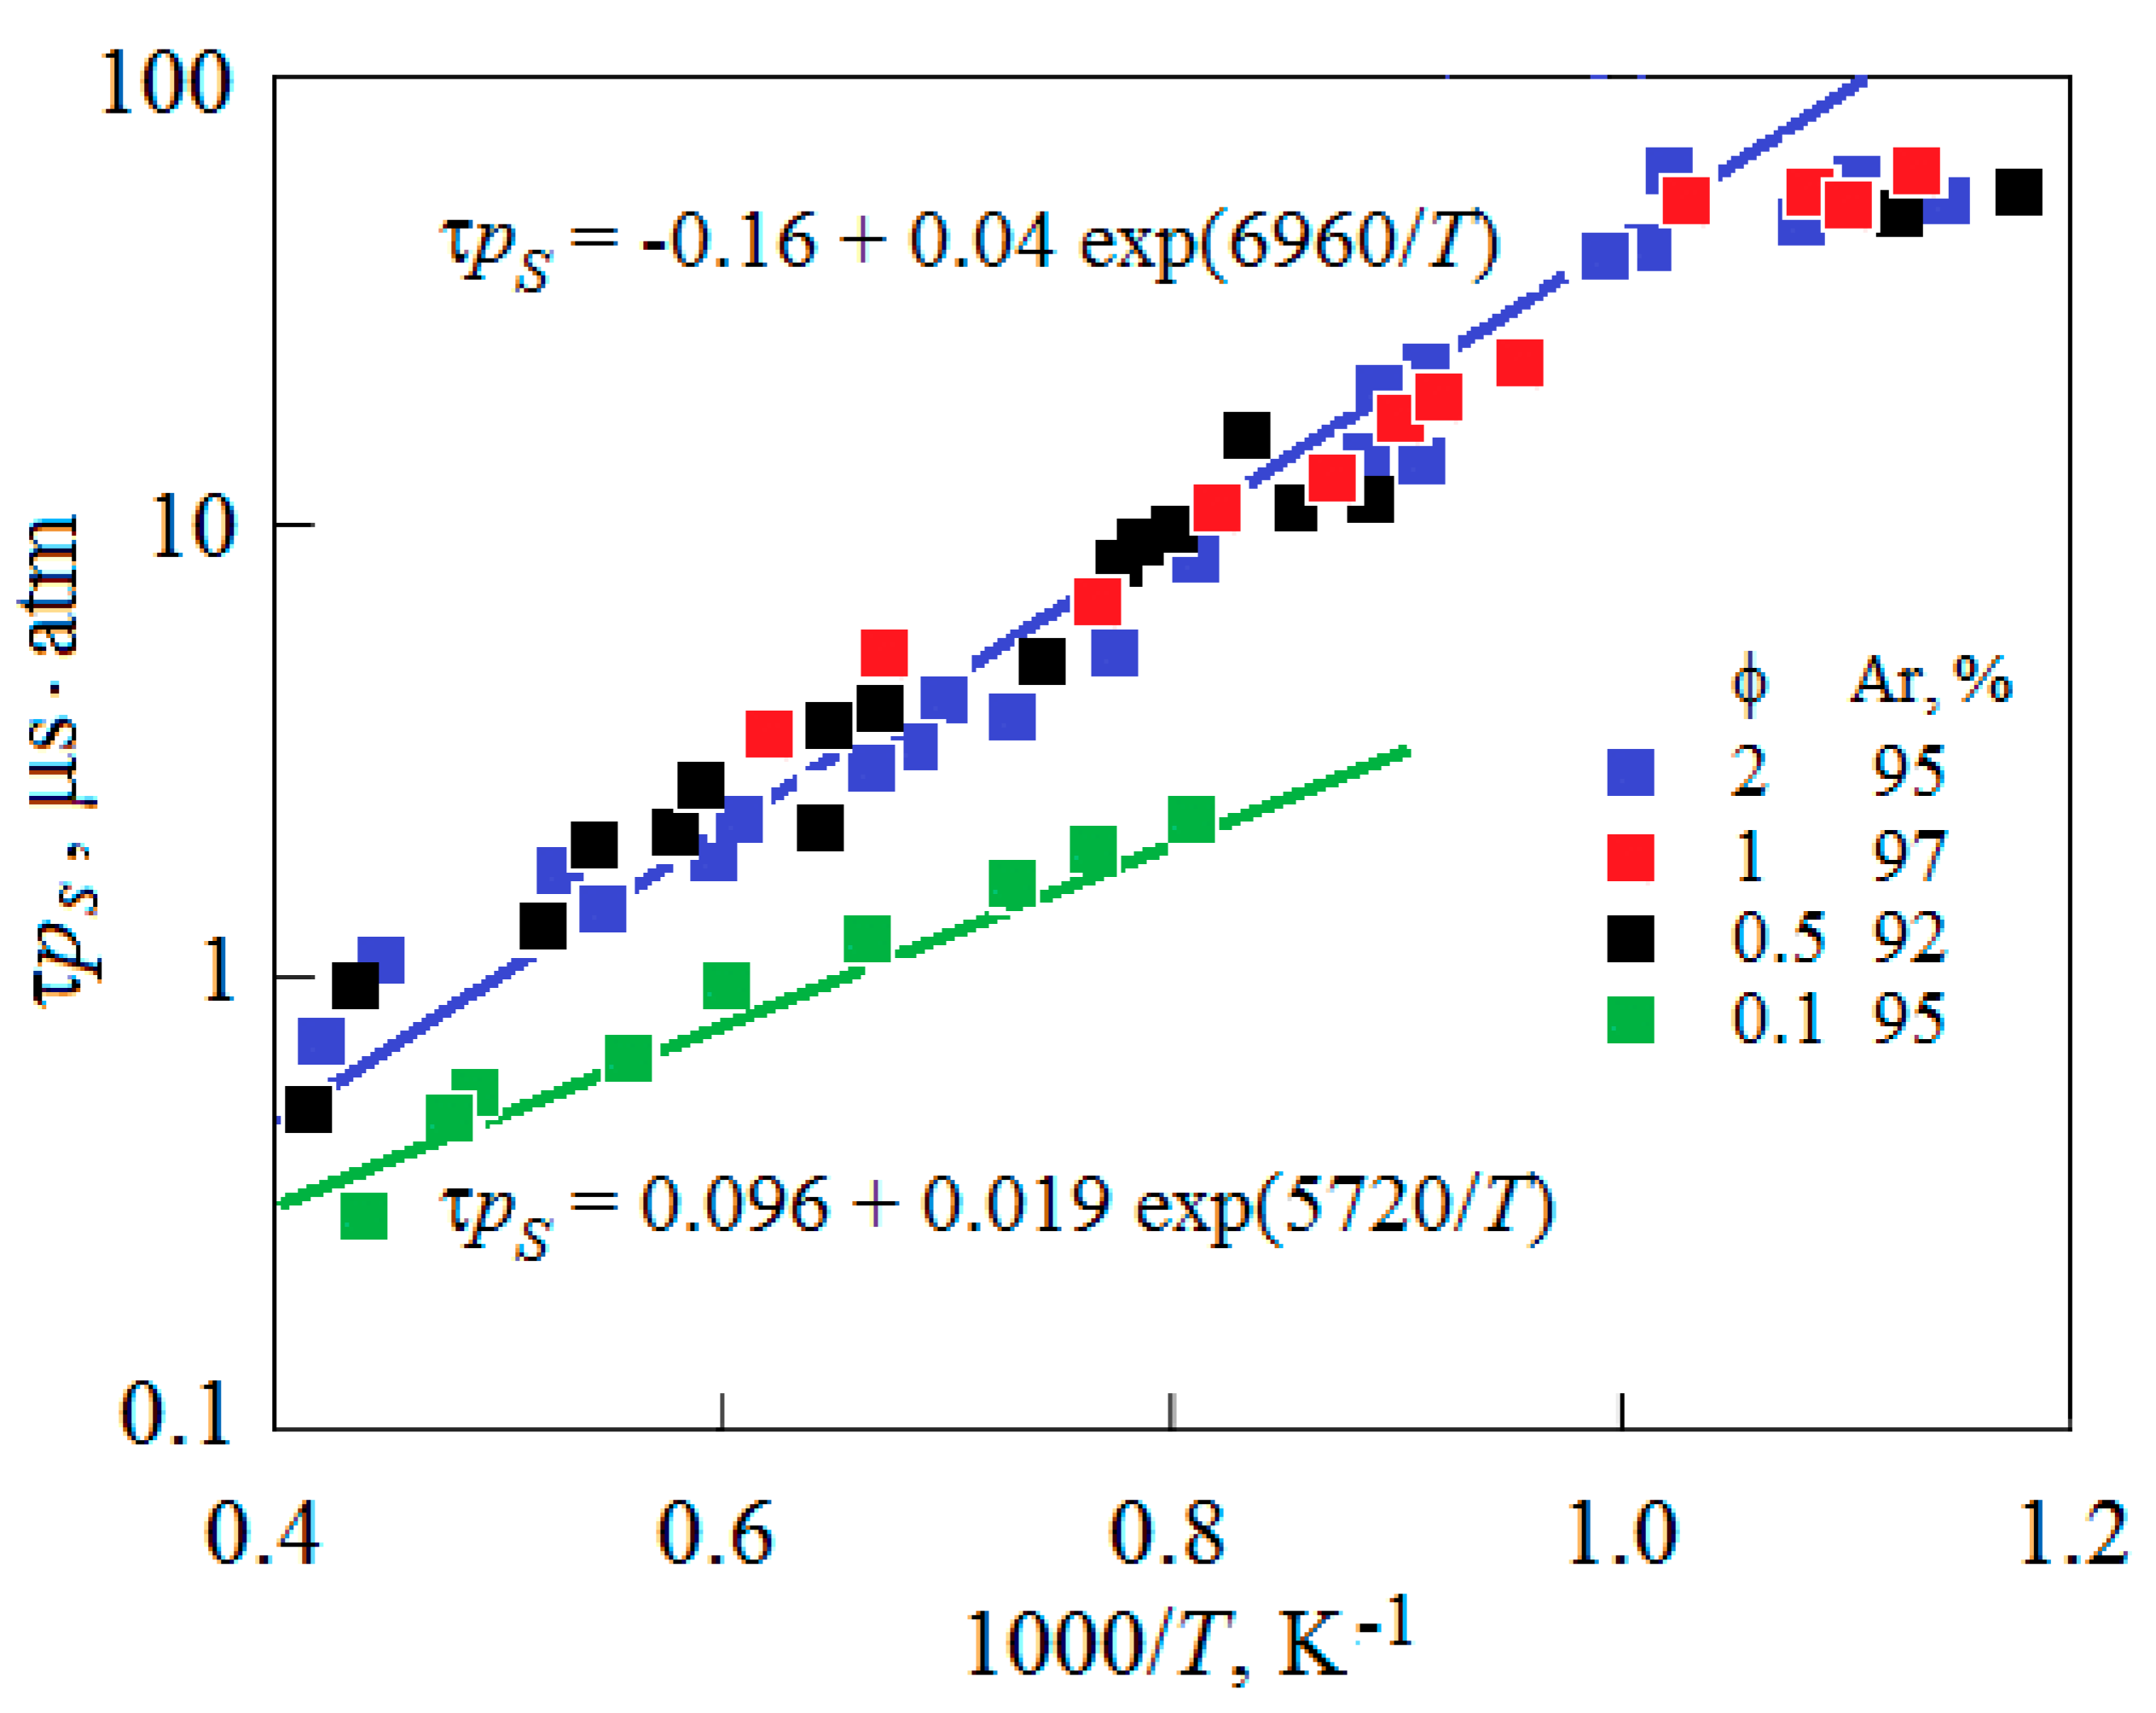
The use of the τpS value to analyze the experimental data obtained in this work made it possible to identify the main regularities of the ignition process for combustible mixtures of different compositions. The results of measuring the ignition delay time are shown in Figure 3 and recalculated to the value τpS, which is shown in Figure 6. One can see that the experimental points, presented in the form of the dependence τpS = τpS(T), are concentrated along two approximation curves. The first group of points corresponds to fuel-rich mixtures and mixtures close to a stoichiometric one, for which the temperature dependence of τpS is practically independent of the mixture composition and satisfies the Arrhenius law with activation energy E = 6960 K. The deviation of the τpS value from the approximation curve in the temperature range T = 1000 ÷ 2500 K is in the order of 15–20%, which is within the scattering of experimental points.
The second group of points corresponds to fuel-lean mixtures that are characterized by a high oxygen content. The τpS values for these mixtures are 2–5 times lower than similar values measured in mixtures with excess fuel. In this case, the temperature dependence of τpS also obeys the Arrhenius law with activation energy E = 5720 K. This behavior of the τpS value can be explained by referring to elementary reactions that describe the initial stage of hydrogen–oxygen mixture ignition [20]. Chain initiation in the chain ignition mechanism at T ~ 1000 K is determined mainly by the reaction H2 + O2 = H + HO2, which generates hydrogen atoms for the chain branching reaction H + O2 = O + OH. The rate of the latter is proportional to the concentration of O2. This leads to an acceleration of the ignition process as the O2/H2 ratio increases.
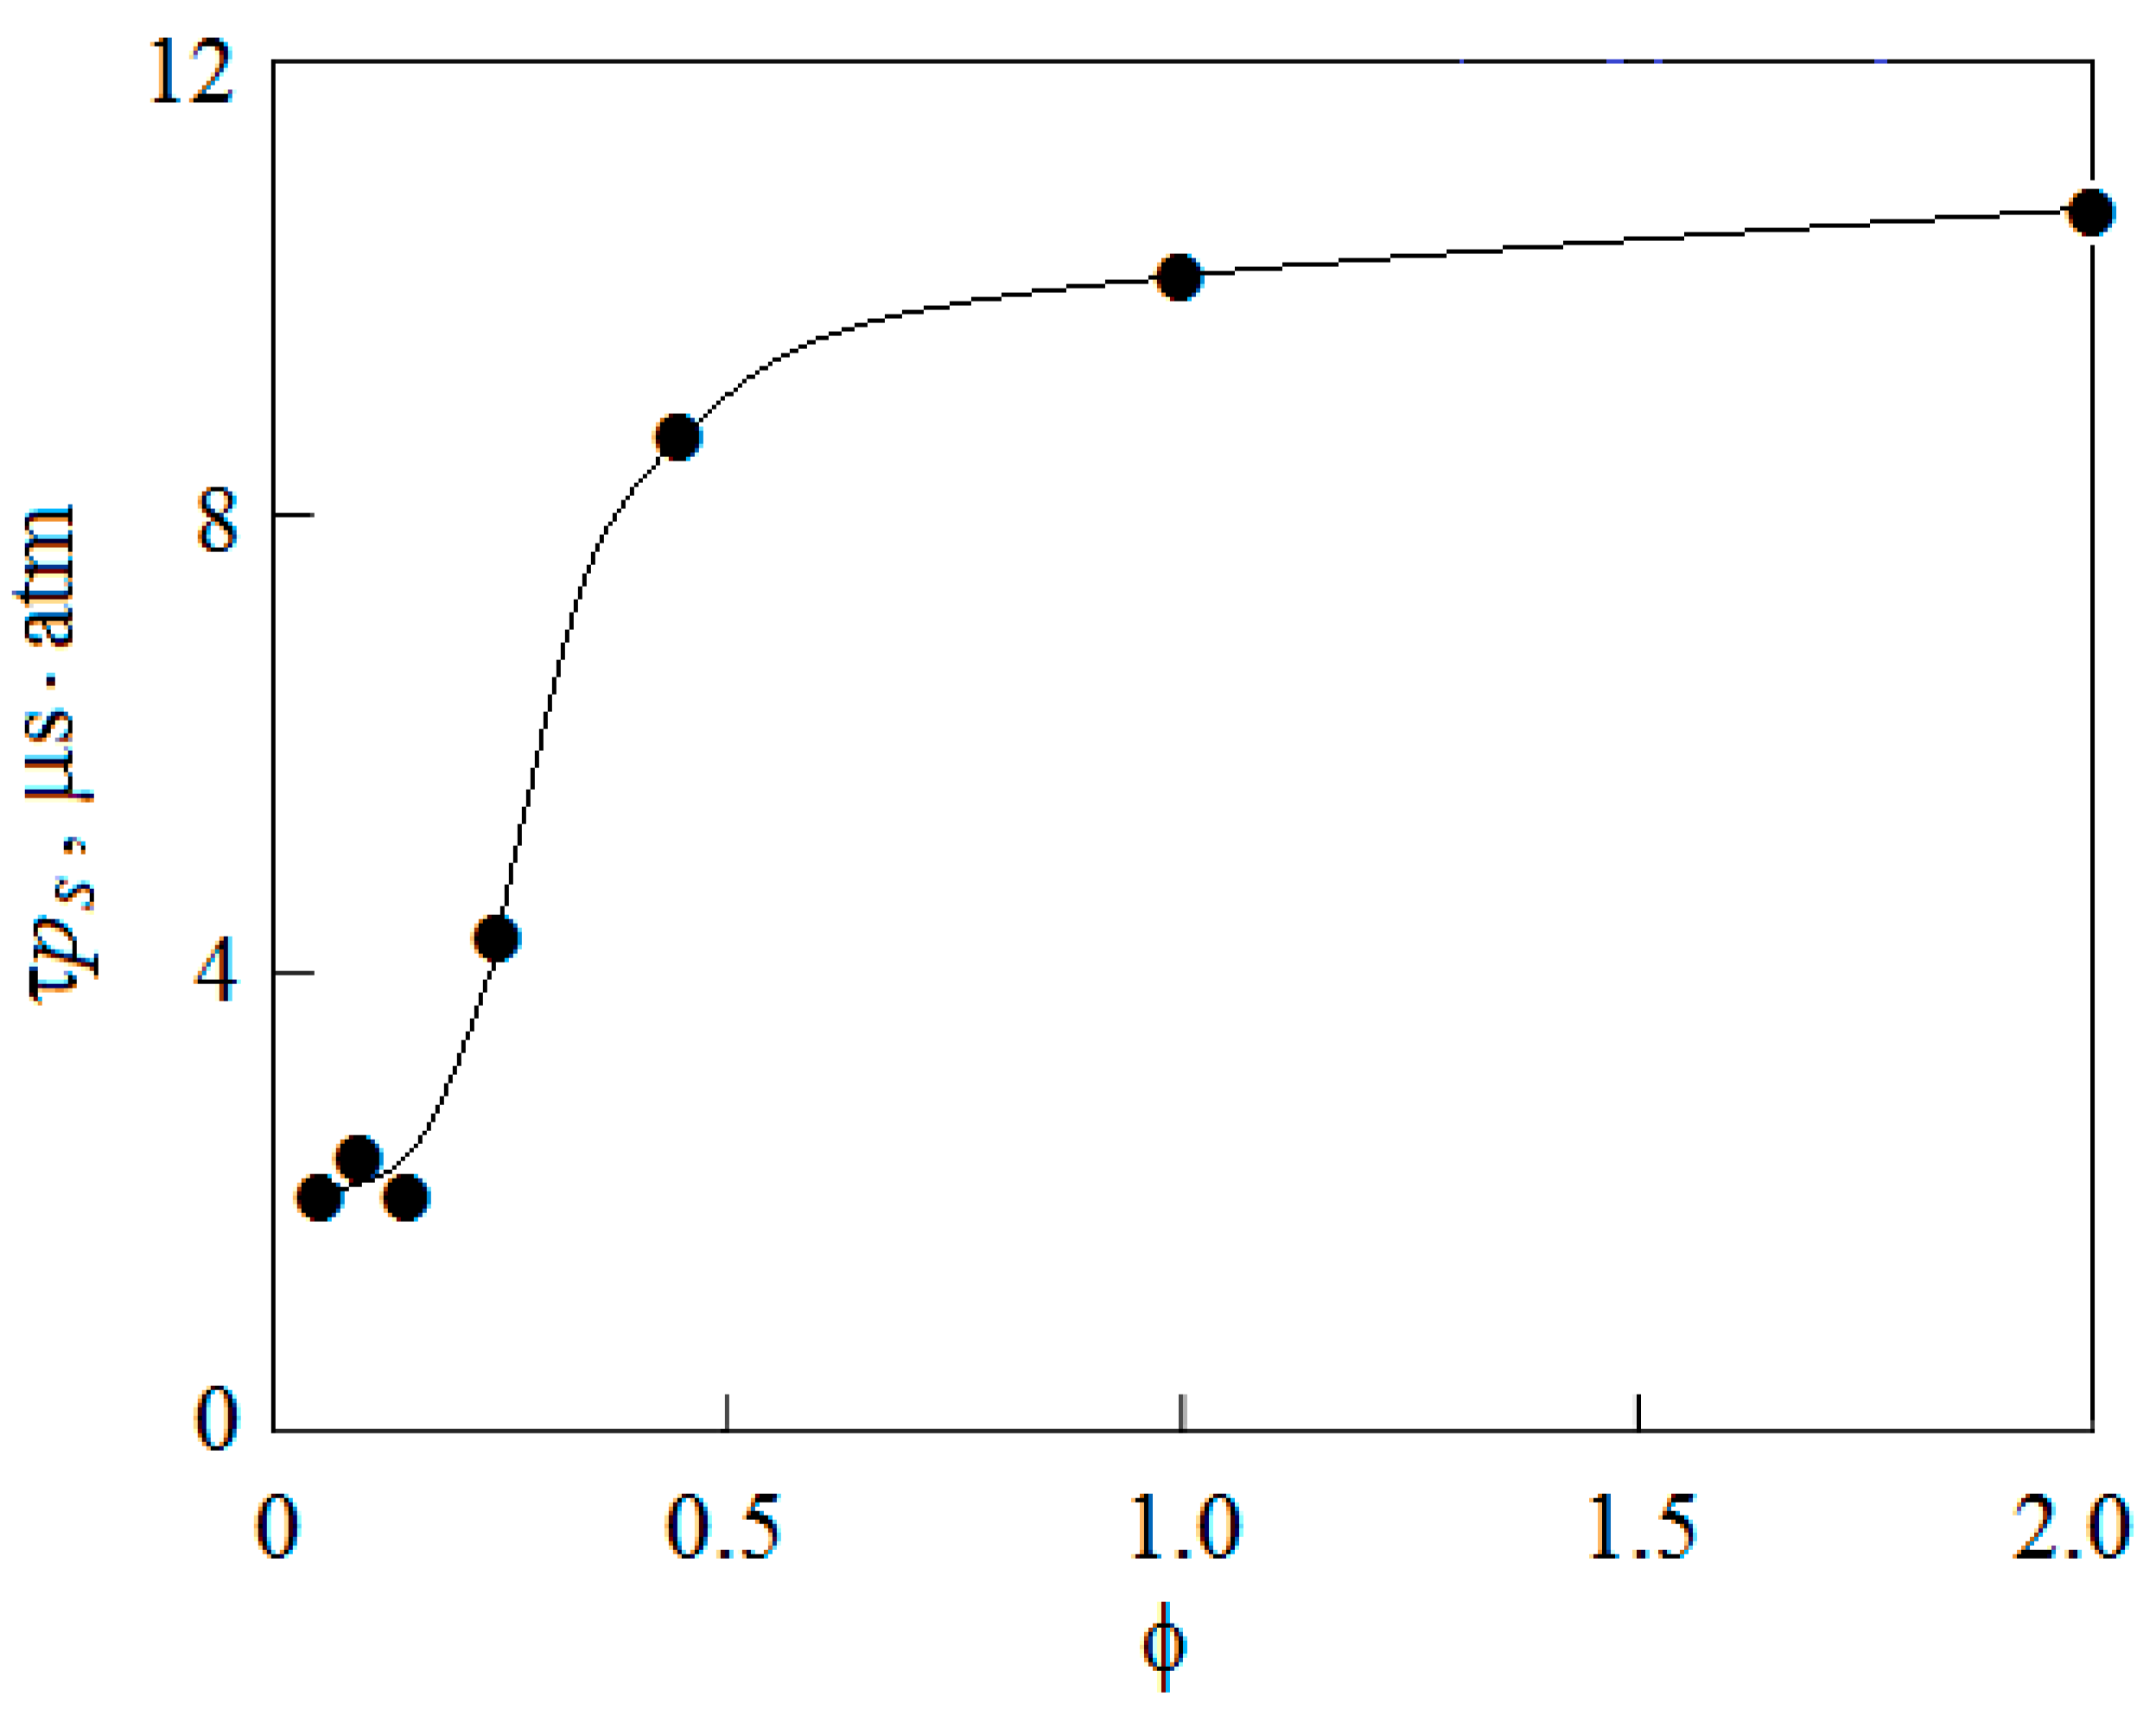
The transition zone between two approximation curves is in the range of equivalent ratio values ϕ from 0.2 to 0.5. This is clear in Figure 7, which shows the change in τpS depending on ϕ, measured at T = 1200 K and p ~ 1 atm. An increase in the value of ϕ in the above range leads to an increase in τpS by approximately five times. At higher temperatures, the dependence of τpS on excess oxygen begins to decrease, which can be explained by a significant increase in the rate constants of other initiating reactions. These primarily include dissociation reactions of the molecular components of the mixture.
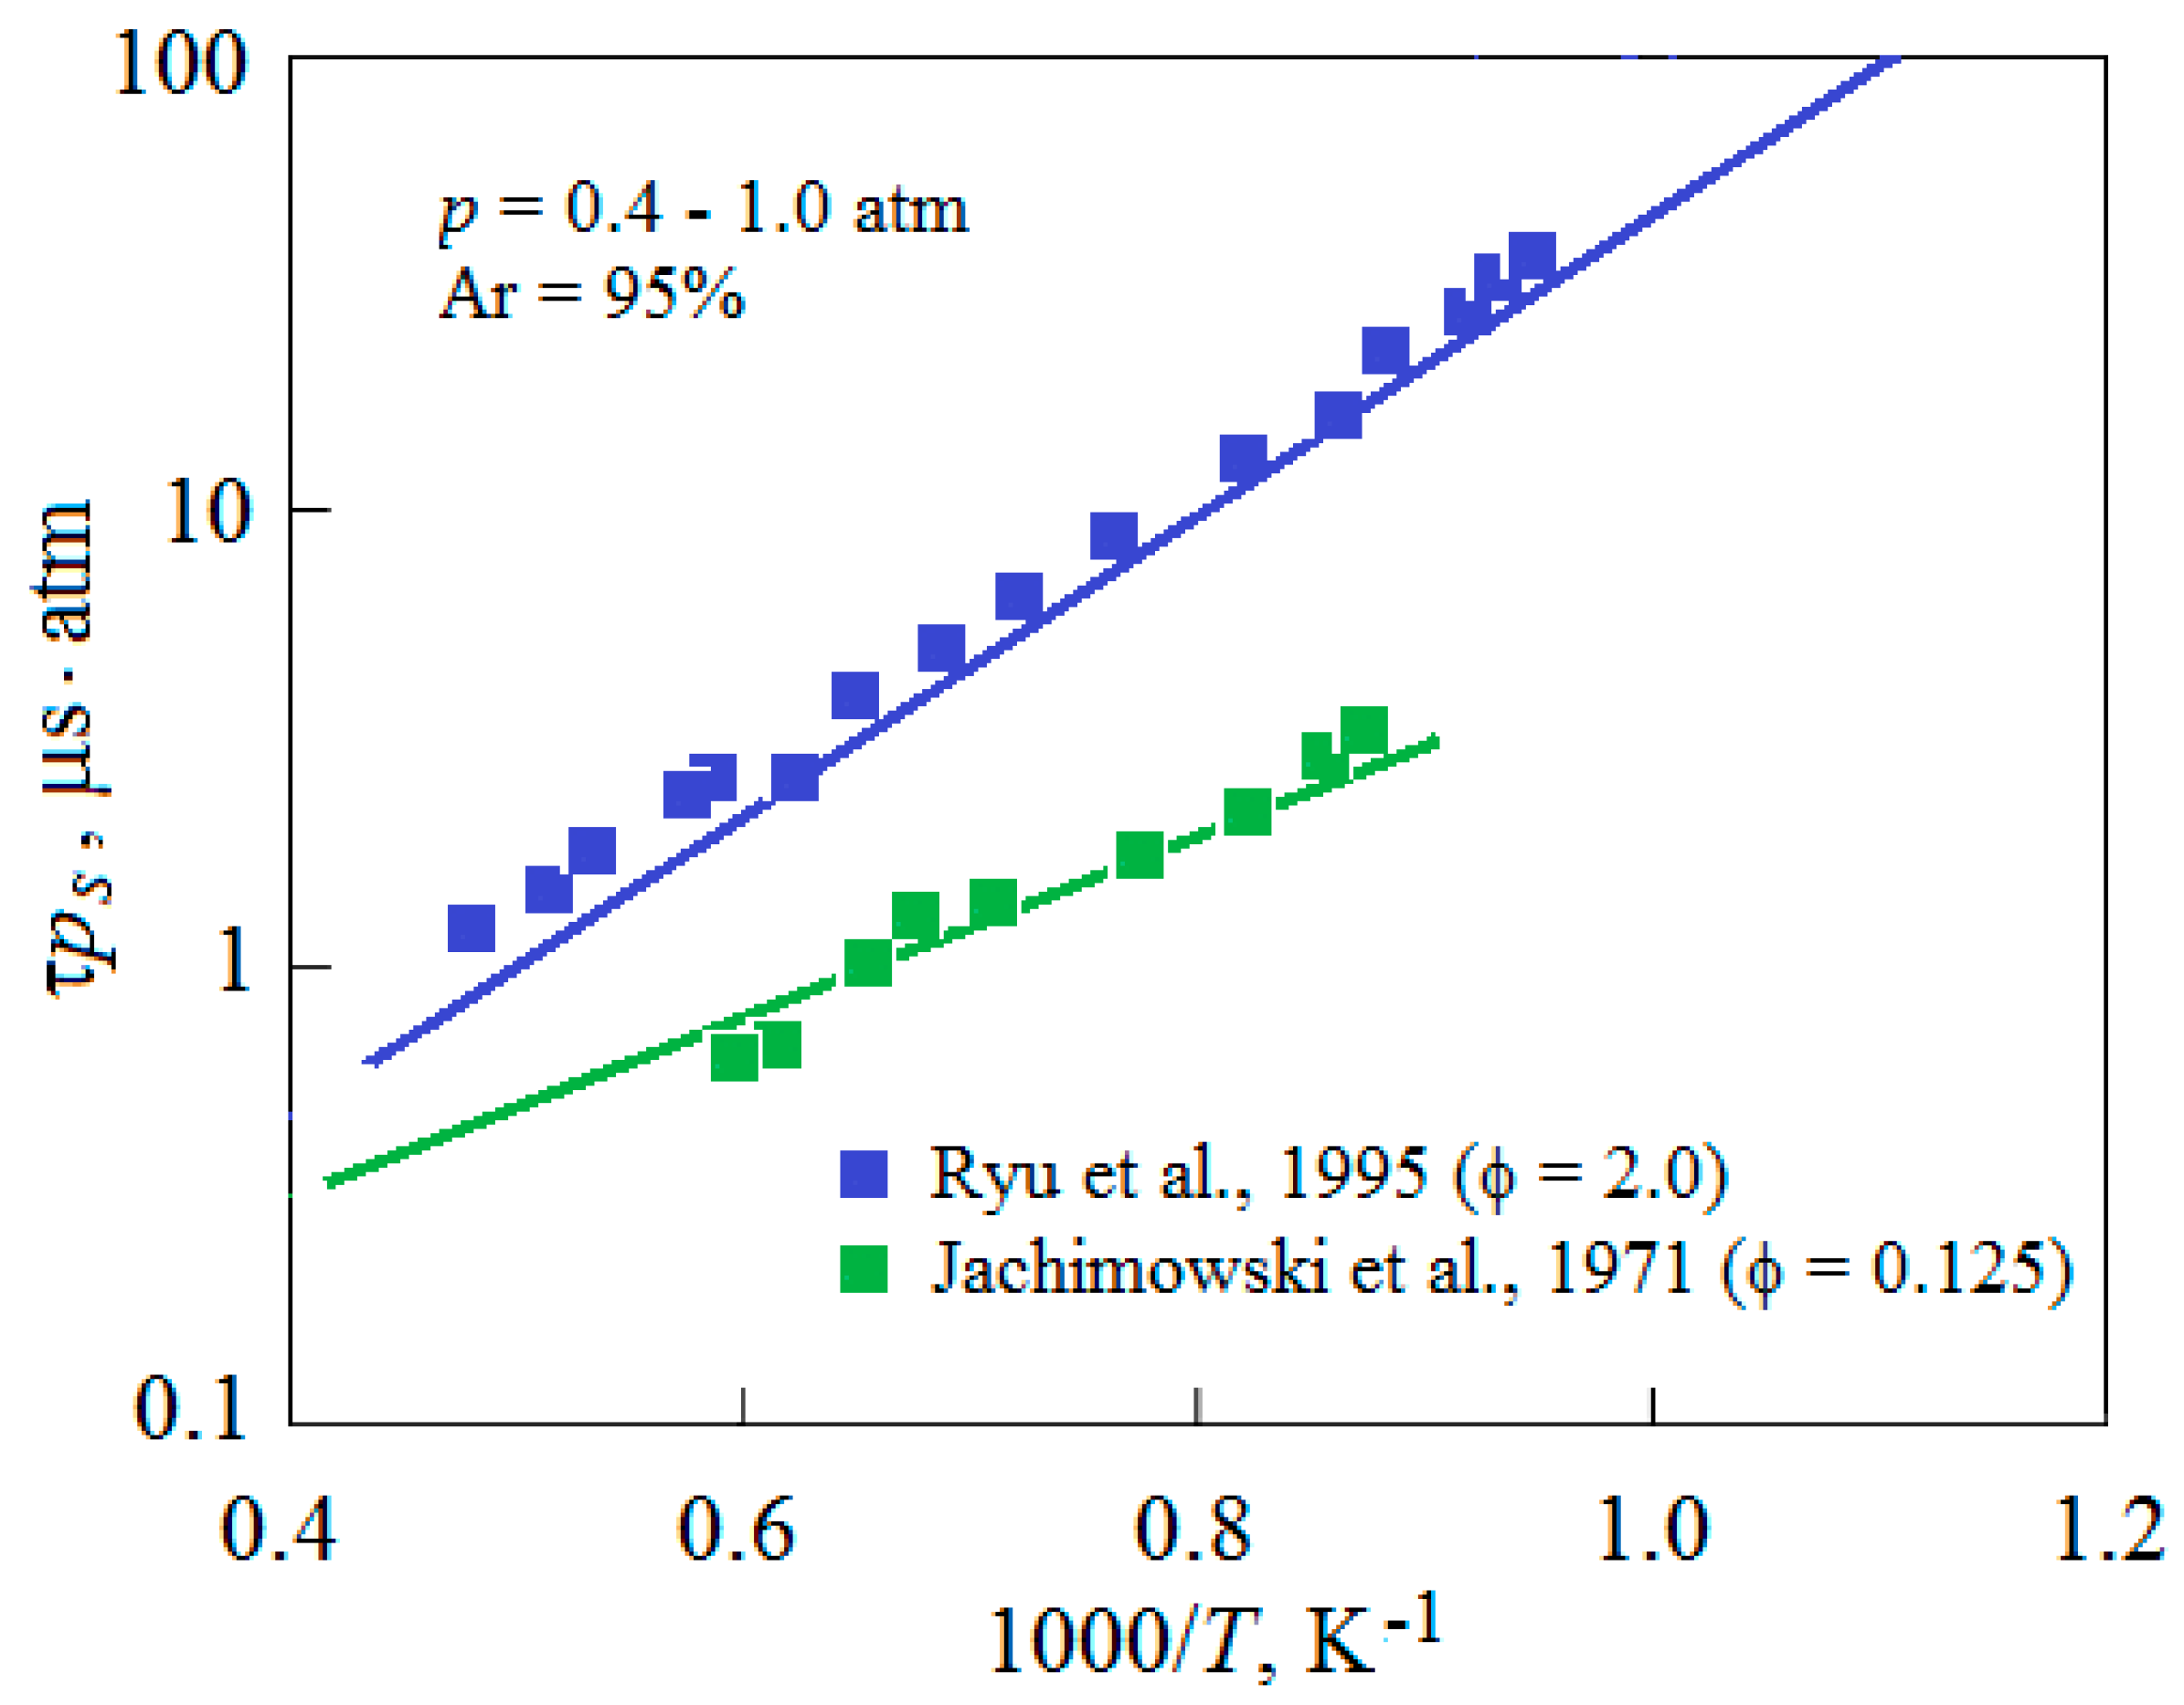
Similar behavior of the value τpS as a function of the equivalent ratio ϕ is also observed for experimental data obtained by other authors. In particular, data from Ref. [32] and Ref. [33], recalculated for the dependence of τpS on temperature, are shown in Figure 8. In the first case, measurements were carried out in a fuel-rich mixture (ϕ = 2.0) with Ar = 97.5% and p ≈ 1 atm. One can see that the experimental points are located near the approximation curve for fuel-rich mixtures in the temperature range from 1070 to 2140 K. In the second case, measurements were fulfilled in a fuel-lean mixture (ϕ = 0.125) with Ar = 95% and p ≈ 0.5 atm. Here, one can also observe the concentration of experimental points near the corresponding approximation curve.
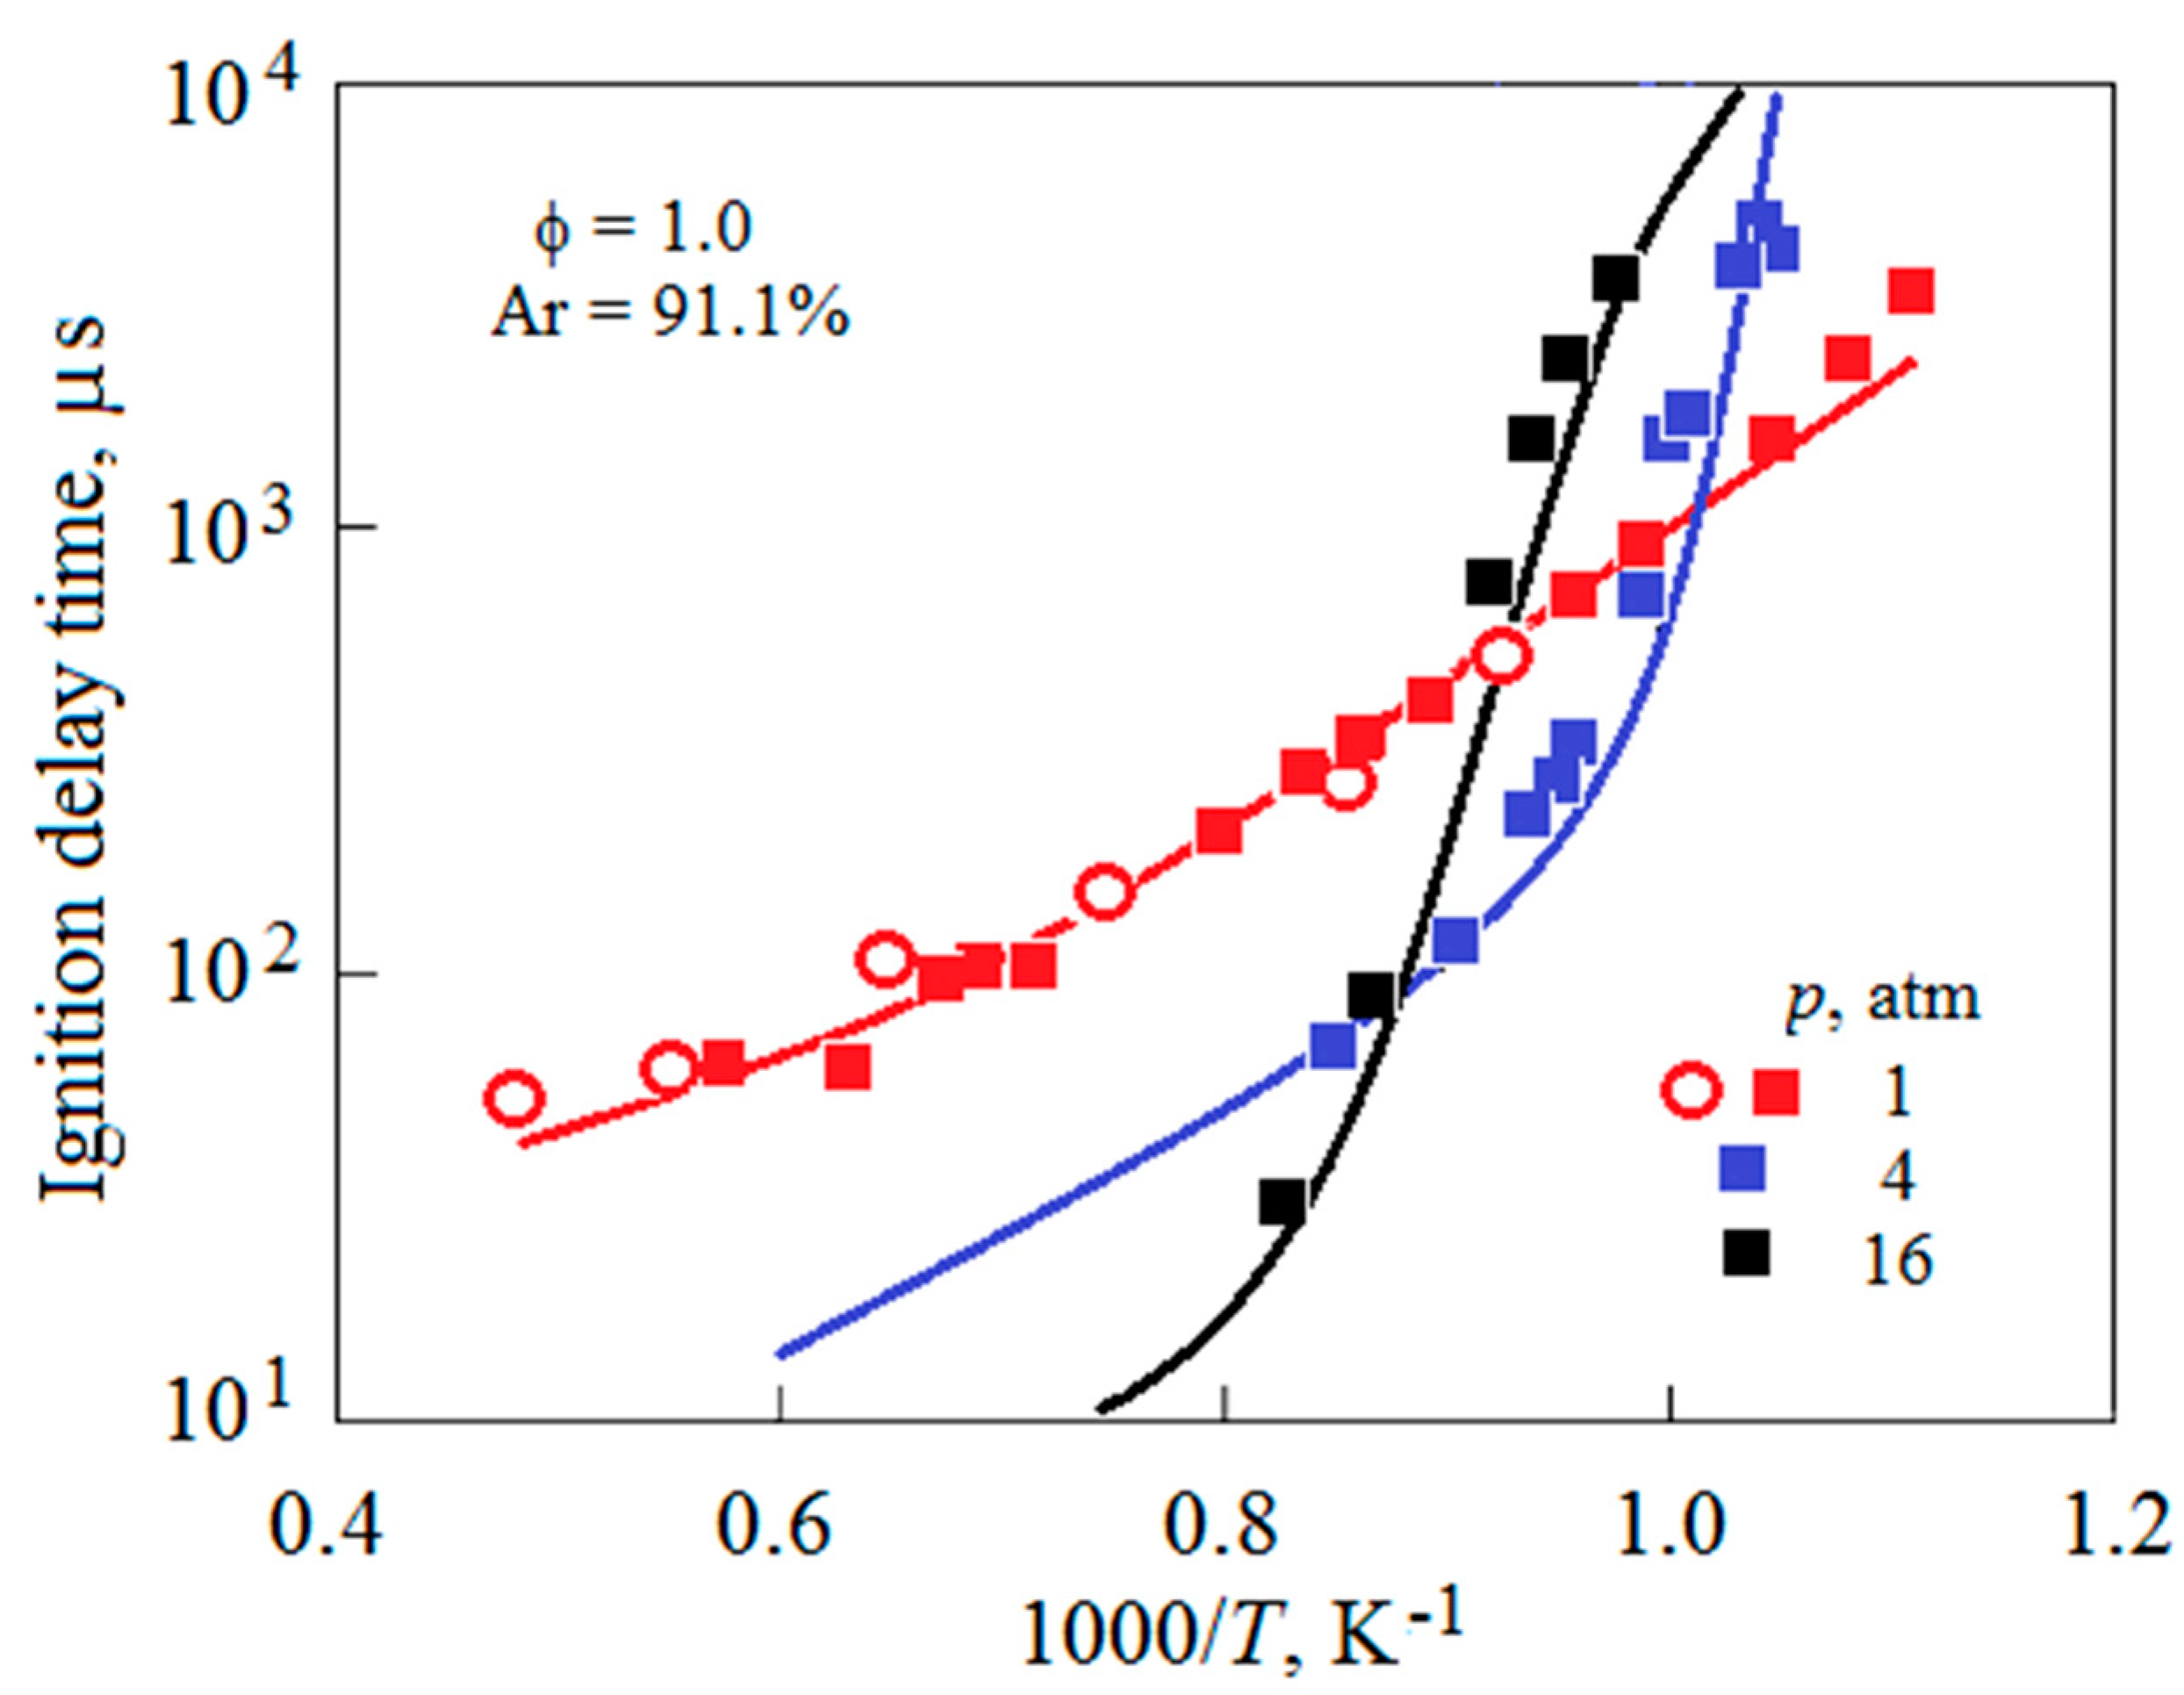
Analysis of the detailed kinetic model [20], which is used in this work for the numerical study of the ignition process, shows that the reaction H + O2 = O + OH leading to chain branching is dominant at high temperatures and low pressures. This reaction at low temperatures and high pressures becomes less important than the competing reaction H + O2 + M = HO2 + M, which leads to chain termination. Therefore, the ignition delay time of the mixture in the low-temperature region increases sharply with increasing gas pressure. This can be seen in Figure 9, where the dependence of the value τ on the pressure p is shown. The lines represent the results of numerical simulation of the mixture ignition process under corresponding experimental conditions, which reproduce the measurement data quite well.
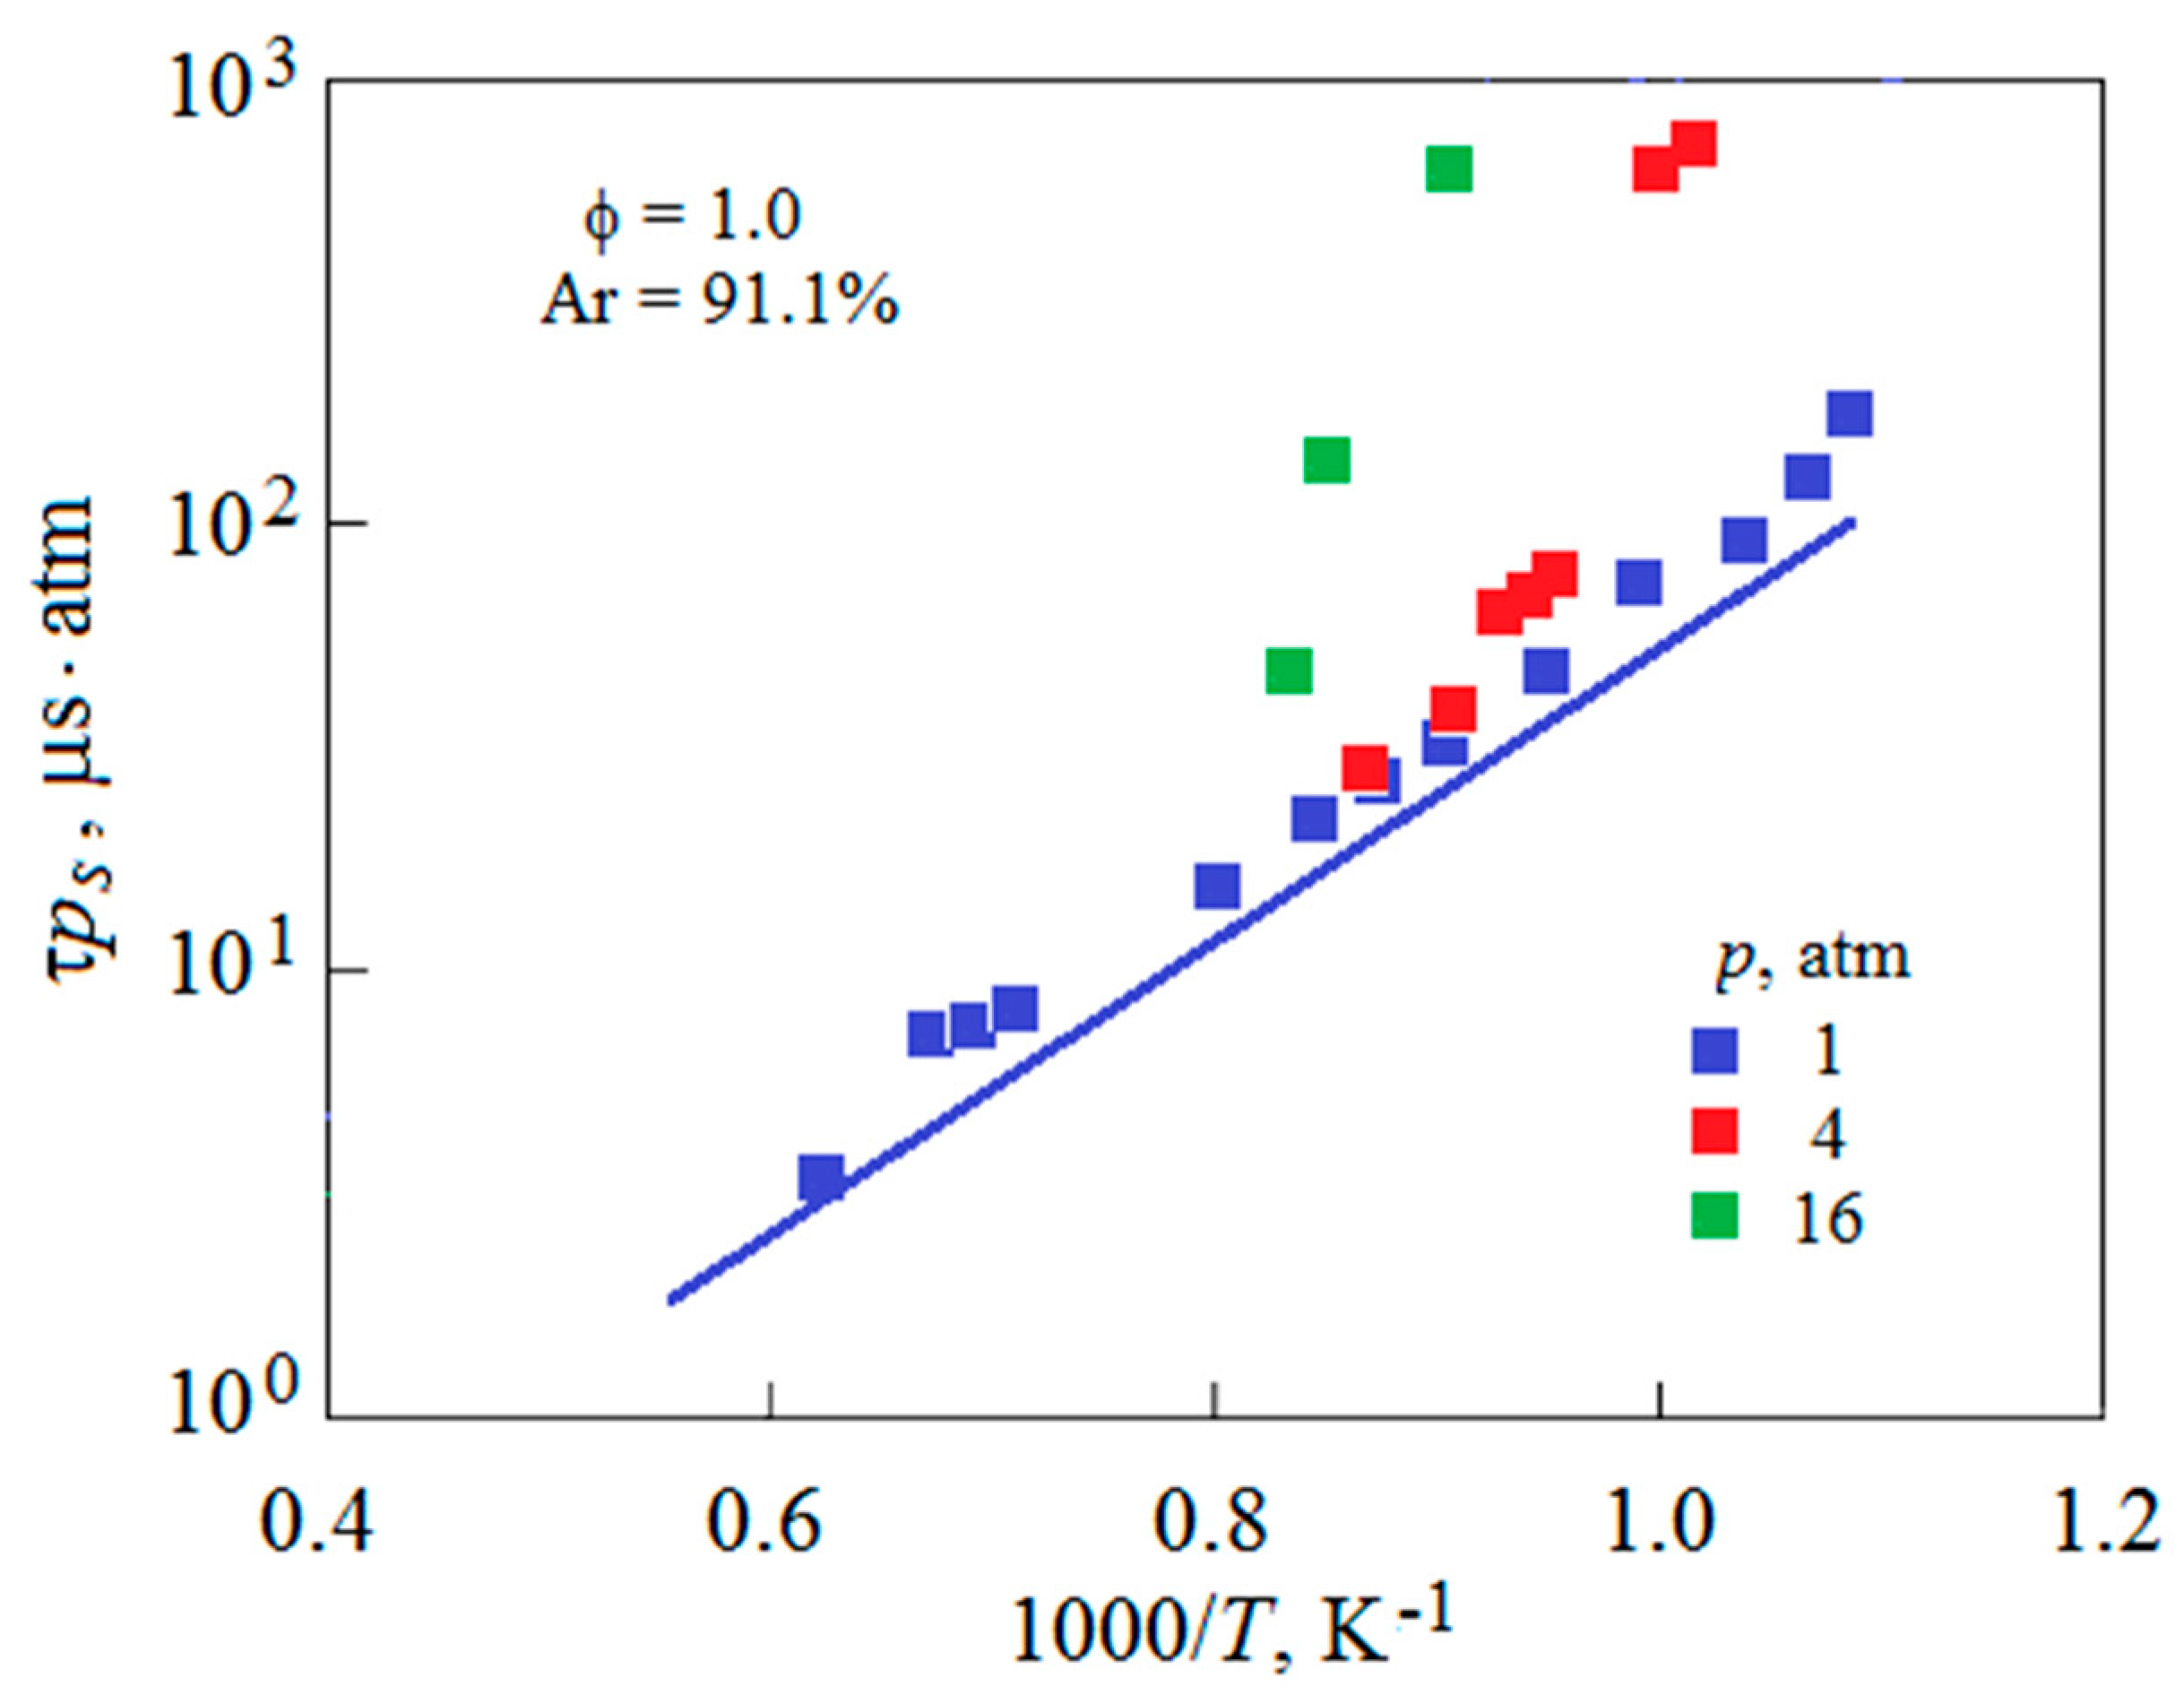
Data on ignition delay times obtained in ref. [13] and recalculated to the dependence of τpS on temperature are shown in Figure 10. It can be seen that the linear dependence of the value of log(τpS) on the inverse temperature, which describes the experimental data in the high-temperature range, is sharply violated with increasing pressure. In the case under consideration, the deviation from the approximation curve begins at T = 1050 K for p = 4 atm and at T = 1180 K for p = 16 atm. Thus, the use of the concept of partial pressure of the stoichiometric part of a combustible mixture is a convenient tool for describing the dependence of τ on T in the high-temperature region for H2/O2/Ar mixtures of various compositions.
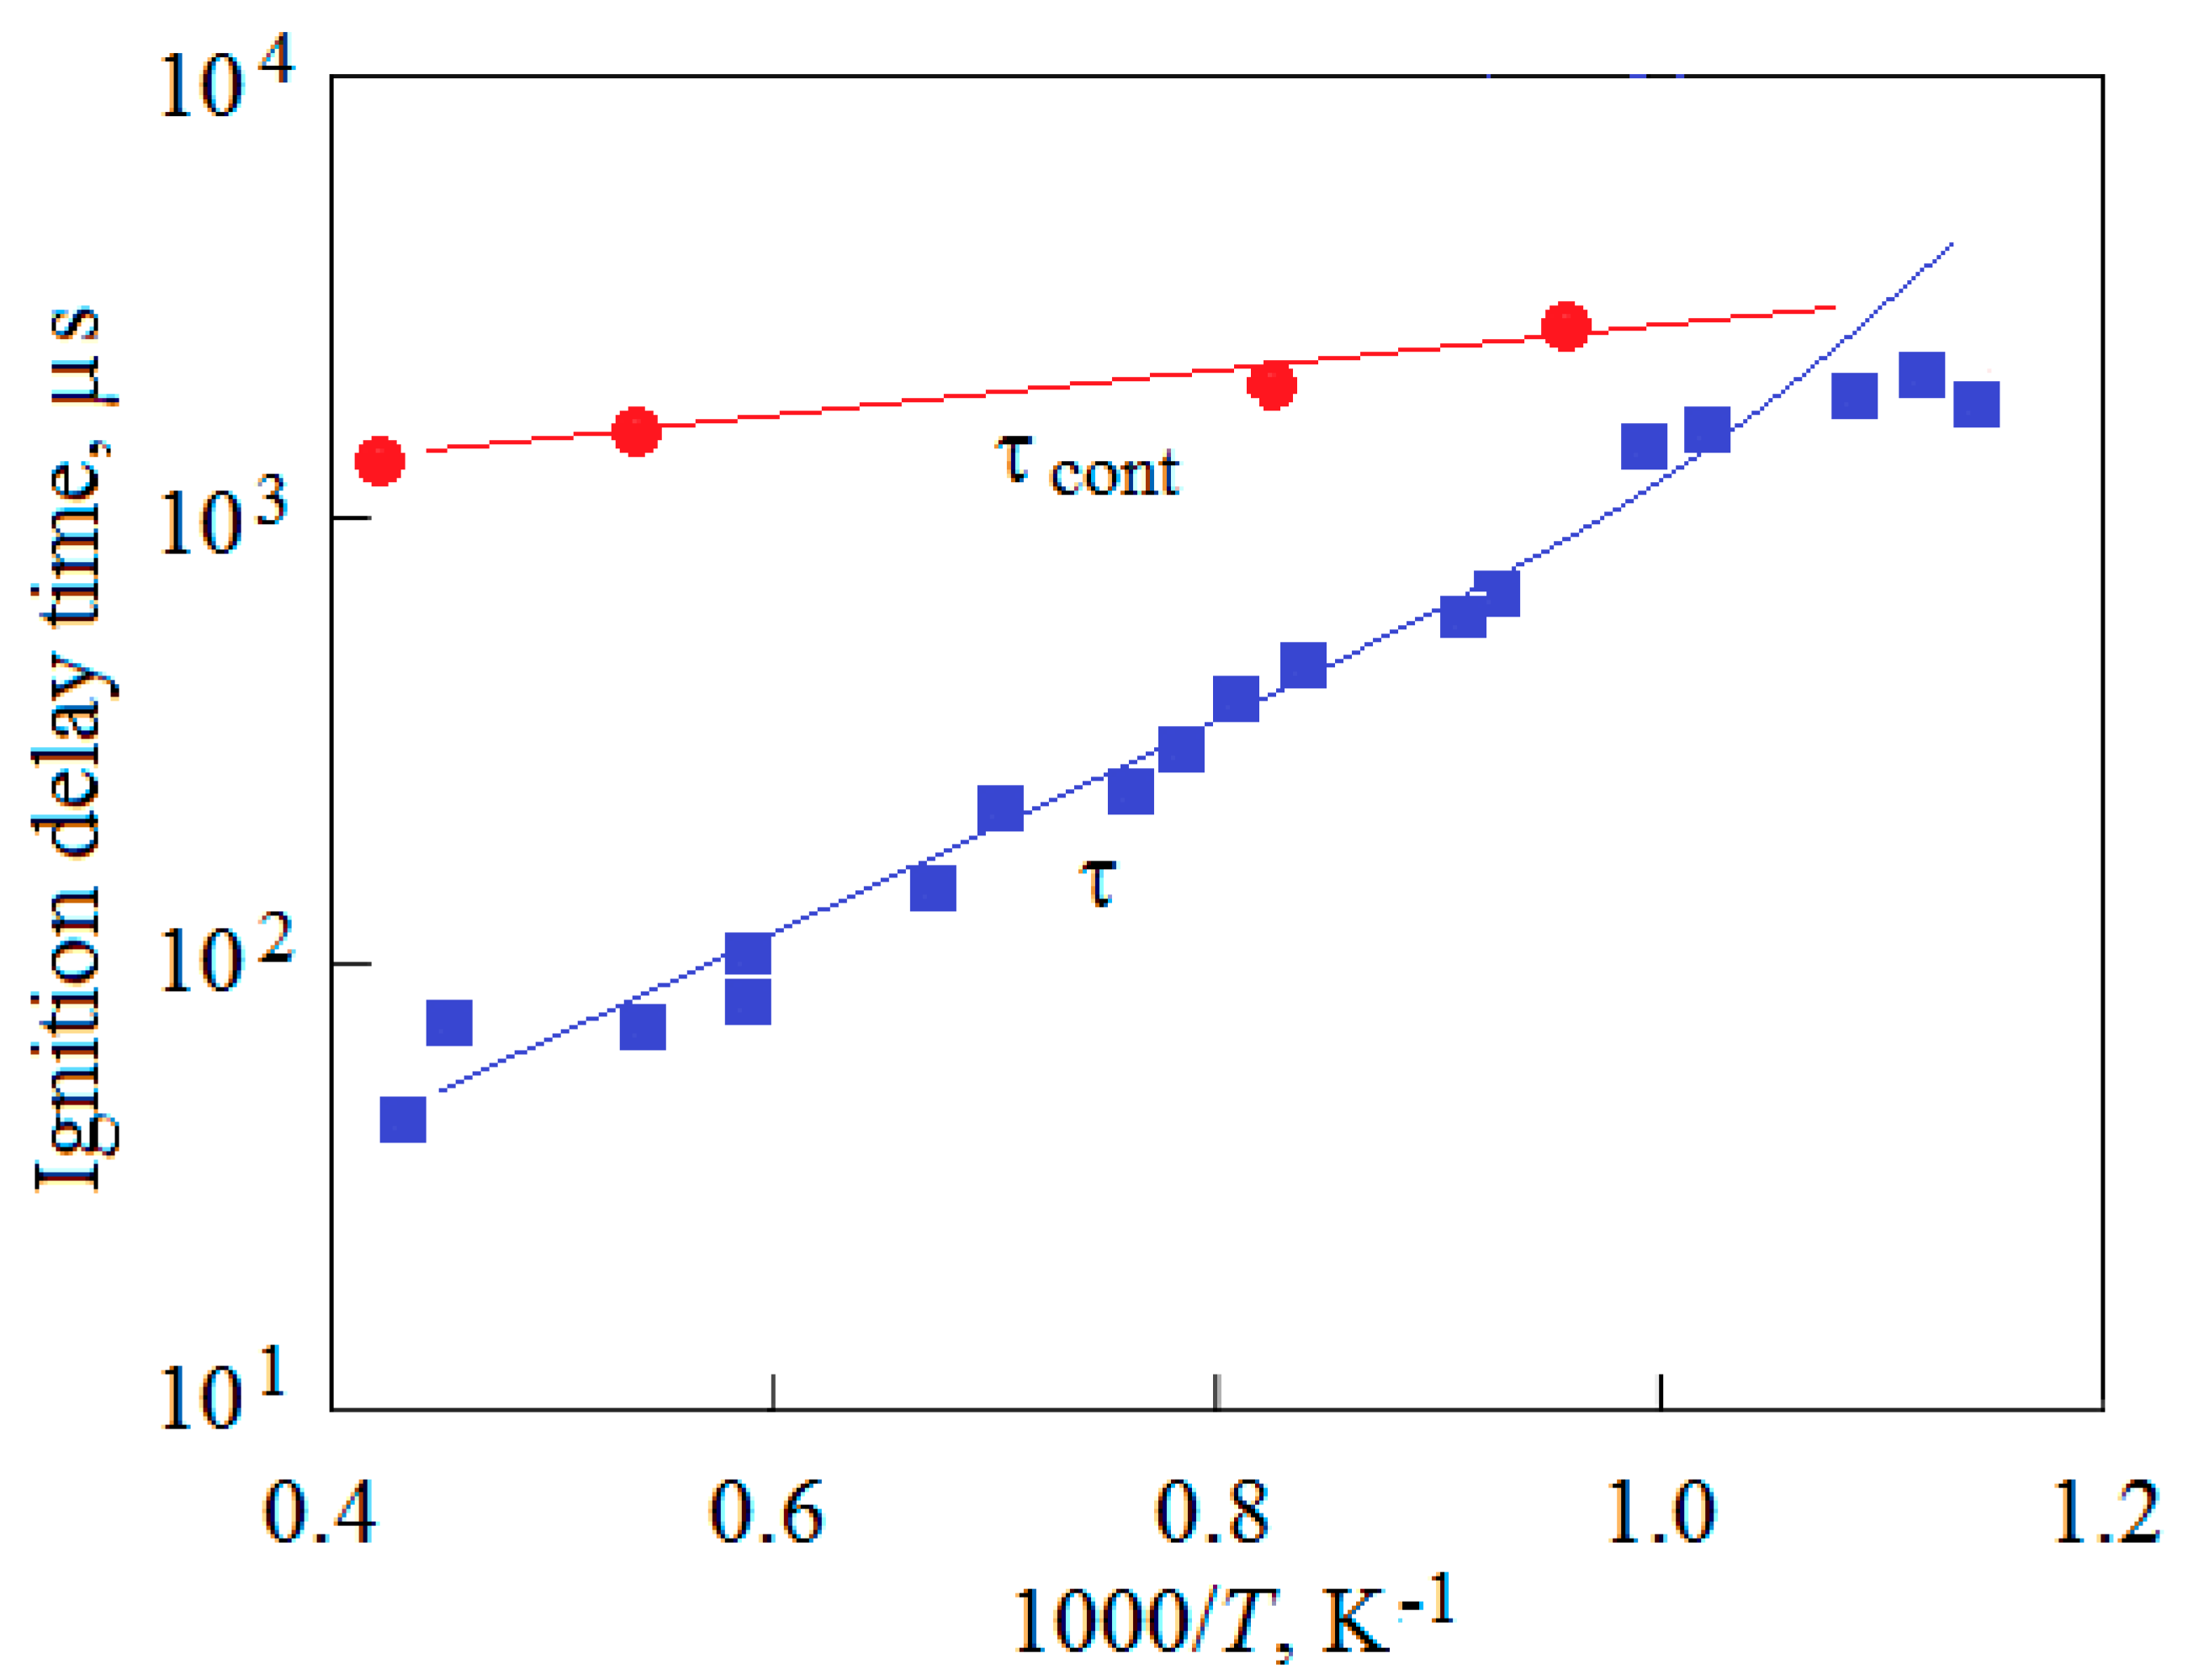
It is worth noting some limitations associated with measuring τ behind the front of the incident shock wave at low temperatures. An increase in the value of τ with a decrease in the temperature can lead to a situation when the combustible mixture does not have time to ignite by the time the contact surface separating the driver and test gas arrives at the measuring section A. This is clearly seen in Figure 11, which shows the dependences of τ and the time of the contact surface arrival to the measuring section τcont on the gas temperature. The measurements were carried out for a fuel-rich mixture with ϕ = 2 and Ar = 95% at T = 900 ÷ 2400 K and p = 0.7 ÷ 1.5 atm. The contact surface in the experiments was identified by the moment of termination of molecular oxygen radiation absorption in the Schumann–Runge band with the wavelength λ = 220 nm. Analysis of Figure 11 shows that at T ≈ 1000 K and below, ignition of the mixture occurs near the contact surface. This reduces the reliability of the experimental data obtained. Therefore, it seems more appropriate to measure the ignition delay time at low temperatures in the reflected shock wave mode.

5. Conclusions

The ignition delay times τ in H2/O2/Ar mixtures were measured behind the front of the incident shock wave at T = 870 ÷ 2500 K, p = 0.5 ÷ 1.5 atm, ϕ = 0.1 ÷ 2.0, and degrees of argon dilution from 89 to 97%. Numerical modeling was fulfilled using the detailed kinetic model developed previously.
Analysis of the obtained data made it possible to give an analytical description of the dependence of the measured values of τ on temperature using the concept of partial pressure of the stoichiometric part of the combustible mixture. The use of this concept is a convenient tool for describing the ignition process in the high-temperature range. In the low-temperature range, a sharp deviation of the experimental points from the approximation curve is observed, and this deviation shifts to the region of higher temperatures with increasing gas pressure.
The ignition delay time measured behind the front of the incident shock wave can have a large error in the low-temperature range due to the simultaneous occurrence of the ignition process and the arrival of the contact surface between the driver and test gas into the measuring section. In this case, it is apparently more correct to perform measurements in the reflected shock wave mode.

Author Contributions

Conceptualization, G.G. and V.L.; methodology, V.P.; software, N.B. and V.L.; validation, P.K., I.Z. and G.G.; formal analysis, V.L.; investigation, V.P., P.K. and I.Z.; resources, V.L.; data curation, G.G.; writing—original draft preparation, V.L.; writing—review and editing, G.G.; visualization, V.L.; supervision, G.G.; project administration, V.L.; funding acquisition, V.L. All authors have read and agreed to the published version of the manuscript.

Funding

This research received no external funding.

Institutional Review Board Statement

Not applicable.

Informed Consent Statement

Not applicable.

Data Availability Statement

The datasets obtained during the current study are available upon reasonable request.

Conflicts of Interest

The authors declare no conflict of interest.

References

  1. Smirnov, N.N.; Nikitin, V.F. Modeling and simulation of hydrogen combustion in engines. Int. J. Hydrog. Energy 2014, 39, 1122–1136. [Google Scholar] [CrossRef]
  2. Jain, I.P. Hydrogen the fuel for 21st century. Int. J. Hydrog. Energy 2009, 34, 7368–7378. [Google Scholar] [CrossRef]
  3. Westbrook, C.K.; Dryer, F.L. Chemical kinetic modeling of hydrocarbon combustion. Prog. Energy Combust. Sci. 1984, 10, 1–57. [Google Scholar] [CrossRef]
  4. Kiverin, A.D.; Minaev, K.O.; Yakovenko, I.S. Modes of mild ignition in shock tubes: Origins and classification. Combust. Flame 2020, 221, 420–428. [Google Scholar] [CrossRef]
  5. Chang, X.; Bai, C.; Zhang, B.; Sun, B. The effect of ignition delay time on the explosion behavior in non-uniform hydrogen-air mixtures. Int. J. Hydrog. Energy 2022, 47, 9810–9818. [Google Scholar] [CrossRef]
  6. Lyu, G.; Zhong, C.; Gou, X. A pressure-ratio equivalent method for ultra-high pressure hydrogen spontaneous ignition experiment. Int. J. Hydrog. Energy 2022, 47, 22650–22661. [Google Scholar] [CrossRef]
  7. Böttler, H.; Chen, X.; Xie, S.; Scholtissek, A.; Chen, Z.; Hasse, C. Flamelet modeling of forced ignition and flame propagation in hydrogen-air mixtures. Combust. Flame 2022, 243, 112125. [Google Scholar] [CrossRef]
  8. Villenave, N.; Dayma, G.; Brequigny, P.; Foucher, F. Experimental measurements of ultra-lean hydrogen ignition delays using a rapid compression machine under internal combustion engine conditions. Fuel 2024, 355, 129431. [Google Scholar] [CrossRef]
  9. Smirnov, N.; Nikitin, V.; Mikhalchenko, E.; Stamov, L. Modeling a Combustion Chamber of a Pulse Detonation Engine. Fire 2023, 6, 335. [Google Scholar] [CrossRef]
  10. Hanson, R.K.; Davidson, D.F. Recent advances in laser absorption and shock tube methods for studies of combustion chemistry. Prog. Energy Combust. Sci. 2014, 44, 103–114. [Google Scholar] [CrossRef]
  11. Martynenko, V.V.; Penyaz’kov, O.G.; Ragotner, K.A.; Shabunya, S.I. High-temperature ignition of hydrogen and air at high pressures downstream of the reflected shock wave. J. Eng. Phys. Thermophys. 2004, 77, 785–793. [Google Scholar] [CrossRef]
  12. Pang, G.A.; Davidson, D.F.; Hanson, R.K. Experimental study and modeling of shock tube ignition delay times for hydrogen–oxygen–argon mixtures at low temperatures. Proc. Combust. Inst. 2009, 32, 181–188. [Google Scholar] [CrossRef]
  13. Herzler, J.; Naumann, C. Shock-tube study of the ignition of methane/ethane/hydrogen mixtures with hydrogen contents from 0% to 100% at different pressures. Proc. Combust. Inst. 2009, 32, 213–220. [Google Scholar] [CrossRef]
  14. Zhang, Y.; Huang, Z.; Wei, L.; Zhang, J.; Law, C.K. Experimental and modeling study on ignition delays of lean mixtures of methane, hydrogen, oxygen, and argon at elevated pressures. Combust. Flame 2012, 159, 918–931. [Google Scholar] [CrossRef]
  15. Hu, E.; Pan, L.; Gao, Z.; Lu, X.; Meng, X.; Huang, Z. Shock tube study on ignition delay of hydrogen and evaluation of various kinetic models. Int. J. Hydrog. Energy 2016, 41, 13261–13280. [Google Scholar] [CrossRef]
  16. Smirnov, N.N.; Penyazkov, O.G.; Sevrouk, K.L.; Nikitin, V.F.; Stamov, L.I.; Tyurenkova, V.V. Onset of detonation in hydrogen-air mixtures due to shock wave reflection inside a combustion chamber. Acta Astronaut. 2018, 149, 77–92. [Google Scholar] [CrossRef]
  17. Pavlov, V.A.; Shatalov, O.P. Measuring the ignition delay time for hydrogen-oxygen mixtures behind the front of an incident shock wave. Kinet. Catal. 2011, 52, 157–165. [Google Scholar] [CrossRef]
  18. A Chemical Equilibrium Program for Windows. Available online: http://www.gaseq.co.uk/ (accessed on 1 January 2005).
  19. Stupochenko, Y.V.; Losev, S.A.; Osipov, A.I. Relaxation in Shock Waves; Springer: New York, NY, USA, 1967. [Google Scholar]
  20. Gerasimov, G.Y.; Shatalov, O.P. Kinetic mechanism of combustion of hydrogen-oxygen mixtures. J. Eng. Phys. Thermophys. 2013, 86, 987–995. [Google Scholar] [CrossRef]
  21. Cohen, N.; Westberg, K.R. Chemical kinetic data sheets for high-temperature chemical reactions. J. Phys. Chem. Ref. Data 1983, 12, 531–590. [Google Scholar] [CrossRef]
  22. Tsang, W.; Hampson, R.F. Chemical kinetic data base for combustion chemistry. Part I. Methane Relat. Compd. J. Phys. Chem. Ref. Data 1986, 15, 1087–1279. [Google Scholar] [CrossRef]
  23. Warnatz, J.; Maas, U.; Dibble, R.W. Combustion; Springer: Berlin/Heidelberg, Germany, 2003. [Google Scholar]
  24. Atkinson, R.; Baulch, D.L.; Cox, R.A.; Crowley, J.N.; Hampson, R.F.; Hynes, R.G.; Jenkin, M.E.; Rossi, M.J.; Troe, J. Evaluated kinetic and photochemical data for atmospheric chemistry: Volume I—Gas phase reactions of Ox, HOx, NOx, and SOx species. Atmos. Chem. Phys. 2004, 4, 1461–1738. [Google Scholar] [CrossRef]
  25. Baulch, D.L.; Bowman, C.T.; Cobos, C.J.; Cox, R.A.; Just, T.; Kerr, J.A.; Pilling, J.; Stocker, D.; Troe, J.; Tsang, W.; et al. Evaluated kinetic data for combustion modeling: Supplement II. J. Phys. Chem. Ref. Data 2005, 34, 757–1397. [Google Scholar] [CrossRef]
  26. Konnov, A.A. Remaining uncertainties in the kinetic mechanism of hydrogen combustion. Combust. Flame 2008, 152, 507–528. [Google Scholar] [CrossRef]
  27. Burcat, A.; Ruscic, B. Third Millennium Ideal Gas and Condensed Phase Thermochemical Database for Combustion with Updates from Active Thermochemical Tables; Tech. Rep. ANL-05/20; Argonne National Laboratory: Lemont, IL, USA, 2005. [Google Scholar]
  28. Kee, R.J.; Rupley, F.M.; Meeks, E.; Miller, J.A. Chemkin-III: A Fortran Chemical Kinetics Package for the Analysis of Gas-Phase Chemical and Plasma Kinetics; Tech. Rep. SAND96-8218; Sandia National Laboratories: Livermore, CA, USA, 1996. [Google Scholar]
  29. Hall, J.M.; Petersen, E.L. An optimized kinetics model for OH chemiluminescence at high temperatures and atmospheric pressures. Int. J. Chem. Kinet. 2006, 38, 714–724. [Google Scholar] [CrossRef]
  30. Pavlov, V.A.; Gerasimov, G.Y. Ignition of hydrogen–oxygen mixtures behind the incident shock wave front. J. Eng. Phys. Thermophys. 2016, 89, 587–591. [Google Scholar] [CrossRef]
  31. Ninnemann, E.; Koroglu, B.; Pryor, O.; Barak, S.; Nash, L.; Loparo, Z.; Sosa, J.; Ahmed, K.; Vasu, S. New insights into the shock tube ignition of H2/O2 at low to moderate temperatures using high-speed end-wall imaging. Combust. Flame 2018, 187, 11–21. [Google Scholar] [CrossRef]
  32. Ryu, S.O.; Hwang, S.M. Shock tube and modeling study of the H + O2 = OH + O reaction over a wide range of composition, pressure, and temperature. J. Phys. Chem. 1995, 99, 13984–13991. [Google Scholar] [CrossRef]
  33. Jachimowski, C.J.; Houghton, W.M. Shock-tube study of the initiation process in the hydrogen-oxygen reaction. Combust. Flame 1971, 17, 25–30. [Google Scholar] [CrossRef]
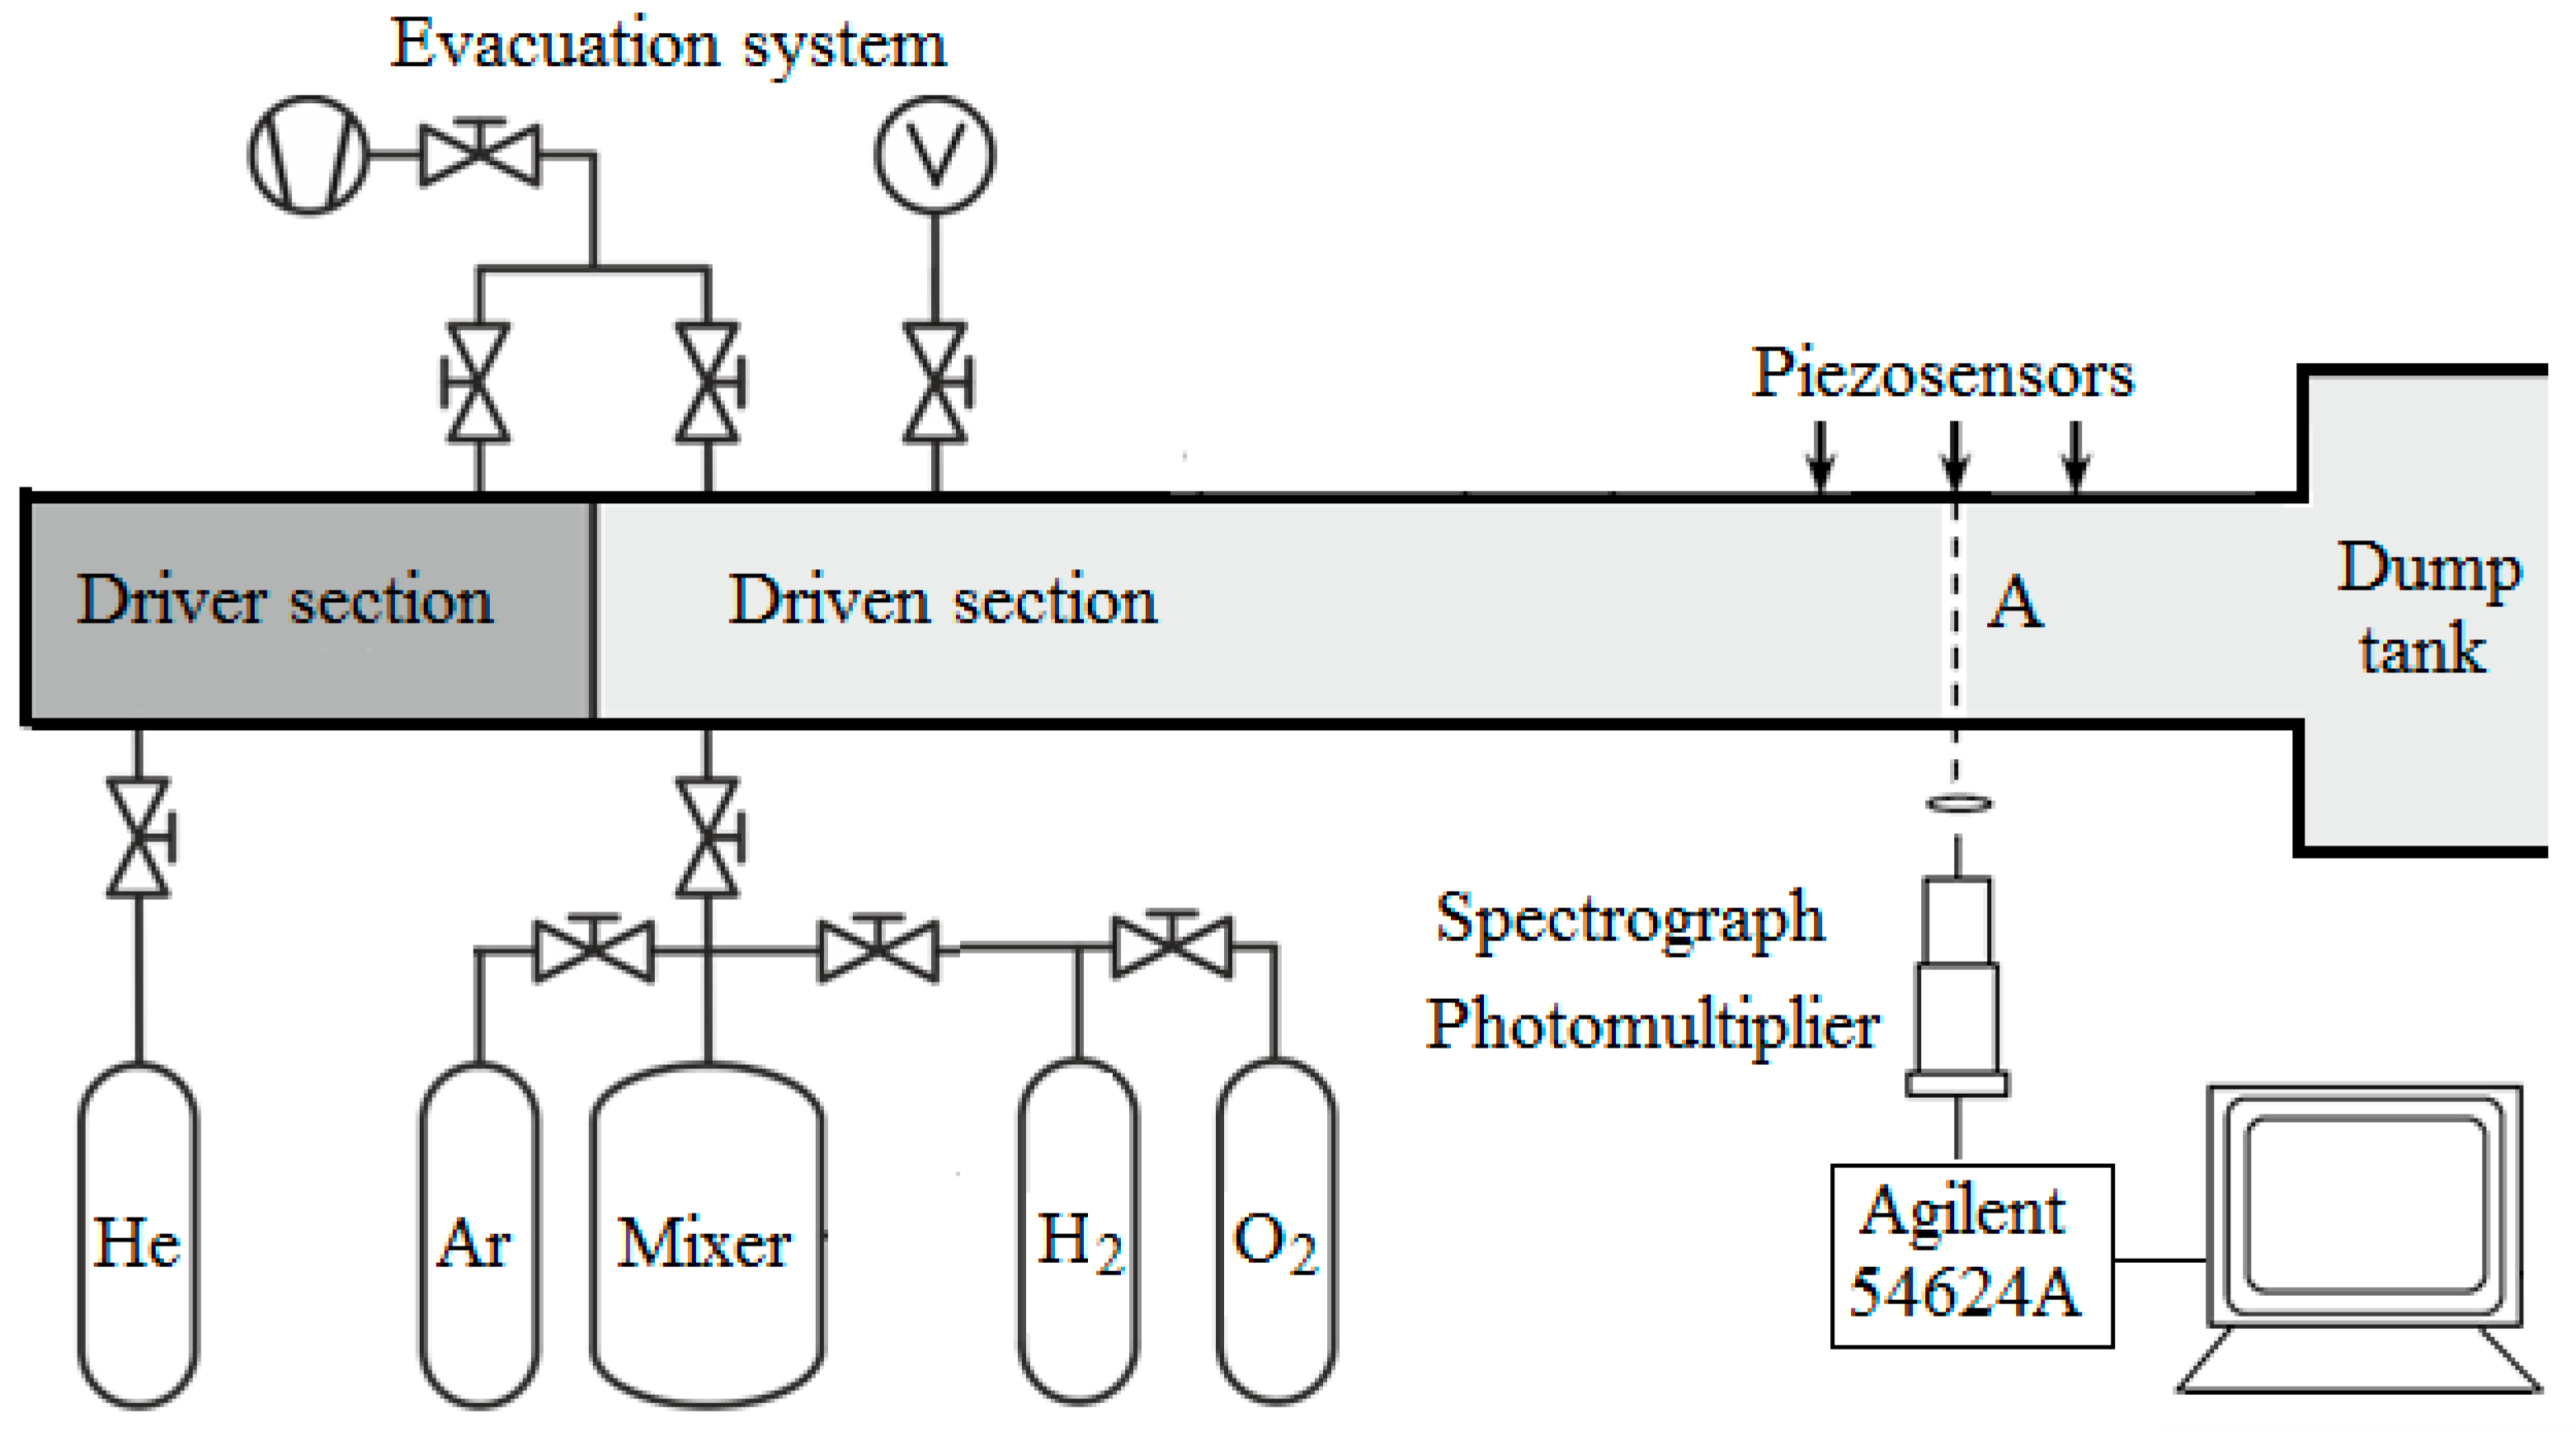
Figure 1. Diagram of the shock facility.
Fire 06 00435 g001
Figure 2. Time scans of pressure and the OH* emission in measuring section A.
Fire 06 00435 g002
Figure 3. Ignition delay times τ measured at various equivalence ratios and dilution degrees.
Fire 06 00435 g003
Figure 4. Comparison of the experimental results in this work with Hu et al.’s [15] measurement data obtained under the same conditions.
Fire 06 00435 g004
Figure 5. Comparison of this work results with the data in Ryu and Hwang [32].
Fire 06 00435 g005
Figure 6. Values of τpS calculated from the results of measurements in this work at arbitrary compositions. The lines are approximation curves.
Fire 06 00435 g006
Figure 7. Dependence of the value τpS on the equivalent ratio ϕ at T = 1200 K.
Fire 06 00435 g007
Figure 8. Experimental data of Ryu et al. [32] and Jachimowski et al. [33], recalculated for the dependence of τpS on temperature.
Fire 06 00435 g008
Figure 9. Ignition delay times τ at various pressures: squares are data from ref. [13]; circles are data from this work.
Fire 06 00435 g009
Figure 10. Experimental data of Herzler and Naumann [13], recalculated for the dependence of τpS on temperature.
Fire 06 00435 g010
Figure 11. Dependences of ignition delay time τ and the time of the contact surface arrival to the measuring section τcont on temperature. Lines are approximating curves.
Fire 06 00435 g011
Disclaimer/Publisher’s Note: The statements, opinions and data contained in all publications are solely those of the individual author(s) and contributor(s) and not of MDPI and/or the editor(s). MDPI and/or the editor(s) disclaim responsibility for any injury to people or property resulting from any ideas, methods, instructions or products referred to in the content.