Abstract
While operational fire severity products inform fire management decisions in Grand Canyon National Park (GRCA), managers have expressed the need for better quantification of the consequences of severity, specifically forest structure. In this study we computed metrics related to the forest structure from airborne laser scanning (ALS) data and investigated the influence that fires that burned in the decade previous had on forest structure on the North Rim of the Grand Canyon in Arizona. We found that fire severity best explains the occurrence of structure classes that include canopy cover, vertical fuel distribution, and surface roughness. In general we found that high fire severity resulted in structure types that exhibit lower canopy cover and higher surface roughness. Areas that burned more frequently with lower fire severity in general had a more closed canopy and a lower surface roughness, with less brush and less conifer regeneration. In a random forests modeling exercise to examine the relationship between severity and structure we found mean canopy height to be a powerful explanatory variable, but still proved less informative than the three-component structure classification. We show that fire severity not only impacts forest structure but also brings heterogeneity to vegetation types along the elevation gradient on the Kaibab plateau. This work provides managers with a unique dataset, usable in conjunction with vegetation, fuels and fire history data, to support management decisions at GRCA.
1. Introduction
Fire, as a disturbance, is a key driver in the diversification of forested ecosystems in terms of forest structure and species response [1]. Fire is a fundamental disturbance process globally; spatio-temporal expressions of fire events equate to the fire regime of a specific landscape, which are net effects on the landscape based on the type, intensity, size, and frequency of fire [2,3]. The mosaic of fire severity types within the landscape can be considered the driving force behind forest structure, as absence of disturbance would end in the expected result of a steady-state condition [4].
Embedded within fire regimes is the expectation that most forested lands in the western U.S. are composed of mixed-severity burns [5], where a single fire event will exhibit a range of patterns, intensity, severity, and disturbance interactions that affect how fire propagates across a landscape [6]. At either extreme of severity are low severity areas indicative of frequently burned systems and high severity or stand replacing events [7]. We posit that the expected severity of fire should result in predictable patterns of forest structure across a landscape.
The inclusion of fire as a process is critical in management of many ecosystems. For instance, xeric and low elevation southwestern ponderosa pine (Pinus ponderosa) rely on fire rotations of 5–7 years to curtail rapid regeneration of ponderosa pine or shade tolerant species. If this rotation is left unabated, either shade-tolerant species will replace the ponderosa pine as the dominant overstory species or a higher density of small diameter trees may be the result [8,9,10]. Low severity fires remove the most flammable surface fuels and have limited effect in regards to overstory mortality [10,11]. In contrast, many systems have extended fire rotations of greater than 50 years that allow for accumulation of fuels and maturation of the overstory that result in an expected high-severity fire under extreme weather [12] that inevitably paves the way for type conversion and reset of successional stages [10]. Within the center of these extremes there are high proportions of mixed severity fire that impart a rich mosaic of burn patterns that are driven in part by weather, interactions with previous disturbance patterns, seasonality, and size of patches [6,10,13,14]. Mixed severity fires typically encompass a broad moisture gradient dependent on elevation and patchiness [15,16,17]. Mixed-severity fires can include frequently-burned systems where islands of structure classes with higher proportions of regeneration exist within generally grassy understories, or can be dependent on climate-vegetation interactions that are temporally and spatially variable [17,18].
The cycle of severity and structure is of interest to natural resource managers [19]. In Grand Canyon National Park (GRCA), resource managers are likely to have some forest structure metric as part of their treatment objectives, while using severity to gauge the impact of fire on the landscape. Fire severity is often stated as an objective, commonly as desired percentages/outcomes in various severity classes, but it is really the resulting structure that matters most. Fire severity is a tractable measure, but only of value when evaluating a specific response such as changes to vegetation [20]. Fire severity is easy to quantify using the differenced Normalized Burn Ratio (dNBR) [21] and this is done frequently at the GRCA and throughout the United States of America (USA), through programs such as Monitoring Trends in Burn Severity (MTBS).
The crossroads between severity and structure that this project provides will give managers another tool when making decisions on how to manage a fire. If the current forest structure is more likely to lead to a fire that leaves a severity that yields an undesirable structure, a different fire management strategy might be considered.
In the GRCA the presence of the Mexican spotted owl (Strix occidentalis lucida) and northern goshawk (Accipiter gentilis) gives impetus for a closer look at the nexus of fire severity and forest structure. Large high severity patches in the mixed conifer type are considered undesirable in the GRCA due to concern for these species, and are regulated and monitored annually by the United States Fish and Wildlife Service (USFWS). High-severity fire has a negative influence on potential Mexican spotted owl habitat [22]. The northern goshawk is a sensitive species [23], which is believed to need dense, old growth forests. The real concern for both species is the structure left by high-severity fire. Both birds prefer forests that have a complex structure that has not been impacted by a recent high-severity fire. Each relies on habitat with heavy canopy component that includes both standing dead trees and a large down woody component. The impact of low severity fires on habitat is likely low, due to the lack of involvement of canopy fuels. Thus, a combination of quantified severity/structure relationships and fire spread modeling informs decision makers as to whether a fire is predicted to move into an area where high-intensity fire will leave a forest structure that is not a desirable habitat for these species. Given a crossroad of severity to structure, managers will be better able to make informed decisions as to where to allow fire to burn and where to keep fire out of, or to take management actions, to limit severity given these types of habitat constraints and considerations.
The term forest structure is often used to describe some characteristic of the spatial distribution of biomass in forested vegetation, both vertically and horizontally. Different researchers have derived and used several metrics to quantify forest structure [24,25]. The importance of a specific structure metric varies, depending on the effect on other variables that are of interest. For example, Mexican spotted owl habitat ratings may require dense stands of trees with few openings, while ponderosa pine regeneration requires open area with sunlight. These are both desired land management options on the North Rim, and illustrate the need of each objective requiring potentially different structure metrics.
Managers need classification systems using biologically-significant vegetation characteristics (e.g., structural conditions) to achieve many of their land management objectives [26]. Modeling and remote sensing show significant potential for producing map products that describe the structural and seral components of western coniferous forests. For example, Franklin et al. [1] outlined structural and development stages of forests that are dependent on factors, such as disturbance, regeneration, canopy stage, and competition; they identified a gradient of forest structure development stages of forest structure over time resulting from a disturbance. Mapping of structural and seral components of western coniferous forests has utilized modeling and remote sensing. For example, [27] used a combination of Landsat Thematic Mapper imagery and nearest neighbor gradient modeling to produce spatially explicit data in species composition and structure across coastal Oregon, USA. The benefits of comprehensive and spatially explicit data products that represent a wide compendium of structure types may alleviate the under-sampling of forests that has occurred in the Western United States and help inform managers and influence decisions regarding expected fire behavior and effects [28]. Sensors, computing resources, and data products that can provide these types of information are becoming more readily available and cost-effective.
Airborne laser scanning (ALS) collects three-dimensional height and reflectance data that provide multiple scaling lanes and outputs, such as a 3D point cloud, that are well poised to estimate structural components of forest through the development of predictive models [29,30]. ALS data have been used to estimate crown bulk density [31,32], stem volume [33], basal area and stem density [34], canopy cover [35], and forest structure [36,37]. Previous studies have specifically demonstrated the efficacy of describing structural characterization as multiple layers of forest structure [38], canopy structural variables (e.g., tree height, crown dimensions, and cover) for Douglas fir (Pseudotsuga menziesii) [39], and forest succession patterns using a rule based classification with ALS-based metrics [40]. Kane et al. [28] utilized ALS estimates of canopy cover as a proxy for structure to relate trends in fire severity as a function of proportional cover.
In this study, we use ALS data collected across the entire North Rim of GRCA to generate forest structure classes (using methods described by Rowell et al. [24]). We compare structural classes with Landsat-derived fire severity (see Section 2.2 for a description) over a twelve-year period for a range of topographically driven species configurations (essentially ponderosa pine, mixed-conifer, and spruce-fir forests) common on the Kaibab Plateau. We use these data and methods to investigate the kinds of stand structures that result from variation in previous fire severity. The goal of this study is to assess the impact that fire severity has on forest structure. We accomplish that goal through the following by first deriving an ALS based forest structure model. In addition, we compare previously published fire severity and other relevant landscape variables to quantify variability in the relationship between fire severity and forest structure.
The specific research questions we address are:
- What is the variability in forest structure on the North Rim of the GRCA?
- What are the most significant variables in a high performing structure model?
- How do structure variables explain variation in previous fire severity?
- What other landscape parameters explain variation in the relationship between severity and structure?
With the results from a study such as this, managers can start to think about the landscape in a holistic context that includes a third dimension of forest structure in a vertical sense, which has interdisciplinary impacts. If forest structure and severity relationships can be derived, managers can begin to make fire management decisions that will promote the overall desired forest structure distribution across the landscape through time.
2. Materials and Methods
2.1. Study Area
The North Rim of Grand Canyon National Park is located on the southwestern edge of the Colorado Plateau in Northern Arizona (Appendix A), and encompasses over 38,400 ha. Wildfires are a frequent disturbance and predominantly occur above the edge of the North Rim, mainly during the summer months, while an aggressive prescribed fire program accounting for a significant amount of fire over the pine dominated peninsular regions. Vegetation on the Rim follows elevation and moisture gradients, ranging from xeric at low elevations to mesic at higher elevations. Elevations range from 2200 m to 2800 m over a distance of approximately 35 km. Woodlands dominated by pinyon pine (Pinus edulis) and juniper (Juniperus scopulorum or J. deppeana) exist along the dry southern tips of the peninsulas. Ponderosa pine covers much of the mid-peninsulas and transitions into a dry mixed-conifer vegetation type, which includes white fir (Abies concolor) and ponderosa pine in the mid-range elevations. Forests dominated by blue spruce (Picea pungens), Engelmann spruce (Picea engelmannii), and white pine (Pinus strobiformis) occurs at the highest elevations [41].
Wildfires and prescribed fires have occurred over much of the North Rim, with locations dominated by the ponderosa pine and mixed-conifer having multiple fires—and the accompanying mix of severities—since the early 2000s. These disturbances have caused changes in fuel loadings and vegetation—including structure, composition, and distribution—both spatially and temporally [42,43], especially in those portions of the landscape dominated by ponderosa pine or where mixed-conifer transitions to ponderosa pine. The higher-elevation mixed conifer and spruce-fir forests have not seen as many fire entries. The longer fire rotation in these forest types does not diverge from the expected natural fire regime, which is greater than in the ponderosa pine forests [43,44]. The fires in the mixed conifer forests are characterized as mixed severity; that is, they contain low and moderate severity patches interspersed with usually smaller areas of high severity [45]. Southern aspects may see a higher frequency of low intensity fire, while northerly aspects see fewer fire events having more and larger, high severity patches.
2.2. Monitoring Trends in Burn Severity
To aid in fire management decisions, GRCA fire staff use burn severity data derived from the Monitoring Trends in Burn Severity (MTBS) project [46]. Pre- and post-fire differences in vegetation (and the degree in which they differ) within a fire perimeter are evaluated and interpreted as the severity with which a fire burned; severity is then classified into five classes. MTBS data are Landsat-derived and have a spatial resolution (pixel size) of 30 m. MTBS data are based on the differenced Normalized Burn Severity Ratio (dNBR). The dNBR is the calculated difference between a pre-fire and post-fire normalized burn ratio (NBR). The NBR uses Landsat channels 4 and 7 to assess changes in moisture and chlorophyll in the vegetation. A larger dNBR indicates a larger change in the vegetation due to the fire that occurred in between pre-fire and post-fire Landsat collects. Within GRCA all fires greater than 60 ha (150 ac) have been mapped using this method. GRCA fire ecology and GIS staff have performed field-based calibrations (e.g., Composite Burn Index (CBI)) for every fire and severity class, and linear regression shows that the adjusted severity class thresholds have an r2-value of 0.85 or greater. This study uses fires that occurred between 2000 and 2012 on the North Rim of the Grand Canyon within the park boundary, because for these fires National Park Service staff have validated the severity classifications using field-verified CBI plot data.
2.3. Airborne Laser Scanning
In 2012, the U.S. Forest Service collected ALS across the entire Kaibab Plateau, including the North Rim area of the GRCA. Using a Leica ALS50 Phase II and an ALS60 (Leica Geosystems AG, Heerbrugg, Switzerland), an average pulse density of ≥8 pulses/m2 was achieved, with 4 returns maximum per pulse, and with an opposing flight line side-lap of ≥50% (≥100% overlap) to reduce laser shadowing. To reduce laser shadowing, the maximum scan-angle was ±15° from nadir. Areas below the rim edge of the park were not collected as the angle of incidence was too extreme. Post-acquisition processing included manual and automated techniques, which yielded a bare earth model (e.g., digital elevation model (DEM)) and classified first returns. A complete description of this airborne laser scanning (ALS)-derived dataset can be found in [47,48].
2.4. Forest Structure Classification
We derived our forest structure metrics from data acquired during the 2012 ALS flight [47,48]. The ALS data from this flight were processed in LAStools [49], and presented as raster layers which summarize many characteristics of the data. An ad hoc ANOVA of alternative pixel sizes resulted in the selection of a 20-meter cell size for the rasters because the variability within pixels was smallest, while the variability between pixels was larger than in other pixel sizes. This matches previously published scales of structure variability [50,51,52].
We used the ALS data to produce an ordered three-tiered structure classification that incorporates horizontal and vertical arrangement of vegetation [24], and a surface roughness metric [53] that characterizes variability in surface fuels. Previous work shows frequent application of horizontal and vertical structure metrics—typically generated from area-based averaging techniques [50]. Surface roughness is independent of vegetation type or cover class. Together, these three forest structure components serve as indicators of the fuel distribution in a forest. Surface roughness indicates the distribution of surface fuels less than two meters above the ground. The vertical distribution indicates whether ladder fuels are present and would allow fire to transition into the crowns. The horizontal distribution indicates the connectivity of fuels in the overstory. The canopy cover is computed as the number of first returns above the cover cutoff divided by the number of all first returns and is output as a percentage. Structure classes were defined using horizontal thresholds for canopy cover (<35%, 35–65%, and >65%) and vertical breaks between standard deviation of the ALS canopy height model (Standard Deviation <4.5 m and ≥4.5 m). This method yields six structure classes representative of the overstory canopy. Fire as a process is dependent on the availability of surface and aerial fuels that drive the flaming front across a landscape. We segmented the landscape to incorporate the influence of surface fuels. Using a surface roughness calculation technique [53], we define three surface roughness classes using the standard deviation in height of vegetation below 2 m (<0.25 m, 0.25–0.5 m, and >0.5 m). These classes are representative of low grassy fuels, moderate height fuels with intermixed shrub and conifer regeneration, and taller shrubs and conifer regeneration. The resulting structure classification schema included canopy cover, vertical variability, and surface roughness.
The structure classes we developed, which included the horizontal, vertical, and surface distribution of biomass, are intuitive and easily communicated. Three horizontal classes, two vertical classes and two surface roughness classes yielded 18 structure classes (Table 1). Each structure class is identified with a three-digit code. The first digit represents the horizontal canopy connectivity class and ranges from 1 (low connectivity) through 3 (high connectivity). The second digit is the vertical connectivity class within the canopy, either a 1 (low) or a 2 (high). The third digit is surface roughness class that ranges from 1 (low roughness or “smooth”) through 3 (high surface roughness or “textured”). For example, a pixel with a structure class code of 111 represents a location that has no canopy connectivity, no vertical connectivity and a low surface roughness (i.e., an open grassland). A structure class designated as 323 has more than 65% canopy closure, a greater than 4.5 standard deviation in height distribution, and a high surface roughness.

Table 1.
Combinations of LAS derived structure metrics are used to create a forest structure classification.
2.5. Additional ALS and Secondary Variables
Seven ALS-based metrics were created for each 20 m pixel: mean canopy height, standard deviation of canopy height model (>2 m), maximum height, percentage canopy cover, crown base height, canopy bulk density, and surface roughness as a stand-alone metric. ALS-derived metrics were calculated using a software application written in IDL (Interactive Data Language) developed at the National Center for Landscape Fire Analysis (NCLFA) called LAS Utility. This tool extracts canopy base height (CBH) for each 20 m cell [24,32]. It also extracts the vertical distribution of canopy material via height distribution from the canopy height model [24,54] assessing for modalities that allow for discrimination of structure classes. Additional derivative metrics generated include mean canopy height, 95th percentile height, which typically corresponds with dominant tree height [32], and canopy cover [35].
Beyond the biotic structure metrics, we add six other pixel-based metrics that could have an influence on structure. These include time-since-fire, elevation, aspect, slope, life form, and forest type. Time-since-fire was derived from the GRCA fire history atlas, using annual fire perimeters aggregated into a single database to spatially and temporally identify area burned. The topographic data were derived from the ALS derived 10 m digital elevation model. The alliances, life form, and forest type we used are from the 2012 GRCA vegetation data layer. The vegetation layer was developed for the GRCA, by a contractor, following the National Vegetation Classification Standard [55].
Our work used a random forest approach [56,57] to quantify variable performance. The random forest exercise uses node purity to see how the structure, topography, and time-since-fire variables explain variation in dNBR. Our random forest analysis includes individual (e.g., slope or canopy cover) and combinatorial variables (three-element structure). We derived an independent ALS-based structure classification; and we applied the additional six landscape parameters to help explain structure occurrence. The goal was to quantify landscape variables that have the highest explanatory power by assessing structure that resulted from previous fire. Our logic is two-fold, that fire is the active agent of structure modification in the GRCA and that operational severity maps are commonly available while ALS acquisitions are not. Therefore, the ability to use severity of a previous fire to inform current forest structure will enhance our ability to assess effects of fire in the context of fire program management objectives. We used node purity as measured by Gini Index, which is the difference between the residual sum of squares before and after the split on that variable, to assess the variables.
We also present partial dependence plots for each variable to assess the changes brought by fire severity on each individual metric. A partial dependence plot shows the influence of each variable, as if all other variables were held constant. Partial dependence plots, based on results from the random forest analysis, show the mean marginal influence of the explanatory variables on the differenced normalized burn ratio.
3. Results
3.1. Tabulating Forest Structure
There are six structure classes that make up 87% of the study area (see Table 2). Structure class 321 (14%) is indicative of multi-age ponderosa pine forests with frequent low severity fires, which inhibits regeneration resulting in a low surface roughness metric. The 321 class is most often found in the ponderosa pine forests on the lower elevation peninsulas. Structure class 322 (29%) is found in the mixed conifer forests, at higher elevations. This class also consists of ponderosa pine forests that have not burned recently, resulting in increased vertical complexity and surface roughness due to higher retention of regeneration and succession of Abies concolor and Pseudotsuga menziesii. Class 323, a complex structural condition, (13% of the burned landscape) is dominant in the mixed conifer forests, at the higher elevations of the Kaibab plateau, where fire return intervals are longer, resulting in potential patches of high-severity fire under 90th percentile fire conditions [43].
Table 2.
The six most common classes (in grey) that occur on the North Rim cover 87% of the study area, the remaining eleven classes cover the other 13%. Those same six structure classes populate the majority of the area that burned in the period.
Figure 1 shows pictures of typical stand structures for the six dominant structure classes, as well as scaled cylinders that show the proportion in each of the three strata. Ponderosa pine stands exhibit two frequently occurring structure classes: class 321 is a closed canopy stand with little surface roughness and class 322 has a regeneration component that yields a higher surface roughness.
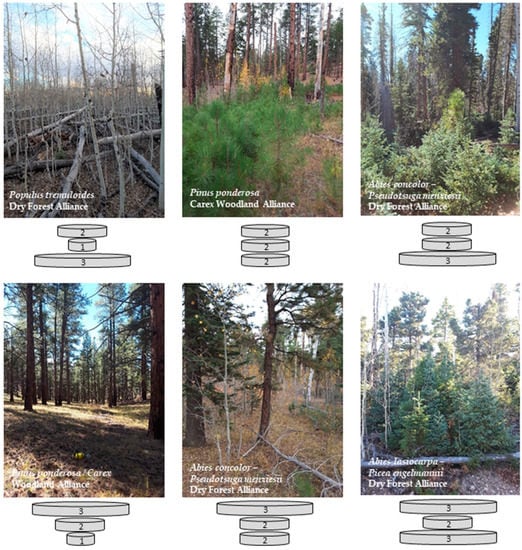
Figure 1.
Distributions for 213, 222, 223, 321, 322, and 323. The upper cylinder indicates the canopy cover, the middle cylinder indicates the vertical structure, and the bottom cylinder shows the amount of surface roughness. Photos show examples of structure classes in certain common vegetation types. For example; structure class 213 shows a typical aspen stand, post high-severity fire.
Figure 2 and Figure 3, and Table 3 show severity and structure totals for the six most dominant structure classes mapped for the study area. Figure 2 shows that low severity fire is more common than high-severity fire, especially in the two most common structure classes 321 and 322. Class 213 frequently follows high-severity fire.
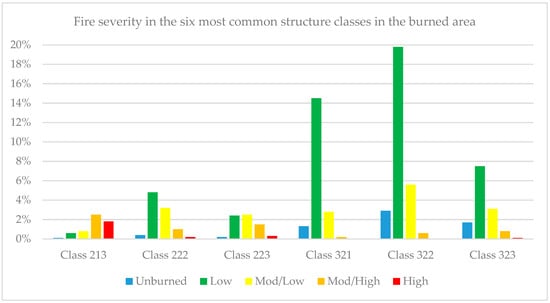
Figure 2.
Fire severity in the six most common structure classes in the burned area. The Grand Canyon fire staff adjusted the original MTBS default severity class thresholds to match the CBI field data for each individual fire.
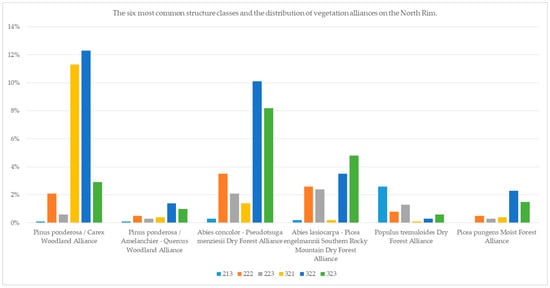
Figure 3.
The six most common structure classes and the distribution of vegetation alliances on the North Rim.
Table 3.
Severity proportions by vegetation alliance. The Grand Canyon fire staff adjusted the original MTBS default severity class thresholds to match the CBI field data for each individual fire.
As shown in Table 3, no one structure class is exclusively found on one vegetation alliance, but some structure classes are more dominant than others. Class 321 is predominantly found in ponderosa pine noting that the second most prevalent structure class in ponderosa pine is class 322 which has a slightly higher surface roughness. Note too that class 322, the dominant class on the North Rim, is found in both ponderosa pine and white fir. Class 323 is often found in both fir dominated alliances. Class 213 is common in post-fire aspen forest where fire has removed the conifer overstory.
Reference to Table 3 shows the same vegetation alliances as displayed in Figure 3, here summarized relative to fire severity. Ponderosa pine is host to a lot of low severity fire. Spruce sees little fire, but often converts to aspen after high-severity fire. Aspen takes over after high-severity fire, taking advantage of the opportunities provided by the removal of the conifer canopy and its ability to regenerate through sprouting.
The remaining three most common structure classes have moderately open canopy cover, but comparatively high levels of sub-canopy regeneration (213, 222, and 223). The classes consisting of multi-aged stands with moderate overstory and relatively high levels of regeneration (222 and 223 (10% and 7% of the total burned area, respectively)) are both predominantly found in the mixed conifer and spruce-fir forests, especially where fires have burned with a mixed severity pattern. Structure classes 213 (6%) and 313 (3.5%), are often found in aspen stands, following high-severity fire. The typical aspen stand shown in Figure 1 (class 213) shows a preponderance of surface fuels. In addition to the new sprouts, the aspen stand also contains a large amount of dead-and-down material (thus the last digit in the structure classification is a “3”). All other structure classes are rare (<5% each) following fire the North Rim of the Grand Canyon and remain proportional to the overall structure totals for the Rim (when unburned area is considered).
3.2. Maps of Severity and Structure
Figure 4 (Fire Severity) and Figure 5 (Structure) show at a landscape scale the spatial correspondence of severity and structure. For the peninsulas at the southern edges of the study area, fire frequency is high, severity is almost always low, and the dense overstory dominates stand structure; expected given that fire regime. As shown by Hoff et al. [45], high-severity patches typically appear relatively small and widely spaced. Conversely, at higher elevations to the north, in a mixed conifer land cover type, there is greater variability in severity, and this landscape in turn has more variation in structure. A notable exceptions are the Outlet fire (2000) and the Poplar fire (2003), which have relatively large proportions of high-severity fire. When severity is summarized and tabulated for the six dominant structure classes (Figure 2), we see that fires overall in the period were frequently low severity fires, with the largest changes in structure occurring in denser, higher elevation stands that resulted in an increase in surface roughness and in general a decrease in canopy cover.
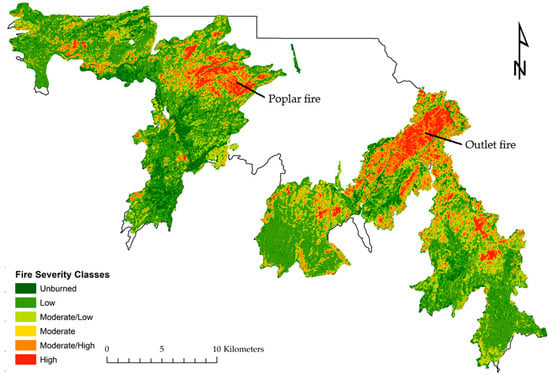
Figure 4.
Map of fire severity for the North Rim of the Grand Canyon, based on MTBS data. These areas burned between 2000 and 2011. There is an increase in the amount of high-severity fire when moving north, up the elevation gradient, into the mixed-conifer and spruce-fir forests. The ponderosa pine forests on the southern peninsulas have seen less high-severity fire.
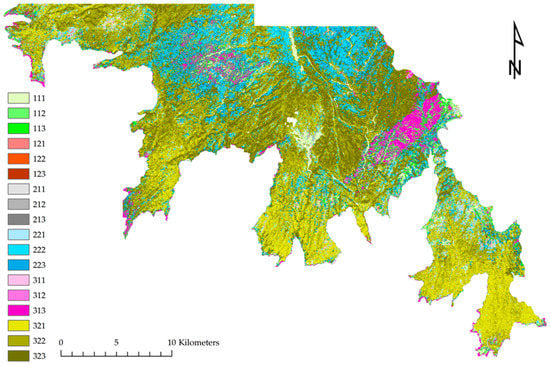
Figure 5.
Structure classes on the North Rim of the Grand Canyon. Classes 321 and 322 are dominant on the lower elevation peninsulas. Areas that are dominated by post high severity aspen stand out as class 313. Grassy areas are all classified as 111.
3.3. Random Forests: Gini and Partial Dependence Plots
Random decision forests reveal the power of each explanatory variable when using fire severity as the dependent variable. The Gini index shows that the most powerful explanatory variable is the structure class that includes both horizontal and vertical canopy metrics, as well as surface roughness (Figure 6).
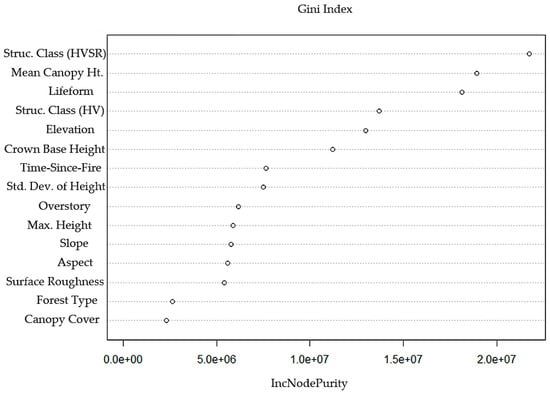
Figure 6.
The “IncNodePurity” is used to evaluate to explanatory power of variables from the 20 m rasters based on the fire severity of a previous fire. The 3-digit structure class (HVSR; horizontal-vertical-surface roughness) and mean canopy height are influenced the most by previous fire severity. The structure class that includes only horizontal and vertical components (HV) had a weaker relationship with fire severity. Variables are ranked from most important at the top to least at the bottom.
We used two categories of independent variables; ALS-derived area-based metrics, as well as a separate set of landscape variables (elevation, slope, aspect). Literature shows frequent use of horizontal and vertical metrics from ALS [48]. We produced a HV (horizontal-vertical) model that only included the canopy cover and vertical variability described in the HVSR model. While the HV model showed high node purity we chose to include a surface roughness metric [54] to distinguish between gradients of fire (e.g., frequent or absence of fire). As expected the inclusion of surface roughness included in the HVSR (horizontal-vertical-surface roughness) model has demonstrated the highest node purity and predictive power. While focused on the ALS HVSR structure model, we note that other landscape variables are also useful in explaining previous fire severity; notably elevation and life form and while these had individual node purity they performed less well (and are less efficient) than the ALS-derived HSVR model.
Mean canopy height, the simplest of all ALS metrics, turns out to be a strong explanatory variable as well, especially in finding high severity patches, where significant shifts in height in the canopy occur due to high overstory mortality. This indicates that the vegetation height either did not change due to fire, or the vegetation was consumed in a high-severity fire and started growing from the ground up through sprouting or from seed. This results in a binary relationship wherein either the overstory is burned off (high severity) or there is no net change (lower severity). Overstory vegetation height is almost never partially reduced on a per 20 m pixel basis.
Examination of the partial dependence plots shows (the mean marginal influence of dNBR) how change in dNBR lead to change as a function of one variable (e.g., mean canopy height) while holding everything else constant. Here we present seven partial dependence plots (mean canopy height, lifeform, crown base height, surface roughness, elevation, time-since-fire, and structure class) that help explain structural response to fire. While the 3-factor structure model is uniquely derived from the independent ALS data; vegetation response following fire can be further understood across a range of variability based on the other stand metrics.
Following high-severity fire the mean canopy height was much lower (Figure 7). Vegetation, presumably new growth following a high-severity fire was almost always less than seven meters tall. The crown base height (CBH) declines from 6 m to 0 m with increased severity. Low severity fires have very little effect on CBH, as indicated by the almost horizontal line in Figure 8. The strong relationship in tree height and fire severity has been previously modeled in the Northern Rockies [58].
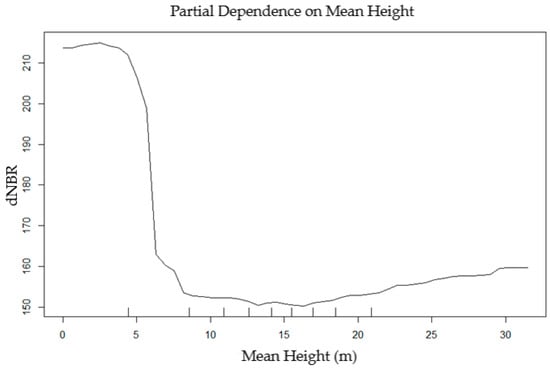
Figure 7.
Mean canopy height of a 20 m pixel is likely to be below 7 m following fires with the highest severity. The dNBR was likely 60 points higher in shorter vegetation.
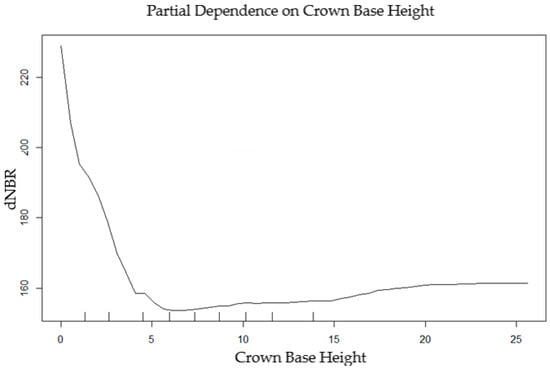
Figure 8.
High-severity fire is followed by lower crown base heights. This is related to the low mean canopy height after high severity.
In contrast to mean canopy height and crown base height, surface roughness is higher following higher severity fires (Figure 9). This is due to the increased availability of light and water, after thermal and/or combustion based removal of the overstory which allows for vigorous growth on the surface as well as possible recruitment of coarse wood into the surface fuel bed. Aspen, conifer regeneration, gambel oak (Quercus gambelii), mahogany (Cercocarpus spp.), locust (Robinia neomexicana), and herbaceous species all take advantage of the reduced competition for these limited resources (Figure 10). This coincides with an increase in surface roughness.
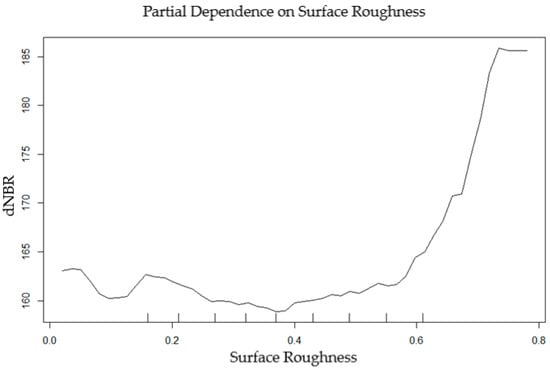
Figure 9.
High severity is followed by higher surface roughness. This is due to regeneration and brushy vegetation that follows high-severity fire.
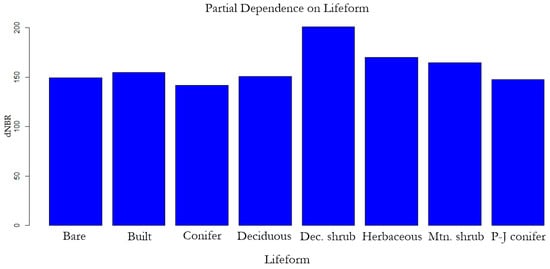
Figure 10.
Deciduous vegetation with a shrub stature follows higher severity fire. Aspen, locust, mahogany, and gambel oak dominate the shrub lifeform category. This coincides with a higher surface roughness. Pinyon-juniper (P-J) is found near the canyon rim, in more xeric locations.
Partial dependence plots illustrate the relationship between fire severity and elevation (Figure 11). The lowest elevation has pinyon-juniper forests, the bottom of the curve with low severities falls in the elevation where ponderosa pine dominates. Higher severities occur in the mixed conifer and spruce-fir dominated forest types at the highest elevations of the Kaibab plateau.
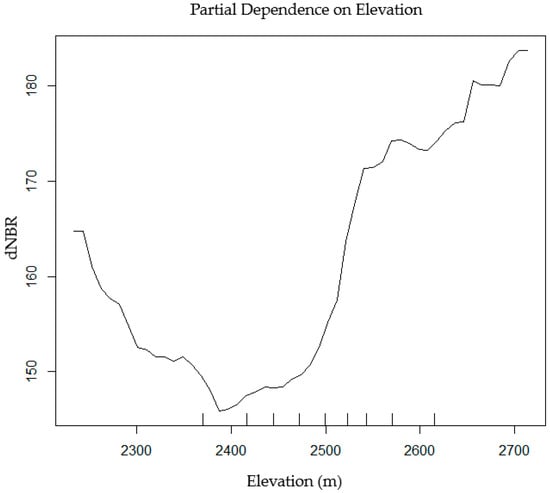
Figure 11.
The likelihood of encountering high fire severity increases along the elevation gradient. There was also more high severity in the pinyon-juniper forest cover class near the rim, but the area that burned was relatively small in this vegetation type.
The proportion of high severity increases with increase in elevation, from the ponderosa pine forests near the rim to the spruce-fir forests at top of the Kaibab plateau. The precipitation and temperature gradient that occur along the elevation gradient influences vegetation structure [41]. We found that the structure classes that follow the range of fire severity classes change accordingly with elevation gain.
Analysis of partial dependence for all structure classes across the range of severity (dNBR) shows that canopies are more closed following low severity fire, while the canopy is more open after a high severity burn (Figure 10). Since the first six structure classes (111–123) occupy such a small percentage of the study area, differences in structure following fire are harder to resolve. In the more dominant, remaining classes, increasing severity shows a consistent increase in surface roughness.
Our period of analysis is 12 years of fire severity data. Low severity areas burn more often, thus have a shorter time-since-fire on average. The partial dependence plot for time-since-fire (Figure 12) shows that fires with a lower time-since-fire burned with lower fire severity. A smaller time-since-fire, which can be seen as a higher fire frequency, points to the fires on the peninsulas that burn in ponderosa pine, where surface fuels are mainly involved. Some of these sites burned twice, providing additional evidence that low severity perpetuates low severity. The Outlet (2000) and Poplar (2003) fires burned in mixed conifer, have largest areas of high-severity fire, and happened early in the analysis period.
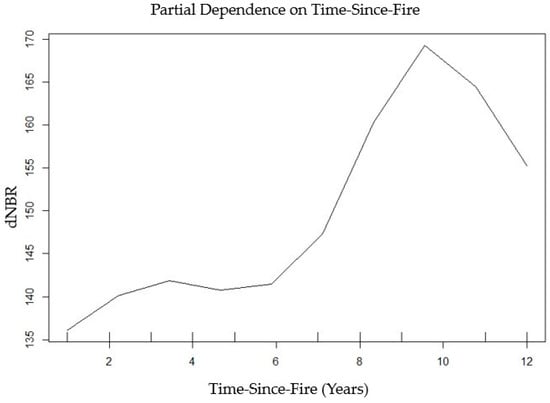
Figure 12.
Partial dependence plot showing the influence of time-since-fire.
The partial dependence plot (Figure 13) for the 18 structure classes we developed shows that the classes with a high canopy cover are often following low severity fire. The classes with a high surface roughness follow higher fire severity. This forest structure classification was the best variable for explaining previous fire severity.
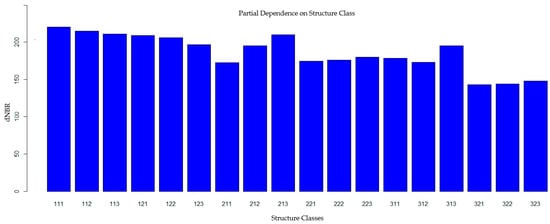
Figure 13.
The structure classes with a high surface roughness are more likely to have been preceded by higher fire severity. The closed canopies of 321, 322, and 323, found on the peninsulas in the ponderosa pine forest have the lowest likelihood of following a high severity event. While 213 and 313 frequently follow high-severity fire.
4. Discussion
Our primary objective was to produce a simple and viable structure classification over large areas of the GRCA, which would encompass a range of structure types that reflect the role of fire on the landscape. It is intuitive that fires impact forest structure and that in turn forest structure has an impact on fire behavior. Our results consistently show that a structure classification that includes the horizontal distribution of biomass, the vertical distribution of biomass and the amount of biomass in the two meters closest to the ground provides a strong explanatory variable as regards the relationship between fire severity and subsequent forest structure. The HVSR structure classes we developed explain the majority of North Rim of the GRCA, as these classes capture three dimensions of vegetation distribution. This approach links well with fire severity, functionally a measure of change in a vegetation type, affecting each of the horizontal, vertical, and surface metrics distinctly. The combination of these three components allows us to capture the variability of the effects of severity in each structure type, for example the 213 class representing a result of high-severity fire in the mixed conifer that results in a lower stature regenerating forest structure 10–12 years after the disturbance. Our relatively simple approach to characterizing structure used the random forests-based analysis to demonstrate that there are quantifiable relationships between the HVSR classes and raw dNBR values provided by MTBS. Our method differs from previous random forest approaches that rely on large suite of individual ALS metrics to produce robust estimates of successional or structural forest traits [40,49]. These results demonstrate that the HVSR method alone accounts for the vast majority of forest structure and fire severity gradients at the study site. Specifically, the inclusion of binned surface roughness integrated into the classification significantly improves the predictive power of the approach to glean trends in fire severity. The traditional methods of using only ALS-based horizontal and vertical metrics perform no better than individual metrics, which alone is an interesting result.
Our second objective was to assess how fire severity influences forest structure on the north rim of the GRCA. We found expected gradients of structure that related to range of fire severity experienced at the GRCA. We used several variables that quantify forest structure to investigate the influence of fire severity, both patterns and proportions of each individual structural variable to capture the “arrangement” used for the combinatorial classification that includes both horizontal and vertical measures of biomass distribution. The horizontal connectivity between canopy fuels can influence the increase in size of high severity patches. A crown fire, where fire spreads through the canopy, will likely result in a high fire severity, i.e., a large change between pre-fire and post-fire forest biomass. In a forest where the surface fuels and the canopy fuels are vertically connected, i.e., through ladder fuels, fire has the opportunity to transition from the surface to the crowns. Structural dynamics at the GRCA are predominantly driven by low severity fire that has its largest manifestation in maintaining a surface fuel bed that has low surface roughness (lower fuel loads) while at the same time not changing horizontal and vertical continuity. Fire behavior that leads to higher fire severity retains biomass in a spatial configuration that is different from the biomass distribution that follows a low severity fire. A higher severity fire consumes more biomass and has a higher mortality in the overstory, while low severity fire that leaves much of the overstory unchanged and predominantly consumes biomass close to the surface [20]. Thus the influence of fire on various structure metrics is different. Within the time frame of this analysis, high-severity fire rarely occurred despite significant management concern for deleterious structural outcomes that would result.
Our third objective was to determine which structure metrics were most influenced by fire severity. The lower peninsulas burn frequently at low severity, in a classic ponderosa pine forest with a grassy understory. This is shown by the low surface roughness under a relatively dense canopy, where grass and needle cast are carrying the fire and perpetuating a low severity/high frequency fire return interval. In these systems, there are confined ranges of fire severity (low and moderate) suggesting that the prescribed fire rotations on the peninsulas produce a relative steady state of low surface fuels on the vast majority of ponderosa pine forests. Increases in elevation, result in a more heterogeneous spatial arrangement of structure classes reflecting a broader range of fire severity that is indicative of mixed-conifer conditions seen at increasingly higher elevations at the North Rim of the GRCA. The ecological transition from ponderosa pine to mixed conifer to spruce fir reflects the severity gradient seen in the HVSR classification. High-severity patches, where the intersection with heterogeneous canopy and surface fuels occur, are clustered at elevation ranges driven by white fire encroachment in ponderosa pine stands and the transition from ponderosa pine to mixed conifer stands [59].
Fire burns often, creating a mosaic of structure classes that follow a range of fire severities, and a dynamic aggregation of ecotypes and ecotones. The transition between mixed conifer and ponderosa pine represents the lowest elevation where patches of aspen show up. Structure changes are most pronounced in the small patches of high fire severity due to the associated removal of the canopy, the increase in surface roughness through an increase in shrubs, conifer regeneration, and woody debris from the dead trees and limbs falling to the ground.
The increase in aspen dominance following high-severity fire, indicated mostly by the 213 structure class, shows the need of fire to remove the coniferous overstory and to release the aspen through sprouting [60]. When an adequate bank of conifer seed is not nearby, the conversion to a more deciduous vegetation type is long lasting. There is a great deal of uncertainty whether these changes will lead to novel vegetation types [61] and structure classes in the long run. Large high-severity areas are rare, but are of significant interest, likely because of the visual changes. The forest structure in the areas after several years has very high surface roughness and even a high canopy cover, if the forest had enough time to grow over 2 m tall. Conifer regeneration, aspen, and other shrub types dominate these areas.
Our fourth objective sought to determine the distribution of HVSR structure classes and their relationship with the vegetation alliances found on the North Rim of the GRCA. The structure classes capture heterogeneity within and between vegetation types. Our data (Table 3) show that although certain classes are dominant in each vegetation alliance, smaller areas occur in other alliances. Interestingly, there are strong signatures of structure class combinations that align well with the vegetation alliances. For example, the Pinus ponderosa/Carex Woodland Alliance that is representative of frequently burned systems at the site were dominated by classes 321 and 322 reflecting the low surface roughness expected in such conditions. This configuration suggests that there are opportunities to leverage prescribed fire in the 322 class for this alliance to further reduce surface fuels that may promote higher severity fire. Additionally, we also found that there are structure classes that might represent multiple vegetation alliances, such as 322 partially representing a ponderosa pine overstory with increasing understory regeneration or a mixed conifer overstory with the similar understory regeneration type. The need for the vegetation alliance data to further distinguish the components of structure is clearly representative in the node purity of the lifeform variable in the GINI index (Figure 6) Our structure classes are explained by previous fire severity regardless of the vegetation. That said, vegetation type helps in translating the results to managers. It is easy to talk about vegetation and see the relationship of fire and structure as part of the successional path of a management unit. For example, where does the white fir encroachment in ponderosa pine change the expected low severity/high frequency regime to a mixed severity regime as is expected in mixed conifer? Using our structure classes managers can look beyond vegetation type and see the interplay of fire and structure in areas where a concern exists for the results of letting a fire burn. The influence of fire on structure, measured using our model; i.e., viewed via a quantitative method, adds decision support that is defensible and repeatable. New severity data can easily extend this work into the future. Further, in our study area, those areas that burn less frequently have a fire return interval (50–100+ years in mixed conifer and spruce-fir) longer than our current satellite record, and detailed ground-truthed severity data does not extend back past 2000. A more in-depth analysis is complicated by three factors; the short period of analysis, the lack of pre-fire ALS structure data, and the interval between fire occurrence and the ALS collect does not have any ecological significance. The ALS date is an arbitrary milestone. In spite of these limitations, the behavior of time-since-fire as a variable is rational and consistent with other findings. A longer period of analysis would allow for stronger inference, especially in vegetation alliances that burn less frequently. We expect that future ALS collections would allow for the 2012 ALS to become the baseline and be used as pre-fire collect. Then changes in the structure can be attributed to the fires that burned between the collects. Additional ALS acquisitions, although costly, would enhance our understanding of the relationships between time-since-fire, fire severity, and structure.
As a stand-alone variable, time-since-fire plays a large role in driving variation in surface roughness, even following low severity fires. Regeneration of the dominant species, immediate removal of dead and down, addition of new dead and down following delayed mortality, and recruitment in the herbaceous and shrub layers are all dynamic variables which change forest structure. The time frame of our data could be the cause of the 7 m height cut-off (see Figure 5). At the time of the ALS acquisition, the vegetation had not had time to grow taller than 7 m in the last twelve years, given a previous high-severity fire. It could also be surmised that most areas with a mean canopy height below 7 m burned with high severity in the last twelve years. A longer period of analysis would allow for stronger inference, especially in vegetation alliances that burn less frequently.
Thus it is important to recognize that while ALS-derived surface roughness greatly aids in separating classes of forest structure; similar structure “classes” do occur across a range of cover types, elevations, and life forms. Thus, while a crossroad of structural outcomes resulting from previous fire is rational, structure alone does not sufficiently elucidate heterogeneity resulting from disturbance. At the same time, the ability to use ALS alone to quantify structure is advantageous. More-so if much more widely available “severity” maps can be used to infer structural outcomes.
Many options are available to GRCA fire managers to use fire on the landscape. One option includes allowing natural ignitions (e.g., lightning-caused fires) on the North Rim to burn in predefined locations without direct suppression actions or with point protection methods [44]. Additionally, fire managers carefully plan and implement prescribed burns to reduce fuel loads, and maintain the fire regimes of the individual forest types. It is the hope that these prescribed burns and limited suppression options will ultimately maintain the forests in a healthy, resilient state and allow wildfire to play its natural role over time [44].
In the end, we hope that our work is useful to managers in the park. Decisions on how to manage a fire are often complex, with many different variables to be considered. The post-fire forest structure is one thing to consider. Our work can help managers decide what fire severity leaves a desired forest structure in a particular area. The post-fire forest structure is one thing to consider, as it plays into the fire behavior and spread characteristics of the next fire. This is important information for fire managers to consider making landscape level planning and treatment decisions, as well as operational scale tactical fire-fighting decisions.
5. Conclusions
Our study analyzed the effects of fire severity on forest structure on the North Rim of the Grand Canyon. The structure classification we use which includes a horizontal canopy component, a vertical canopy component and a surface fuel component is sensitive to previous fire severity. It is also easy to understand and recognize in the field, so that fire managers have an additional tool for decision making. Mean canopy height was also a good explanatory variable, especially in areas that burned with a high severity, where the canopy height was severely reduced. Canopy height alone is less useful for fire managers because it lacks more descriptive forest structure information. When looking at the six dominant structure classes, which make up 87% of the area, we see that frequently occurring low severity fires maintain ponderosa pine forests with structure classes that have high canopy cover and low surface roughness. The largest changes in structure occur in higher elevation forests that result in an increase in surface roughness and in general a decrease in canopy cover. Areas dominated by aspen regeneration had a strong relationship with high fire severity, covered by structure class 213.
Author Contributions
Conceptualization: V.H., E.R., C.T., and L.Q.; data curation: V.H., E.R., and T.W.; formal analysis: V.H., E.R., C.T., and T.W.; funding acquisition: V.H., E.R., and L.Q.; investigation: V.H., E.R., C.T., L.Q., and T.W.; methodology: V.H., E.R., C.T., L.Q., and T.W.; project administration: V.H. and L.Q.; resources: L.Q.; software: E.R. and T.W.; supervision: V.H. and L.Q.; validation: V.H., E.R., C.T., L.Q., and T.W.; visualization: V.H.; writing—original draft: V.H.; writing—review and editing: V.H., E.R., C.T., L.Q., and T.W.
Funding
Funding for this project was provided by the National Park Service (Task Agreement Number P15AC00601 under Master Cooperative Agreement Pl4AC00749 between The United States Department of the Interior National Park Service and the National Center for Landscape Fire Analysis, University of Montana).
Acknowledgments
The authors would like to acknowledge and thank Chris Moran for help with R scripting. The authors would like to acknowledge and thank former and current National Park Service staff at Grand Canyon National Park for their support: Eric Gdula, Windy Bunn, Christopher Marks, and Jay Lusher.
Conflicts of Interest
The funders had no role in the design of the study; in the collection, analyses, or interpretation of data; in the writing of the manuscript, or in the decision to publish the results.
Appendix A

Figure A1.
Location map for Grand Canyon National Park, Arizona, USA. The North Rim of the Grand Canyon, in Grand Canyon National Park, is located on the Kaibab Plateau in Northern Arizona.
References
- Franklin, J.F.; Spies, T.A.; Van Pelt, R.; Carey, A.B.; Thornburgh, D.A.; Berg, D.R.; Lindenmayer, D.B. Disturbances and structural development of natural forest ecosystems with silvicultural implications, using Douglas-fir forests as an example. For. Ecol. Manag. 2002, 155, 399–423. [Google Scholar] [CrossRef]
- Heinselman, M.L. Fire and succession in the conifer forests of northern North America. In Forest Succession; Springer: New York, NY, USA, 1981; pp. 374–405. [Google Scholar]
- Kilgore, B.M. Fire in ecosystem distribution and structure: Western forests and scrublands. In Proceedings of the Conference: Fire Regimes and Ecosystem Properties; Mooney, H.A., Bonnicksen, T.M., Christensen, N.L., Eds.; USDA Forest Service, General Technical Report WO-GTR-26; USDA Forest Service: Washington, DC, USA, 1981; pp. 58–89. [Google Scholar]
- Borman, F.H.; Likens, G.E. Pattern and Process in a Forested Ecosystem; Springer: New York, NY, USA, 1979; p. 253. ISBN 978-1-4612-6232-9. [Google Scholar]
- Rollins, M.G. LANDFIRE: A nationally consistent vegetation, wildland fire, and fuel assessment. Int. J. Wildl. Fire 2009, 18, 235–249. [Google Scholar] [CrossRef]
- Hutto, R.L.; Keane, R.E.; Sherriff, R.L.; Rota, C.T.; Eby, L.A.; Saab, V.A. Toward a more ecologically informed view of severe forest fires. Ecosphere 2016, 7, e01255. [Google Scholar] [CrossRef]
- Agee, J.K. The landscape ecology of western forest fire regimes. Northwest Sci. 1998, 72, 24–34. [Google Scholar]
- Covington, W.W.; Moore, M.M. Southwestern ponderosa forest structure: Changes since Euro-American settlement. J. For. 1994, 92, 39–47. [Google Scholar]
- Covington, W.W.; Moore, M.M. Postsettlement changes in natural fire regimes and forest structure: Ecological restoration of old-growth ponderosa pine forests. J. Sustain. For. 1994, 2, 153–181. [Google Scholar] [CrossRef]
- Agee, J.K. Fire ecology of Pacific Northwest Forests; Island Press: Washington, DC, USA, 1993. [Google Scholar]
- Stephens, S.L.; Fry, D.L.; Franco-Vizcaíno, E. Wildfire and spatial patterns in forests in northwestern Mexico: The United States wishes it had similar fire problems. Ecol. Soc. 2008, 13. [Google Scholar] [CrossRef]
- Johnson, E.A.; Cochrane, M.A. Disturbance regime interactions. Adv. Appl. Biodivers. Sci. 2003, 4, 39–44. [Google Scholar]
- Falk, D.A.; Miller, C.; McKenzie, D.; Black, A.E. Cross-scale analysis of fire regimes. Ecosystems 2007, 10, 809–823. [Google Scholar] [CrossRef]
- McKenzie, D.; Miller, C.; Falk, D.A. Chapter 1: Toward a theory of landscape fire. In The Landscape Ecology of Fire: Ecological Studies—Analysis and Synthesis; McKenzie, D., Miller, C., Falk, D.A., Eds.; Springer: Dordrecht, The Netherlands, 2011; pp. 3–23. [Google Scholar]
- Spies, T.A.; Hemstrom, M.A.; Youngblood, A.; Hummel, S. Conserving old-growth forest diversity in disturbance-prone landscapes. Conserv. Biol. 2006, 20, 351–362. [Google Scholar] [CrossRef] [PubMed]
- Moritz, M.A.; Moody, T.J.; Krawchuk, M.A.; Hughes, M.; Hall, A. Spatial variation in extreme winds predicts large wildfire locations in chaparral ecosystems. Geophys. Res. Lett. 2010, 37. [Google Scholar] [CrossRef]
- Perry, D.A.; Hessburg, P.F.; Skinner, C.N.; Spies, T.A.; Stephens, S.L.; Taylor, A.H.; Franklin, J.F.; McComb, B.; Riegel, G. The ecology of mixed severity fire regimes in Washington, Oregon, and northern California. For. Ecol. Manag. 2011, 262, 703–717. [Google Scholar] [CrossRef]
- Heyerdahl, E.K.; Brubaker, L.B.; Agee, J.K. Annual and decadal climate forcing of historical fire regimes in the interior Pacific Northwest, USA. Holocene 2002, 12, 597–604. [Google Scholar] [CrossRef]
- Marks, C. (National Park Service, Deputy Fire Management Officer, Grand Canyon National Park, AZ, USA). Personal communication, 2015.
- Keeley, J.E. Fire intensity, fire severity and burn severity: A brief review and suggested usage. Int. J. Wildl. Fire 2009, 18, 116–126. [Google Scholar] [CrossRef]
- Key, C.H.; Benson, N.C. The Normalized Burn Ratio (NBR): A Landsat TM Radiometric Measure of Burn Severity; United States Geological Survey, Northern Rocky Mountain Science Center: Bozeman, MT, USA, 1999.
- Bond, M.L.; Derek, E.L.; Rodney, B.S.; Ward, J.P., Jr. Habitat use and selection by California spotted owls in a postfire landscape. J. Wildl. Manag. 2009, 73, 1116–1124. [Google Scholar] [CrossRef]
- Squires, J.R.; Reynolds, T. Northern goshawk (Accipiter gentilis). In The Birds of North America; Poole, A., Gill, F., Eds.; No. 298; The Birds of North America, In.: Philadelphia, PA, USA, 1997; pp. 1–31. [Google Scholar]
- Rowell, E.; Seielstad, C.; Vierling, L.; Queen, L.; Shepperd, W. Using laser altimetry-based segmentation to refine automated tree identification in managed forests of the Black Hills, South Dakota. Photogramm. Eng. Remote Sens. 2006, 72, 1379–1388. [Google Scholar] [CrossRef]
- Kane, V.R.; McGaughey, R.J.; Bakker, J.D.; Gersonde, R.F.; Lutz, J.A.; Franklin, J.F. Comparisons between field-and LiDAR-based measures of stand structural complexity. Can. J. For. Res. 2010, 40, 761–773. [Google Scholar] [CrossRef]
- O’Hara, K.L.; Latham, P.A.; Hessburg, P.; Smith, B.G. A structural classification for inland northwest forest vegetation. West. J. Appl. For. 1996, 11, 97–102. [Google Scholar]
- Ohmann, J.L.; Matthew, J.G. Predictive mapping of forest composition and structure with direct gradient analysis and nearest-neighbor imputation in coastal Oregon, USA. Can. J. For. Res. 2002, 32, 725–741. [Google Scholar] [CrossRef]
- Kane, V.R.; North, M.P.; Lutz, J.A.; Churchill, D.J.; Roberts, S.L.; Smith, D.F.; McGaughey, R.J.; Kane, J.T.; Brooks, M.L. Assessing fire effects on forest spatial structure using a fusion of Landsat and airborne LiDAR data in Yosemite National Park. Remote Sens. Environ. 2014, 151, 89–101. [Google Scholar] [CrossRef]
- Yu, X.; Hyyppä, J.; Holopainen, M.; Vastaranta, M. Comparison of area-based and individual tree-based methods for predicting plot-level forest attributes. Remote Sens. 2010, 2, 1481–1495. [Google Scholar] [CrossRef]
- Wulder, M.A.; Coops, N.C.; Hudak, A.T.; Morsdorf, F.; Nelson, R.; Newnham, G.; Vastaranta, M. Status and prospects for LiDAR remote sensing of forested ecosystems. Can. J. Remote Sens. 2013, 39, S1–S5. [Google Scholar] [CrossRef]
- Riano, D.; Chuvieco, E.; Condés, S.; González-Matesanz, J.; Ustin, S.L. Generation of crown bulk density for Pinus sylvestris L. from LiDAR. Remote Sens. Environ. 2004, 92, 345–352. [Google Scholar] [CrossRef]
- Andersen, H.E.; McGaughey, R.J.; Reutebuch, S.E. Estimating forest canopy fuel parameters using LIDAR data. Remote Sens. Environ. 2005, 94, 441–449. [Google Scholar] [CrossRef]
- Silva, C.A.; Klauberg, C.; Hudak, A.T.; Vierling, L.A.; Liesenberg, V.; Carvalho, S.; Rodriguez, L. A principal component approach for predicting the stem volume in Eucalyptus plantations in Brazil using airborne LiDAR data. Forestry 2016, 89, 422–433. [Google Scholar] [CrossRef]
- Hudak, A.T.; Crookston, N.L.; Evans, J.S.; Falkowski, M.J.; Smith, A.M.S.; Gessler, P.E.; Morgan, P. Regression modeling and mapping of coniferous forest basal area and tree density from discrete-return LiDAR and multispectral satellite data. Can. J. Remote Sens. 2006, 32, 126–138. [Google Scholar] [CrossRef]
- Hopkinson, C.; Chasmer, L. Testing LiDAR models of fractional cover across multiple forest ecozones. Remote Sens. Environ. 2009, 113, 275–288. [Google Scholar] [CrossRef]
- Lefsky, M.A.; Cohen, W.B.; Acker, S.A.; Parker, G.G.; Spies, T.A.; Harding, D. LiDAR remote sensing of the canopy structure and biophysical properties of Douglas-fir western hemlock forests. Remote Sens. Environ. 1999, 70, 339–361. [Google Scholar] [CrossRef]
- Lim, K.; Treitz, P.; Wulder, M.; St-Onge, B.; Flood, M. LiDAR remote sensing of forest structure. Prog. Phys. Geogr. 2003, 27, 88–106. [Google Scholar] [CrossRef]
- Zimble, D.A.; Evans, D.L.; Carlson, G.C.; Parker, R.C.; Grado, S.C.; Gerard, P.D. Characterizing vertical forest structure using small-footprint airborne LiDAR. Remote Sens. Environ. 2003, 87, 171–182. [Google Scholar] [CrossRef]
- Coops, N.C.; Hilker, T.; Wulder, M.A.; St-Onge, B.; Newnham, G.; Siggins, A.; Trofymow, T. Estimating canopy structure of Douglas-fir forest stands from discrete-return LiDAR. Trees 2007, 21, 295. [Google Scholar] [CrossRef]
- Falkowski, M.J.; Evans, J.S.; Martinuzzi, S.; Gessler, P.E.; Hudak, A.T. Characterizing forest succession with LiDAR data: An evaluation for the Inland Northwest, USA. Remote Sens. Environ. 2009, 113, 946–956. [Google Scholar] [CrossRef]
- Halvorson, W.L. Environmental influence on the pattern of plant communities along the North Rim of Grand Canyon. Am. Midl. Nat. 1972, 87, 222–235. [Google Scholar] [CrossRef]
- Fulé, P.Z.; Heinlein, T.A.; Covington, W.W.; Moore, M.M. Assessing fire regimes on Grand Canyon landscapes with fire-scar and fire-record data. Int. J. Wildl. Fire 2003, 12, 129–145. [Google Scholar] [CrossRef]
- Fulé, P.Z.; Crouse, J.E.; Heinlein, T.A.; Moore, M.M.; Covington, W.W.; Verkamp, G. Mixed-severity fire regime in a high-elevation forest of Grand Canyon, Arizona, USA. Landsc. Ecol. 2003, 18, 465–486. [Google Scholar] [CrossRef]
- Grand Canyon National Park. Fire Management Plan; US Department of Interior, National Park Service: Grand Canyon, AZ, USA, 2012.
- Hoff, V.; Teske, C.C.; Riddering, J.P.; Queen, L.P.; Gdula, E.G.; Bunn, W.A. Changes in severity distribution after subsequent fires on the North Rim of Grand Canyon National Park, Arizona, USA. Fire Ecol. 2014, 10, 48–63. [Google Scholar] [CrossRef]
- Eidenshink, J.; Schwind, B.; Brewer, K.; Zhu, Z.; Quayle, B.; Howard, S. A project for monitoring trends in burn severity. Fire Ecol. 2007, 3, 3–21. [Google Scholar] [CrossRef]
- Hazell, B. Kaibab National Forest LiDAR Data Report; WSI Applied Remote Sensing and Analysis, On file at Grand Canyon National Park, WSI: Corvallis, OR, USA, 2012. [Google Scholar]
- Hazell, B. Kaibab National Forest Technical Data Report—LiDAR Delivery 2; WSI Applied Remote Sensing and Analysis, On file at Grand Canyon National Park, WSI: Corvallis, OR, USA, 2012. [Google Scholar]
- Isenburg, M. LAStools—Efficient Tools for LiDAR Processing. 2015 Version 150701. Available online: http://lastools.org (accessed on 2 September 2015).
- Moran, C.; Rowell, E.; Seielstad, C. A data-driven framework to identify and compare forest structure classes using LiDAR. Remote Sens. Environ. 2018, 211, 154–166. [Google Scholar] [CrossRef]
- Cansler, C.A.; McKenzie, D.; Halpern, C.B. Fire enhances the complexity of forest structure in alpine treeline ecotones. Ecosphere 2018, 9, e02091. [Google Scholar] [CrossRef]
- Hardiman, B.; Elizabeth, A.; LaRue, J.; Atkins, W.; Fahey, R.T.; Wagner, F.W.; Gough, C.M. Spatial Variation in Canopy Structure across Forest Landscapes. Forests 2018, 9, 474. [Google Scholar] [CrossRef]
- Seielstad, C.A.; Queen, L.P. Using airborne laser altimetry to determine fuel models for estimating fire behavior. J. For. 2003, 101, 10–15. [Google Scholar]
- Rowell, E.M.; Seielstad, C.A.; Ottmar, R.D. Development and validation of fuel height models for terrestrial LiDAR—RxCADRE 2012. Int. J. Wildl. Fire 2016, 25, 38–47. [Google Scholar] [CrossRef]
- Field Data for the Vegetation Mapping Inventory Project of Grand Canyon National Park and Parashant National Monument. 2009–2012. Available online: https://www.nps.gov/im/vmi-grca-para.html (accessed on 7 September 2015).
- Breiman, L. Random forests. Mach. Learn. 2001, 45, 5–32. [Google Scholar] [CrossRef]
- R Core Team. R: A Language and Environment for Statistical Computing; R Foundation for Statistical Computing: Vienna, Austria, 2010; ISBN 3-900051-07-0. Available online: http://www.R-project.org/ (accessed on 17 August 2015).
- Jain, T.; Graham, R. Is forest structure related to fire severity? Yes, no, and maybe: Methods and insights in quantifying the answer. In Proceedings of the Silviculture in Special Places: Proceedings of the 2003 National Silviculture Workshop, Granby, CO, USA, 8–11 September 2003; Shepperd, W.D., Eskew, L.G., Eds.; USDA Forest Service Proceedings RMRS-P-34; U.S. Department of Agriculture, Forest Service, Rocky Mountain Research Station: Fort Collins, CO, USA, 2003; pp. 217–234. [Google Scholar]
- Higgins, A.M.; Waring, K.M.; Thode, A.E. The effects of burn entry and burn severity on ponderosa pine and mixed conifer forests in Grand Canyon National Park. Int. J. Wildl. Fire 2015, 24, 495–506. [Google Scholar] [CrossRef]
- Johnstone, J.F.; Allen, C.D.; Franklin, J.F.; Frelich, L.E.; Harvey, B.J.; Higuera, B.E.; Mack, M.C.; Meentemeyer, R.K.; Metz, M.R.; Perry, G.L.W.; et al. Changing disturbance regimes, ecological memory, and forest resilience. Front. Ecol. Environ. 2016, 14, 369–378. [Google Scholar] [CrossRef]
- Collins, B.M.; Lyderson, J.M.; Everett, R.G.; Fry, D.L.; Stephens, D.L. Novel characterization of landscape-level variability in historical vegetation structure. Ecol. Appl. 2015, 25, 1167–1174. [Google Scholar] [CrossRef] [PubMed]
© 2019 by the authors. Licensee MDPI, Basel, Switzerland. This article is an open access article distributed under the terms and conditions of the Creative Commons Attribution (CC BY) license (http://creativecommons.org/licenses/by/4.0/).