Article

Low-Current High-Voltage Pulsed Atmospheric Arc Plasma Jet: Nanoparticle Emission from the Cathodic Spot

1
relyon plasma GmbH, Osterhofener Straße 6, 93055 Regensburg, Germany
2
Ostbayerische Technische Hochschule (OTH) Regensburg, Laboratory of Combustion Engines and Emission Control, Galgenbergstraße 30, 93055 Regensburg, Germany
*
Author to whom correspondence should be addressed.
Plasma 2025, 8(4), 44; https://doi.org/10.3390/plasma8040044
Submission received: 10 September 2025 / Revised: 18 October 2025 / Accepted: 24 October 2025 / Published: 28 October 2025
(This article belongs to the Special Issue Feature Papers in Plasma Sciences 2025)

Abstract

The atmospheric pressure plasma jet (APPJ) is a popular type of cold atmospheric plasma (CAP). APPJs based on a pulsed atmospheric arc (PAA) are widely spread in industrial processing. A plasma jet of this type, PlasmaBrush PB3 (PB3), is a subject of diverse research activities. The characteristic feature of PB3 is the generation of a low-current (300 mA), high-voltage (1500 V) pulsed (54 kHz) atmospheric arc. A gas flow vortex is used to stabilize the arc and to sustain the circular motion of the cathodic arc foot. During long periods of operation, nozzles acting as arc discharge cathodes erode. Part of the eroded material is emitted as nanoparticles (NPs). These NPs are not wanted in many processing applications. Knowledge of the number, type, and size distribution of emitted NPs is essential to minimize their emissions. In this study, NPs in the size range of 6 to 220 nm, emitted from four different nozzles operated with PB3, are investigated. The differences between the nozzles are in the eroded surface material (copper, tungsten, and nickel), the diameter of the nozzle orifice, the length of the discharge channel, and the position of the cathodic arc foot. Significant differences in the particle size distribution (PSD) and particle mass distribution (PMD) of emitted NPs are observed depending on the type and condition of the nozzle and their operating time. Monomodal and bimodal PMD models are used to approximate emissions from the nozzles with tungsten and copper cores, respectively. The skew-normal distribution function is deemed suitable. The results of this study can be used to control NP emissions, both to avoid them and to utilize them intentionally.

Graphical Abstract

1. Introduction

The atmospheric pressure plasma jet (APPJ), in its numerous variations [1,2], is a widely accepted tool in research and industry. The low-temperature arc jet [3,4] has a substantial potential for material processing due to its high local plasma density. Widespread are the low-current, high-voltage (HV) pulsed atmospheric arc plasma jets (PAA-PJs). The physical [5], electrical [6], and material [7] properties of such a plasma source were investigated earlier. Recently, Szulc et al. investigated its physics using laser-scattering techniques [8] and optical spectroscopy [9]. They examined the influence of pulse amplitude and frequency on plasma properties [10].
The high power coupled into plasma enabled many industrially oriented applications of PAA-PJ. One of the most popular is the modification of the surface of polymers for improvement in adhesion [11], for example, for polyethylene [12], glass fiber-reinforced polypropylene [13], or polydimethylsiloxane (PDMS) [14]. Furthermore, metal surfaces can be treated [15]. Surface modification for the hydrophilic property of stainless steel was demonstrated in [16]. Varnished or polymer-coated metal surfaces can also be successfully treated [17]. Another application example is the surface modification of carbon fibers [18]. The improvement in the mechanical shear strength of glued joints on PAA-PJ treated aerosol jet printed pads has been documented [19].
The high energy density in the arc zone allows for the use of PAA-PJ for coating processes. A 1.29 nm/s deposition rate of zinc oxide is reached using a nebulized ZnCl2 solution sprayed into the downstream of the nitrogen plasma jet [20]. PAA-PJ can be used for low-density polyethylene coating [21], fluxing of printed circuit boards [22], coating wood with polyester [23] or TiO2 [24], and coating of bismuth oxide circular droplets [25].
Recently, microbial, medical, and pharmaceutical applications of PAA-PJ have been investigated. The suitability of the PAA-PJ for bacteria inactivation on temperature-sensitive surfaces was demonstrated on the example of Geobacillus stearothermophilus spores [26]. Joshi et al. [27] used the PAA-PJ to characterize the microbial inactivation. In the study of Ahrens et al. [28], the PAA-PJ was successfully used for the production of plasma-activated water (PAW) used for bacterial decontamination. Steinhäußer et al. [29] investigated the shelf life and surface sanitizing efficacy of PAA-PJ plasma-treated liquids (PTLs).
The price paid for the high power of the PAA-PJ is the erosion of the electrodes, especially of the cathode [30]. Hontañón et al. [31] stated that the mass output rate, mean size, and dispersion of nanoparticles (NPs) from a copper electrode increase with electrical power. NP contamination originating from the cathodic arc spot is a limiting factor for novel biosensitive applications. Gaining control over the particle emission process can enable the development of new applications. This is why the focus of this study is on investigating the NPs emitted from the PAA-PJ nozzles. No experimental studies on NP emissions from PAA-PJ are known to the authors.
In our study, the PAA-PJ PlasmaBrush PB3 was used to generate NPs. Its discriminating feature is the generation of the arc via positive DC pulses between the internal electrode (anode) and the grounded nozzle (cathode). The pulse frequency can be set in the range from 40 to 65 kHz. The voltage varies between 15 kV for ignition and 1500 V to sustain the arc. Compressed dried air (CDA) flow rate can be set in a range from 40 to 70 standard liters per minute (SLM). The gas vortex [32] stabilizes the arc along the nozzle axis and forces the rotational movement of the cathodic spot.
The size distributions of the particles emitted from four different PB3 nozzles, described in Section 2.2, are measured and analyzed. Section 2.3 describes the setup used for the measurement. Section 3.1 analyzes the difference in the particle number distribution (PND) for the measured nozzles. In Section 3.2, the main definitions and calculation methods for the particle mass distributions (PMDs) are presented. The obtained PMDs and relative cumulative PMDs are presented and discussed in Section 3.3 and Section 3.4, respectively. In Section 3.5 the modeling of the PMD for the nozzle with tungsten core using different distribution functions is attempted. Section 3.6 summarizes the mechanisms of NP generation and possible control methods learned from this research.

2. Materials and Methods

2.1. Particle Generation

For the NP generation, a mobile system PlasmaBrush PB3 Integration [33] (relyon plasma GmbH, Regensburg, Germany) was used. It consisted of a high-voltage generator PS2000OEM, an external CDA supply unit, a cable-connected operating unit, a plasma generator PG31 (relyon plasma GmbH [34]), and a nozzle (see Section 2.2). The integrated gas flow meter (MFM), with minimum-value monitoring and display on the unit, provided gas flow information. The plasma unit was controlled remotely. Positive DC pulses of 54 kHz were applied between the internal electrode (anode) and the grounded nozzle (cathode). The electric power coupled into the discharge was 700 W. The flow rate of compressed dried air (CDA) was 50 SLM. The operation principle of PB3 and construction of the PG31 have been described in detail in the previous article [21].
The jet can operate in two modes. In the diffuse plasma mode, the cathodic arc foot contacts the nozzle surface, leading to nozzle erosion and NP generation. In focused mode, the arc is transferred from the nozzle to the grounded substrate [35]. In this operation mode, the nozzle is not eroded because the cathodic arc spot is placed at the substrate surface. It makes the transferred arc mode irrelevant for the NP emission from the nozzles.

2.2. Nozzles

The particle emissions from four different nozzles shown in Figure 1a were investigated. The main properties of the nozzles are summarized in Table 1. The thermal type of the nozzle was coded by the number of ring-shaped grooves that were turned into its cylindrical surface. Nozzles marked with one, two, and three grooves generate cold, medium, and hot plasma jet plumes, respectively. The temperature of the plasma plume correlates with the typical arc length, both listed in Table 1.
The characteristic feature of the cold nozzle A251 operation is that the arc is not driven out of the nozzle channel (see schematic drawing in Figure 1b). The cathodic foot point continues to rotate in the conical internal part of the nozzle. In contrast to the nozzle with an analogue geometry but with a copper core, A250 [36] and to the other nozzles under investigation, A251 has a core made of tungsten. It is not nickel-plated. At the start of measurements, the nozzle was in pristine condition.
The second nozzle shown in Figure 1a is the standard A450 [37], recognizable by three grooves. The condition of this nozzle was new before the start of measurements. Therefore, it will be referred to as A450n in this paper. A characteristic of A450 is that the arc extends beyond the nozzle channel, as demonstrated in Figure 1b. This operation mode is enabled by a larger nozzle orifice diameter, 4.2 mm compared to 3.0 mm of A251 (see Table 1), shorter nozzle channel, and longer inner, conical part of the nozzle. The extending arc rotates around the edge of the nozzle mouth, driven by the gas vortex generated inside the nozzle. The arc current is modulated by the 54 kHz pulses. A450n is electrochemically plated with 10–15 μ m of nickel to avoid the oxidation of the nozzles’ copper walls.
The third nozzle in Figure 1a, coded by two ring grooves, is the medium-hot nozzle A350 [38]. It is not nickel-plated (older type) and had already been operated for about 100 h before the start of measurements. Its plume temperature is between those of A251 and A450n. In A350, the cathodic foot of the arc extends only partially beyond the nozzle channel, resulting in the arc being longer than for A251 but shorter than for A450n, as illustrated in Figure 1b.
The last one, referred to as A450e, is a highly eroded and not nickel-plated (older model) A450. It reached an end-of-life (EOL) condition, but was still able to generate a plasma plume. Such a condition is achieved when long-term erosion causes a significant increase in the diameter and regularity of the nozzle orifice, reaching 4.7 to 5.0 mm (see Table 1). It occurs when the erosion zone overlaps with the cone-shaped part of the nozzle core. The consequence of the widening of the nozzle orifice is a detrimental change in the properties of the arc and the generated plasma plume. The arc voltage is decreasing due to reduced pressure within the nozzle. It burns frequently, asymmetrically, and irregularly with time. An extreme deformation of the nozzle tip, reached after many thousands of operation hours, is shown in the front view in Figure 2a. The erosion crater is strongly asymmetric. The radial extension of the erosion zone is twice as wide on the right as on the left. The presumed reason for such asymmetric wear is a variation in the rotation velocity of the cathodic arc spot during circulation around the nozzle orifice. A possible reason for such variation in the early phase of nozzle life can be a strong external air movement perpendicular to the nozzle axis.
It can accelerate the vortex air motion at the left side and decelerate it at the right side. The assumed direction of external gas movement, e.g., due to strong gas extraction flow, and the direction of vortex gas movement are depicted with yellow and pink arrows, respectively. By slowing the arc, the probability increases that it remains in one place for a longer time and produces a larger amount of molten material. In the late phase of nozzle life, the eroded asymmetry of the nozzle orifice can significantly disturb the symmetry of the airflow.
In Figure 2b, a red arrow points to the magnification of a ball of molten copper. To be able to melt such a large amount of material, the arc must stop for a longer time at one position. Such an event can occur when the slowed-down motion of the arc is combined with a protrusion formed in the course of prolonged erosion.
The copper surfaces of the A350 and the A450e nozzles are darker than A251 due to oxidation in ambient air during long-time operation.

2.3. Particles Measurement

The measurement setup is typically used to investigate motor exhaust gases, but it is suitable for any aerosol. The plasma generator PG31 was inserted into an exhaust pipe, as shown in Figure 3a, and sealed with aluminum tape to prevent any ingress of ambient air. The analyzed gas was taken from the exhaust system using a hole probe (see Figure 3a), and transferred for particle distribution analysis. To achieve a spatially uniform extraction of the exhaust gas across the entire pipe cross-section, a multi-hole sampling probe with an internal diameter of 6 mm was employed. The probe was equipped with fifteen sampling orifices, each 1.5 mm in diameter. The cumulative flow cross-section of all the orifices (26.5 mm2) thus closely matched the internal cross-section of the sampling tube (28.3 mm2), ensuring balanced flow distribution. The fifteen orifices were arranged in three circumferential rows of five holes each, offset by 120° to achieve homogeneous coverage of the exhaust gas stream. The system used for particle measurement, shown schematically in Figure 3b, consisted of a diluting unit eDiluter Pro (Dekati Ltd., Kangasala, Finland) and Scanning Mobility Particle Sizer (SMPS) spectrometer (TSI Incorporated, Shoreview, MN, USA) for measurement of the particle size distribution. This sizer consisted of an aerosol neutralizer TSI 3087, an electrostatic classifier TSI 3080L with the longest differential mobility analyzer (DMA) TSI 3081, and a condensation particle counter (CPC) TSI 3775, where particle diameters between 6 and 220 nm are measured. eDiluter Pro was used to prevent undiluted exhaust gas from entering the measuring device. It operates as a two-stage diluter with an integrated catalytic stripper, and enables dilution rates ranging from 25:1 to 900:1. It draws exhaust gas from the pipe through a heating line at 30 °C, dilutes it, and then sends it to the SMPS for particle size measurement.
Sample gas lines and the first dilution air stage were not heated. In the first stage, the exhaust gas was diluted with CDA at 30 °C. The catalytic stripper was also located in this dilution stage, but remained inactive to retain the particle components in a non-oxidized state. Subsequently, in the second stage, the sample gas was diluted again with CDA to room temperature, and a portion was then passed to the SMPS. The gas remaining after each dilution stage was fed into an extraction device.
The dilution ratios of both dilution stages were 5:1, respectively. This means the total dilution ratio was 25:1. The result of this dilution was a decrease in particle concentration in the analyzed air by a factor of 25. Consequently, the measured particle numbers should be multiplied by this factor. The particle concentration reduction factor (PCRF) loss curve of the eDiluter was not measured.
The settings of SMPS were as follows: sheath air of 15 L/min, suction speed CPC of 1.5 L/min, and size range of the measured particles from 6 to 220 nm.
The setup applied has two limitations.
First, the exclusion of ambient air may lead to differences between the erosion in our experiments and that under typical ambient conditions. The difference is the presence of humidity in the ambient air, which results in different oxidation chemistry of the nozzles. However, the CDA used in the experiments was not completely dry. Its relative humidity was about 7%, making the difference less significant.
Second, the measurement technique does not discriminate between particles emitted from the nozzle and from the internally placed discharge anode. However, the endurance tests showed that the anode’s erosion was two orders of magnitude lower than that of the cathode. This allowed us to interpret our results as cathode erosion.

3. Results and Discussion

3.1. Particle Number Distributions

The outcome of each measurement is the PND as a function of particle size. In Section 3.3, Section 3.4 and Section 3.5, the spherical shape of the particles was assumed, allowing us to replace size with diameter and number with mass, respectively. The size range represented by a single size value was related to the particle size and increased from approximately 0.23 nm at low values to 7.6 nm at high values. The particle size can be expressed as a function of the range number i ( i < 2 ; 100 > ):
d ( i ) = 5.9368 nm × exp ( 0.036 · i )
The raw data obtained from the measurement represented the mean number of particles in the difference of decimal logarithms of the incremental sizes. The correction used to obtain the particle numbers for all particle sizes was calculated using Equation (1).
For each nozzle, a series of 3 to 5 distributions was collected, as described below. The intervals between measurements were 2 min. Before starting the measurement, each nozzle was operated 2 min with plasma, except the A450n nozzle, which was operated 1 h before starting measurements. The PND evolved differently over time for different nozzles. To gain a deeper understanding of NP generation mechanisms, the time-dependent evolution of the distributions will be analyzed.

3.1.1. Differences in the Nozzle Erosion Mechanisms

Figure 4 shows the PNDs taken at the start of the measurement series for all four nozzles. The maximum particle numbers per particle size in each plot differ from each other by orders of magnitude. To visualize the plots for all four nozzles in one diagram, a semilogarithmic plot was used. The highest particle number of 1.97 × 10 5 at a size of 7.1 nm was measured for the A251 nozzle (see Table in Figure 4). The PND curve decayed rapidly with size, reaching values below 1000 at 20 nm. Such a sharp and regular distribution speaks for the single mechanism of NP generation. The cause of high numbers can be a combination of the influence of the material (tungsten core) and the cross-sectional shape of the nozzle, suppressing the transfer of the arcs out of the nozzle body (see Figure 1b). The cathodic foot remained inside the nozzle at the tungsten surface. Due to the low thermal conductivity of tungsten compared to copper (see Table 2), the temperature of the cathodic arc spot was significantly higher than that of copper outside the nozzle.
The scenario of the concurrent oxide growth and oxide removal is presented in Figure 5 and discussed in Section 3.6. Figure 5a shows the idealized temperature distribution under the arc foot, when the drag of the gas motion is not sufficient to move the arc. The temperature around the arc was high enough to initiate the oxide growth. Directly under the arc, the temperature was significantly higher, leading to the instantaneous removal of the already-grown oxide. Figure 5b shows how the temperature distribution changes when the arc is moving. Since the interaction time between the arc and the tungsten surface was shorter, the temperature directly below the arc was lower compared with the static case. At the same time, the temperature around the arc was lower, and less oxide was produced. The faster the movement, the less oxide is grown and subsequently removed.
The pristine A450n nozzle emitted the fewest number of NPs. The highest NP number of 387 measured at a size of 6.61 nm (see Table in Figure 4) was three orders of magnitude lower than for A251. The reason for the low erosion is related to the nickel plating. Due to the very smooth nickel-plated surface, no protrusions obstructed the arc rotation. Thanks to the fast arc movement, the thermal energy was distributed evenly along the arc’s footpath. As long as no protrusions are available to slow down the arc movement, the local temperature does not rise to the level of metal melting. At low temperatures, the oxidation of nickel is very slow [40], and thin oxide films do not obstruct the arc motion. The atmospheric pressure glow discharge (GD) mode was assumed at the cathodic arc foot (see the discussion in Section 3.6.2), and consequently, the particles were generated only in small amounts. This situation continued as long as the nickel coating remained smooth and was not eroded through by the arc. After nickel coating removal, the erosion of A450n was analogous to that of the A450 without coating.
A high number of NPs was emitted from the strongly eroded A450e nozzle. The maximum value of 1.3 × 10 5 was reached at a size of 6.61 nm (see Table in Figure 4). It was about 30% less than for A251. However, the shape of the PND curve was very different. It had a long, slowly decreasing tail, with significant particle numbers extending up to 50 nm. Such a broad distribution suggests diverging conditions of NP generation. In the size range below 20 nm, the predominant mechanism could be copper vapor aggregation in the gas phase above the cathodic arc spot. The size of the aggregated copper particles depends on the residence time over the cathodic spot. If the cathodic spot moves fast, smaller particles are generated. The slow movement gives more time to build larger particle aggregates. It means the strong modulation of the arc spot velocity results in a larger spread of the PND.
During the operation of a strongly eroded nozzle after reaching the EOL, the vortex causing the arc foot rotation was not strong enough to move the arc smoothly. It is frequently observed that the arc stops at larger protrusions for a longer time, causing local melting. Even the building of small, visible melt droplets, as shown in Figure 2b, is documented. Such molten spots can be the source of droplet emission, but the expected sizes of such droplets are in μ m range, not captured by our measurements.
The A350 nozzle showed intermediate numbers of emitted NPs. The maximum value of 3.03 × 10 4 was reached at a size of 6.15 nm (see Table in Figure 4). The general shape of the PND was significantly different from that of the other nozzles. It had several distinct maxima, which can be understood as an overlap of several sub-distributions (multimodal distribution). Each such sub-distribution can be related to a different NP generation conditions.

3.1.2. Time-Dependent A251 Distributions

The comparison of the PNDs in Figure 4 shows that the curve for A251 is focused in the range of low size values. Let us take a closer look at the distribution in the size range below 20 nm. In the starting phase of the arc discharge, two characteristic changes of the PND can be observed (see Figure 6). First, the number of emitted NPs decreases with time. Second, the mean NP size decreases. Several factors can be considered as the reason for these effects. On the scale of minutes, the nozzle and the flowing gas are warming up. Generally, increasing the cathode temperature results in greater erosion. However, with increasing gas temperature, the gas volume increases, followed by an increase in the gas velocity and the rotation velocity of the arc foot. Consequently, the residence time of the arc foot at one place gets shorter. The surface reaches lower temperatures. Assuming the NP generation mechanism based on oxide growth and removal described in Section 3.1.1, less oxide grows, and subsequently, less oxide or tungsten can be sublimated. Additionally, by a faster arc movement and gas flow, the aggregation time of particles decreases, resulting in a decrease in the particle mean size [41]. Another phenomenon contributing to the faster arc foot motion is the “polishing” of the tungsten surface by the rotating arc, removing any convex features and preventing lingering of the arc at such places.

3.1.3. Time-Dependent A450e Distributions

Figure 7 shows the PND collected four times in two-minute intervals after the start of measurement. Analogue to A251, the maximum particle number decreased with time, but the shift in the size of these maxima was not so clear. A distinctive feature of the PNDs of the A450e nozzle, not occurring in the A251 distributions, is its double structure. The most apparent is this effect in the 0 min curve. It resembles an overlay of two PNDs, the first with a maximum at 7.1 nm and the second with a maximum around 9 nm. The bimodal character of the PND was also visible for the 4 min curve. As mentioned in Section 3.1.1, two distinct physical mechanisms can account for these distributions. The first distribution can be related to the atomic-scale erosion of the metallic copper surface and aggregation in the gas phase. The second one can be related to the erosion of the oxidized regions produced at the copper surface. Since copper oxides do not sublimate and grow thicker, a different erosion scenario than for tungsten should be proposed. The presence of oxidized areas forces the arc to move not smoothly but to overjump the strongly oxidized regions, seeking out low-resistivity spots. They can be found at places where oxide is punched by the high-voltage arc. At such spots with a bare metal surface, it remains a little longer. The slower, less smooth movement of the arc produces hotter cathodic spots. A higher atomic concentration of copper and longer available aggregation time promote the production of larger particles. Since the mean time of lingering at one place can vary strongly with time, the particle size distributions change as well.

3.1.4. Time-Dependent A350 Distributions

Figure 8 shows the PND of the A350 nozzle. It changes strongly with time after the start of measurement. The first curve has a distinct maximum for the smallest size, 6 nm. The value of the maximum is decreasing with time, but the particle size for these maxima is shifting towards larger sizes. The last distribution collected 8 min after the measurement start has a maximum at a size of 12 nm. An additional fifth distribution was collected, because during measurements, a strong variation in the distributions was noticed. It can be concluded that the conditions of NP generation change during plasma operation. Initially, the evaporation and aggregation of copper from the molten protrusions is probable. After the disappearance of protrusions and an increase in the copper surface temperature, the oxide grows, causing less smooth rotational motion of the arc. The erosion mechanism described for A450e can be considered.

3.1.5. Time-Dependent A450n Distributions

Figure 9 shows the PND of the A450n nozzle. A large spread in the measured values is due to the low absolute number of NPs, which is close to the resolution of the measurement technique. Due to a longer preheating time, the thermal equilibrium conditions can be assumed for the erosion process. The fourth distribution was not collected because no temporal development could be observed. A vague observation is that despite the thermal equilibrium, the number of emitted NPs and the width of distribution vary with time. It indicates a temporal variation in the particle emission conditions. The PMD variation within minutes can be caused by the thermally initiated variation in the arc foot velocity. The hotter the cathode surface is, the more atoms are emitted. On the contrary, the increasing speed of the gas flow with increasing temperature of the nozzle tip reduces the interaction time between the arc foot and nickel oxide surface and, consequently, suppresses the particle emission. These competing effects can result in fluctuation of particle emission. An additional tool to analyze particle emission from this nozzle is the cumulative PMD presented in Section 3.4.2.

3.2. Definitions

The PNDs are important for the design of particle filters. But it is not a sufficient description for predictions related to the cathode erosion, such as cathode lifetime or the production rate of NPs. For this purpose, different types of diameter-dependent PMDs are introduced, as defined below.

3.2.1. PMD

The most significant number of NPs measured in the range of small sizes, below 20 nm. But this was not always the size range where the largest part of the metal mass was eroded. To compare the particle distribution results with gravimetrically determined nozzle erosion, the PMDs were calculated. Assuming spherical particle shape, which holds for molten and solidifying metal in the gaseous phase, and for aggregation of Cu NPs from vapor phase, the PMD can be derived from the PND.
The PMD depends on the density of the eroded material. For the nozzle A251, the mass m i of all N i particles with diameter d i is given as follows:
m i = π 6 d i 3 N i ρ W
where ρ W is the mass density of tungsten (see Table 2). For copper nozzles A350 and A450e, Equation (2) is valid with the mass density of copper. For the pristine nozzle A450n, the mass density of nickel should be applied; however, after the removal of the nickel plating, the copper is eroded.
This model disregards the oxidation processes. The aggregation of metal particles in the gas phase can, depending on their temperature, be accompanied by oxidation. The result could be the metal-oxide particles with oxygen volume added to the metal. The measurement of such particles would cause the overestimation of the amount of eroded metal by Equation (2).

3.2.2. Cumulative PMD

For analysis of the particle size distributions, cumulative distributions were used [42]. The cumulative mass M i is defined as the mass of all particles with a size smaller than or equal d i . It can be expressed with the following formula:
M i = k = 1 i m k
where m k is given by Equation (2).

3.2.3. Total Cumulative Mass

The total cumulative mass is defined as the cumulative mass for all the measured particles. It can be expressed using Equation (3) with the upper summation limit of N, which refers to the maximum measured particle diameter d N :
M N = i = 1 N m i

3.2.4. Relative Cumulative PMD

To make the cumulative PMDs comparable for different operation times and different nozzles, the relative cumulative mass μ i expressed in % is defined as follows:
μ i = M i M N × 100 %
The diameter d 50 is defined as the diameter d i for which the relative cumulative mass is μ i = 50 % . It means the median of the PMD. Similarly, the diameter d 95 is defined at the relative cumulative mass of 95%.

3.3. PMDs

3.3.1. PMDs for A251 Nozzle

Figure 10 shows four PMDs for the A251 nozzle collected at four times from the start of the measurement. Comparing the PNDs and PMDs for t = 0 min , the substantial shift in the maximum value is observed. The maximum of PND is at a size of 7.6 nm (see Figure 6), but for the PMD it is a diameter of 10.6 nm. Due to its larger volume, the smaller number of particles is carrying a larger mass of the eroded material. The strong shift over time of the maxima toward smaller sizes and masses is observed. It will be discussed in detail in Section 3.5.4.

3.3.2. PMDs for A450e Nozzle

Using Equation (2) with the mass density of copper (see Table 2), the PMD for the nozzle A450e is determined and displayed in Figure 11. The curve for the start of the measurement series confirms the bimodal character of the distribution.

3.3.3. PMDs for A350 Nozzle

The multimodal physical mechanism of the particle emission can be interpreted based on the temporal evolution of the PMDs shown in Figure 12. Assuming atomic aggregation in the gas phase as the most probable NP generation mechanism, strong variations in the cathodic foot velocity can lead to differences in PMD. In the A350 nozzle, the cathodic arc spot can rotate within or outside the nozzle channel, depending on the gas flow and surface condition. Outside the nozzle channel, the velocity of the cathodic spot is lower than inside it due to the decelerating effect of the ambient air. The faster motion in the nozzle channel would result in the emission of smaller particles. The cathodic spot rotation out of the nozzle would shift the PMD toward the larger particles. The maximum of the distribution shifts to 8 nm after 2 min and to 11.3 nm after four minutes of operation, because the hotter gas moves faster and drives the arc out of the nozzle channel, causing the slowing down of the rotational arc movement.
A significant difference between the PNDs and PMDs is that the numbers decay for sizes close to 20 nm, whereas the eroded mass increases for diameters between 16 and 20 nm. A mechanism involving oxidation processes is proposed to explain this behavior. The oxidation speed of copper is exponentially dependent on temperature. In the vicinity of arc spots, the best conditions for oxide growth prevail: high temperature and no oxide removal. The arc foot leaves a trace of thicker copper oxide. During the next arc sweep over this oxide layer, the arc preferentially sticks to regions with thinner oxide, because Cu2O is a semiconductor with much higher resistivity than copper. Such “searching” for places with lower voltage drop causes a non-continuous, slower movement of the arc foot and consequently the aggregation of larger particles.

3.3.4. Total NP Masses

Using Formula (4), the total mass of all the particles from the PMD can be calculated. Table 3 summarizes the values for all the nozzles and for different times after the start of measurement. Each nozzle shows specific trends in the total erosion over time. For the two copper-core nozzles, the calculated erosion mass increases over time. The total mass for A350 exhibits this general tendency. Such an increase can be correlated with rising surface temperature, promoting particle emission. Only for A251 is a strong decrease by a factor of 3 observed. Although the A251 nozzle emits the highest number of NPs, the mass of NPs emitted from the A450e nozzle is larger.

3.3.5. NP Related Erosion Rate

The total NP masses summarized in Table 3 can be directly recalculated in the particle concentration in the gas flow. Assuming that total NP mass is related to the volume concentration in the gas flow from the PG31 f air = 50 SLM by a factor c d , the total mass of emitted NPs Δ M W eroded from the nozzle and released in the air flow in a period Δ t can be expressed as follows:
Δ M W Δ t = c d f air M N
with M N given by Equation (4). The factor c d takes into account the dilution ratio 25:1 and the relation between the particle total mass and the particle concentration in the measurement cell.
Considering, as an example, the emission of tungsten NPs, and PND taken 6 min after the start of measurements, the erosion rate (mass per time) calculated using Equation (6) is 0.71 mg/h. A 1000 h endurance test was conducted for the A251 nozzle. From the total nozzle mass loss, the gravimetrically determined erosion rate was 2 g/1000 h (2 mg/h). It would mean that only one-third of the nozzle emission is emitted as NPs. Assuming that the large part of measured NP consists of WO3 with mass density of ρ WO 3 = 7160 kg · m 3 , about one third of the mass density of tungsten, the calculated removal rate of tungsten from the nozzle would be lower by a factor of three (see Section 3.3.4). This factor can be even higher, considering the aggregation processes of WO3 resulting typically in highly structured, porous NPs [43]. Similar discrepancies between the gravimetrically determined erosion rates and the calculated erosion rates related to NP are observed for all the nozzles. The high value of the PCRF loss curve for small particles is not a sufficient reason for the discrepancy in the calculated erosion rate for NPs and the gravimetrically determined erosion rate. The assumed reason is the emission of particles that are much larger than the upper limit of the measured range. In conclusion, the measured NP distributions are not suitable for estimating the gravimetric erosion rate.

3.4. Relative Cumulative PMDs

To calculate the relative cumulative PMD according to Equation (5), the total particle masses from Table 3 were used.

3.4.1. Relative Cumulative PMDs for A251

To visualize the relative cumulative PMDs across the entire particle-size range, particle diameter is presented on a logarithmic scale. Figure 13 shows such a diagram for the A251 nozzle. The d 50 and d 95 diameters for all four curves are calculated and shown in the table included in the diagram. For all times of measurement, 95% of the particle mass is emitted in the diameter range below 16.3 nm. The d 95 = 8.8 nm for 4 and 6 min after start of measurement shows that there are almost no large NPs. The very steep transition from low to high mass is characteristic of a narrow spread of particle mass. It can be explained either by very short or by very slow aggregation processes. The first is related to a rapid movement and a small arc foot diameter. The second is related to the high atomic mass of tungsten (see Table 2) or molecular mass of WO3, and consequently, low mobility in the gas phase, with a low number of aggregating collisions. The spread of d 50 below 1.5 nm shows that the PMD is stable in time, even though the total particle mass varies strongly (see Table 3). One of the conditions promoting the constant rotation velocity of the arc is the independence of the arc discharge on the ambient air movement, because the arc is contained within the nozzle.

3.4.2. Relative Cumulative PMDs for A450n

Figure 14 shows the relative cumulative PMDs for the A450n nozzle. The horizontal line segments at large diameters are visible in all three curves. These are artifacts caused by low particle counts. They mean that in these ranges, no particles are counted. For measurement times 2 and 4 min, no reliable determination of d 95 parameters is possible. The value of 66.1 nm (see the table in Figure 14) for 0 min is more than four times larger than for the A251 nozzle, despite the nickel-plated nozzle surface. The broad PMD can be the consequence of the operation of the cathodic arc foot in GD mode (see the discussion in Section 3.6.2). The emission of electrode material is strongly dependent on the energy of positive ions bombarding the surface. This energy is proportional to the voltage across the cathodic fall, which in PAA-PJ is not constant but pulsing. In contrast to thermally driven evaporation from the arc spot, the flux of atoms emitted from the cathode surface follows variations in the cathode fall voltage. Electron emission from the cathode is stronger during positive anode pulses due to the higher energy and flux of bombarding electrons. These effects heat the GD and extend its area over the cathode surface. When the pulse ends, the GD declines, followed by a decrease in atomic flux from the cathode. This strong variation in aggregation conditions results in a shift in the mean particle size. Since the measurement technique integrates the number of particles with time, the consequence is a broader measured PMD. As an alternative reason for broad PMD the different dynamics of the NP aggregation process can be considered. A much lower atomic mass of nickel, compared with tungsten (see Table 2), and consequently higher mobility in the gas phase can contribute to faster aggregation to larger particles.
The curve for time of measurement 2 min after start, reaching d 50 = 28.9 nm compared to about 11 nm for the two remaining curves, is an outlier. The occurrence of such an outlier indicates the time instability of the rotational arc foot movement on a minute scale described in Section 3.1.5.

3.4.3. Relative Cumulative PMDs for A350

The relative cumulative PMDs of the A350 nozzle, shown in Figure 15, differ significantly from the remaining three nozzles.
First, the diameter transition from low to high mass is wide, stretching across the entire range of measured diameters. It means that both very small, close to 6 nm, and very large, approaching 200 nm, particles are emitted. The lack of mass saturation at 200 nm suggests that the emission of particles larger than 200 nm, not measured in this study, is occurring.
The second characteristic of the A350 nozzle is the large time-dependent spread of the d 50 reaching 53 nm. Such a substantial variation in the PMD over time points to an instability in the erosion mechanisms proposed in Section 3.3.3. Several effects can promote such instability. One example is the transition from a laminar to a turbulent flow at the nozzle mouth. Another effect can be thermal instability. The variation in the nozzle tip temperature modulates the arc foot rotation velocity. Oxide growth causes slower arc-foot motion, followed by an increase in gas temperature. The arc foot gets larger. The obstacles get easier to overcome. The arc foot can move faster, resulting in a decrease in the nozzle tip temperature, and the thermal cycle starts from the beginning. The modulation of the arc foot velocity is correlated with the radial and axial position of the arc rotation track. Such changes in the arc foot track can be caused by the growth of an oxide layer on the copper surface, forcing the arc foot to seek a more energetically favorable path. The oxide film growing faster at the outer surface of the nozzle tip keeps the arc foot in the orifice. The arc movement inside the orifice causes the emission of smaller particles according to the aggregation mechanism. The increase in temperature within the orifice and, consequently, the higher gas speed will expel the arc foot toward the outer nozzle tip, creating an instability loop. Pushing the arc out of the orifice is promoted by blowing away the cloud of highly conductive metal vapor, thereby increasing the arc voltage. The arc movement at the outer nozzle tip surface covered with a thicker oxide film will tend to emit larger oxide particles or to make irregular stops accompanied by droplet emission. In particular, the A350 nozzle is prone to this instability due to the transitional position of the arc foot between the nozzle channel and the nozzle tip’s outer surface.

3.4.4. Relative Cumulative PMDs for A450e

In view of the heavy destruction of the nozzle tip, the relative cumulative PMDs of the A450e nozzle, displayed in Figure 16, show a surprisingly narrow spread of the d 50 not exceeding 1 nm and moderate d 95 not exceeding 55 nm. A higher concentration of copper atoms in the gas phase, related to its much lower melting point and higher mobility, compared to tungsten (see Table 2), explains the aggregation into larger particles and, consequently, a broader particle size distribution. The melting effects shown in Section 2.2 suggest that the arc foot relocates between localized melting zones, creating in each of them similar conditions for particle emission. The arc foot remaining at one place is a result of two contradictory physical phenomena. On the one hand, the rapidly increasing temperature causes an exponentially temperature-dependent oxidation of copper, which should shift the arc foot to a less oxidized location as the gas flow drags it. On the other hand, the increasing concentration of emitted copper atoms increases the electrical conductivity of the arc foot plasma, making the change in arc foot position less energetically attractive. The higher conductivity of the metal-containing plasma, compared with air plasma, is related to a much lower ionization energy of metals, lower than 8 eV (see Table 2), compared with about 14 eV for oxygen and nitrogen atoms. It can also be concluded that this particle emission mechanism is, in general, invariant with time in the minutes range. The exception is the distribution for 2 min, which shows an increased contribution from particles larger than 15 nm. For such an extension of the particle distribution toward larger particles, the droplet emission mechanism could be considered. Since the gravimetrically determined erosion rate for A450 is much higher than the one calculated from the particle emission distributions, the emission of particles larger than the investigated size range can be expected (see the discussion in Section 3.6.3).

3.5. Fitting of the PMDs

The fitting of the PMD is restricted to the particle range from 6 to 20 nm, because, as the results of the cumulative PMD (Section 3.4.1) show, the nozzle A251 does not emit a significant amount of particles with a diameter over 20 nm. The measurement setup allows particles with diameters larger than 6 nm to be captured. However, smaller particles can also be expected. For very regular PMDs of the A251 nozzle, a cautious extrapolation can be attempted using a fitting function.
Due to the multimodal [44] and qualitatively time-variant distributions of other nozzles, much more experimental data is needed to formulate their particle emission models.

3.5.1. Normal Distribution

The straightforward approach is to model the PND by a normal distribution (Gaussian function) [45]. However, the normal distribution function is not a good fit for the PND because the number of points on the left side is insufficient. A good fit is expected for the PMDs, which are strongly shifted toward larger diameters. The formula expresses the version of the normal distribution adopted for our case of PMD:
m d ( d ) = m 0 exp d d m 2 σ 2
where m 0 is the maximum particle mass per diameter interval, d m is the position of this maximum on the diameter axis, and σ is the standard deviation of the normal distribution.
It is plotted as a blue line in Figure 17. Since the normal distribution is symmetric, it is apparent that the PMD is asymmetric. Reaching a good fit at the right branch of the distribution is followed by a large difference between the fit line and the PMD. A significant amount of particles, down to a diameter of 0 nm, is modeled, which is physically not realistic.

3.5.2. Logarithmic Normal Distribution

To achieve a better fit, an asymmetric fitting function should be considered that decays to zero when the diameter approaches zero. A promising function having these properties is the logarithmic normal (or log-normal) distribution function [46]. It is used in many studies to model the particle size distributions. Examples of such applications are presented by Limpert et al. [47]. The log-normal distribution has been used for a long time to describe particle-size distributions in natural atmospheric aerosols [48] and in artificially generated nanoparticles [49]. It justifies the expectation that, in our NP production, it could be a good choice. The green line in Figure 17 visualizes the log-normal distribution calculated using the following equation:
m d ( d ) = m 0 2 π σ d exp ln d ln d m 2 σ 2
The fit parameters are listed in the table in Figure 17. It is worth noting that the parameter’s units differ from those for the normal distribution. In the plot, it can be seen that if the left branch of the PMD is well fitted, no satisfactory fitting of the right branch is possible. Consequently, the log-normal distribution is not suitable for modeling the PMDs in our case.

3.5.3. Skew-Normal Distribution

The main limitation of the log-normal distribution function is the lack of possibility to control the curve asymmetry independently of other fitting parameters. Such an additional degree of freedom is assured by the skew-normal distribution function [50]. The asymmetry of this function is controlled by the fourth parameter: skewness ( α ). The formula adopting our physical situation is given as follows:
m d ( d ) = m 0 exp d d m 2 σ 2 1 + erf α d d m 2 σ
One can verify that the normal distribution is recovered when skewness α = 0 , and that the distribution becomes more skewed as the absolute value of α increases. Figure 18 shows the fitting curves and, in the table, the parameters used for the calculation of the curves. Small variations in the skewness α can be stated. The curves shift slightly toward lower diameters as the parameter d m varies over time. The parameter related to the curve’s maximum, m 0 , decreases strongly with operation time. This effect was already discussed in Section 3.1.2. The parameter σ responsible for the distribution width strongly decreases. Let us assume that arc foot velocity variation modulates surface temperature and, consequently, the size of aggregated particles. This could mean that the velocity of the arc foot increases with time, resulting in fewer particles emitted and in a narrower particle size distribution. The velocity increase could be due to a smoothing effect at the surface. An alternative scenario involves the molecular aggregation processes. Faster arc movement reduces the time available for aggregation in the gas volume, resulting in smaller particles.
The fitting curves enable the extrapolation of the PMDs for diameters below 6 nm. This extrapolation predicts that almost no particles with a diameter below 3 nm are emitted from the A251 nozzle.

3.5.4. Fitting of a Bimodal Distribution

The fitting of the PMDs for other nozzles is much more complicated due to their multimodal character. As an example, the bimodal distribution of the A450e nozzle is modeled. In Figure 19, the distribution collected at time 0 min for the A450e nozzle together with its fit is shown. The blue fit line is the sum of two skew-normal distributions, calculated according to Equation (9), plotted as a yellow and green line, respectively. The parameters of the fit lines are summarized in the table in the diagram. From the d m parameters, the distance between the skew-normal distributions is 4.4 nm. The distribution for larger particles (the green line) is by 45% smaller compared with the smaller particles.
However, it is broader and has more than twice the skewness. The slight divergence between the fit and the measured results for diameters larger than 15 nm may result from an additional NP generation mechanism.

3.6. NP Emission Control

Two different goals can be pursued through control of particle emission. On the one hand, the particle emission from the PAA-PJ can be utilized in the production of nanoparticles [31,49,51,52,53]. On the other hand, their emission should be minimized because it limits the applicability of PAA-PJs due to NP contamination. Let us discuss the achieved results from these two points of view.

3.6.1. Influencing the NP Properties

The comparison of the PMDs of the four nozzles shows that the A251 nozzle is the most promising for application as a source of NPs. The tungsten core of A251 emits the most NPs, and at the same time, the PMD is relatively narrow. Increasing the nozzle temperature shifts the PMD maximum to lower diameters. This thermal effect can be utilized for controlling the size of the NPs.
The direct emission of tungsten NPs is not probable due to a very high melting point and not much lower sublimation temperature (see Table 2). We assume that the emission of WO3-based oxides is crucial for the A251 NP production. The WO3 growth is significant already at a lower temperature. Togaru et al. [54] determined the growth rate of tungsten oxide film in an atmosphere with 2% oxygen at a temperature of 900 °C of about 5 nm/min. The gravimetrically determined growth rate at the same temperature is about 12 mg cm−2 h−1 [55]. It increases rapidly with temperature. The thermally grown WO3, which can be expected to form at the tungsten surface, starts to sublimate intensely already at 1000 °C. Such sublimation is utilized for WO3−x film deposition at low-pressure conditions [56], without competing oxidation process. Klein et al. [57] measured at this temperature in humid air the sublimation rate of tungsten oxide of 0.36 mg · cm 2 · h 1 . Some sources negate the sublimation of the WO3 in air at temperatures up to 1200 °C [58]. In any case, the WO3 boiling point is much lower than the sublimation point of tungsten. Consequently, the oxide emission starts at a lower temperature than that of tungsten. Since the sublimation rate depends exponentially on temperature, it can be expected that WO3 is removed much faster than growing in the much hotter cathodic arc spot. This correlates with the observation that after a long time of operation of nozzles with tungsten core, no oxide can be observed at the tungsten surface. It can be assumed that the entire thermally grown tungsten oxide deposit sublimates continuously in the advancing arc spot, as illustrated in Figure 5.

3.6.2. Sustaining a Glow Discharge

The ignition of the GD at atmospheric pressure is difficult because the free path of both electrons and ions is short. However, the high temperatures in the arc in the range of many thousands of K are accompanied by low effective pressure [59], enabling the GD. In this operation mode, the main erosion mechanism is the sputtering of the electrode material by the impact of positive ions extracted from the glow across the cathodic plasma sheath.
In many experiments, the transition from arc discharge to GD was observed. Korolev et al. [60,61,62] found out that at a current of fractions of an ampere, the discharge burns in a regime of normal glow rather than in an arc regime, and the area of the negative glow plasma smoothly moves over the cathode surface under the effect of gas flow. The pictures of the cathodic foot in gliding arc discharge show that the contact area between the discharge and the substrate is much larger than for the cathodic spot. The resulting lower current density at the electrode surface means the energy flux density is insufficient to melt the electrode surface.
The NP emission can be reduced by weakening the sputtering effect, which can be reduced by lowering the voltage and hence the ion energy, decreasing the current density, and lowering the cathode surface temperature. Reducing current and voltage compromises the arc’s power and the efficiency of the arc-based process. The reduction of the cathode surface temperature can be achieved by faster arc movement and good electrode cooling.
Since the NiO present at the surface of nickel electrodes has a very high melting point and decomposition temperature (see Table 4), the A450n is predistined for GD operation mode. The limitation of the nickel coating used is its thickness of less than 15 μ m. The maximum possible thickness of the nickel coating was not determined. The thicker coating may allow sustained low particle emission for longer than with the A450n nozzle, assuming sufficient cooling remains.

3.6.3. Role of the Droplet Emission

The emission of droplets from the cathodic arc spot under vacuum conditions is a broadly investigated phenomenon [63]. Siemroth et al. [64] have studied the molten droplets emitted from cathode spots of vacuum arcs for copper, tungsten, and titanium using a time-of-flight method. The emitted droplets are typically on the micrometer-to-sub-micrometer scale, with sizes ranging from approximately 0.2 to 100 μ m. While the exact size distribution depends on the specific cathode material and arc conditions, these droplets are a common feature of cathodic arc emission and are often referred to as “microparticles”. Since we have observed the droplet splats in a similar size range, deposited at the surfaces treated by PAA-PJ with both copper and tungsten nozzles, it can be assumed that this size range is valid for droplets emitted from the atmospheric pressure arc cathodic spot as well. The droplet emission from the molten cathode spot crater, as described in the simulation study by Kaufmann et al. [65], may be the mechanism of microparticle generation having a strong influence on the total amount of eroded material, but is out of the particle size of interest in this study.

3.6.4. Avoiding Contamination

The erosion rate is strongly affected by the residence time of the arc attachment over the same region of the cathode surface [66]. The displacement of the discharge roots on the electrodes prevents their erosion [67]. Numerous studies investigated the displacement of the cathodic arc spot, forced by the gas flow in the gliding (or blown) arcs [68]. The site of the current attachment continues its smooth displacement when the cathode spot spontaneously extinguishes. The events when the cathode spot abruptly relocates to a new place of attachment downstream are also observed. A spark cathode spot can be created. Then the discharge becomes attached to the cathode surface, and the site of current attachment remains stationary despite the gas flow. Such an effect occurs at the tips of PB3 nozzles when obstacles hinder the smooth rotation of the cathodic spot around the nozzle mouth. To such obstacles belong a fast gas flow at the nozzle, disrupting the circular motion of the cathodic spot, a mechanical scar at the nozzle mouth surface promoting the attachment of the arc, an insulating deposit at the nozzle surface difficult to “overjump” by the arc, or increased roughness due to a very long time of operation, offering the protrusions for arc attachment.

3.6.5. Role of Copper Oxidation

Under ambient conditions, copper (Cu) readily oxidizes to form a thin layer of both cuprous oxide (Cu2O) and cupric oxide (CuO). Initially, the surface reacts with oxygen to form Cu2O nanoparticles, which then grow and coalesce. With prolonged exposure, further oxidation can also lead to the formation of CuO, with the relative amounts depending on factors such as time, temperature, and humidity.
Since the melting point of Cu2O of 1232 °C is much higher than copper (see Table 2), less evaporation is expected from Cu2O than for Cu. However, the decomposition processes of the Cu oxides start already at the temperature of 900 °C. First, CuO decomposes to Cu2O and oxygen; then, Cu2O decomposes to Cu and oxygen. It means that these oxides can be removed from the copper surface, but different removal mechanisms are employed.
Additional physical processes can be considered for generating Cu oxide microparticles. Cu2O is a p-type semiconductor with conductivity increasing with temperature [69]. With increasing thickness of the oxide, more heat energy can be deposited in its bulk by the electric conduction of arc current to the copper surface. Since the thermal conductivity of Cu2O is low, the deposited heat can disrupt the oxide and produce the comparatively large oxide particles. This process exposes the bare copper surface and affects the path of the arc spot.
The oxidation process is sensitive to the composition of the plasma gas. One remarkable example is the influence of humidity on oxidation. It is known that an increase in water content in the arc-foot discharge gas accelerates the copper oxidation [70]. The cathodic arc spot, which extends deeper into the nozzle orifice, is ignited in dry air, typically with a relative humidity below 7%. The arc foot at the nozzle’s outer surface is exposed to much more humid ambient air with about 50% relative humidity. The position of the rotation track can also influence the copper oxidation chemistry. This effect is not relevant for our study, because the external vicinity of the nozzles is filled with the same dried air as the discharge zone. However, humidity can increase the spread of emitted NP sizes and reduce the controllability of the particle emission process. This fact makes the A350 nozzle not the first choice for controllable NP production.

4. Conclusions

The main conclusions are summarized in the following points:
  • The particle size distributions in the range 6 to 220 nm were measured in the plasma gas produced by the low-current, high-voltage, pulsed atmospheric arc plasma generator. The collected PNDs and PMDs, calculated under the assumption of spherical particles, and the cumulative PMDs were analyzed to understand the erosion mechanisms in the cathodic arc spot. Depending on the nozzle material (copper, tungsten, and nickel), different mechanisms of nozzle erosion are proposed to explain the measured particle distributions.
  • Under constant fast movement of the cathodic spot, the glow discharge was assumed for the cathodic foot as the source of NPs. This mechanism was supposed for the pristine nickel surface of the galvanically coated nozzle. The pristine nickel surface emitted the lowest number of NPs.
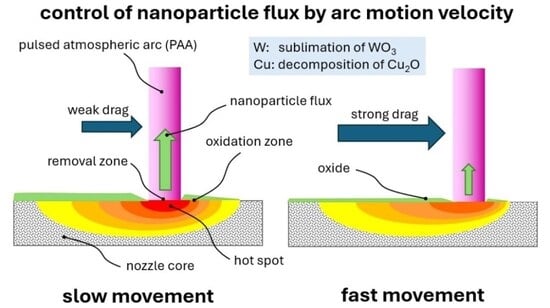
  • The highest number of NPs was emitted from the nozzle with a tungsten core (A251). Their PMD was very narrow and time-stable, indicating the constant velocity of the arc movement. Such conditions were most likely due to the elimination of ambient air movement, as the arc developed entirely within the nozzle. The maximum of the PMD could be controlled by temperature. Surface oxidation and subsequent sublimation/evaporation, followed by molecular oxide emission and aggregation, were expected to be the main sources of NPs. The most probable chemical composition of the particles was tungsten trioxide. It made the tungsten-core nozzles a good candidate for the synthesis of WO3 nanoparticles.
  • The NP distributions from the copper surface had a multimodal character. The slower the arc foot movement, the higher the particle emission. The primary reason for variations in arc velocity was the growth and decomposition of copper oxides, resulting in a rough, irregularly oxidized copper surface.
  • The cumulative PMDs determined for the nozzles with copper surface erosion showed that NPs of larger sizes than the maximum measured 220 nm could be expected. For these nozzles, the erosion rate calculated from the total PMD particle mass was significantly lower than the gravimetrically determined value.
  • The droplet particle emission mode was expected for strongly worn cathode surfaces. The cathodic arc foot, instead of moving smoothly, relocated abruptly between the melting zones. The residence time of the arc at each such zone was long enough to melt a larger amount of copper and establish stable generation of larger particles. However, sizes of the particles obtained from frozen droplets in the μ m range, not captured by our measurements, were expected.
  • For the pristine A251 nozzle (tungsten core), the PMDs could be fitted by a skew-normal function. It was much more difficult for A350 or A450e, because the PNDs and PMDs were multimodal and time-dependent, indicating the dynamically changing combination of different physical erosion conditions. The first PMD from the A450e nozzle could be modeled by an overlap of two skew-normal distributions, demonstrating the bimodality of the NP generation.
  • The results of this study allow for designing the nozzles with controlled NP emission. The main rules to minimize NP emission are to avoid gas flow instabilities and to promote a constant, high-velocity rotating cathodic arc spot. To avoid modulation of arc rotation velocity, strong air movements perpendicular to the nozzle axis should be minimized. The nozzle material can be optimized for operation with different gases and in various environments. In the air, the glossy surfaces with low oxide build-up are recommended.
  • More experimental work and simulations are needed to confirm the proposed mechanisms and to bridge the understanding of the fundamental physical and chemical mechanisms with the statistical distributions of cathodic arc spot emissions. The gained understanding of the erosion mechanisms enables the dimensioning of plasma gas extraction filters and the design of new nozzles with improved erosion control.

Author Contributions

The individual contributions of the authors are as follows: conceptualization, I.D. and F.F.; methodology, F.Z. and D.K.; software, L.K.; validation, H.-P.R.; formal analysis, D.K.; investigation, F.F., I.D., F.Z. and L.K.; resources, H.-P.R. and I.D.; data curation, D.K., L.K. and F.Z.; writing—original draft preparation, D.K.; writing—review and editing, D.K., F.Z. and I.D.; visualization, D.K.; supervision, F.F. and H.-P.R.; project administration, F.F. All authors have read and agreed to the published version of the manuscript.

Funding

This research received no external funding.

Institutional Review Board Statement

Not applicable.

Informed Consent Statement

Not applicable.

Data Availability Statement

The data supporting reported results can be obtained upon request from the corresponding author.

Conflicts of Interest

The authors F.Z., L.K. and H.-P.R. declare no conflicts of interest. The authors D.K., I.D. and F.F. are employees of the company, relyon plasma GmbH.

Abbreviations

The following abbreviations are used in this manuscript:
ACAlternating current
APPAtmospheric pressure plasma
APPJAtmospheric pressure plasma jet
CAPPCold atmospheric pressure plasma
CDACompressed dry air
DCDirect current
DMADifferential mobility analyzer
EOLEnd-of-life
HEPAHigh efficiency particulate air
HVHigh voltage
MFCMass flow controller
MFMMass flow meter
NPNanoparticles
PAA-PJPulsed atmospheric arc plasma jet
PCRFParticle concentration reduction factor
PAWPlasma-activated water
PMDParticle mass distribution
PNDParticle number distribution
PTLPlasma-treated liquid
SLMStandard liter per minute
SMPSScanning mobility particle sizer
UVUltraviolet light

References

  1. Lu, X.; Laroussi, M.; Puech, V. On atmospheric-pressure non-equilibrium plasma jets and plasma bullets. Plasma Sources Sci. Technol. 2012, 21, 034005. [Google Scholar] [CrossRef]
  2. Winter, J.; Brandenburg, R.; Weltmann, K.D. Atmospheric pressure plasma jets: An overview of devices and new directions. Plasma Sources Sci. Technol. 2015, 24, 064001. [Google Scholar] [CrossRef]
  3. Laroussi, M.; Akan, T. Arc-free atmospheric pressure cold plasma jets: A review. Plasma Process. Polym. 2007, 4, 777–778. [Google Scholar] [CrossRef]
  4. Fanelli, F.; Fracassi, F. Atmospheric pressure non-equilibrium plasma jet technology: General features, specificities and applications in surface processing of materials. Surf. Coat. Technol. 2017, 322, 174–201. [Google Scholar] [CrossRef]
  5. Hsu, Y.w.; Yang, Y.j.; Wu, C.y.; Hsu, C.c. Downstream characterization of an atmospheric pressure pulsed arc jet. Plasma Chem. Plasma Process. 2010, 30, 363–372. [Google Scholar] [CrossRef]
  6. Hsu, C.C.; Wu, C.Y. Electrical characterization of the glow-to-arc transition of an atmospheric pressure pulsed arc jet. J. Phys. D Appl. Phys. 2009, 42, 215202. [Google Scholar] [CrossRef]
  7. Léoment, S.; Salem, D.B.; Carton, O.; Pulpytel, J.; Arefi-Khonsari, F. Influence of the nozzle material on an atmospheric pressure nitrogen plasma jet. IEEE Trans. Plasma Sci. 2014, 42, 2480–2481. [Google Scholar] [CrossRef]
  8. Szulc, M.; Forster, G.; Marques-Lopez, J.L.; Schein, J. A simple and compact laser scattering setup for characterization of a pulsed low-current discharge. Appl. Sci. 2022, 12, 6915. [Google Scholar] [CrossRef]
  9. Szulc, M.; Forster, G.; Marques-Lopez, J.L.; Schein, J. Spectroscopic characterization of a pulsed low-current high-voltage discharge operated at atmospheric pressure. Appl. Sci. 2022, 12, 6366. [Google Scholar] [CrossRef]
  10. Szulc, M.; Forster, G.; Marques-Lopez, J.L.; Schein, J. Influence of pulse amplitude and frequency on plasma properties of a pulsed low-current high-voltage discharge operated at atmospheric pressure. Appl. Sci. 2022, 12, 6580. [Google Scholar] [CrossRef]
  11. Noeske, M.; Degenhardt, J.; Strudthoff, S.; Lommatzsch, U. Plasma jet treatment of five polymers at atmospheric pressure: Surface modifications and the relevance for adhesion. Int. J. Adhes. Adhes. 2004, 24, 171–177. [Google Scholar] [CrossRef]
  12. Lommatzsch, U.; Pasedag, D.; Baalmann, A.; Ellinghorst, G.; Wagner, H.E. Atmospheric pressure plasma jet treatment of polyethylene surfaces for adhesion improvement. Plasma Process. Polym. 2007, 4, S1041–S1045. [Google Scholar] [CrossRef]
  13. Palleiro, C.; Stepanov, S.; Rodríguez-Senín, E.; Wilken, R.; Ihde, J. Atmospheric pressure plasma surface treatment of thermoplastic composites for bonded joints. In Proceedings of the 20th International Conference on Composite Materials—ICCM20, Copenhagen, Denmark, 19–24 July 2015; pp. P101–P112. [Google Scholar]
  14. Ohkubo, Y.; Endo, K.; Yamamura, K. Adhesive-free adhesion between heat-assisted plasma-treated fluoropolymers (PTFE, PFA) and plasma-jet-treated polydimethylsiloxane (PDMS) and its application. Sci. Rep. 2018, 8, 18058. [Google Scholar] [CrossRef]
  15. Kim, M.C.; Yang, S.H.; Boo, J.H.; Han, J.G. Surface treatment of metals using an atmospheric pressure plasma jet and their surface characteristics. Surf. Coat. Technol. 2003, 174–175, 839–844. [Google Scholar] [CrossRef]
  16. Kim, M.C.; Song, D.K.; Shin, H.S.; Baeg, S.H.; Kim, G.S.; Boo, J.H.; Han, J.G.; Yang, S.H. Surface modification for hydrophilic property of stainless steel treated by atmospheric-pressure plasma jet. Surf. Coat. Technol. 2003, 171, 312–316. [Google Scholar] [CrossRef]
  17. Toshifuji, J.; Katsumata, T.; Takikawa, H.; Sakakibara, T.; Shimizu, I. Cold arc-plasma jet under atmospheric pressure for surface modification. Surf. Coat. Technol. 2003, 171, 302–306. [Google Scholar] [CrossRef]
  18. Käppler, I.; Hund, R.D.; Cherif, C. Surface modification of carbon fibers using plasma technique. AUTEX Res. J. 2014, 14, 34–38. [Google Scholar] [CrossRef]
  19. Hirman, M.; Navratil, J.; Soukup, R.; Hamacek, A.; Steiner, F. Influence of flexible substrate roughness with aerosol jet printed pads on the mechanical shear strength of glued joints. In Proceedings of the 40th International Spring Seminar on Electronics Technology (ISSE), Sofia, Bulgaria, 10–14 May 2017; pp. 1–6. [Google Scholar] [CrossRef]
  20. Hsu, Y.W.; Li, H.C.; Yang, Y.J.; Hsu, C.C. Deposition of zinc oxide thin films by an atmospheric pressure plasma jet. Thin Solid Films 2011, 519, 3095–3099. [Google Scholar] [CrossRef]
  21. Korzec, D.; Nettesheim, S. Application of a pulsed atmospheric arc plasma jet for low-density polyethylene coating. Plasma Process. Polym. 2020, 17, 1900098. [Google Scholar] [CrossRef]
  22. Korzec, D.; Nettesheim, S.; Ammon, A. Plasmawerkzeug für den Flussmittelauftrag auf Leiterplatten. In Atmosphärische Plasmen: Anwendungen-Entwicklungen-Anlagen; Horn, K., Ed.; Anwenderkreis Atmosphärendruckplasma-ak-adp: Jena, Germany, 2019; pp. 158–167. [Google Scholar]
  23. Köhler, R.; Sauerbier, P.; Militz, H.; Viöl, W. Atmosphereic pressure plasma coating of wood and MDF with polyester powder. Coatings 2017, 7, 171. [Google Scholar] [CrossRef]
  24. Jnido, G.; Ohms, G.; Viöl, W. Deposition of TiO2 thin films on wood substrate by an air atmospheric pressure plasma jet. Coatings 2019, 9, 441. [Google Scholar] [CrossRef]
  25. Köhler, R.; Ohms, G.; Militz, H.; Viöl, W. Atmosphereic pressure plasma coating of bismuth oxide circular droplets. Coatings 2018, 8, 312. [Google Scholar] [CrossRef]
  26. Szulc, M.; Schein, S.; Schaup, J.; Zimmermann, S.; Schein, J. Suitability of thermal plasmas for large-area bacteria inactivation on temperature-sensitive surfaces—First results with Geobacillus stearothermophilus spores. Iop Conf. Ser. J. Phys. 2017, 825, 012017. [Google Scholar] [CrossRef]
  27. Joshi, I.; Salvi, D.; Schaffner, D.W.; Karwe, M.V. Characterization of microbial inactivation using plasma-activated water and plasma-activated acidified buffer. J. Food Prot. 2018, 81, 1472–1480. [Google Scholar] [CrossRef] [PubMed]
  28. Ahrens, M.; Böltl, S.; Marson, J.; Mansi, S.; Mela, P. Plasma-activated water for the decontamination of textiles: A proof-of-concept study using Escherichia coli and Staphylococcus aureus. J. Water Process Eng. 2025, 71, 107317. [Google Scholar] [CrossRef]
  29. Steinhäußer, L.S.; Hain, K.; Lachmann, K.; Weile, D.; Gotzmann, G. Production, shelf life and surface sanitizing efficacy of plasma-treated liquids. Surf. Coatings Technol. 2025, 508, 132092. [Google Scholar] [CrossRef]
  30. Beilis, I.I. The phenomenon of a cathode spot in an electrical arc: The current understanding of the mechanism of cathode heating and plasma generation. Plasma 2024, 7, 329–354. [Google Scholar] [CrossRef]
  31. Hontañón, E.; Palomares, J.M.; Stein, M.; Guo, X.; Engeln, R.; Nirschl, H.; Kruis, F.E. The transition from spark to arc discharge and its implications with respect to nanoparticle production. J. Nanoparticle Res. 2013, 15, 1957. [Google Scholar] [CrossRef]
  32. Pearson, J.B. Aspects of Energy Transport in a Vortex Stabilized Arc. Ph.D. Thesis, The University of British Columbia, Department of Physics, Vancouver, BC, Canada, 1985. [Google Scholar]
  33. relyon plasma GmbH. Operating Instructions: PlasmaBrusch PB3 Integration. 2021. Available online: https://www.relyon-plasma.com/wp-content/uploads/2024/03/F0355100_BA_plasmabrush_PB3_Integration_EN__V01_iA.pdf (accessed on 5 September 2025).
  34. relyon plasma GmbH. Operating Instructions: Plasma generator PG31. 2014. Available online: http://www.relyon-plasma.com/wp-content/uploads/2016/05/plasma-generator-pg31-manual-EN_F0298601.pdf (accessed on 12 April 2019).
  35. Korzec, D.; Hoffmann, M.; Nettesheim, S. Application of plasma bridge for grounding of conductive substrates treated by transferred pulsed atmospheric arc. Plasma 2023, 6, 139–161. [Google Scholar] [CrossRef]
  36. relyon plasma GmbH. Data Sheet: Nozzle A250. 2015. Available online: https://www.relyon-plasma.com/wp-content/uploads/2016/05/nozzle-a250-data-sheet-EN.pdf (accessed on 5 September 2025).
  37. relyon plasma GmbH. Data Sheet: Nozzle A450. 2021. Available online: https://www.relyon-plasma.com/wp-content/uploads/2021/08/210802_Data_sheet_A450_EN_i.A..pdf (accessed on 5 September 2025).
  38. relyon plasma GmbH. Data Sheet: Nozzle A350. 2021. Available online: https://www.relyon-plasma.com/wp-content/uploads/2021/08/210802_Data_sheet_A350_EN_i.A..pdf (accessed on 5 September 2025).
  39. Martienssen, W.; Warlimont, H. (Eds.) The elements. In Handbook of Condensed Matter and Materials Data; Springer: Berlin/Heidelberg, Germany, 2005; Chapter 2.1.5; pp. 45–158. [Google Scholar]
  40. Mrowec, S.; Grzesik, Z. Oxidation of nickel and transport properties of nickel oxide. J. Phys. Chem. Solids 2004, 65, 1651–1657. [Google Scholar] [CrossRef]
  41. Feng, J. Scalable Spark Ablation Synthesis of Nanoparticles Fundamental Considerations and Application in Textile Nanofinishing. Ph.D. Thesis, Delft University of Technology, Delft, The Netherlands, 2016. Available online: https://pure.tudelft.nl/ws/portalfiles/portal/49559259/Feng_dissertation.pdf (accessed on 17 August 2025).
  42. Masuda, H.; Higashitani, K.; Yoshida, H. (Eds.) Powder Technology Handbook; Taylor & Francis: New York, NY, USA, 2006; Chapter I; pp. 3–93. [Google Scholar]
  43. Li, X.; Fu, L.; Karimi-Maleh, H.; Chen, F.; Zhao, S. Innovations in WO3 gas sensors: Nanostructure engineering, functionalization, and future perspectives. Heliyon 2024, 10, e27740. [Google Scholar] [CrossRef]
  44. Whitby, E.R.; McMurry, P.H. Modal aerosol dynamics modeling. Aerosol Sci. Technol. 1997, 27, 673–688. [Google Scholar] [CrossRef]
  45. Bethea, R.M.; Duran, B.S.; Boullion, T.L. Statistical Methods for Engineers and Scientists; Marcel Dekker: New York, NY, USA, 1985; Chapter 3.3.7; p. 698. [Google Scholar]
  46. Bronshtein, I.; Semendyayev, K.A.; Musiol, G.; Muehlig, H. Logarithmic normal distribution. In Handbook of Methematics, 4th ed.; Springer: Berlin/Heidelberg, Germany; New York, NY, USA, 2004; Chapter 16.2.4.3; pp. 757–758. ISBN 3-540-43491-7. [Google Scholar]
  47. Limpert, E.; Stahel, W.A.; Abbt, M. Log-normal distributions across the sciences: Keys and clues: On the charms of statistics, and how mechanical models resembling gambling machines offer a link to a handy way to characterize log-normal distributions, which can provide deeper insight into variability and probability—normal or log-normal: That is the question. BioScience 2001, 51, 341–352. [Google Scholar] [CrossRef]
  48. Heintzenberg, J. Properties of the log-normal particle size distribution. Aerosol Sci. Technol. 1994, 21, 46–48. [Google Scholar] [CrossRef]
  49. Feng, J.; Huang, L.; Ludvigsson, L.; Messing, M.E.; Maisser, A.; Biskos, G.; Schmidt-Ott, A. General approach to the evolution of singlet nanoparticles from a rapidly quenched point source. J. Phys. Chem. C 2016, 120, 621–630. [Google Scholar] [CrossRef]
  50. Ashour, S.K.; Abdel-hameed, M.A. Approximate skew normal distribution. J. Adv. Res. 2010, 1, 341–350. [Google Scholar] [CrossRef]
  51. Corbella, C.; Portal, S.; Kundrapu, M.N.; Keidar, M. Nanosynthesis by atmospheric arc discharges excited with pulsed-DC power: A review. Nanotechnology 2022, 33, 342001. [Google Scholar] [CrossRef] [PubMed]
  52. Mandilas, C.; Daskalos, E.; Karagiannakis, G.; Konstandopoulos, A.G. Synthesis of aluminium nanoparticles by arc plasma spray under atmospheric pressure. Mater. Sci. Eng. B 2013, 178, 22–30. [Google Scholar] [CrossRef]
  53. Kohut, A. On the Plasma and Electrode Erosion Processes in Spark Discharge Nanoparticle Generators. Ph.D. Thesis, Doctoral School of Physics, Department of Optics and Quantum Electronics, Faculty of Science and Informatics, University of Szeged, Szeged, Hungary, 2017. Available online: https://doktori.bibl.u-szeged.hu/id/eprint/4102/1/PhD_Dissertation_Attila_Kohut.pdf (accessed on 26 October 2025).
  54. Togaru, M.; Sainju, R.; Zhang, L.; Jiang, W.; Zhu, Y. Direct observation of tungsten oxidation studied by in situ environmental TEM. Mater. Charact. 2021, 174, 111016. [Google Scholar] [CrossRef]
  55. Habainy, J.; Iyengar, S.; Surreddi, K.B.; Lee, Y.; Dai, Y. Formation of oxide layers on tungsten at low oxygen partial pressures. J. Nucl. Mater. 2018, 506, 26–34. [Google Scholar] [CrossRef]
  56. Yu, H.; Yang, J.; Fickl, B.; Guan, S.; Burton, O.J.; Wyatt-Moon, G.; Flewitt, A.; Bayer, B.C.; Hofmann, S. A close-space sublimation approach to tungsten oxide and sulfide nanostructure formation. Nanoscale 2025, 17, 21070–21082. [Google Scholar] [CrossRef]
  57. Klein, F.; Litnovsky, A.; Wegener, T.; Tan, X.; Gonzalez-Julian, J.; Rasinski, M.; Schmitz, J.; Linsmeier, C.; Bram, M.; Coenen, J.W. Sublimation of advanced tungsten alloys under DEMO relevant accidental conditions. Fusion Eng. Des. 2019, 146, 1198–1202. [Google Scholar] [CrossRef]
  58. Wendel, J. Thermodynamics and Kinetics of Tungsten Oxidation and Tungsten Oxide Sublimation in the Temperature Interval 200°-1100°. 2014. Available online: https://api.semanticscholar.org/CorpusID:93911267 (accessed on 25 October 2025).
  59. Korolev, Y.D.; Frants, O.B.; Landl, N.V.; Geyman, V.G.; Suslov, A.I. Parameters of a positive column in a gliding glow discharge in air. Phys. Plasmas 2017, 24, 103526. [Google Scholar] [CrossRef]
  60. Korolev, Y.D.; Frants, O.B.; Landl, N.V.; Bolotov, A.V.; Nekhoroshev, V.O. Features of a near-cathode region in a gliding arc discharge in air flow. Plasma Sources Sci. Technol. 2014, 23, 054016. [Google Scholar] [CrossRef]
  61. Korolev, Y.D. Low-current discharge plasma jets in a gas flow. Application of plasma jets. Russ. J. Gen. Chem. 2015, 85, 1311–1325. [Google Scholar] [CrossRef]
  62. Korolev, Y.D.; Nekhoroshev, V.O.; Frants, O.B.; Landl, N.V.; Suslov, A.I.; Geyman, V.G. Nonsteady-state processes in a low-current discharge in airflow and formation of a plasma jet. J. Phys. Commun. 2019, 3, 085002. [Google Scholar] [CrossRef]
  63. Takikawa, H.; Tanoue, H. Review of cathodic arc deposition for preparing droplet-free thin films. IEEE Trans. Plasma Sci. 2007, 35, 992–999. [Google Scholar] [CrossRef]
  64. Siemroth, P.; Laux, M.; Pursch, H.; Sachtleben, J.; Balden, M.; Rohde, V.; Neu, R. Investigation of vacuum arc droplets from copper, titanium, and tungsten by means of light scattering. IEEE Trans. Plasma Sci. 2022, 50, 2736–2744. [Google Scholar] [CrossRef]
  65. Kaufmann, H.T.C.; Cunha, M.D.; Benilov, M.S.; Hartmann, W.; Wenzel, N. Detailed numerical simulation of cathode spots in vacuum arcs: Interplay of different mechanisms and ejection of droplets. J. Appl. Phys. 2017, 122, 163303. [Google Scholar] [CrossRef]
  66. Munz, R.; Szente, R.; Drouet, M. Arc behaviour and plasma chemistry in electrode erosion. Pure Appl. Chern. 1992, 64, 657–663. [Google Scholar] [CrossRef]
  67. Czernichowski, A. Gliding arc. Applications to engineering and environment control. Pure Appl. Chem. 1994, 66, 1301–1310. [Google Scholar] [CrossRef]
  68. Fridman, A.; Nester, S.; Kennedy, L.A.; Saveliev, A.; Mutaf-Yardimci, O. Gliding arc gas discharge. Prog. Energy Combust. Sci. 1999, 25, 211–231. [Google Scholar] [CrossRef]
  69. Kudryashov, D.; Gudovskikh, A.; Zelentsov, K.; Mozharov, A.; Babichev, A.; Filimonov, A. The temperature dependence of the electrical conductivity in Cu2O thin films grown by magnetron sputtering. J. Phys. Conf. Ser. 2016, 741, 012013. [Google Scholar] [CrossRef]
  70. Li, B.; Zhao, Y.; Ji, R.; Dong, H.; Wei, N. Arc dynamics and erosion behavior of pantograph-catenary contacts under controlled humidity levels. Sensors 2025, 25, 5208. [Google Scholar] [CrossRef] [PubMed]
Figure 1. The nozzles used for NP generation: (a) The photograph of four nozzles. (b) The schematic cross-sections of the three nozzle geometries with characteristic arc positions depicted.
Plasma 08 00044 g001
Figure 2. The erosion of the A450e nozzle: (a) The front view. (b) Magnification of a molten ball.
Plasma 08 00044 g002
Figure 3. Setup used for PND measurement of the NPs emitted from the nozzles: (a) The main gas flow. (b) The dilution and measurement.
Plasma 08 00044 g003
Figure 4. The PNDs collected at the beginning of the measurement for four nozzles. The embedded table contains the maximum particle numbers per size interval and the particle size at which each maximum occurs.
Plasma 08 00044 g004
Figure 5. Idealized visualization of the impact of the arc on temperature distribution under the cathodic arc spot: (a) Not moving arc. (b) The arc shifted by strong gas motion drag.
Plasma 08 00044 g005
Figure 6. The PND evolution during plasma generation in the A251 nozzle.
Plasma 08 00044 g006
Figure 7. The PND evolution during plasma generation in the A450e nozzle.
Plasma 08 00044 g007
Figure 8. The PND evolution during plasma generation in the A350 nozzle.
Plasma 08 00044 g008
Figure 9. The variation in the A450n nozzle PND during plasma generation.
Plasma 08 00044 g009
Figure 10. The PMDs for the nozzle A251.
Plasma 08 00044 g010
Figure 11. The PMDs for the nozzle A450e.
Plasma 08 00044 g011
Figure 12. The PMDs for the nozzle A350.
Plasma 08 00044 g012
Figure 13. The relative cumulative PMDs for the nozzle A251. The embedded table contains the particle diameters for 50% and 95% of the total mass, respectively.
Plasma 08 00044 g013
Figure 14. The relative cumulative PMDs for the nozzle A450n. The embedded table contains the particle diameters for 50% and 95% of the total mass, respectively.
Plasma 08 00044 g014
Figure 15. The relative cumulative PMDs for the A350 nozzle. The embedded table contains the particle diameters for 50% and 95% of the total mass, respectively.
Plasma 08 00044 g015
Figure 16. The relative cumulative PMDs for the A450e nozzle. The embedded table contains the particle diameters for 50% and 95% of the total mass, respectively.
Plasma 08 00044 g016
Figure 17. The PMD from Figure 10 together with a normal distribution fit (blue line) according to Equation (7) and logarithmic normal distribution fit (green line) according to Equation (8). The embedded table summarizes the parameters used to plot both fitting curves.
Plasma 08 00044 g017
Figure 18. The PMDs from Figure 10 with the skew normal fits according to Equation (9). The embedded table summarizes the parameters used to plot the fitting curves.
Plasma 08 00044 g018
Figure 19. The PMD of the A450e distribution for time 0 min with two skew normal fits according to Equation (9). The fit parameters are summarized in the table in the diagram. The blue line is the sum of both skew-normal functions.
Plasma 08 00044 g019
Table 1. The properties of the four nozzles used for the PND measurement.
NozzleNumber of GrovesCore MaterialCoatingConditionPlume TemperatureArc LengthOrifice Diameter
A2511Wnopristine200 °C *)3 cm3.0 mm
A3502Cuno100 h500 °C *)5 cm3.8–4.0 mm
A450n3Cu10–15  μ m Nipristine700 °C *)7 cm4.2 mm
A450e3CunoEOLn.a.8 cm4.7–5.0 mm
*) The typical temperature measured statically in a distance of 10 mm from the nozzle tip.
Table 2. Selected properties of tungsten, nickel, and copper [39].
MetalAtomic Mass [ u ] Mass Density [ kg · m 3 ] Melting Point [°C]Boiling Point [°C]Thermal Conductivity [ W · m 1 · K 1 ] Electrical Conductivity [ MS · m 1 ] Ionization Energy [ eV ]
W183.8419,30034222500 *)164187.98
Ni58.698900145527309114.37.64
Cu63.5489601085256240159.67.73
*) The temperature at which sublimation of a significant amount of tungsten starts.
Table 3. The total mass of particles, calculated for four nozzles over five periods after the start of measurements.
M N Units0 min2 min4 min6 min8 min
A251 10 13 kg 7.24.23.02.4
A450n 10 16 kg 3.85.46.0
A350 10 12 kg 1.01.11.31.22.1
A450e 10 13 kg 1.91.71.71.6
Table 4. Selected properties of oxides of tungsten, nickel, and copper.
OxideMolar Mass [g · mol−1]Mass Density [kg · m−3]Melting Point [°C]Boiling Point [°C]Thermal Conductivity [W · m−1] · K−1]Electrical Conductivity [S · m−1]Dielectric Loss Factor tg δ
WO3231.8471601473∼1700 *)1.6 9 × 10 5 –20.9
NiO74.69667019840.140.011.0
CuO75.5563101326 **)7010– 10 4 0.074
Cu2O143.026000123218000.6 10 6 –0.10.04
*) Sublimates before reaching the boiling point. **) The temperature of decomposition.
Disclaimer/Publisher’s Note: The statements, opinions and data contained in all publications are solely those of the individual author(s) and contributor(s) and not of MDPI and/or the editor(s). MDPI and/or the editor(s) disclaim responsibility for any injury to people or property resulting from any ideas, methods, instructions or products referred to in the content.

