Abstract
Zirconolite is a wasteform that can immobilize Pu. Herein, zirconolites comprising Ce as a Pu simulant and Al as a charge compensator of Ce/Pu were synthesized by sintering raw CaO, ZrO2, TiO2, CeO2, and Al2O3 powder mixtures at 1400 °C in static air. The reduction behavior and phase transformation of zirconolites during their heat treatment in an Ar–H2 gas flow were investigated. In pure and Ce–Al co-doped zirconolite compositions, 2M-zirconolite and small amounts of perovskite were obtained after sintering. In contrast, 2M-, 4M-zirconolite and relatively large amounts of perovskite were obtained in Ce-doped zirconolite composition. All zirconolite compositions first underwent reduction at ~1050 °C by forming a small domain of perovskite phase. Ce–Al co-doped zirconolite showed a smaller fraction of phase transformation in perovskite than Ce-doped zirconolite, indicating the advantage of using a charge compensator to prevent perovskite formation.
1. Introduction
Several wasteforms have been developed to immobilize radioactive materials. Ringwood et al. developed synthetic rock (SYNROC) [1] comprising several ceramics. It has a lower leaching rate, higher radiation tolerance, and higher thermal stability at high temperatures compared with glass [2,3,4].
Among SYNROCs, 2M-zirconolite (CaZrxTi3-xO7, x = 0.8–1.3) can contain plutonium (Pu) as a solid solution in its crystal structure [5,6]. Zirconolite is known to have many polytypes such as 2M, 4M, 3T, and 3O [7,8]. The synthesis of zirconolites has been extensively reported [9,10,11,12,13,14], and single-phase zirconolite can be obtained by sintering CaO (or CaCO3), ZrO2, TiO2, and PuO2 (or CeO2) powder mixtures with charge compensator in air, e.g., Ca0.8Ce0.2ZrTi1.8Al0.2O7 [15]. When synthesized in a reducing atmosphere, the single-phase zirconolite transforms into zirconolite in equilibrium with a perovskite (CaTiO3) phase containing Pu3+ (or Ce3+) [16]. Perovskite has a lower dissolution resistance than zirconolite in acids such as H2SO4 and HNO3 [17]; therefore, it offers poor stability to solidified product and resistance to Pu separation. Therefore, perovskite formation should be inhibited during Pu-containing zirconolite synthesis.
Although the formation of zirconolite and perovskite during synthesis of zirconolite from raw powders in a reducing atmosphere has been widely reported, there are few reports on the reduction in once synthesized zirconolite [18]. Begg et al. reported that pure (Pu-free) zirconolite phase completely transformed into perovskite and fluorite phases via reduction heat treatment at 1400 °C for 60 h. This phase transformation of zirconolite would reduce its chemical stability and is therefore considered to be a significant phenomenon.
Begg et al. performed reduction tests on zirconolite without Pu; however, it was not performed with Pu (Ce) or charge compensator. Therefore, reduction tests on zirconolites with Ce or charge compensator were performed in this study. Herein, zirconolites (CaZr1-xCexTi2O7, x = 0–0.35) were synthesized using Ce as the Pu simulant because of its similarity in ionic radii (rCe(+4) = 0.97 Å, rPu(+4) = 0.96 Å) [19] and oxidation state (tetravalent and trivalent), as well as (Ca1−yCeyZrTi2-2yAl2yO7, y = 0–0.35) with Al as a charge compensator to prevent Ce4+ reduction [5,20]. Al was used for its stability of oxidation state and similarity in ionic radii (rAl(+3) = 0.535 Å, rTi(+4) = 0.605 Å) [19]. Then, the effects of phase transformation via reduction heat treatment on the microstructure and structure of zirconolite, as well as the phase transformation temperature, were investigated.
2. Materials and Methods
2.1. Fabrication of Zirconolite
Zirconolites with Ce are as follows: CaZr1−xCexTi2O7; Ce-doped zirconolite, and Ce and Al (as a charge compensator) Ca1−yCeyZrTi2−2yAl2yO7. Ce–Al co-doped zirconolites were synthesized from their respective raw powders (CaO: 99.9% purity from FUJIFILM Wako Pure Chemical, Richmond, VA, USA; ZrO2: 98% purity from Kojundo Chemical Laboratory, Sakado, Japan; CeO2: 99.99% purity from Kojundo Chemical Laboratory; TiO2: 99.99% purity from Kojundo Chemical Laboratory; and Al2O3: 99.99% purity from Kojundo Chemical Laboratory). The powders were weighed with CaZrTi2O7 (x = 0), CaZr0.8Ce0.2Ti2O7 (x = 0.2), CaZr0.65Ce0.35Ti2O7 (x = 0.35), Ca0.8Ce0.2ZrTi1.6Al0.4O7 (y = 0.2), and Ca0.65Ce0.35ZrTi1.3Al0.7O7 (y = 0.35) as target compositions (Table 1); these were then mixer-milled (Retsch, MM400, Haan, Germany) at 20 Hz for 30 min. The five mixed powders were pressed at 400 MPa into compacts of 0.25–0.35 g and sintered at 1400 °C for 4 h in static air with a heating rate of 10 °C/min. The crystal structures of sintered specimens were analyzed via X-ray diffraction (XRD, Rigaku, Ultima IV, Tokyo, Japan) by scanning from 20° to 135° 2θ with a CuKα X-ray tube operating at 40 kV and 40 mA. The XRD patterns were collected at room temperature and ambient pressure. Then, Rietveld analysis was performed using the PDXL software (Rigaku, Ver.2.1). Quantitative phase analysis (QPA) was also calculated using the Rietveld method.

Table 1.
Dopant contents and target composition of zirconolite samples.
The microstructure of the specimens was observed using a scanning electron microscope (SEM) equipped with an Energy dispersive X-ray (EDX) spectroscopy (JEOL, SEM/EDX, JSM-IT200, Tokyo, Japan). EDX analyses were performed via standardless analysis using ZAF corrections with a 15 kV acceleration voltage.
2.2. Reduction in Zirconolite
To investigate the temperature at which the reduction begins, the mass changes in pure zirconolite (x = 0), Ce-doped zirconolite (x = 0.2), and Ce–Al co-doped zirconolite (y = 0.2) were investigated in situ using the BRUKER AXS, TG-DTA-2000SA thermobalance (TG). Pure zirconolite and other samples were heat-treated at 1400 °C in an Ar–4.5% H2 atmosphere (∆≒ −497 kJ/mol) at a heating rate of 20 °C/min for 3 and 5 h, respectively.
2.3. Characterization of Reduced Zirconolite
To investigate the phase transformation of zirconolite occurs and the behavior of Ce by reduction heat treatment, each specimen was heat-treated at 1400 °C for 10 h in an Ar–4.5% H2 atmosphere at a heating rate of 20 °C/min.
The crystal structures of specimens were analyzed via XRD, and the microstructure of the specimens was observed using SEM/EDX.
3. Results
3.1. Fabrication of Zirconolite
Figure 1 shows the XRD patterns of all specimens. As displayed in Figure 1, 2M-zirconolite (monoclinic unit cell, space group C2/c) and small amounts of perovskite reflections were observed in pure and Ce–Al co-doped zirconolite compositions, corresponding to the findings reported by Yudintsev et al. [21] and Begg et al. [22]. In contrast, 2M-zirconolite, 4M-zirconolite (monoclinic unit cell, space group C2/c), and relatively large amounts of perovskite reflections were observed in Ce-doped zirconolite compositions, corresponding to the Blackburn et al.’s findings [9]. Platinum reflections were derived from the specimen holder. Table 2 shows the ratios of crystalline phases. Perovskite phases of ~22 and 28 mol% was formed in Ce-doped zirconolite (x = 0.2 and 0.35), respectively. These fractions were higher than those reported by Blackburn et al. [9], possibly due to a short sintering time of 4 h in the present work. No perovskite reflections were obtained in Ce–Al co-doped zirconolite (y = 0.35), similarly to Zhong et al.’s report [5]. Table 3 shows the Rietveld refinement parameters.
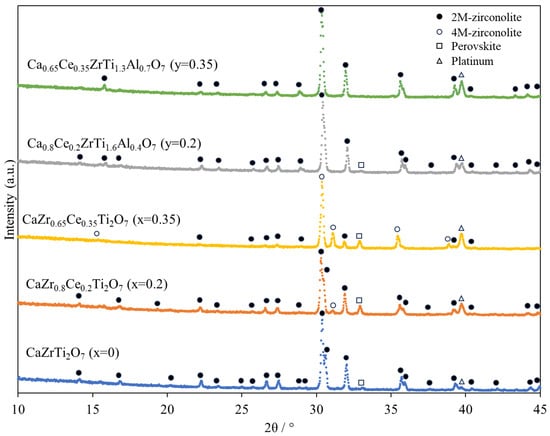
Figure 1.
Room-temperature XRD patterns of specimens sintered at 1400 °C for 4 h in static air. Platinum reflections correspond to the specimen holder.
Table 2.
Ratio of crystalline phases in the sintered specimens.
Table 3.
Refined structural parameters for CaZr1−xCexTi2O7 (0 ≤ x ≤ 0.35) and Ca1−yCeyZrTi2−2yAl2yO7 (0 ≤ y ≤ 0.35) determined from Rietveld analysis of X-ray diffraction data.
Figure 2 shows the SEM images and elemental mappings of sintered specimens. All the elements homogeneously overlapped in all areas, which were deemed zirconolite. Areas comprising Ca, Ti, Ce, and Al without Zr were also observed in all compositions, as indicated in red circles. The Zr-free areas were considered to be perovskite, as they are consistent with other reports that the perovskite phase contains no or very little Zr. [1,6,9] However, this phase was hardly detected via XRD in pure zirconolite and Ce–Al co-doped zirconolite. The Al-rich areas were also observed. These areas were considered to be residual Al2O3 from the raw powder.
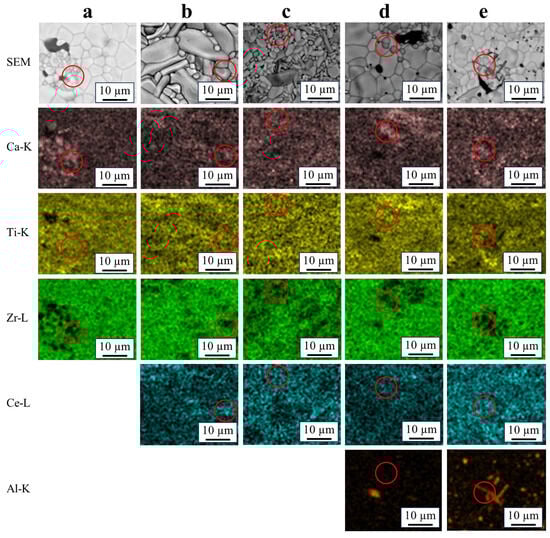
Figure 2.
EDX mapping of the specimens sintered at 1400 °C in static air for 4 h. (a): x = 0, (b): x = 0.2, (c): x = 0.35, (d): y = 0.2, and (e): y = 0.35. The red circled areas seem to be perovskite.
The spots in Figure 3 denote the elemental fractions of each sintered specimen. In CaZr0.8Ce0.2Ti2O7 (x = 0.2) and CaZr0.65Ce0.35Ti2O7 (x = 0.35), the Ce contents (Ce/(Zr+Ce)) measured via EDX were 0.22 and 0.37, respectively. The results indicated that Ce can be mostly substituted in the Zr site of Ce-doped zirconolites. In Ca0.8Ce0.2ZrTi1.6Al0.4O7 (y = 0.2) and Ca0.65Ce0.35ZrTi1.3Al0.7O7 (y = 0.35), the measured Ce contents (Ce/(Ca+Ce)) were 0.19 and 0.37, respectively (Table 4). Contrary to Ce-doped zirconolites, Ce can be mostly substituted in Ca site of Ce–Al co-doped zirconolites.
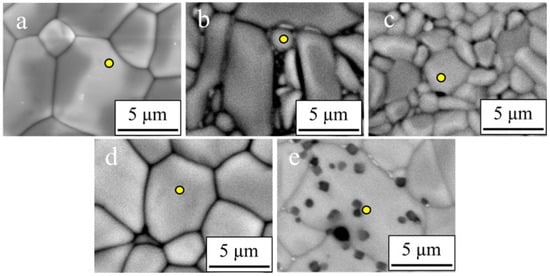
Figure 3.
SEM/EDX point analyses were conducted for each specimen sintered at 1400 °C for 4 h in static air. (a): x = 0, (b): x = 0.2, (c): x = 0.35, (d): y = 0.2, and (e): y = 0.35. The yellow points are the target point of point analyses.
Table 4.
The results of the EDX point analyses after sintering at 1400 °C for 4 h in static air.
3.2. Reduction in Zirconolite
Figure 4a,b show the mass change behavior and temperature differential of the mass change in sintered specimens during reduction heat treatment measured via TGA, respectively. For all the compositions, mass decrease began at ~1050 °C. For Ce-doped zirconolite, the mass decrease was larger above 1100 °C than that for pure zirconolite. Moreover, the total mass decrease was larger for Ce-doped zirconolite than that for Ce–Al co-doped zirconolite. TGA results showed that a 10 h holding time at 1400 °C was ideal for the saturation of reduction and was therefore applied to the specimens for XRD and EDX analyses.
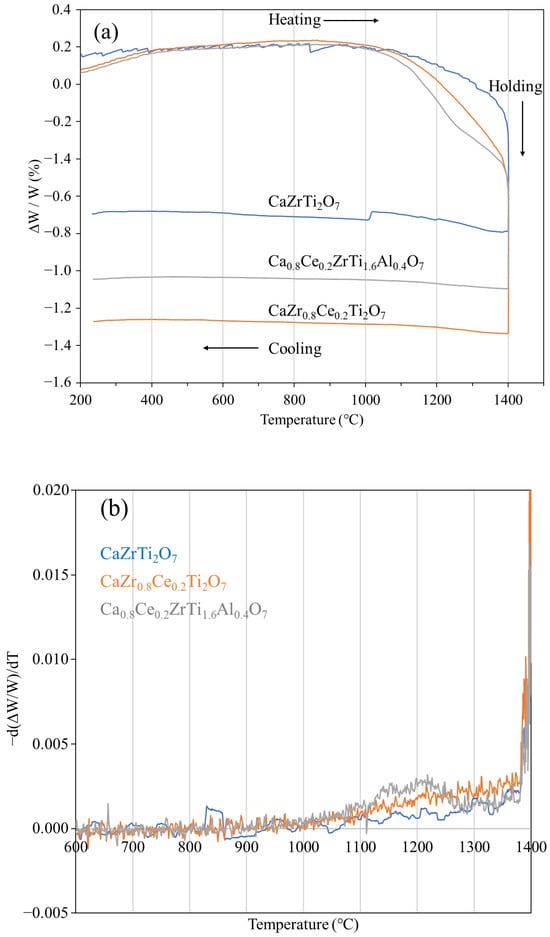
Figure 4.
Variations in the (a) mass change and (b) mass differential data as a function of temperature in sintered specimens during reduction heat treatment in Ar–4.5% H2.
3.3. Characterization of Reduced Zirconolite
Figure 5 shows the XRD patterns of specimens after reduction heat treatment. 2M-zirconolite and perovskite reflections were observed in all compositions. 4M-zirconolite reflections that were confirmed in Ce-doped zirconolite before reduction heat treatment disappeared after heat treatment. Table 5 shows the ratios of crystalline phases obtained via Rietveld analysis. Phase transformation from zirconolite to perovskite occurred in all compositions, which increased with increasing Ce content.
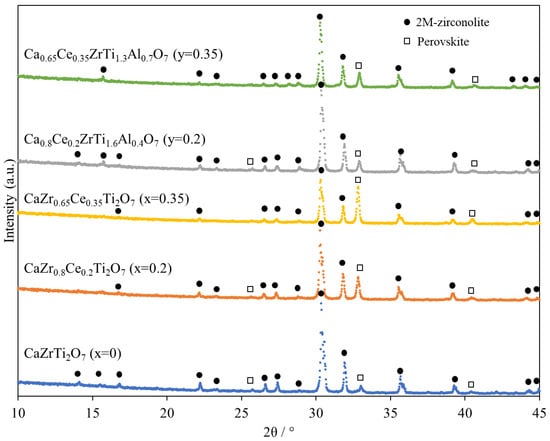
Figure 5.
Room-temperature XRD patterns of specimens after reduction heat treatment at 1400 °C for 10 h in Ar–4.5% H2.
Table 5.
Ratios of crystalline phases after reduction heat treatment at 1400 °C for 10 h in Ar–4.5% H2. The values in parentheses indicate crystalline phase content before the reduction heat treatment (from Table 1).
Figure 6 shows the SEM images and elemental mappings of specimens after reduction heat treatment. Relatively small grains were observed in all compositions compared with that in the specimens before the reduction heat treatment. These grains are indicated by red circles and were particularly noticeable in Ce-doped zirconolite (x = 0.35). The elemental mappings revealed that those small grains were free of Zr and were therefore regarded as perovskites, as also observed via XRD analysis. The spots in Figure 7 denote the elemental fractions of each sintered specimen. Table 6 shows the results of elemental fraction analyses of CaZr0.65Ce0.35Ti2O7 (x = 0.35) and Ca0.65Ce0.35ZrTi1.3Al0.7O7 (y = 0.35) before and after reduction heat treatment, for the spots shown in Figure 6. The Zr content in CaZr0.65Ce0.35Ti2O7 (x = 0.35) increased from 16.6 to 26.3 mol%, whereas the Ce content decreased from 9.8 to 5.2 mol%. In contrast, the Ce content in perovskite increased from 10.5 to 14.1 mol%. A similar trend was obtained in Ca0.65Ce0.35ZrTi1.3Al0.7O7 (y = 0.35).
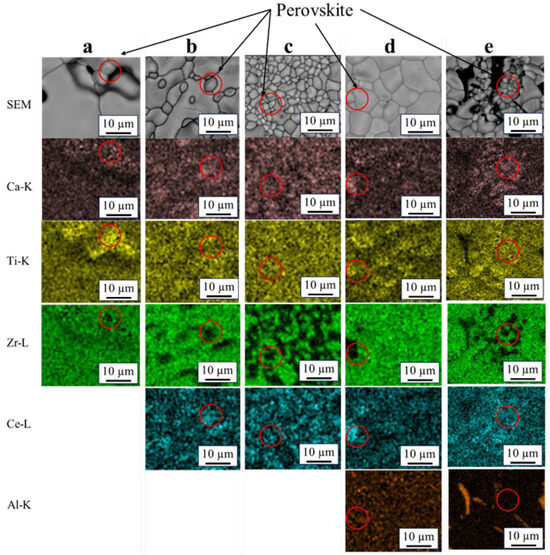
Figure 6.
EDX mapping after reduction heat treatment at 1400 °C for 10 h in Ar–4.5% H2. (a): x = 0, (b): x = 0.2, (c): x = 0.35, (d): y = 0.2, and (e): y = 0.35.
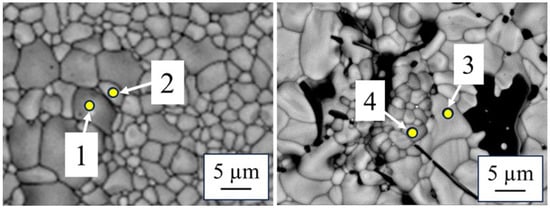
Figure 7.
Point analyses were conducted for specimens after reduction heat treatment at 1400 °C for 10 h in Ar–4.5% H2. Nos. 1 and 2 denote CaZr0.65Ce0.35Ti2O7 (x = 0.35), and Nos. 3 and 4 denote Ca0.65Ce0.35ZrTi1.3Al0.7O7 (y = 0.35). The yellow points are the target point of point analyses.
Table 6.
The results of the point analyses of specimens after reducing heat treatment at 1400 °C for 10 h in Ar-4.5% H2. Nos. 1 and 2 are CaZr0.65Ce0.35Ti2O7 (x = 0.35), and Nos. 3 and 4 are Ca0.65Ce0.35ZrTi1.3Al0.7O7 (y = 0.35). The values in parentheses are before reduction heat treatment.
4. Discussion
4.1. Zirconolite Fabrication
As shown in Figure 1 and Figure 2, Ce-doped zirconolite coexisted with 2M- and 4M-zirconolite. 4M-zirconolite is a monoclinic crystal structure with a unit cell that has double the c-axis of 2M-zirconolite, and both Ca and Zr sites are replaced by other cations, such as Ce. Thus, 4M-zirconolite can be substituted with more number of cations than 2M-zirconolite [23,24,25]. Ce is substituted at the Zr site in 2M-zirconolite, forming Ca(Zr,Ce)Ti2O7, because the cation ratio is Ca:(Zr+Ce):Ti ≈ 1:1:2 (Table 4). Contrarily, Ce is substituted at both the Ca and Zr sites in 4M-zirconolite, forming (Ca,Ce)(Zr,Ce)Ti2O7, as reported by Clark et al. [23]. On the other hand, for 2M-zirconolite in Ce–Al co-doped zirconolite, (Ca+Ce):Zr:(Ti+Al) ≈ 1:1:2, indicating the solid solution of (Ca,Ce)Zr(Ti,Al)2O7. The formation of perovskite phases was prevented in Ce–Al co-doped zirconolite compared to that in Ce-doped zirconolite. Ce4+ is reduced to Ce3+ during zirconolite sintering, which forms a Ce3+ containing perovskite phase [9,23]. However, during Ce–Al co-doped zirconolite synthesis, the reduction in Ce4+ to Ce3+ is prevented by the addition of Al2O3 (Al3+) as a charge compensator [15].
4.2. Reduction in Zirconolite
Begg et al. reported that pure zirconolite (CaZrTi2O7) undergoes phase transformation upon reduction due to the partial reduction in Ti4+ to Ti3+ [18], which is similar to the reduction in TiO2 at high temperatures [26]. TGA of pure zirconolite (Figure 4a) revealed that the reduction in Ti4+ began at ~1050 °C, which is higher than the thermal stability of the glass (borosilicate glass; 550 °C) and the temperature of the TiO2 being reduced (approximately 790 °C at ∆≒ −497 kJ/mol) [27,28]. This indicated that zirconolite is more resistant to reduction heat treatment than glass and TiO2. All compositions underwent mass decrease due to reduction heat treatment at ~1050 °C. As CeO2 undergoes reduction at lower temperatures [29], Ce is more resistant to reduction in solid solution in zirconolite than in its fluorite structure. Thus, it is reasonable to deduce that Pu would also exhibit the same behavior.
For Ce-doped zirconolite and Ce–Al co-doped zirconolite, the mass decrease at temperatures above 1100 °C was larger than that of pure zirconolite. This is because Ce4+ was more easily reduced than Ti4+ considering that CeO2 undergoes considerable reduction than TiO2 under same thermodynamic conditions [28,30]. Ce–Al co-doped zirconolite experienced lower mass decrease than Ce-doped zirconolite. This was considered to be due to the fact that when Ce–Al co-doped zirconolite was synthesized, Ce4+ was in the Ca site, and when reduced to Ce3+, the difference in ionic radii of the cations is smaller when Ce was dissolved in the Ca site than when dissolved in the Zr site (rCe(+3) = 1.14 Å, rCa(+2) = 1.12 Å, and rZr(+4) = 0.78 Å) [19].
4.3. Characterization of Reduced Zirconolite
The ratios of crystalline phases in pure zirconolite (CaZrTi2O7), Ce-doped zirconolite (CaZr0.65Ce0.35Ti2O7), and Ce–Al co-doped zirconolite (Ca0.65Ce0.35ZrTi1.3Al0.7O7) (Table 5) revealed an increase in the fraction of perovskite phase. Reduction heat treatment creates oxygen defects in pure zirconolite, and their charges were balanced by the reduction in Ti4+ to Ti3+. As the reduction progressed and the concentration of oxygen defects increased, the crystal structure could not be retained and a perovskite phase was formed. As a result, Ti3+ was present in a structure free of oxygen defects. Similarly, in Ce-doped zirconolite and Ce–Al co-doped zirconolite, as the reduction in Ce4+ and Ti4+ progressed and the concentration of oxygen defects increased, the crystal structure was not retained and a perovskite phase was formed. Compared to the Begg et al.’s report [18], the reduction heat treatment in this study was short, so the perovskite content may increase with longer heat treatment.
The perovskite phase content in pure zirconolite (CaZrTi2O7), Ce-doped zirconolite (CaZr0.65Ce0.35Ti2O7), and Ce–Al co-doped zirconolite (Ca0.65Ce0.35ZrTi1.3Al0.7O7) (Table 5) increased by ~9, 35, and 34 mol%, respectively, after the reduction heat treatment. The total perovskite phase content was 62.6 mol% in CaZr0.65Ce0.35Ti2O7 and 34.0 mol% in Ca0.65Ce0.35ZrTi1.3Al0.7O7, consistent with the TGA results.
Compared with Ce-doped zirconolite, Ce–Al co-doped zirconolite only contained a small amount of perovskite because the reduction in Ce4+ and Ti4+ was prevented by the addition of Al2O3 as a charge compensator. Moreover, the presence of Ce4+ in Ca site reduced the difference in ionic radii of cations even when Ce4+ was reduced to Ce3+, making the crystal structure highly difficult to decompose.
Table 6 shows that Zr and Ce contents in the zirconolite phase increased and decreased, respectively, whereas the Ce content in perovskite phase increased. These results indicated that Ce in the zirconolite phase segregated into the perovskite phase during the reduction heat treatment. As Ce4+ was reduced to Ce3+, it was less likely to be present in the Zr site in zirconolite and more likely to be positioned in the Ca site in perovskite due to its ionic radius and charge compensation. Thus, reduction heat treatment increased Ce3+ concentration in the zirconolite crystals, causing its phase transformation to perovskite containing Ce3+ as small grains.
5. Conclusions
Herein, the phase transformations in five zirconolites (un-doped, Ce-doped, and Ce–Al co-doped) during reduction heat treatment were investigated via XRD, SEM/EDX, and TG analyses. After the reduction heat treatment, zirconolite was partially transformed into perovskite in all compositions. When the specimens were exposed to an Ar–4.5% H2 gas mixture, all compositions first underwent reduction at ~1050 °C. Compared with Ce-doped zirconolites, Ce–Al co-doped zirconolites were less prone to transformation into perovskite. Moreover, the reduction in Ce4+ and Ti4+ was inhibited by adding Al3+ as the charge compensator. After the reduction heat treatment, Ce in the zirconolite phase was segregated into the perovskite phase. From the viewpoint of nuclear nonproliferation, it is important to use zirconolite with Al-doping as a stable solidification product for Pu to make its extraction difficult. An increased reduction resistance of Pu results in less perovskite formation, making Pu extraction difficult. Therefore, Pu-doped zirconolite can be synthesized by adding a charge compensator to enhance its reduction resistance and prevent perovskite formation.
Author Contributions
Conceptualization, K.H., S.H. and T.M.; formal analysis, K.H. and S.H.; Investigation, T.Y. and T.S.; writing—original draft, K.H. and S.H.; writing—review and editing, K.H., S.H. and K.S.; supervision, T.M. and K.S. All authors have read and agreed to the published version of the manuscript.
Funding
This research received no external funding.
Institutional Review Board Statement
Not applicable.
Informed Consent Statement
Not applicable.
Data Availability Statement
The original contributions presented in this study are included in the article. Further inquiries can be directed to the corresponding author.
Conflicts of Interest
Authors Tadahisa Yamada and Takeo Sunaoshi were employed by the Inspection Development Company. The remaining authors declare that the research was conducted in the absence of any commercial or financial relationships that could be construed as a potential conflict of interest.
References
- Ringwood, A.E.; Kesson, S.E.; Ware, N.G.; Hibberson, W.O.; Major, A. The SYNROC process: A geochemical approach to nuclear waste immobilization. Geochem. J. 1979, 13, 141–165. [Google Scholar] [CrossRef]
- Deschanels, X.; Seydoux-Guillaume, A.M.; Magnin, V.; Mesbah, A.; Tribet, M.; Moloney, M.P.; Serruys, Y.; Peuget, S. Swelling induced by alpha decay in monazite and zirconolite ceramics: A XRD and TEM comparative study. J. Nucl. Mater. 2014, 448, 184–194. [Google Scholar] [CrossRef]
- Vance, E.R.; Lumpkin, G.R.; Carter, M.L.; Cassidy, D.J.; Ball, C.J.; Day, R.A.; Begg, B.D. Incorporation of Uranium in Zirconolite (CaZrTi2O7). J. Am. Ceram. Soc. 2002, 85, 1853–1859. [Google Scholar] [CrossRef]
- Wang, S.X.; Wang, L.M.; Ewing, R.C.; Was, G.S.; Lumpkin, G.R. Ion irradiation-induced phase transformation of pyrochlore and zirconolite. Nucl. Instrum. Methods Phys. Res. Sect. B Beam Interact. Mater. At. 1999, 148, 704–709. [Google Scholar] [CrossRef]
- Zhong, M.-X.; Walkley, B.; Bailey, D.J.; Blackburn, L.R.; Ding, H.; Wang, S.-Q.; Bao, W.-C.; Gardner, L.J.; Sun, S.-K.; Stennett, M.C.; et al. Synthesis of Ca1-xCexZrTi2-2xAl2xO7 zirconolite ceramics for plutonium disposition. J. Nucl. Mater. 2021, 556, 153198. [Google Scholar] [CrossRef]
- Blackburn, L.R.; Sun, S.-K.; Lawson, S.M.; Gardner, L.J.; Ding, H.; Corkhill, C.L.; Maddrell, E.R.; Stennett, M.C.; Hyatt, N.C. Synthesis and characterisation of Ca1-xCexZrTi2-2xCr2xO7: Analogue zirconolite wasteform for the immobilisation of stockpiled UK plutonium. J. Eur. Ceram. Soc. 2020, 40, 5909–5919. [Google Scholar] [CrossRef]
- Grey, I.E.; Mumme, W.G.; Ness, T.J.; Roth, R.S.; Smith, K.L. Structural relations between weberite and zirconolite polytypes—Refinements of doped 3T and 4M Ca2Ta2O7 and 3T CaZrTi2O7. J. Solid State Chem. 2003, 174, 285–295. [Google Scholar] [CrossRef]
- Errandonea, D.; Turnbull, R.; Sánchez-Martín, J.; Oliva, R.; Muñoz, A.; Radescu, S.; Mujica, A.; Blackburn, L.; Hyatt, N.C.; Popescu, C.; et al. A comparative study of the high-pressure structural stability of zirconolite materials for nuclear waste immobilization. Results Phys. 2024, 61, 107704. [Google Scholar] [CrossRef]
- Blackburn, L.R.; Sun, S.; Gardner, L.J.; Maddrell, E.R.; Stennett, M.C.; Hyatt, N.C. A systematic investigation of the phase assemblage and microstructure of the zirconolite CaZr1-xCexTi2O7 system. J. Nucl. Mater. 2020, 535, 152137. [Google Scholar] [CrossRef]
- Reiser, J.T.; Tolman, K.R.; Kropp, M.T.; Kissinger, R.M.; Saslow, S.A.; Cutforth, D.A.; Crum, J.V.; Seiner, B.N.; Smith, G.L.; Vienna, J.D. Fabrication of radioactive and non-radioactive titanate and zirconate ceramics for immobilization of used nuclear fuel. J. Nucl. Mater. 2022, 572, 154033. [Google Scholar] [CrossRef]
- Kuman, M.; Gardner, L.; Blackburn, L.; Stennett, M.; Hyatt, N.; Corkhill, C. Investigation of the Effect of Milling Duration on a Ce-Gd Doped Zirconolite Phase Assemblage Synthesised by Hot Isostatic Pressing. Ceramics 2023, 6, 707–716. [Google Scholar] [CrossRef]
- Mason, A.R.; Tocino, F.Y.; Stennett, M.C.; Hyatt, N.C. Molten salt synthesis of Ce doped zirconolite for the immobilisation of pyroprocessing wastes and separated plutonium. Ceram. Int. 2020, 46, 29080–29089. [Google Scholar] [CrossRef]
- Ji, S.; Li, Y.; Ma, S.; Liu, C.; Shih, K.; Liao, C.-Z. Synergistic effects of Ln and Fe Co-Doping on phase evolution of Ca1-xLnxZrTi2-xFexO7 (Ln = La, Nd, Gd, Ho, Yb) ceramics. J. Nucl. Mater. 2018, 511, 428–437. [Google Scholar] [CrossRef]
- Gilbert, M.R.; Selfslag, C.; Walter, M.; Stennett, M.C.; Somers, J.; Hyatt, N.C.; Livens, F.R. Synthesis and characterisation of Pu-doped zirconolites –(Ca1−xPux)Zr(Ti2-2xFe2x)O7. IOP Conf. Ser. Mater. Sci. Eng. 2010, 9, 012007. [Google Scholar] [CrossRef]
- Kaur, R.; Gupta, M.; Kulriya, P.K.; Ghumman, S.S. Phase analysis and reduction behaviour of Ce dopant in zirconolite. J. Radioanal. Nucl. Chem. 2019, 322, 183–192. [Google Scholar] [CrossRef]
- Sun, S.-K.; Stennett, M.C.; Corkhill, C.L.; Hyatt, N.C. Reactive spark plasma synthesis of CaZrTi2O7 zirconolite ceramics for plutonium disposition. J. Nucl. Mater. 2018, 500, 11–14. [Google Scholar] [CrossRef]
- Blackburn, L.R.; Crawford, R.; Walling, S.A.; Gardner, L.J.; Cole, M.R.; Sun, S.-K.; Gausse, C.; Mason, A.R.; Stennett, M.C.; Maddrell, E.R.; et al. Influence of accessory phases and surrogate type on accelerated leaching of zirconolite wasteforms. Npj Mater. Degrad. 2021, 5, 1–11. [Google Scholar] [CrossRef]
- Begg, B.D.; Vance, E.R.; Hunter, B.A.; Hanna, J.V. Zirconolite transformation under reducing conditions. J. Mater. Res. 1998, 13, 3181–3190. [Google Scholar] [CrossRef]
- Shannon, R.D. Revised effective ionic radii and systematic studies of interatomic distances in halides and chalcogenides. Found. Crystallogr. 1976, 32, 751–767. [Google Scholar] [CrossRef]
- Vance, E.R.; Ball, C.J.; Day, R.A.; Smith, K.L.; Blackford, M.G.; Begg, B.D.; Angel, P.J. Actinide and rare earth incorporation into zirconolite. J. Alloys Compd. 1994, 213–214, 406–409. [Google Scholar] [CrossRef]
- Yudintsev, S.V.; Stefanovskii, S.V.; Jang, Y.N.; Che, S. X-Ray Diffraction Analysis of Phase Formation in Synthesis of Actinide Matrices. Glass Ceram. 2002, 59, 237–241. [Google Scholar] [CrossRef]
- Begg, B.D.; Vance, E.R.; Lumpkin, G.R. Charge Compensation and the Incorporation of Cerium in Zirconolite and Perovskite. MRS Online Proc. Libr. 1997, 506, 79–86. [Google Scholar] [CrossRef]
- Clark, B.M.; Sundaram, S.K.; Misture, S.T. Polymorphic Transitions in Cerium-Substituted Zirconolite (CaZrTi2O7). Sci. Rep. 2017, 7, 5920. [Google Scholar] [CrossRef]
- Jafar, M.; Achary, S.N.; Salke, N.P.; Sahu, A.K.; Rao, R.; Tyagi, A.K. X-ray diffraction and Raman spectroscopic investigations on CaZrTi2O7–Y2Ti2O7 system: Delineation of phase fields consisting of potential ceramic host materials. J. Nucl. Mater. 2016, 475, 192–199. [Google Scholar] [CrossRef]
- Coelho, A.A.; Cheary, R.W.; Smith, K.L. Analysis and Structural Determination of Nd-Substituted Zirconolite-4M. J. Solid State Chem. 1997, 129, 346–359. [Google Scholar] [CrossRef]
- Zhang, Y.; Fang, Z.Z.; Xia, Y.; Sun, P.; Van Devener, B.; Free, M.; Lefler, H.; Zheng, S. Hydrogen assisted magnesiothermic reduction of TiO2. Chem. Eng. J. 2017, 308, 299–310. [Google Scholar] [CrossRef]
- Lee, W.E.; Ojovan, M.I.; Stennett, M.C.; Hyatt, N.C. Immobilisation of radioactive waste in glasses, glass composite materials and ceramics. Adv. Appl. Ceram. 2006, 105, 3–12. [Google Scholar] [CrossRef]
- Jacob, K.; Gupta, S. Calciothermic reduction of TiO2: A diagrammatic assessment of the thermodynamic limit of deoxidation. JOM J. Miner. Met. Mater. Soc. 2009, 61, 56–59. [Google Scholar] [CrossRef]
- Kato, T.; Iwamoto, M.; Tokoro, C. Investigation of Cerium Reduction Efficiency by Grinding with Microwave Irradiation in Mechanochemical Processing. Minerals 2022, 12, 189. [Google Scholar] [CrossRef]
- Suzuki, K.; Kato, M.; Sunaoshi, T.; Uno, H.; Carvajal-Nunez, U.; Nelson, A.T.; McClellan, K.J. Thermal and mechanical properties of CeO2. J. Am. Ceram. Soc. 2019, 102, 1994–2008. [Google Scholar] [CrossRef]
Disclaimer/Publisher’s Note: The statements, opinions and data contained in all publications are solely those of the individual author(s) and contributor(s) and not of MDPI and/or the editor(s). MDPI and/or the editor(s) disclaim responsibility for any injury to people or property resulting from any ideas, methods, instructions or products referred to in the content. |
© 2025 by the authors. Licensee MDPI, Basel, Switzerland. This article is an open access article distributed under the terms and conditions of the Creative Commons Attribution (CC BY) license (https://creativecommons.org/licenses/by/4.0/).