Correlation of Thermo-Elastic Material and Corrosion Behavior of Refractory Castables by In-Situ Measurements

 ,
, 
Abstract
:1. Introduction
2. Materials and Methods
2.1. Materials
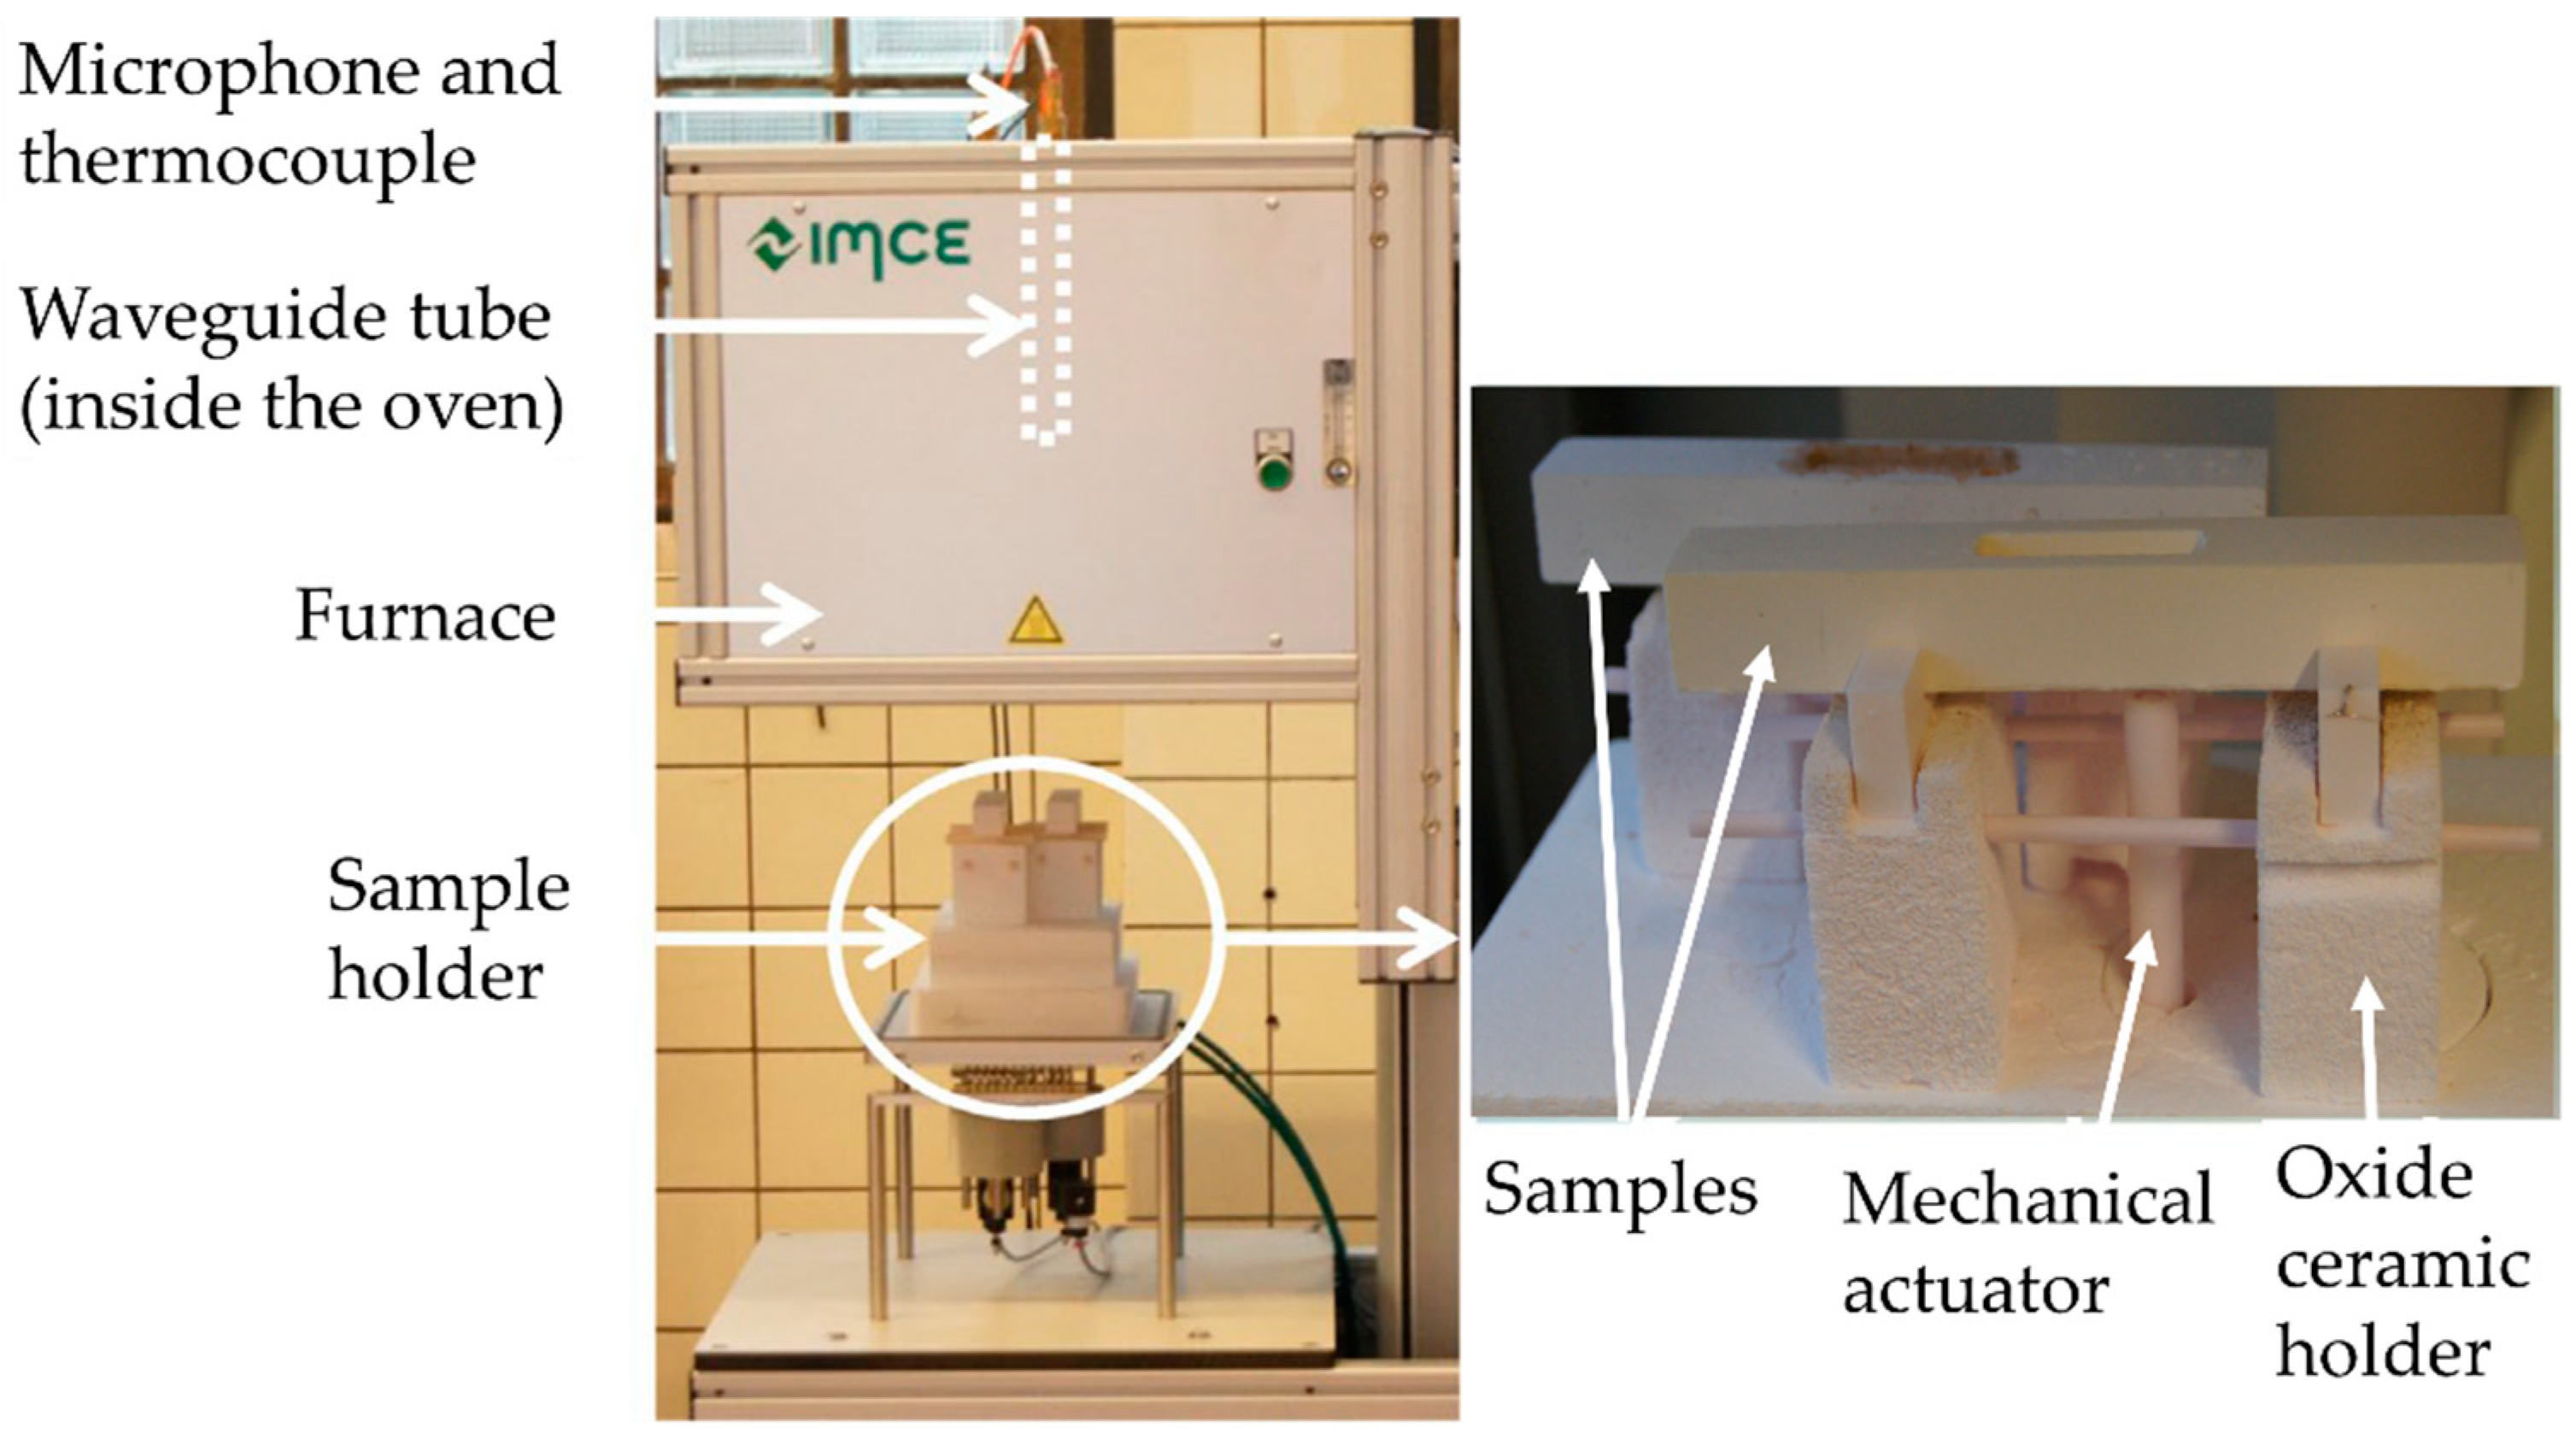
2.2. Measurements
2.3. Corrosive Medium
3. Results
3.1. Procedure
3.2. Fundamental, Simplified Investigations
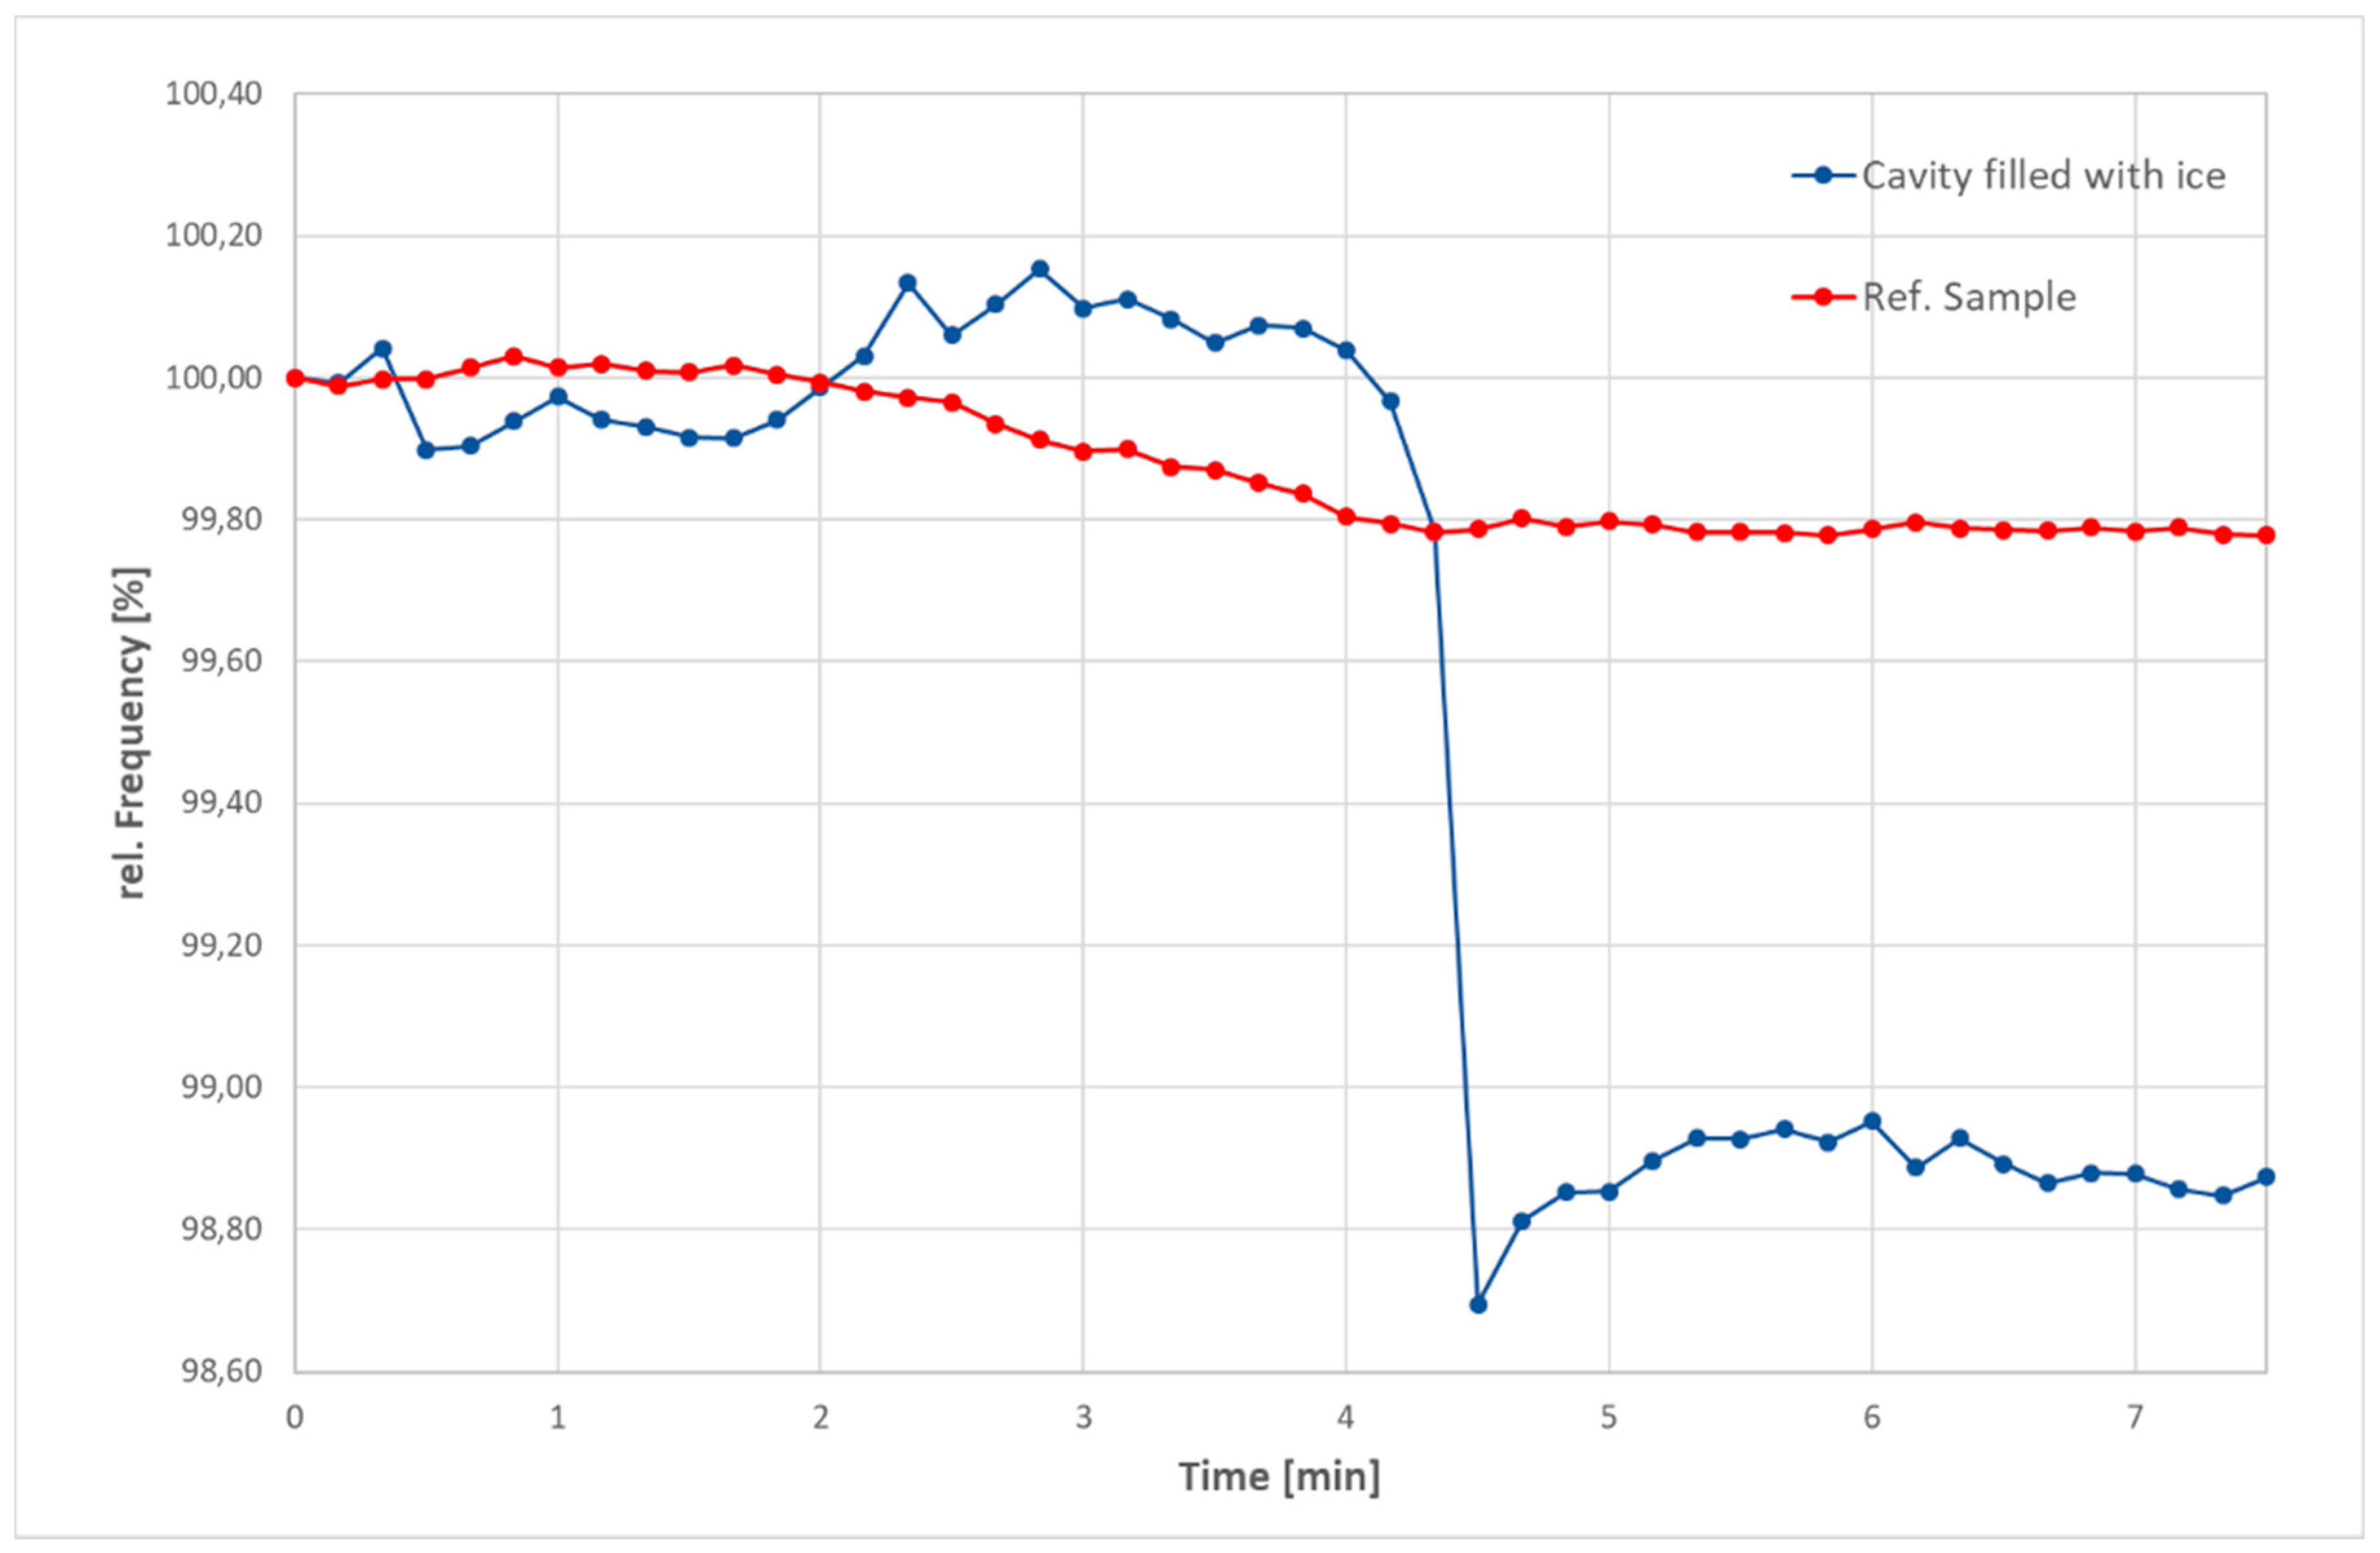
3.2.1. Influence of the Cavity
3.2.2. Influence of Liquids and Solids in the Cavity
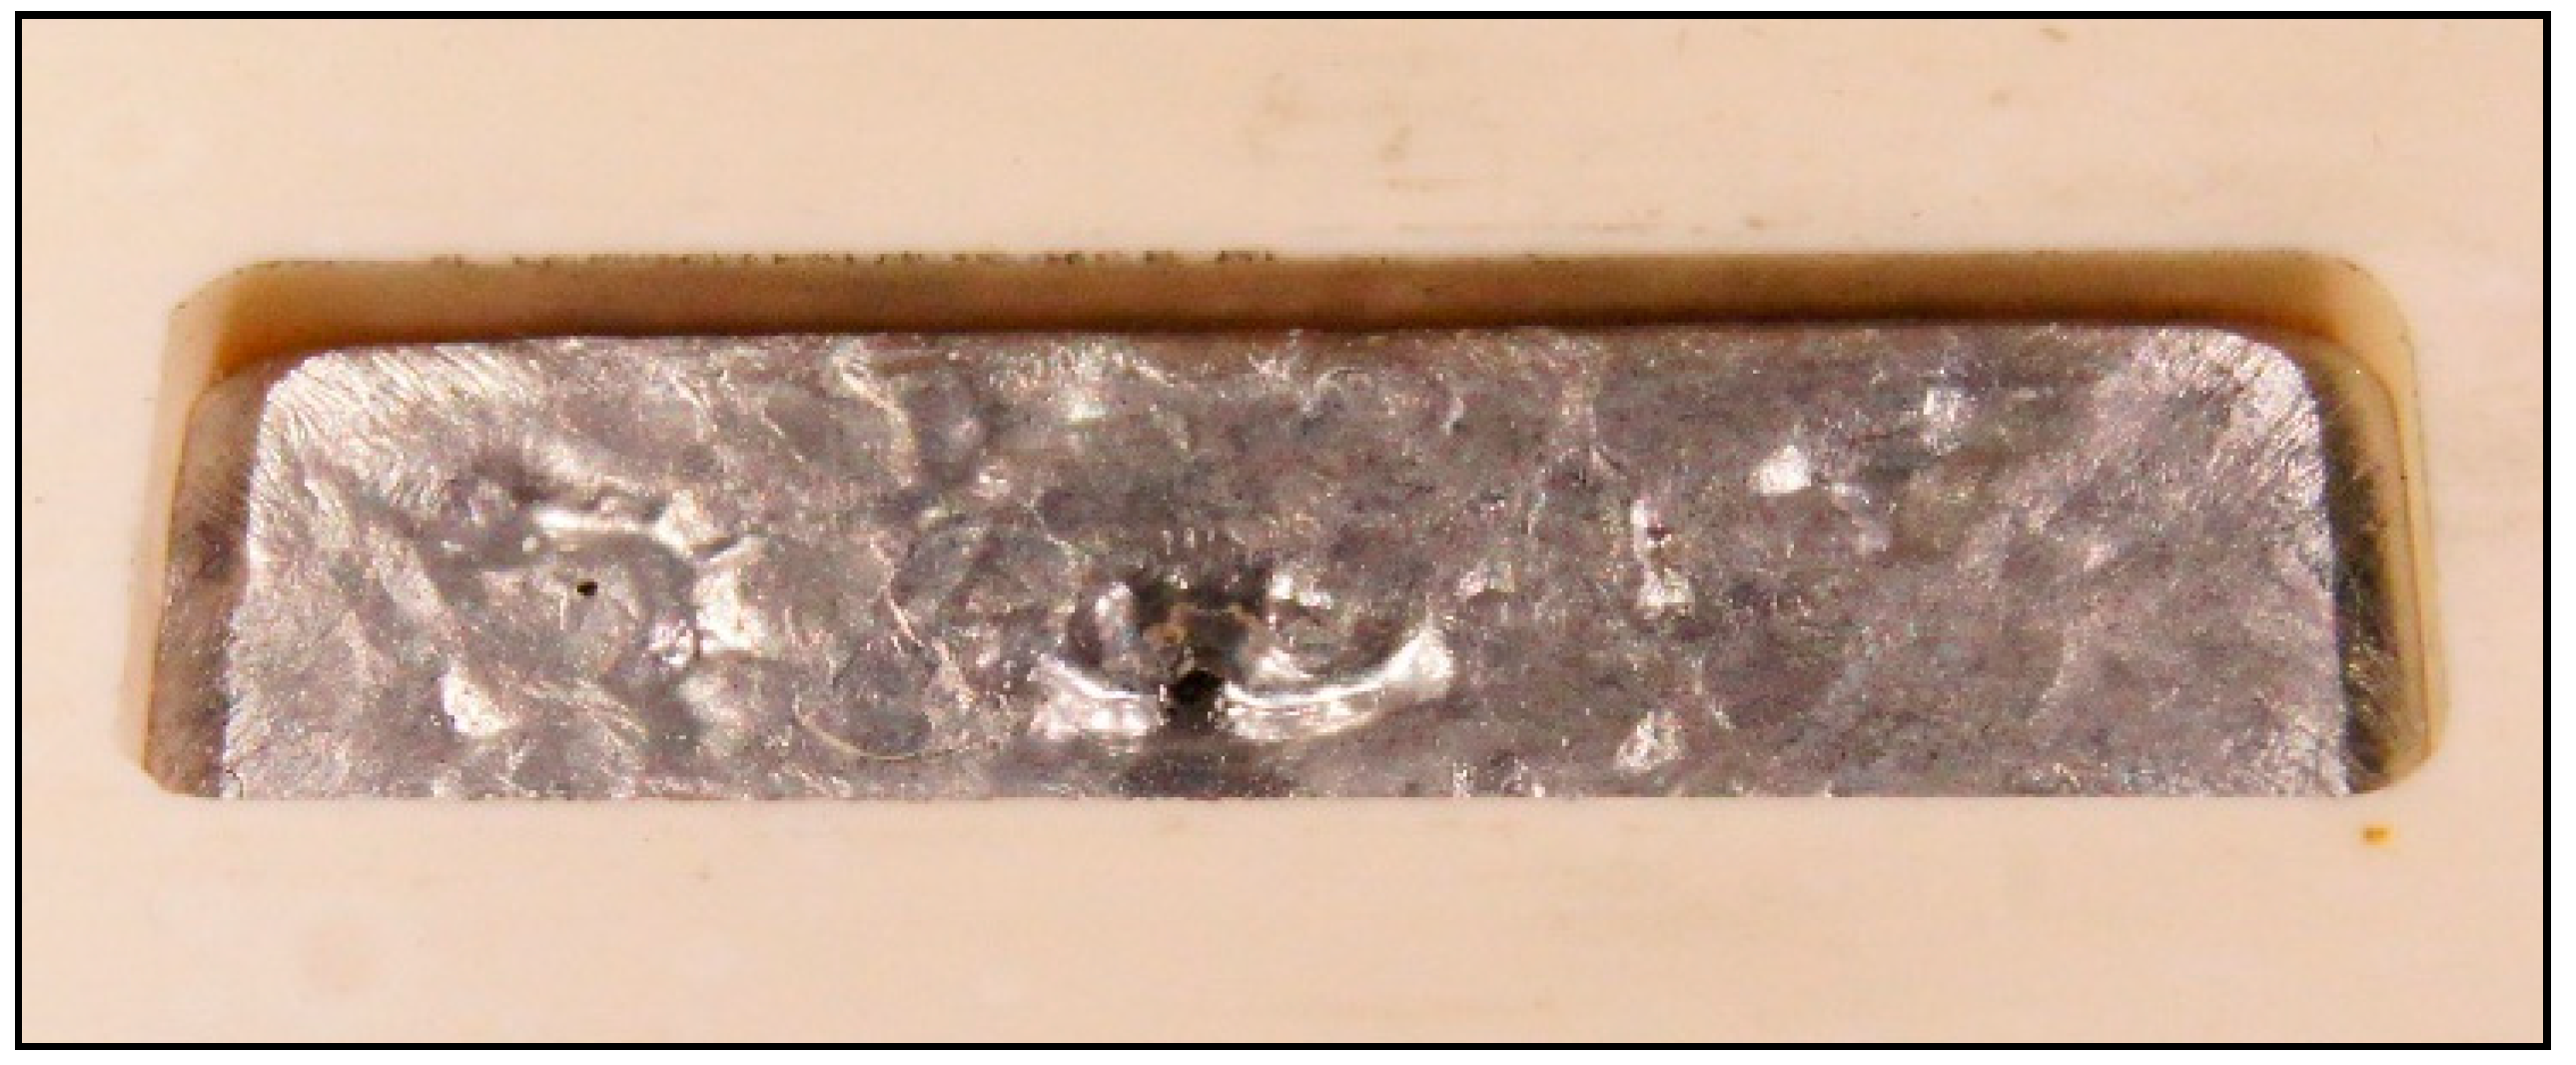
3.2.3. Difference of Casting and Granular Filling of the Cavity
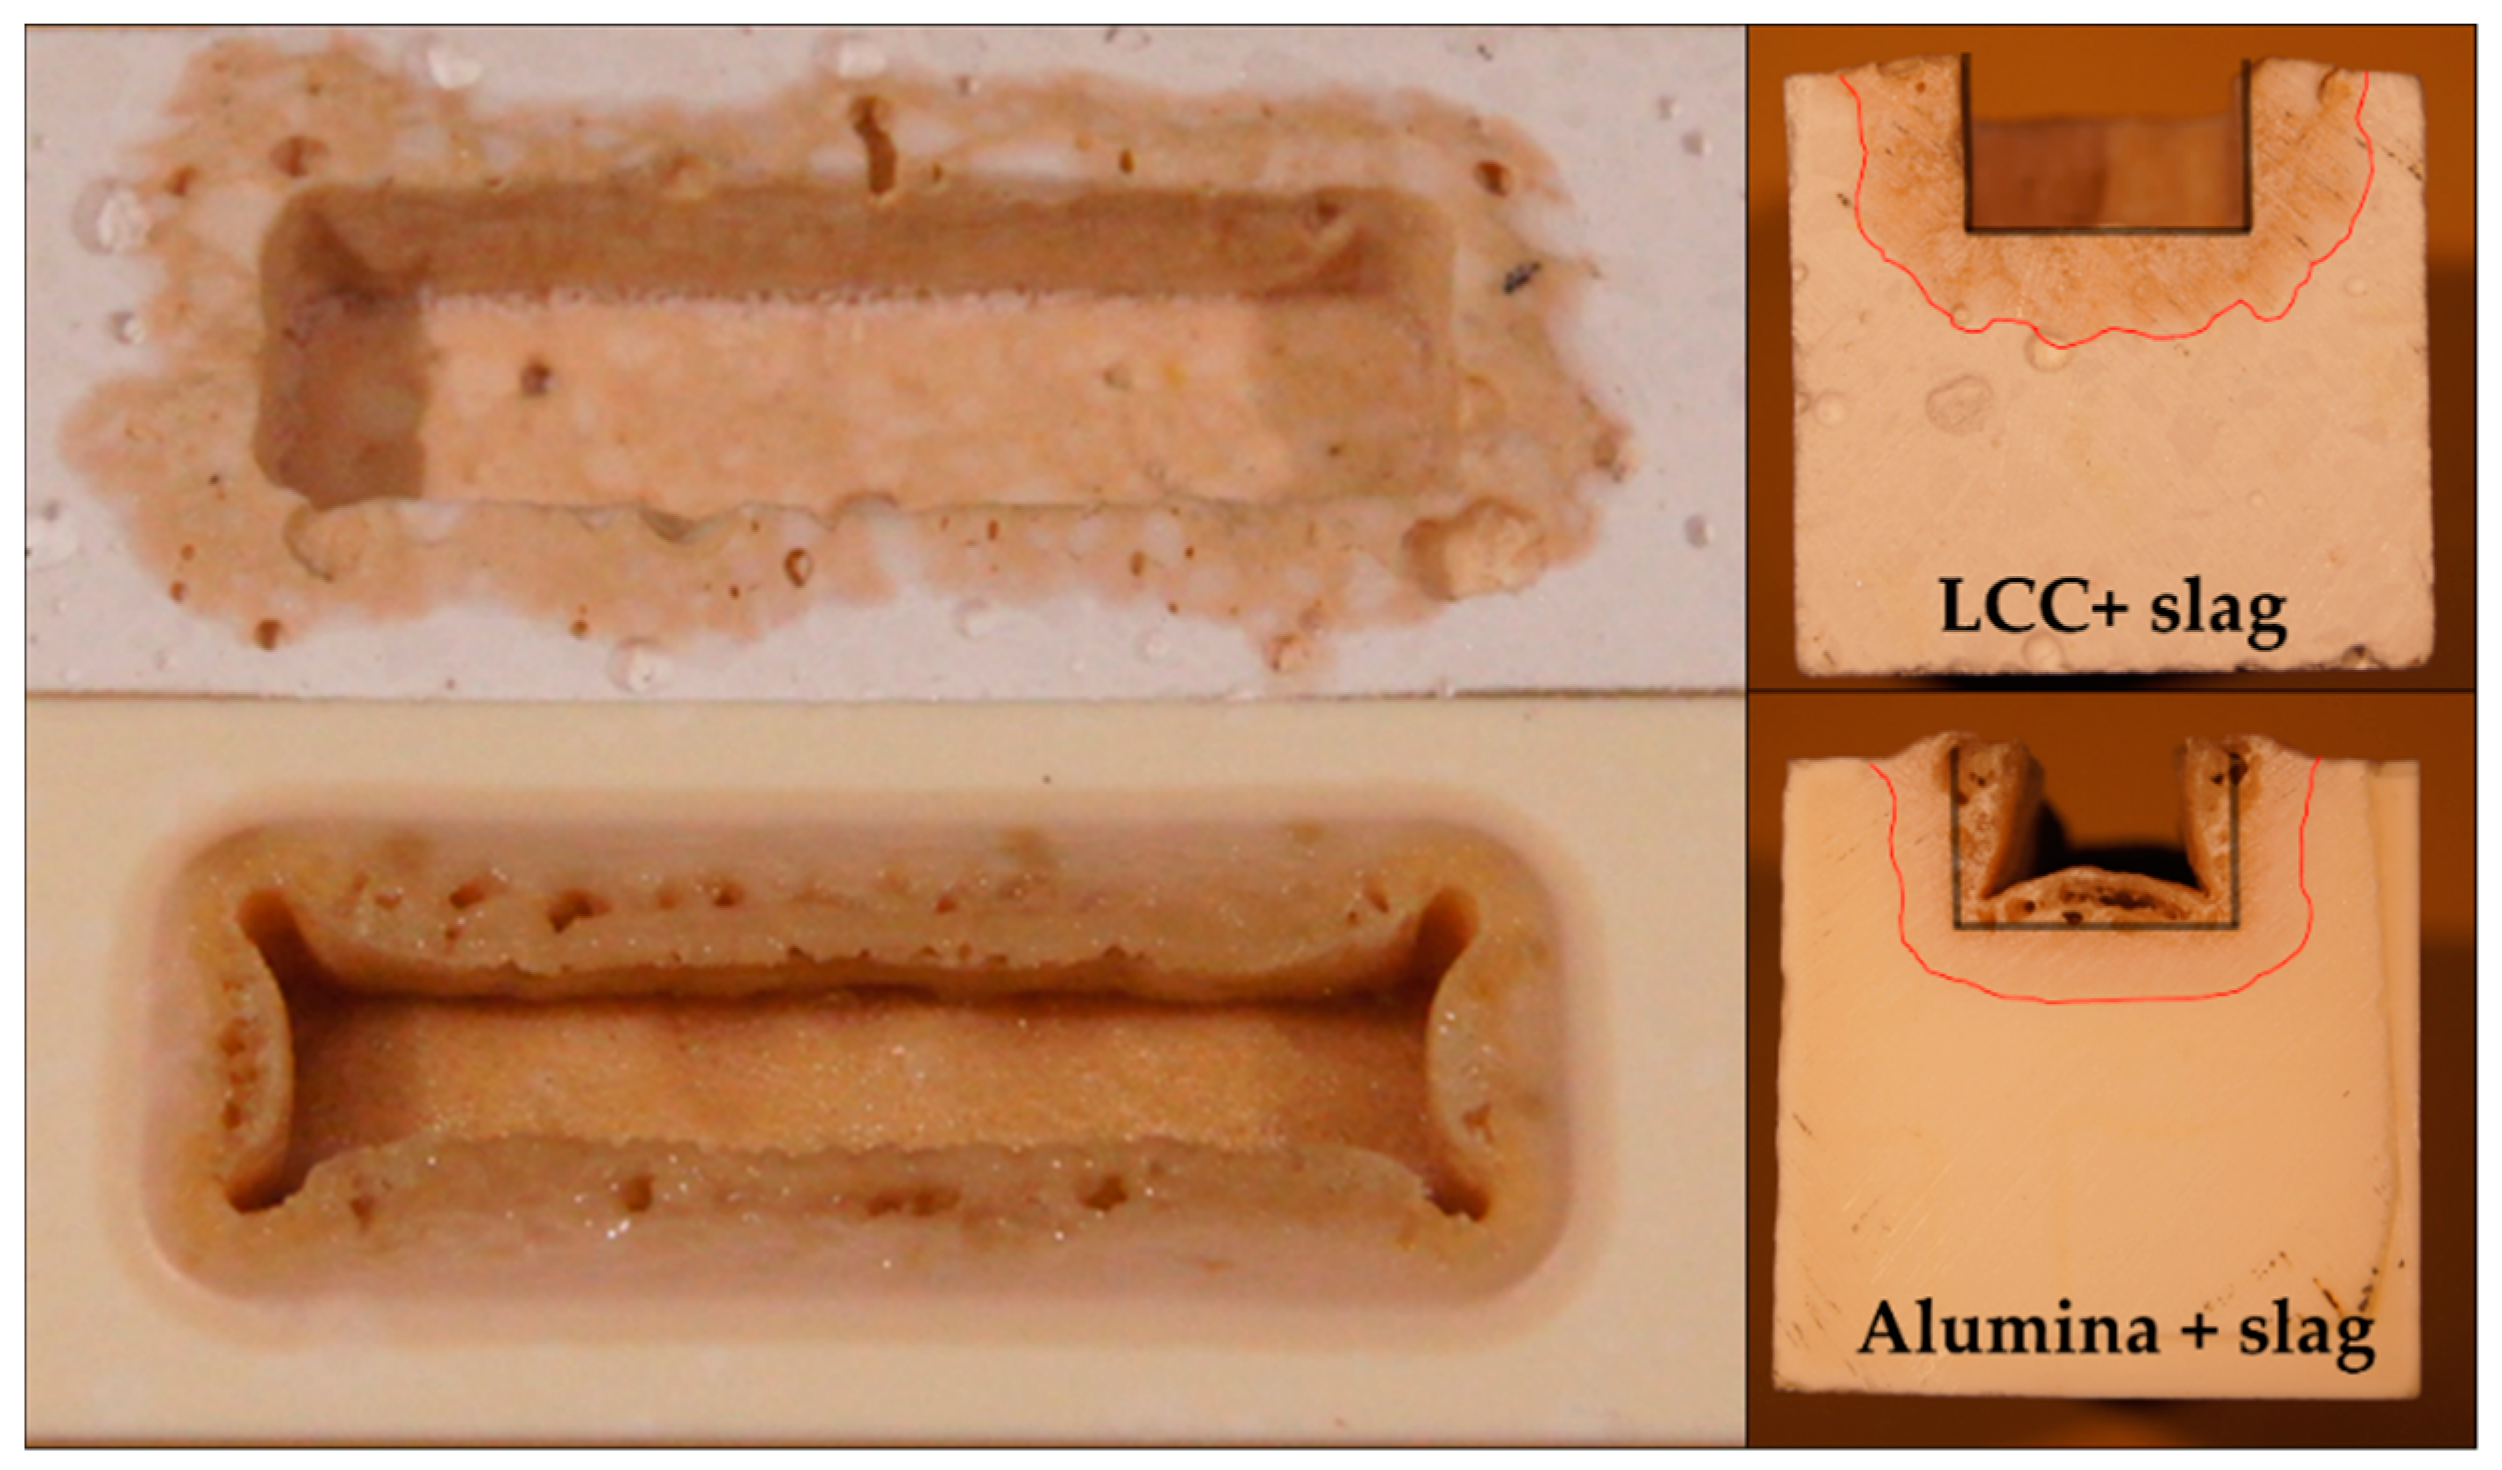
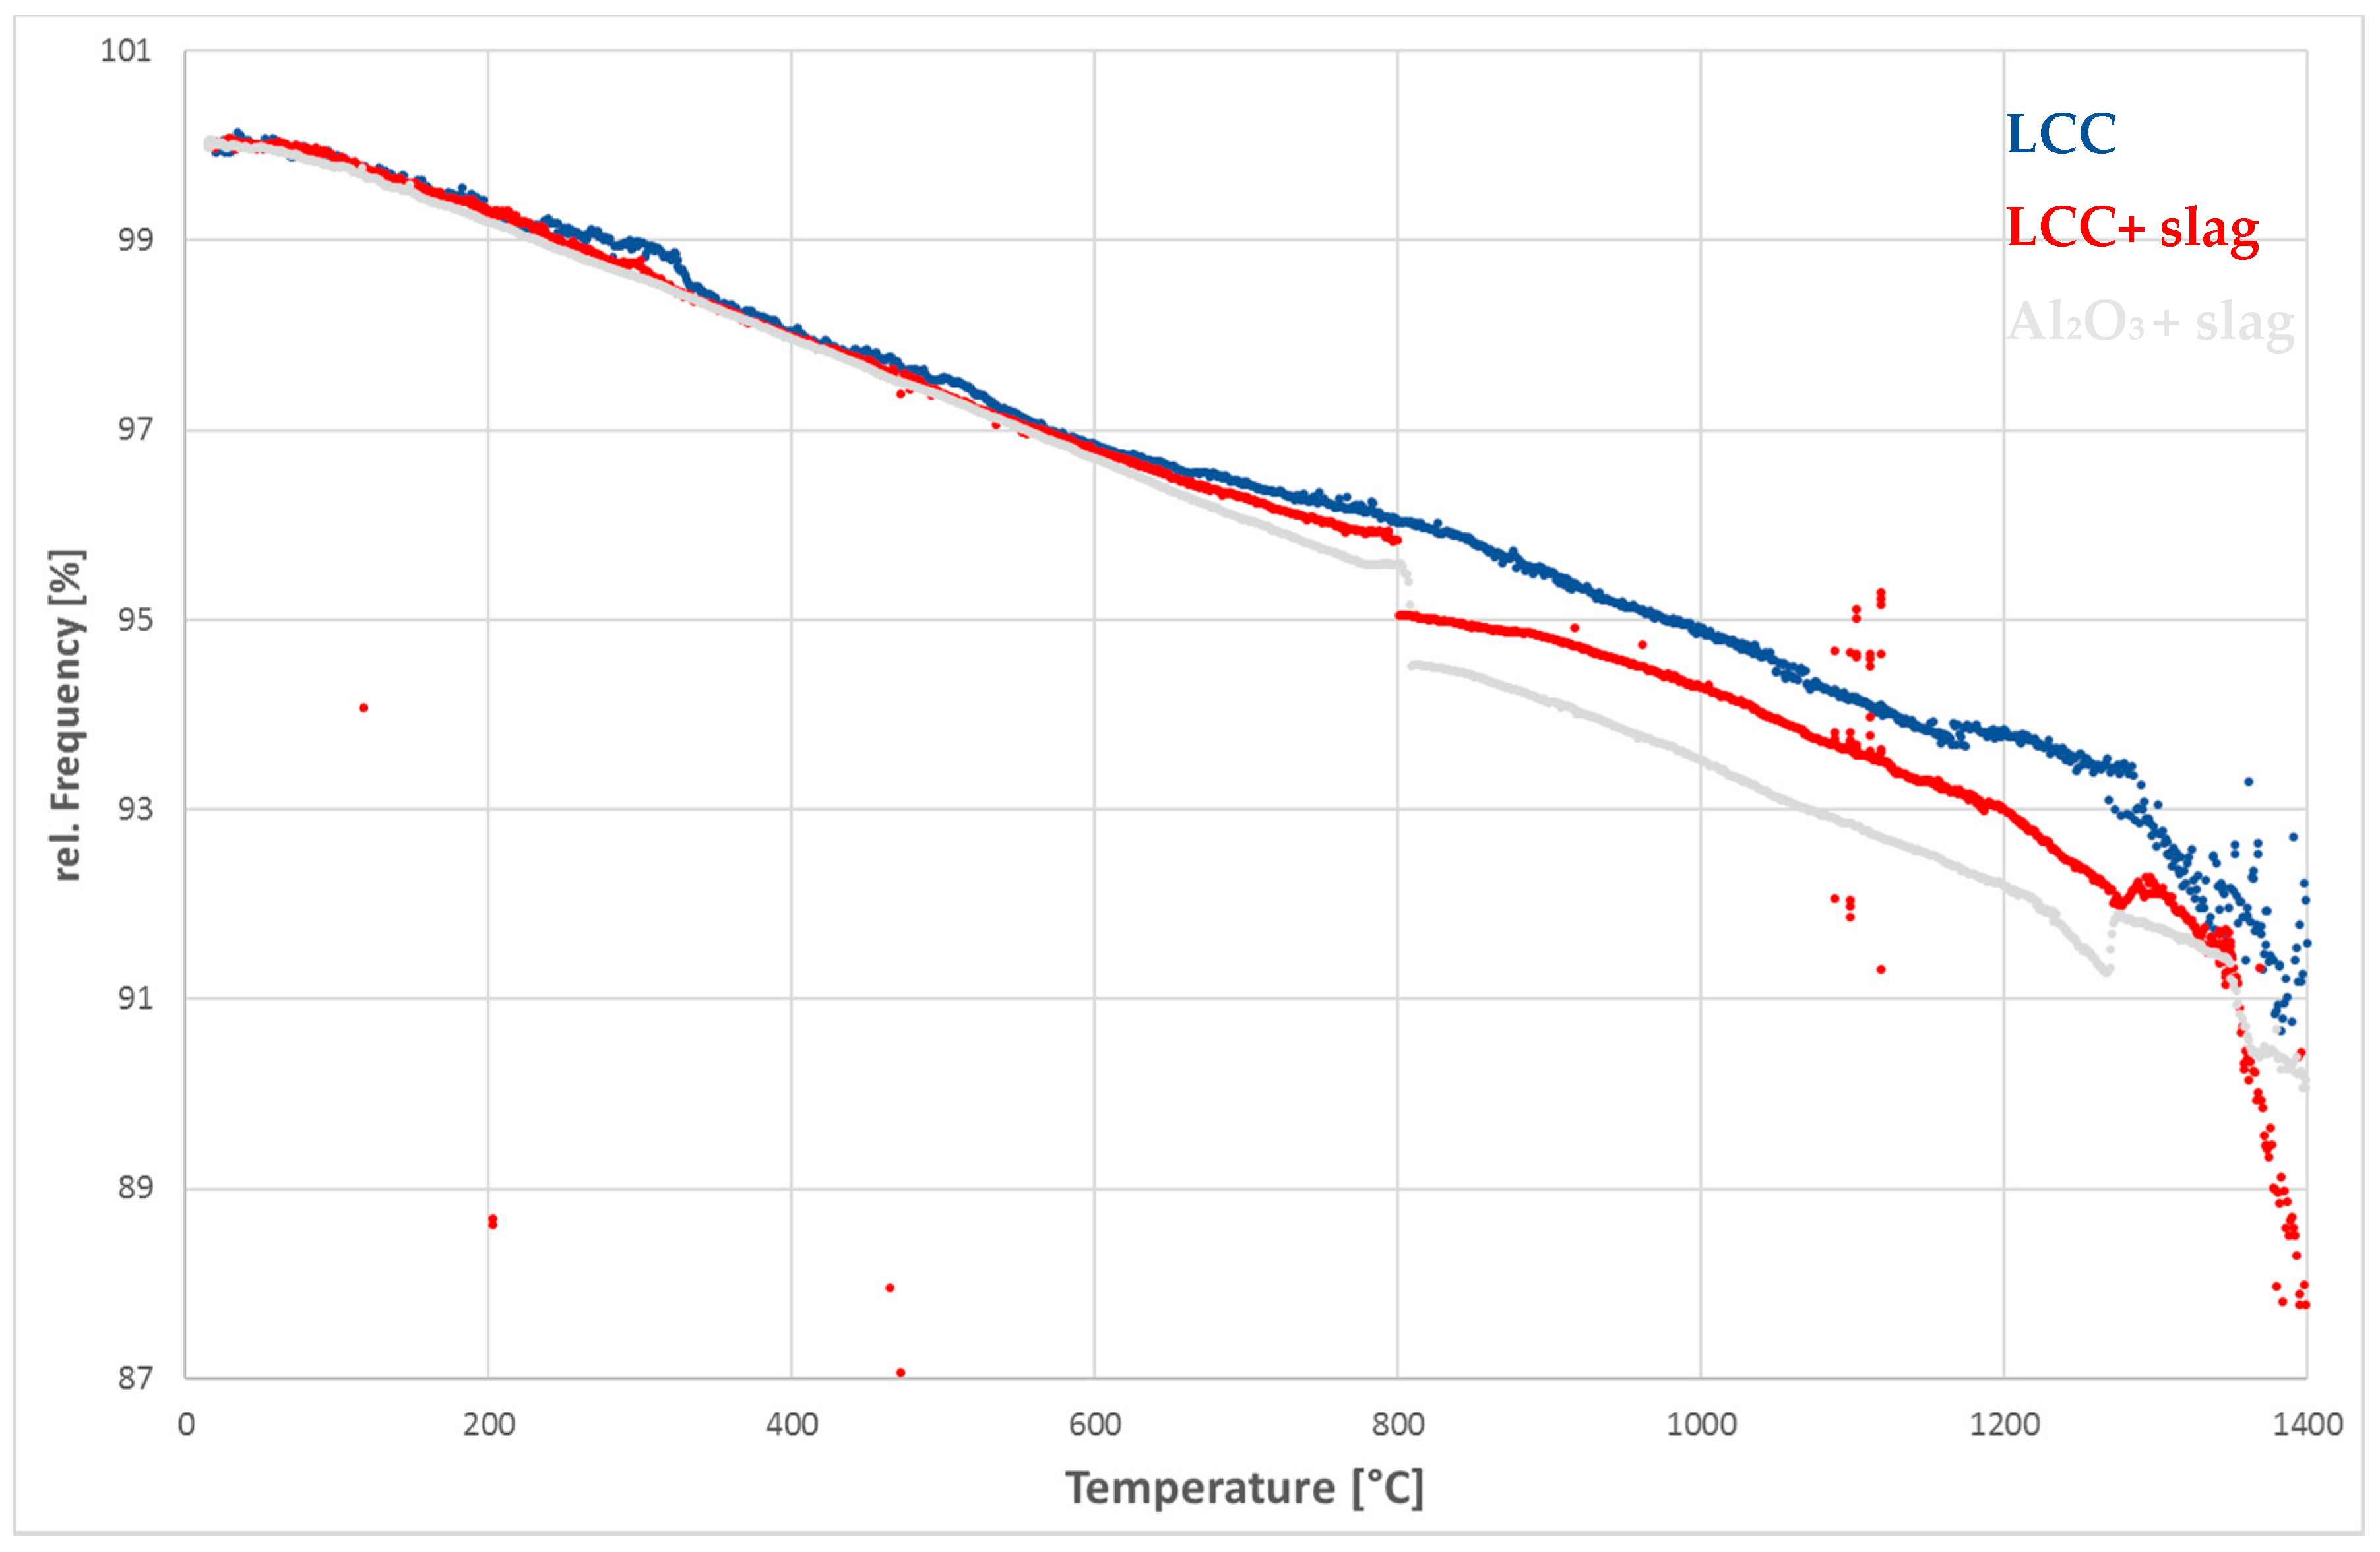
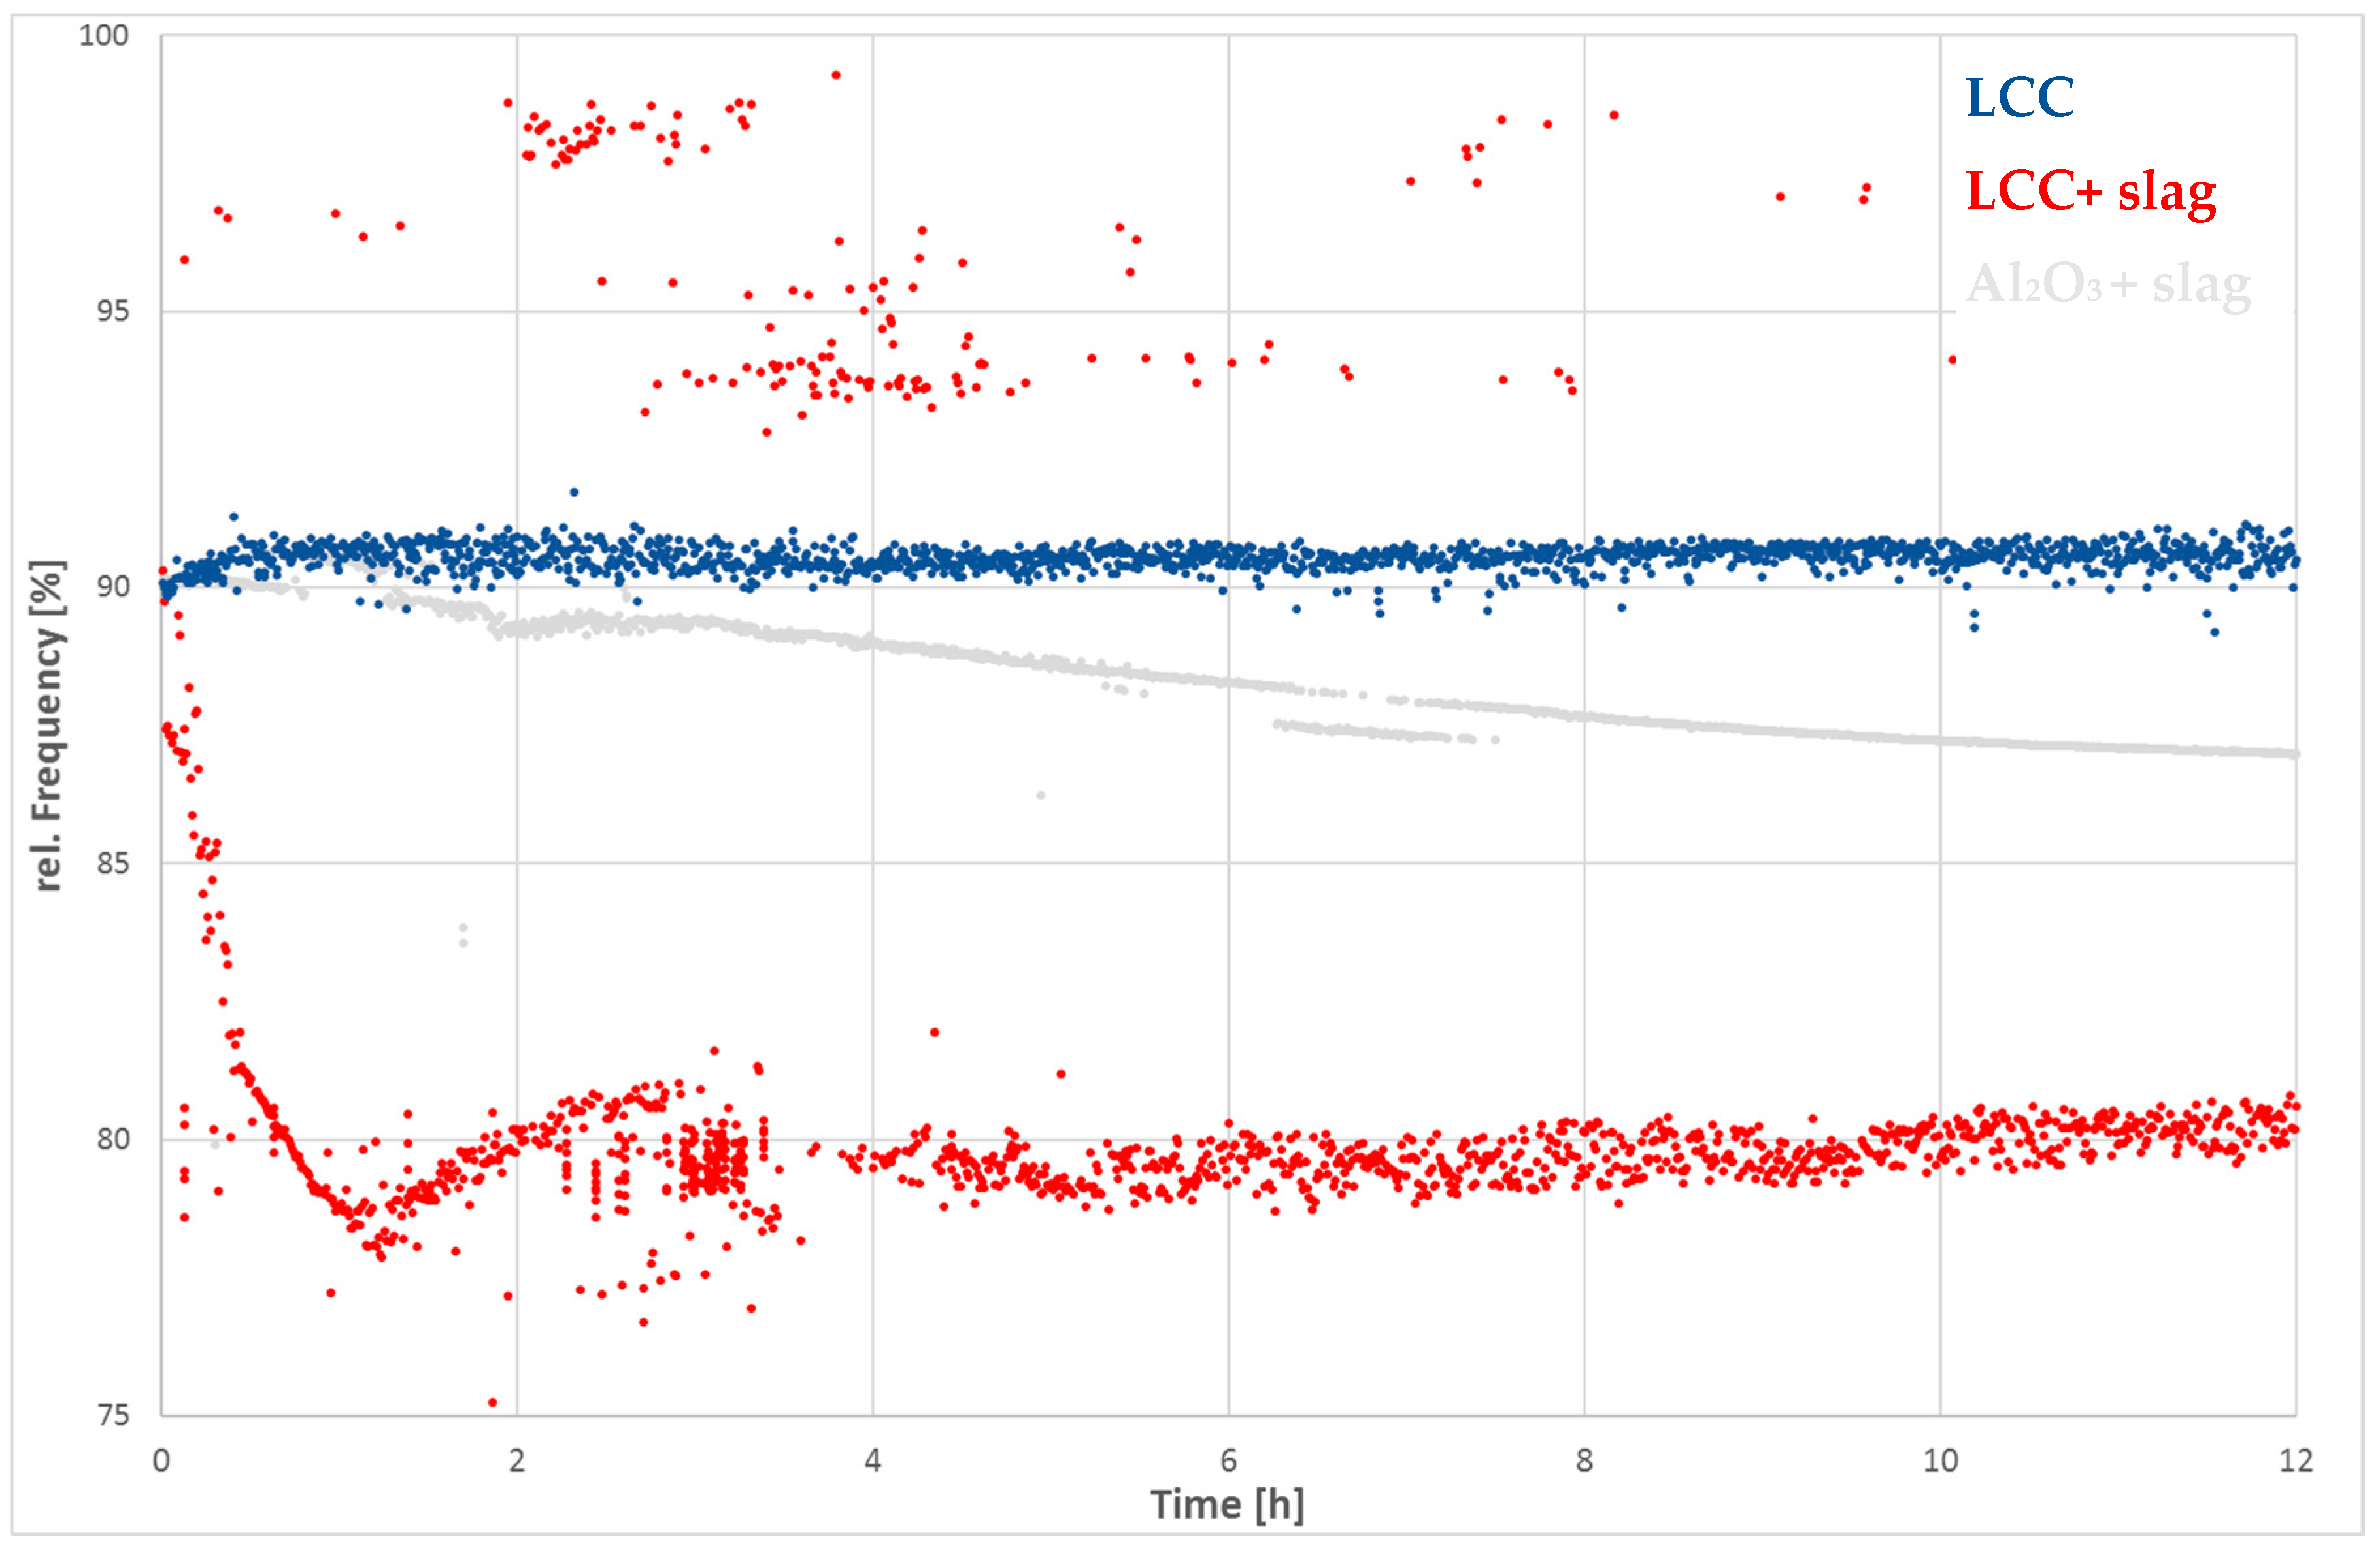
3.3. Corrosion with Blast Furnace Slag
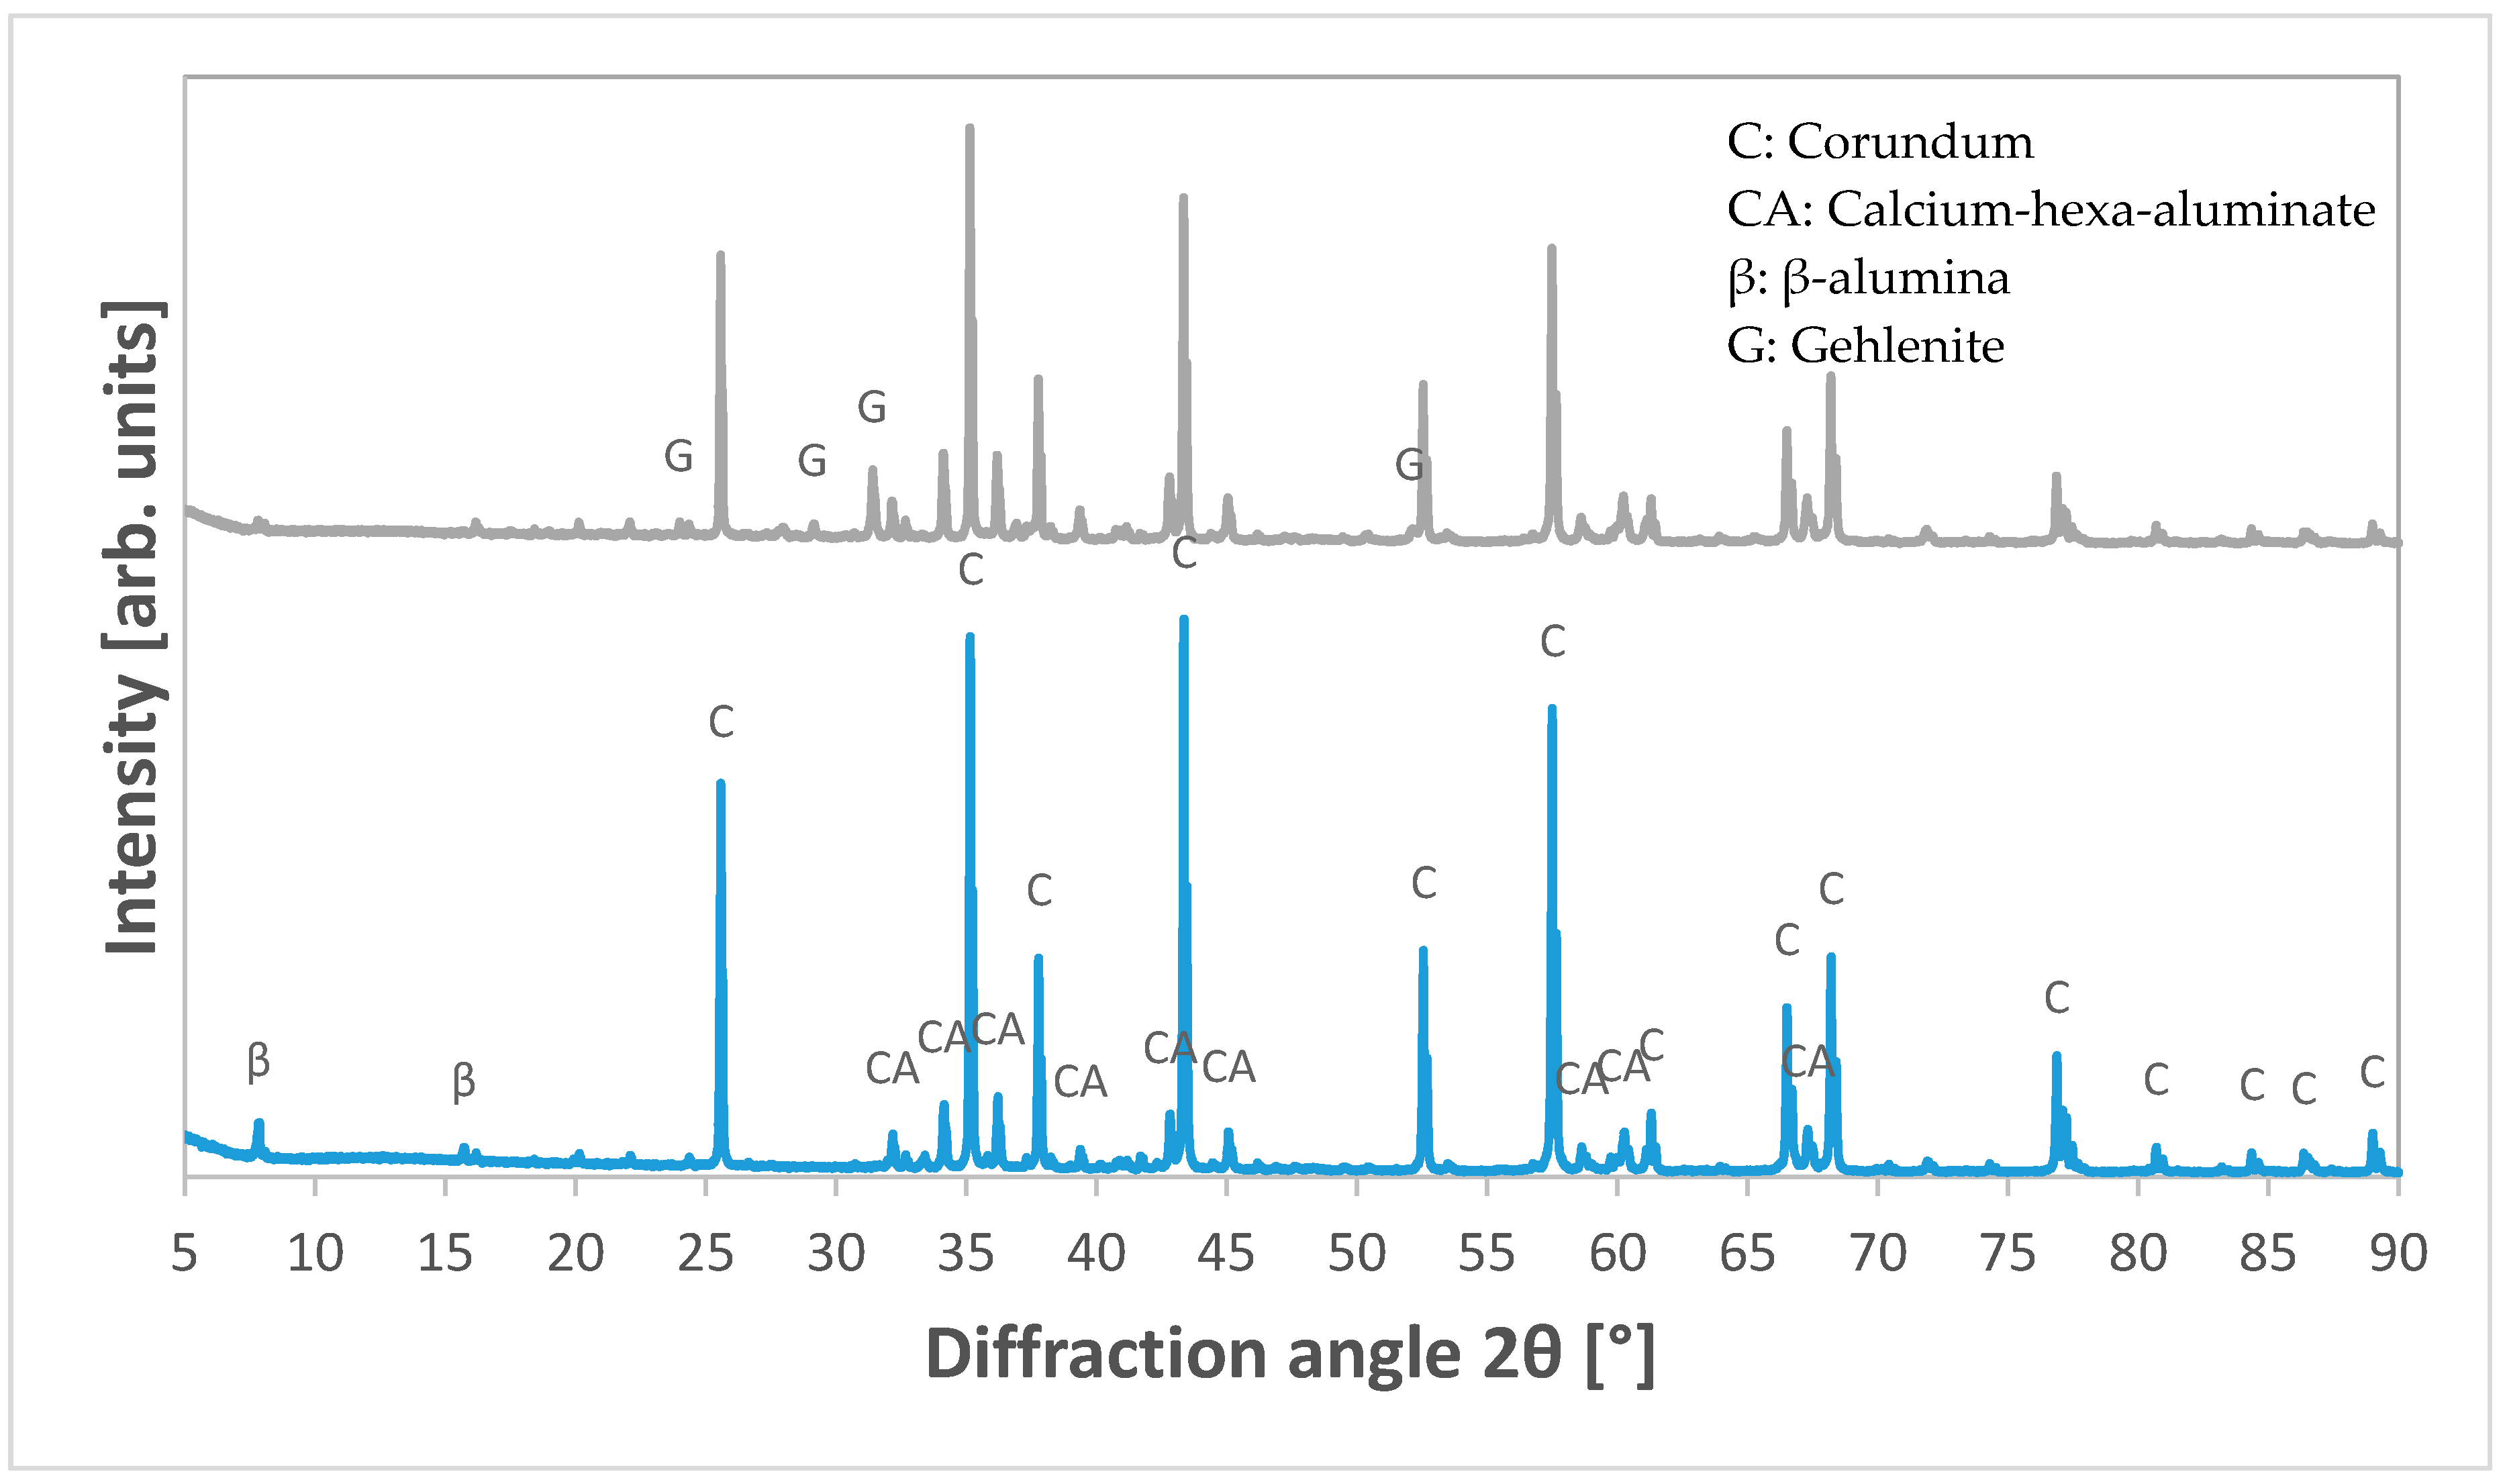
3.4. Corrosion Results (XRD)
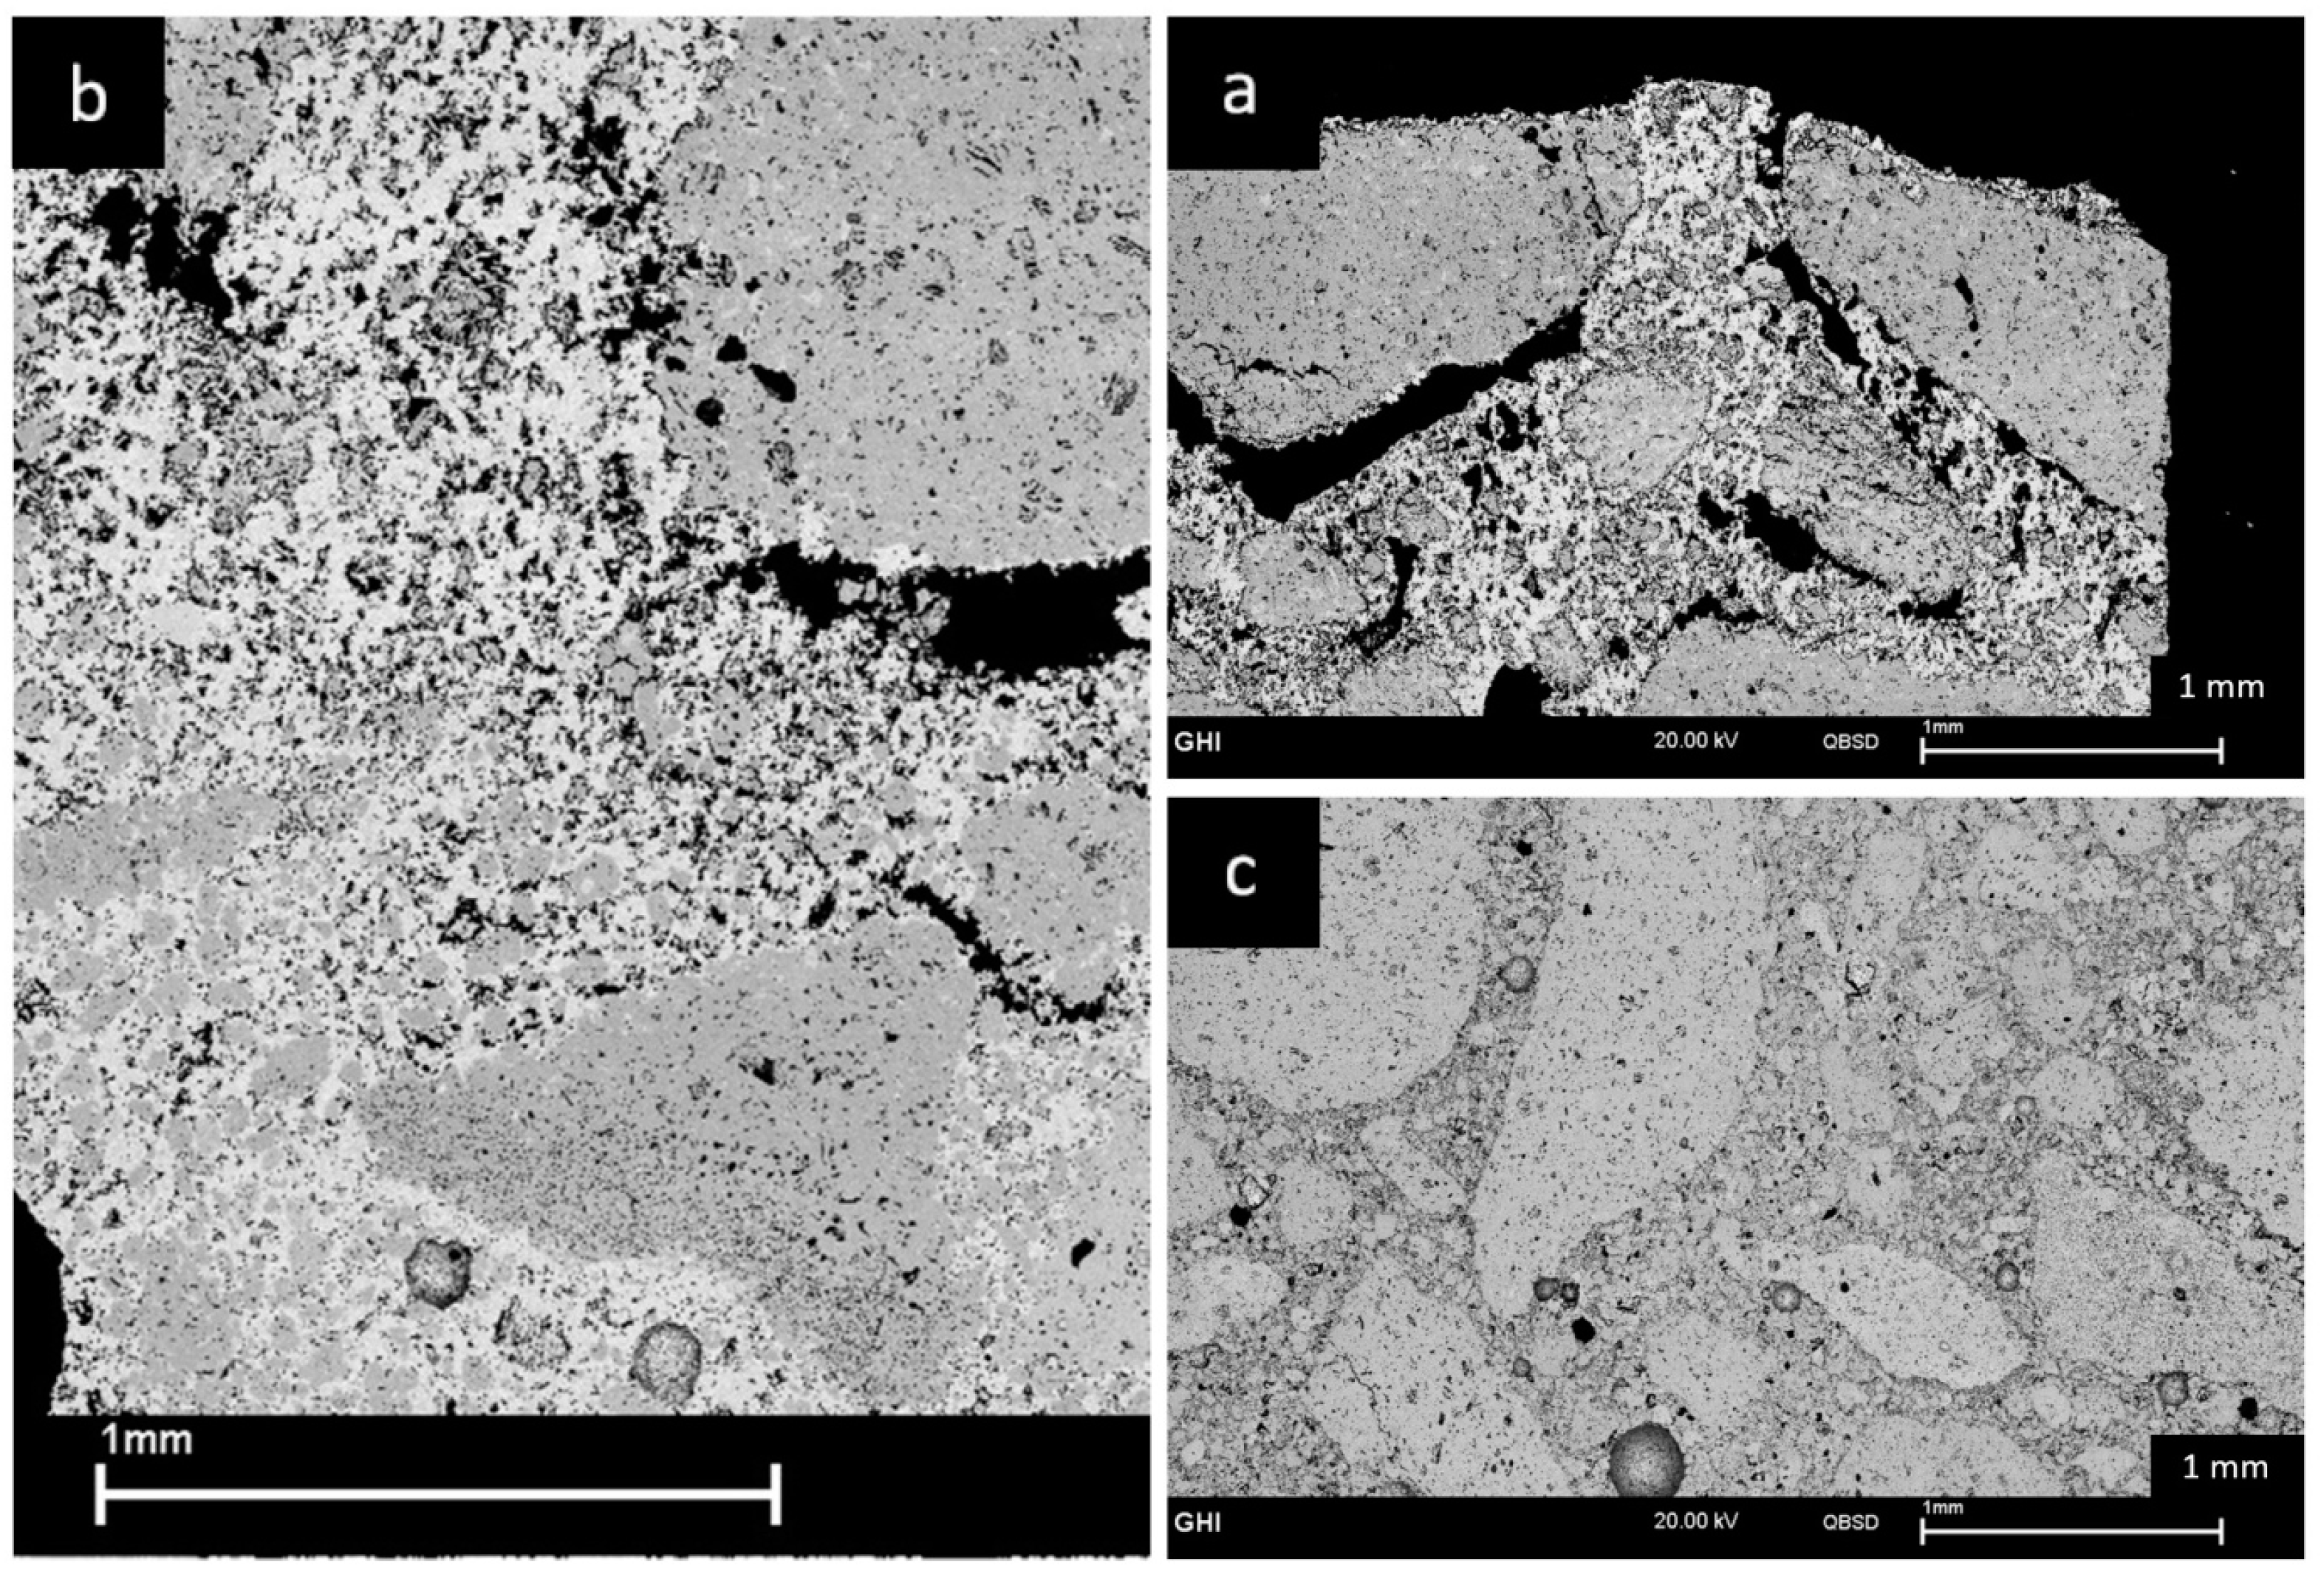
3.5. Corrosion Results (SEM)
4. Discussion
5. Conclusions
Author Contributions
Funding
Acknowledgments
Conflicts of Interest
References
- Salmang, H.; Scholze, H. Keramik, 7th ed.; Telle, R., Ed.; Springer: Berlin/Heidelberg, Germany, 2007. [Google Scholar]
- Winston Revie, R. Uhlig’s Corrosion Handbook, 3rd ed.; John Wiley & Sons, Inc.: Hoboken, NJ, USA, 2011. [Google Scholar]
- DIN, German Institute for Standardization. Methods of Test for Dense Refractory Products—Guideline for Testing Corrosion of Refractories Caused by Liquids; German Version CEN/TS 15418:2006; Materials Testing Standards Committee: Berlin, Germany, 2006. [Google Scholar] [CrossRef]
- Schacht, C. Refractories Handbook; CRC Press: Boca Raton, FL, USA, 2004. [Google Scholar]
- ASTM International. C1548-02(2012) Standard Test Method for Dynamic Young’s Modulus, Shear Modulus, and Poisson’s Ratio of Refractory Materials by Impulse Excitation of Vibration; ASTM International: West Conshohocken, PA, USA, 2012. [Google Scholar] [CrossRef]
- Andreev, K.; Tadaion, V.; Zhu, Q.; Wang, W.; Yin, Y.; Tonnesen, T. Thermal and mechanical cyclic tests and fracture mechanics parameters as indicators of thermal shock resistance: Case study on silica refractories. J. Eur. Ceram. Soc. 2019, 39, 1650–1659. [Google Scholar] [CrossRef]
- Sibil, A.; Erauw, J.P.; Cambier, F.; R’Mili, M.; Godin, N.; Fantozzi, G. Study of damage of high zirconia fused-cast refractories by measurement of Young’s modulus. Mater. Sci. Eng. A 2009, 521, 221–223. [Google Scholar] [CrossRef]
- Traon, N.; Tonnesen, T.; Telle, R. Comparison of the elastic properties determined by different devices in a refractory castable based on partially stabilized zirconia. In Proceedings of the 53rd International Colloquium on Refractories, Aachen, Germany, 8–9 September 2010. [Google Scholar]
- Tonnesen, T.; Telle, R. Evaluation of Thermal Shock Damage in Castables by a Resonant Frequency and Damping Method. In Proceedings of the 49th International Colloquium on Refractories, Aachen, Germany, 7–8 November 2006; pp. 133–136. [Google Scholar]
- Etzold, S.; Traon, N.; Tonnesen, T.; Telle, R. Elastic and Mechanical Fatigue at High Temperatures of High-Alumina Castables with Addition of Partially Stabilized Zirconia. Interceram 2016, 65, 19–23. [Google Scholar] [CrossRef]
- Traon, N.; Schnieder, J.; Villalba, A.; Tonnesen, T.; Telle, R.; Huger, M.; Chotard, T. Influence of Andalusite, Al2O3-ZrO2-SiO2 and Al2O3-ZrO2 Addition on Elastic and Mechanical Properties of High Alumina Castables. Interceram-Int. Ceram. Rev. 2014, 63, 290–294. [Google Scholar] [CrossRef]
- Traon, N.; Schnieder, J.; Tonnesen, T.; Telle, R.; Huger, M.; Chotard, T.; Belrhiti, Y.; Villalba, W.A. High Temperature Evaluation of Mechanical Properties of Refractory Castables. Refract. Worldforum 2017, 9, 116–126. [Google Scholar]
- Reichert, W.; Nießen, J.; Kröll, E.; Tonnesen, T.; Telle, R.; Leto, P.; Haubner, R. In-situ Thermo-Elastic Measurements of High-Alumina Castables During Corrosion Process. In Proceedings of the 61st International Colloquium on Refractories, Aachen, Germany, 26–27 September 2018; ECREF: Aachen, Germany, 2018. [Google Scholar]
- Tonnesen, T.; Reichert, W.; Telle, R.; Leto, P.; Haubner, R. Progess of Young’s Modulus of High Alumina Castables during Corrosion Process. In Proceedings of the UNITECR 19, Yokohama, Japan, 13–16 October 2019. [Google Scholar]
- Kyrillis, S.; Tonnesen, T.; Telle, R. Monitoring the elastic properties of a alumina based monolithics exposed to steel slag and the effect of preformed spinel addition. In Proceedings of the 62nd International Colloquium on Refractories, Aachen, Germany, 25–26 September 2019; ECREF: Aachen, Germany, 2019. [Google Scholar]
- Hönig, S.; Koch, D.; Weber, S.; Etzold, S.; Tonnesen, T.; Telle, R.; Traon, N. Evaluation of dynamic modulus measurement for C/C-SiC composites at different temperatures. Int. J. Appl. Ceram. Technol. 2019, 16, 1723–1733. [Google Scholar] [CrossRef]
- Roebben, G.; Bollen, B.; Brebels, A.; Van Humbeeck, J.; Van der Biest, O. Impulse excitation apparatus to measure resonant frequencies, elastic moduli, and internal friction at room and high temperature. Rev. Sci. Instrum. 1997, 68, 4511–4515. [Google Scholar] [CrossRef]
- Wachtman, J.B., Jr.; Lam, D.G., Jr. Young’s Modulus of Various Refractory Materials as a Function of Temperature. J. Am. Ceram. Soc. 1959, 42, 254–260. [Google Scholar] [CrossRef]
- Manasijević, I.; Balanović, L.; Grgurić, T.H.; Minić, D.; Gorgievski, M. Study of Microstructure and Thermal Properties of the Low Melting Bi-In-Sn Eutectic Alloys. Mater. Res. 2018, 21. [Google Scholar] [CrossRef]
- Carter, C.B.; Norton, M.G. Ohio Library and Information Network. In Ceramic Materials: Science and Engineering, 2nd ed.; Springer: New York, NY, USA, 2007. [Google Scholar]


| Sample | Filler | |||||
|---|---|---|---|---|---|---|
| Material | Water | Rap Oil | Ice | Gallium | Field’s Metal | Slag |
| Aluminum | X | X | X | |||
| Alumina | X | X | X | X | X | X |
| LCC | X | X | X | X | ||
| Component | Portion [wt.-%] |
|---|---|
| CaO | 47.0 |
| SiO2 | 32.4 |
| Al2O3 | 10.1 |
| MgO | 5.5 |
| SO3 | 2.5 |
| TiO2 | 1.1 |
| K2O | 0.5 |
| MnO | 0.4 |
| Fe2O3 | 0.3 |
| Na2O | 0.2 |
| LoI (1050 °C) | −1.89 |
© 2020 by the authors. Licensee MDPI, Basel, Switzerland. This article is an open access article distributed under the terms and conditions of the Creative Commons Attribution (CC BY) license (http://creativecommons.org/licenses/by/4.0/).
Share and Cite
Reichert, W.; Nießen, J.; Leto, P.; Etzold, S.; Kröll, E.; Tonnesen, T.; Telle, R. Correlation of Thermo-Elastic Material and Corrosion Behavior of Refractory Castables by In-Situ Measurements. Ceramics 2020, 3, 101-113. https://doi.org/10.3390/ceramics3010011
Reichert W, Nießen J, Leto P, Etzold S, Kröll E, Tonnesen T, Telle R. Correlation of Thermo-Elastic Material and Corrosion Behavior of Refractory Castables by In-Situ Measurements. Ceramics. 2020; 3(1):101-113. https://doi.org/10.3390/ceramics3010011
Chicago/Turabian StyleReichert, Wanja, Jonas Nießen, Peter Leto, Simon Etzold, Eva Kröll, Thorsten Tonnesen, and Rainer Telle. 2020. "Correlation of Thermo-Elastic Material and Corrosion Behavior of Refractory Castables by In-Situ Measurements" Ceramics 3, no. 1: 101-113. https://doi.org/10.3390/ceramics3010011
APA StyleReichert, W., Nießen, J., Leto, P., Etzold, S., Kröll, E., Tonnesen, T., & Telle, R. (2020). Correlation of Thermo-Elastic Material and Corrosion Behavior of Refractory Castables by In-Situ Measurements. Ceramics, 3(1), 101-113. https://doi.org/10.3390/ceramics3010011