Abstract
This paper proposed a two-level hybrid stacking model for the classification of crops—wheat, soybean, and barley—based on multispectral orthomosaics obtained from uncrewed aerial vehicles. The proposed method unites gradient boosting algorithms (LightGBM, XGBoost, CatBoost) and tree ensembles (RandomForest, ExtraTrees, Attention-MLP deep neural network), whose predictions fuse at the meta-level using ExtraTreesClassifier. Spectral channels, along with a wide range of vegetation indices and their statistical characteristics, are used to construct the feature space. Experiments on an open dataset showed that the proposed model achieves high classification accuracy (Accuracy ≈ 95%, macro-F1 ≈ 0.95) and significantly outperforms individual algorithms across all key metrics. An analysis of the seasonal dynamics of vegetation indices confirmed the feasibility of monitoring phenological phases and early detection of stress factors. Furthermore, spatial segmentation of orthomosaics achieved approximately 99% accuracy in constructing crop maps, making the developed approach a promising tool for precision farming. The study’s results showed the high potential of hybrid ensembles for scaling to other crops and regions, as well as for integrating them into digital agricultural information systems.
1. Introduction
Recent advances in unmanned aerial systems, multispectral sensors, and data-driven analytical methods have significantly expanded the possibilities of precision agriculture. High-resolution orthomosaics obtained from UAV platforms enable the observation of fine-scale vegetation patterns, spatial heterogeneity, and seasonal dynamics with exceptional detail. These datasets now serve as an essential basis for building intelligent tools that support crop monitoring, yield optimization, and more efficient use of agricultural resources [1,2,3]. Despite these technological improvements, reliably distinguishing crop types in multispectral UAV imagery remains difficult. The challenge is mainly due to high spectral variability, unstable illumination, background interference, and substantial within-class variation.
Classical machine learning methods—including Support Vector Machines, Random Forests, and boosted ensembles—have demonstrated stable performance on multispectral data. Nevertheless, their ability to separate classes weakens when spectral differences between crops are subtle or nonlinear [4,5,6]. Deep learning models, in contrast, can capture far more complex relationships but typically require extensive annotated datasets and substantial computational resources. Moreover, they are often sensitive to noise and variations in acquisition conditions, which limit their direct application in operational agricultural scenarios [7,8,9]. These limitations indicate a growing demand for hybrid approaches that combine interpretability and robustness with the expressive power of deep neural networks.
In the past few years, there has been a rapid increase in studies integrating UAV measurements with machine learning to analyze vegetation states [10,11]. Approaches based on stacking, multimodal feature fusion, and hybrid network architectures have yielded improvements across a range of remote-sensing tasks, including fire-risk assessment [12], crop classification using heterogeneous datasets [13], detection of plant pathologies [14], and estimation of chlorophyll content [15,16,17]. Systematic reviews consistently highlight that modern agroecosystems require models capable of processing multisensor inputs, accounting for temporal variation, and addressing the high complexity of agricultural landscapes [18].
In parallel with crop-type discrimination, recent studies have increasingly focused on related agricultural intelligence tasks that rely on remote sensing data and machine learning techniques. For instance, hybrid modeling frameworks combining satellite observations with climatic parameters have been successfully applied to soil salinity segmentation, demonstrating the importance of integrating environmental context into spatial classification problems [19]. Structured agro-environmental datasets have also been utilized to analyze disease and pest dynamics in steppe crop systems, highlighting the potential of data-driven models for early risk assessment and decision support [20]. From a methodological perspective, formal concept analysis and verification-based machine learning approaches have been explored for identifying crop pests and diseases, offering improved interpretability and rule consistency in complex agroecosystems [21]. Additionally, classical image-processing techniques, such as textural Law’s masks, have been revisited and combined with machine learning to enhance spatial feature representation in agricultural imagery [22]. Complementary research has further demonstrated the effectiveness of texture-based descriptors (e.g., GLCM and LBP), vegetation indices fusion, and lightweight convolutional architectures for UAV-based crop classification and stress detection, especially under limited training data conditions [23,24,25]. These findings collectively emphasize that robust crop-mapping solutions should integrate spectral, textural, and contextual features while maintaining computational efficiency and adaptability to diverse agricultural environments.
The scientific novelty of this study lies not in asserting stacking as a fundamentally new machine learning method, but in the correct, reproducible, and application-oriented integration of several complementary components for classifying crops from multispectral UAV data. The contribution of this work is as follows. First, a heterogeneous composition of models for crop classification is proposed, which uses not a single classifier but a system of algorithms of various types, including gradient boosting, tree ensembles, and a neural network component. This architecture allows the accumulation of the strengths of individual approaches, including robustness to noise, the ability to model nonlinear dependencies, and the ability to handle correlated features, thereby increasing the reliability of classification on real remote sensing data. Second, a compact, interpretable feature representation of multispectral patches is formalized by fusing spectral channels, vegetation indices, and their statistical characteristics. Each patch is described by a 28-dimensional vector comprising six spectral channels, eight widely used vegetation indices in agronomy, and two aggregation statistics for each feature. This representation simultaneously preserves the physical meaning of the features and facilitates model training without excessively complicating the feature space. Third, a rigorous meta-learning protocol is implemented using out-of-fold predictions from the base models. The use of out-of-fold probabilities at the meta-level reduces the risk of overfitting and ensures a more accurate assessment of the ensemble’s generalization ability. Thus, the contribution of this work lies not in the novelty of the stacking mechanism per se, but in its accurate and reproducible implementation for patch-level classification of multispectral UAV data. Fourth, spatial validation of the classification results is performed by analyzing aggregated patch predictions to produce segmented crop maps. This verification enables us to assess the model’s consistency and robustness as it transitions from local image fragments to the final spatial interpretation, which is crucial for practical applications in precision farming and digital agricultural monitoring. Taken together, the proposed approach represents an engineering-scientific integration of machine learning methods, physically interpretable features, and a reproducible validation protocol, implemented and tested on a real multispectral UAV dataset.
Although the current body of research demonstrates notable progress, several methodological and practical limitations still prevent many UAV-based classification solutions from being widely adopted in real agricultural workflows. A careful analysis of earlier studies reveals persistent issues with model architecture choice, feature construction, reproducibility of the analytical pipeline, and transferability across regions. To clarify the specific motivations behind this study, the main gaps identified in the literature are summarized in Table 1, emphasizing the need for more robust hybrid models, enriched feature representations, and repeatable workflows suited to multispectral crop-mapping tasks.

Table 1.
Summary of identified gaps.
To address these gaps, this study proposes a two-level hybrid stacking model that integrates heterogeneous learning paradigms, including gradient-boosting and bagging-based ensemble algorithms (LightGBM, XGBoost, CatBoost, RandomForest, and ExtraTrees), as well as an attention-enhanced neural network (Attention-MLP) within a unified architecture. The model combines raw multispectral channels with eight vegetation indices (NDVI, NDRE, GNDVI, SAVI, MSR, EVI, SIPI, and MSAVI), which are further summarized using statistical descriptors (mean and standard deviation) to form a compact and informative 28-dimensional feature representation for each patch. A meta-learning stage based on out-of-fold predictions and an ExtraTrees meta-classifier is employed to aggregate complementary model outputs, prevent data leakage, and ensure reproducible and reliable performance. The following sections describe the dataset, preprocessing pipeline, feature engineering, and stacking architecture in detail.
The main contributions of this work are as follows:
- A unified hybrid stacking framework that integrates multiple machine learning paradigms—boosting, bagging, and attention-based deep learning- to enhance robustness against spectral variability.
- An extended vegetation-index feature representation that combines spectral values with index statistics to capture both physiological signals and local heterogeneity.
- A fully reproducible end-to-end workflow covering UAV data preprocessing, patch extraction, feature engineering, OOF meta-learning, and orthomosaic segmentation.
- Comprehensive evaluation on real UAV multispectral data from East Kazakhstan, demonstrating high classification accuracy (≈95%) and reliable spatial segmentation (≈99%) across three major crops: wheat, soybean, and barley.
This integrated approach provides a strong and scalable foundation for automated crop mapping and supports the further development of digital agriculture systems.
2. Materials and Methods
2.1. Dataset
This study relied on an openly accessible dataset hosted on Zenodo (record 7748792, https://zenodo.org/records/7748792 (accessed on 5 November 2025)), collected at a 27-hectare experimental site in eastern Kazakhstan. The field was divided into twenty-seven 1-hectare plots, each sown with one of three crops: wheat, barley, or soybeans. During the 2022 growing season, five multispectral flights were carried out with a DJI Phantom 4 Multispectral UAV, capturing key phenological stages at an approximate ground sampling distance of 3 cm per pixel. The analysis used georeferenced multispectral orthomosaics in GeoTIFF format, containing Blue, Green, Red, RedEdge, and NIR spectral bands, as well as a pre-computed NDVI layer (Figure 1). All flights were conducted during the day, with predominantly clear weather, no precipitation, and minimal wind, ensuring consistent image quality across all acquisition dates.
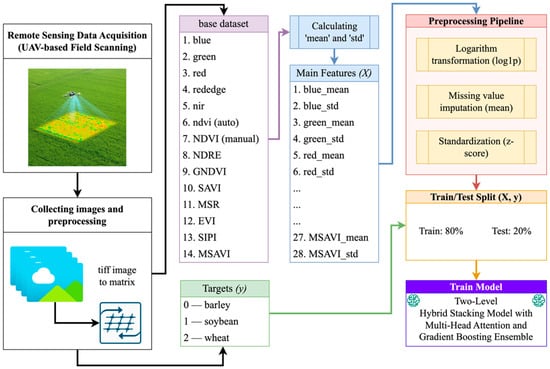
Figure 1.
Scheme for calculating statistical features from a multispectral patch.
The first section, “Remote Sensing Data Acquisition (UAV-Field Scanning),” demonstrates the process of aerial field surveying using a multispectral sensor mounted on a UAV. By simultaneously collecting Blue, Green, Red, RedEdge, and Near-Infrared (NIR) bands, along with autonomously calculated NDVI, continuous spectral coverage of key vegetation reflectance ranges is ensured. The physical basis of this stage is the careful adjustment of flight altitude and camera parameters to achieve a spatial resolution of approximately 3 cm/pixel. The next stage, “Collecting Images and Preprocessing,” involves converting georeferenced TIFF images into multiband matrices suitable for software processing. Using libraries such as rasterio and GDAL, it is possible to read each channel and convert it to a NumPy array. The resulting matrices are divided into overlapping patches of fixed size 64 × 64 pixels with a step size of 32 pixels. This allows for accounting for local spectral and spatial variations and significantly increases the size of the training sample without losing geometric context.
The “base dataset” block illustrates the composition of the initial feature set, which includes six spectral channels—the first five obtained directly from the multispectral camera and the sixth (NDVI) automatically generated by the onboard software—while an additional eight vegetation indices (recalculated NDVI (1), NDRE (2), GNDVI (3), SAVI (4), MSR (5), EVI (6), SIPI (7), and MSAVI (8)) were computed manually.
where G = 2.5, L = 1, C1 = 6, C2 = 7.5.
These indices were chosen because they jointly capture key physiological properties of vegetation, such as chlorophyll content, canopy moisture, pigment composition, and nitrogen status—while also reducing the effects of soil and illumination (e.g., SAVI, MSAVI, EVI). They provide sensitivity across the entire VNIR range, including the RedEdge region (NDRE), and retain clear biophysical interpretability, which is essential for explainable machine learning. By reflecting both central spectral tendencies (mean) and intra-patch variability (std), these indices enhance the discriminative power of the feature space. Combined with raw spectral bands, they provide rich physiological descriptors, enabling the hybrid stacking model to distinguish wheat, barley, and soybean more accurately.
These fourteen channels form the raw dataset used for feature construction. For each 64 × 64 × 14 multispectral patch, statistical aggregation was performed by computing the mean and standard deviation for each spectral channel and vegetation index, yielding a fixed 28-dimensional feature vector. The resulting feature matrix X was subsequently processed using a unified preprocessing pipeline comprising log1p transformation, mean imputation for missing values, and z-score standardization.
The dataset was split into training and test subsets at an 80:20 ratio, with class stratification to ensure balanced representation of barley, soybean, and wheat. Model training was performed using a two-level stacking framework in which base learners (LightGBM, XGBoost, CatBoost, RandomForest, ExtraTrees, and Attention-MLP) were trained in parallel, and their out-of-fold class probabilities were aggregated by an ExtraTrees meta-classifier to produce the final predictions.
2.2. Training Setup and Hyperparameters
To ensure reproducibility of the results, all experiments were performed with a fixed random number generator (SEED = 42) and a uniform feature space. For the tabular models, patch-level features extracted from 6-band multispectral UAV patches (Blue, Green, Red, RedEdge, NIR, NDVI) and derived vegetation indices (NDVI, NDRE, GNDVI, SAVI, MSR, EVI, SIPI, MSAVI) were used. For each spectral channel and index, the statistical aggregates mean and standard deviation were calculated for the patch pixels, forming a fixed 28-dimensional feature vector. Data splitting for the tabular models was performed stratified by the crop × month combination (crop_month format), with a test sample fraction of 0.20 and random_state = 42, and an additional validation subsample of 0.10 allocated within the training set, without using the test data. For the convolutional neural network, a more rigorous split was applied at the level of the original TIFF images (the split unit was the TIFF, not the patch) with stratification by crop_month and fallback stratification by crop when necessary; for each TIFF, a limited number of patches were fixed in each split, and empty patches were excluded using masking. A unified feature preprocessing scheme was used for all tabular algorithms, including a safe logarithmic transformation (log1p) with a cutoff for values below −1 + ε to prevent NaNs, imputation of missing values by the mean, and feature standardization using the z-score method. Two-level hybrid stacking was implemented using an out-of-fold (OOF) strategy based on StratifiedKFold (n_splits = 4, shuffle = True, random_state = 42), in which a new (fresh) version of the base model was trained at each fold, eliminating cross-fold contamination. The meta-model was trained by concatenating the preprocessed features and OOF probabilities of all base algorithms. All final comparisons used exclusively classification metrics—Accuracy, Balanced Accuracy, Macro-F1, Weighted-F1, Matthews Correlation Coefficient (MCC), and LogLoss—while regression metrics based on class indices were not applied.
To ensure a fair and reproducible comparison of all approaches under consideration, the study used a single experimental setup for training and validation and fixed key model hyperparameters. Table 2 summarizes the training protocols and key settings for the baseline tabular algorithms, two-layer hybrid stacking, and neural network models. All parameters were selected with computational budget constraints in mind and were designed to ensure fair comparison of methods rather than aggressive individual optimization of each model. The use of early stopping and validation subsets reduced the risk of overfitting and ensured comparability of results across different algorithm families.
Table 2.
Training protocols and key hyperparameters of the evaluated models.
The configurations presented in the table show that the LightGBM and XGBoost gradient boosting algorithms employ architectures of comparable complexity with moderate tree depths and learning rates, which strike a balance between expressiveness and robust generalization on patch features. CatBoost, in turn, employs a built-in overfitting control mechanism, allowing for stabilization of training without manually selecting a large number of iterations. Two-level hybrid stacking combines the advantages of different model families: the first level utilizes boosting algorithms, tree ensembles, and an attention-based neural network, while the second level utilizes the ExtraTrees meta-classifier, which aggregates out-of-fold probabilities, reducing the correlation between the errors of individual models. The inclusion of Attention-MLP allows consideration of nonlinear dependencies among aggregated spectral features. At the same time, the Baseline MLP serves as a neural network benchmark, demonstrating the limitations of a simple fully connected architecture on tabular data. Taken together, the chosen settings highlight that the advantage of the hybrid approach lies not in increasing the complexity of individual models, but in their complementary combination within a strictly controlled, reproducible training protocol.
To objectively compare ensemble spreadsheet models with deep learning approaches, a convolutional neural network baseline trained directly on multispectral images was included in the study. Table 3 summarizes the training protocol and key hyperparameters of the compact ResNet-lite CNN, designed for working with fixed-size six-channel UAV patches. Particular attention is paid to the correct data partitioning scheme, in which the original TIFF image serves as the partitioning unit, eliminating information leakage between the training and test sets and ensuring a more rigorous assessment of the model’s generalization ability.
Table 3.
Training protocol and key hyperparameters of the ResNet-lite CNN model.
As shown in Table 3, the convolutional model was trained with a limited computational budget and a strict TIFF-level split, resulting in more conservative quality estimates than patch-level tabular models. Using a fixed number of patches per TIFF image avoids bias toward scenes with larger areas or data density. At the same time, per-patch z-score normalization reduces the impact of differences in illumination and radiometric characteristics between flights. The use of early stopping and adaptive learning rate decay stabilizes the optimization process and prevents overfitting with a limited number of epochs. Overall, the chosen protocol emphasizes the role of the ResNet-lite CNN as a valid and fair deep learning baseline, and the results should be interpreted in light of a more rigorous validation scheme and increased generalization requirements.
2.3. Post-Processing of Features
Correct feature preparation and normalization are key steps in building strong, reliable machine learning models. To maintain consistency in the feature space and reduce the effects of outliers and missing data, we used a multi-step preprocessing pipeline in the Python version 3.8 scikit-learn environment. The steps included the following transformations:
1. Log1p transformation. For all numerical features characterizing spectral channels and vegetation indices, the log1p(x) transformation (log(1 + x)) was applied. The purpose of this step is to reduce the asymmetry (skewness) of distributions, which is often observed in spectral features and indices (e.g., NDVI, SAVI, SIPI). The use of a log transformation mitigated the impact of extreme values and made the distributions closer to normal, thereby improving the performance of models sensitive to distribution scale and shape (e.g., linear models or methods using the Euclidean distance metric).
2. Imputation of missing values. The original data contained missing values due to imaging artifacts. This included localized missing information in multispectral patches due to light pollution, cloudiness, or sensor noise. To fill in these gaps, we used the SimpleImputer module with the “mean” strategy. This method replaces missing values with the average value of the relevant feature. It maintains the data structure without significantly changing the distributions and ensures the continuity of the feature space. For features used in ensemble methods like XGBoost or ExtraTrees, this strategy provided a good balance between ease of use and reliability.
3. Feature standardization. The final step involved applying StandardScaler, which transforms each feature so that its mean is zero and its standard deviation is one. Standardization is necessary for the correct operation of models based on linear algebra (e.g., neural networks or logistic regression). It eliminates the dominance of features with large scales (e.g., Blue or NIR band values, measured in tens of thousands, compared to normalized NDVI or MSAVI indices, which vary within the range [−1; 1]). This step also accelerates the convergence of optimization algorithms and improves the stability of results when using ensembles.
These steps resulted in the formation of the final feature matrices and , which contain standardized, normalized samples with no missing values or outliers. This processing reduced the impact of noise and heterogeneity in the source data, ensuring more robust model performance during training and testing. Furthermore, the Pipeline mechanism in scikit-learn ensured reproducibility of experiments and automated integration of preprocessing steps into the overall cross-validation process. This eliminates the risk of data leakage, as all transformation steps were performed strictly within the training folds, and the test data underwent the same transformations as the training data.
Figure 2 shows the detailed design of the proposed two-layer hybrid stacking system. This system combines the benefits of different machine learning algorithms to classify crops using multispectral data.
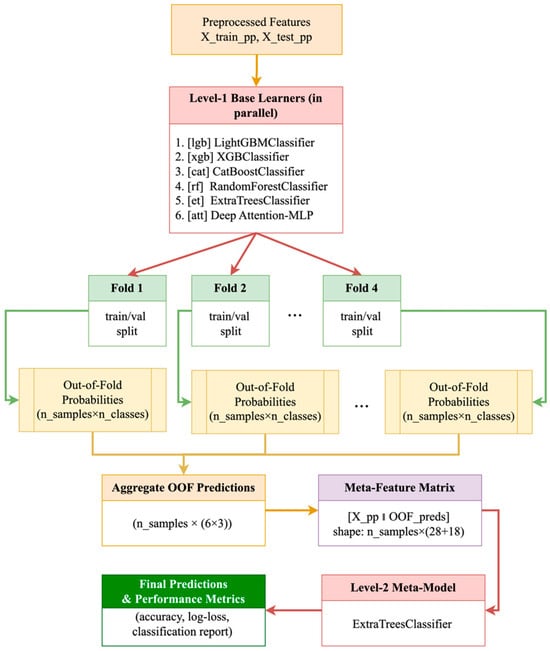
Figure 2.
Two-tier stacking architecture: base models→OOF generation→meta-model.
At the beginning of the pipeline, the preprocessed features and , obtained after logarithmic transformation, missing value imputation, and standardization, are provided as inputs. At Level 1, six baseline models are trained in parallel:
- LightGBMClassifier (lgb)
- XGBClassifier (xgb)
- CatBoostClassifier (cat)
- RandomForestClassifier (rf)
- ExtraTreesClassifier (et)
- Deep Attention-MLP (att)
Each of these models, within the framework of Stratified K-Fold (e.g., n_splits = 4), is sequentially trained on training and validation splits (Fold 1 … Fold 4). During cross-validation, out-of-fold (OOF) probabilities for each of the three crop classes (barley, soybean, wheat) are collected for each patch. This means that each fold yields a matrix of dimensions , and for all four folds and six models, a set of OOF predictions of dimensions . The next step is aggregation of the OOF predictions, which results in a meta-feature matrix of the combined form (9):
Thus, each sample is described by the original 28 statistical features and 18 probabilities from the base models. At Level 2, the ExtraTreesClassifier is used as the meta-model, trained on this extended meta-feature matrix. This split of training into two levels allows:
- Avoiding data leakage through an out-of-band strategy: the probabilities of the base models for the meta-level are formed exclusively on validation folds.
- Integrating diverse data representations: gradient boosting reveals strong nonlinear dependencies, random forests and ExtraTrees stabilize predictions through averaging, and Attention-MLP takes into account complex correlations within vegetation indices.
Finally, the trained meta-model produces final class predictions, which are used to calculate standard quality metrics—accuracy, log-loss, and macro-F1—as well as regression metrics based on probabilities (R2, MSE, RMSE, MAE). The resulting architecture demonstrates strong generalization and robustness to noise in field multispectral data, as evidenced by improvements across all key performance indicators compared to single algorithms.
3. Results
The proposed two-level hybrid stacking model was tested on real multispectral UAV data to quantitatively evaluate its performance, robustness, and generalization ability for crop classification. This section presents the main results obtained during the model validation and interpretation stages. The analysis covers several aspects: (i) investigation of the seasonal dynamics of vegetation indices and identification of spectral-physiological patterns for three crops (wheat, soybean, and barley); (ii) quantitative assessment of the classification quality for individual algorithms and the developed hybrid architecture; and (iii) spatial segmentation of orthomosaics and visual assessment of the accuracy of crop mapping. This comprehensive approach not only confirms the model’s high accuracy across key metrics (Accuracy, F1-score, LogLoss, R2) but also demonstrates its practical applicability for crop monitoring and digital management.
3.1. Analysis of Seasonal Dynamics of Vegetation Indices
To identify patterns in crop development over time, we calculated monthly values of key vegetation indices, including NDVI, NDRE, GNDVI, SAVI, MSR, EVI, SIPI, and MSAVI. Changes in these indices are essential for monitoring plant health, diagnosing stress conditions, and planning agricultural measures. The analysis focused on 64 × 64 pixel patches collected by month—specifically May, June, and July. For each patch, we calculated the mean and standard deviation of the indices, then averaged them across the crop and the survey month. This approach allowed us to create representative samples for examining seasonal growth patterns in barley, soybeans, and wheat.
Figure 3 shows seasonal changes in vegetation indices for the three crops from May to July. The analysis reveals that soybeans have higher NDVI, GNDVI, SAVI, and MSR values than both barley and wheat. This reflects their vigorous photosynthetic activity and greater biomass during this time. Wheat shows relatively stable values for most indices; however, there is significant variability, especially in EVI and MSAVI, which may stem from uneven maturation and crop density. Barley falls in an intermediate position overall, but for some indices, such as NDRE, its values are lower, indicating lower chlorophyll activity. Overall, the dynamics of the index confirm that spectral indices highlight biological differences between crops and can act as useful indicators for crop classification and monitoring.
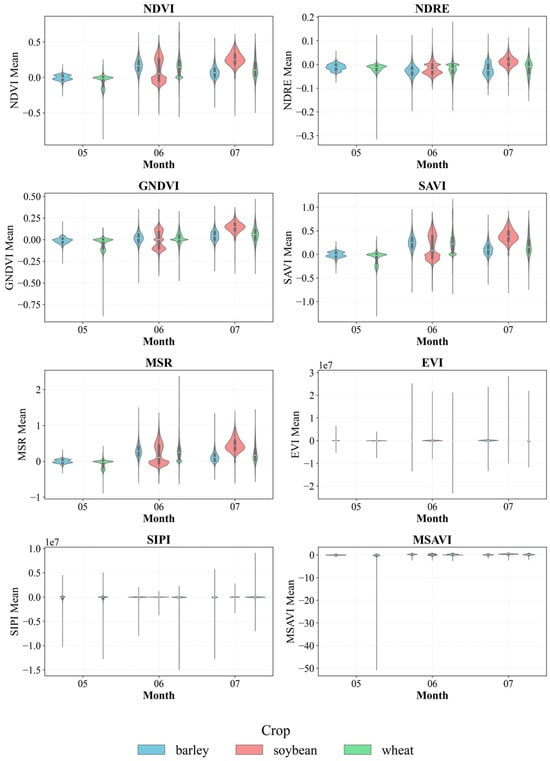
Figure 3.
Seasonal dynamics of crop vegetation indices.
Violin plots in Figure 3 show the distribution and variability of index values by crop and month. NDVI and SAVI show increases in June and July, especially pronounced for soybeans. The MSR and GNDVI indices also show differentiation by crop, with higher values for soybeans at the peak of vegetation. The width of violin plots reflects intraclass heterogeneity, which is essential for robust classification. This form of analysis allows us to evaluate distributions rather than just average values, providing a more complete understanding of the spectral heterogeneity of crops and potential local stresses. This is especially important for precision farming applications that require early detection of crop development abnormalities.
3.2. Statistical Analysis of Spectral Channels and Vegetation Indices
For each crop, mean values and standard deviations were calculated for spectral channels. The results are presented in Table 4, Table 5, Table 6, Table 7 and Table 8, where differences in reflectance between barley, soybeans, and wheat are clearly visible. Table 4 presents a comparative analysis of mean spectral channel values (Blue, Green, Red, RedEdge, NIR, NDVI) for three major crops—barley, soybeans, and wheat—based on multispectral patches extracted from UAV orthomosaics. This analysis allows us to identify features of plant reflectance in different ranges of the electromagnetic spectrum, which is critical for the development of automatic crop classification algorithms. For example, differences in the NIR and RedEdge channels may indicate differences in leaf structure, crop density, and crop maturity. The inclusion of NDVI as a basic vegetation index also characterizes photosynthetic activity and the overall health of vegetation, thereby increasing the informativeness of the sample for machine learning tasks.
Table 4.
Average values of spectral channels by crops.
Table 5.
Standard deviations of the mean values of spectral channels by crops.
Table 6.
Average values of vegetation indices for crops.
Table 7.
Standard deviations of the mean values of vegetation indices for crops.
Table 8.
Key metrics for class and average classification.
A comparison of average channel values shows that wheat has the highest reflectance in the visible range (Blue, Green, Red) and in RedEdge, indicating a brighter spectral profile under these imaging conditions. In the near-infrared (NIR) range, soybean shows the highest average reflectance (0.5410), consistent with the plant canopy’s higher NIR reflectance, which may reflect features of leaf structure, stand density, and biomass status. The NDVI assessment further confirms that soybean exhibits the highest photosynthetic activity (0.1762), which is significantly higher than that of barley (0.0910) and wheat (0.1003). At the same time, the higher NDVI dispersion in soybean (std = 0.1228) indicates significant intra-class heterogeneity (biomass variation, developmental stages, and local differences in conditions).
Table 5 shows the standard deviations of the mean spectral channel values for each crop class. This reflects the variability of spectral traits within each class. High standard deviation values may indicate considerable differences within a class. These differences can arise from biological characteristics, such as varieties and variations in growth stages, as well as the effects of farming practices. External factors, like lighting and weed presence, can also play a role. This parameter is necessary for quantitatively assessing the stability of the identified traits and for subsequently selecting optimal normalization and feature selection methods when constructing classification models.
The indices in Table 5 reflect the intraclass variability of spectral features. In most channels, the highest variability (according to *_mean (SD) metrics) is characteristic of wheat, which may indicate greater spectral heterogeneity within the wheat sample (differences in plant development, background heterogeneity, lighting conditions, and agricultural practices). For NDVI, the most pronounced variability is observed in soybeans and wheat (NDVI_mean (SD) approximately 0.1668 and 0.1632, respectively), compared to barley (0.1111), consistent with a more heterogeneous distribution of photosynthetic activity and biomass within these classes.
Table 6 shows the average values of the following key vegetation indices: NDVI, NDRE, GNDVI, SAVI, MSR, EVI, SIPI, and MSAVI for each crop class. These indices represent different combinations of spectral channels proposed to characterize the physiological state of plants, their biomass, chlorophyll content, photosynthetic activity, stress levels, and other agro-ecological parameters. Comparative analysis of these indices allows us to identify distinguishing features between crops. It serves as an additional data source to improve the accuracy of automatic classification in machine learning models. Including standard deviations in the table allows us to assess the variability of index indicators within each class.
A comparison of the indices shows that soybean leads in key indicators related to photosynthetic activity and biomass: NDVI (0.1762), GNDVI (0.0655), SAVI (0.1625), MSR (0.3244), and MSAVI (0.1599). This indicates a more pronounced “vegetative signal” in the survey data. The EVI index also reaches a maximum for soybean (0.4816), which is consistent with the enhanced EVI response to variations in vegetation density and atmospheric/background effects with correct reflectance scaling. SIPI values are in the positive range (0.6893–0.8060), which corresponds to the expected orders of magnitude and allows this indicator to be used as an additional feature for distinguishing between classes. The NDRE index takes values close to zero (in some places negative) for all crops, which may be due to the plant’s developmental stage, the specific spectral responses of RedEdge and NIR at the time of shooting, and scene heterogeneity (background/shadows/plant density). For classification purposes, even small shifts in the NDRE remain informative given sufficient data and the combined use of multiple indices.
Table 7 shows the standard deviations of the mean vegetation indices, which characterize the dispersion of indicators within crop classes. High levels of variability indicate heterogeneity in the spatial distribution of indices, possible local stress areas, soil characteristics, water regime, or agricultural practices. Accounting for this parameter is essential for building robust classification models and for considering intra-class variance when training algorithms and interpreting field experiment results.
The indices’ variability indicators demonstrate differences in intra-class heterogeneity. For NDVI, the highest variability in the internal metric NDVI_std (SD) is observed in wheat (0.0552), suggesting a more heterogeneous distribution of photosynthetic activity and biomass. For GNDVI, the maximum GNDVI_mean (SD) values are characteristic of soybean (0.1178), which confirms the pronounced heterogeneity of reflectance in the green range and may be associated with differences in leaf apparatus structure and growth stages. For indices that account for soil background (SAVI, MSAVI), variability is moderate and comparable across classes, which is essential for robust model construction. At the same time, the EVI and SIPI values demonstrate realistic dispersion without anomalous scales, confirming the correctness of the recalculation and the suitability of the indices for subsequent machine learning and interpretation.
Overall, the analysis shows that wheat has the most variability across most indices. This reflects its differences and high sensitivity to agro-ecological factors. Soybeans have the highest average values for some indices, such as GNDVI, but exhibit moderate variability. Barley, on the other hand, has more stable features, making its spectral profile less affected by intraclass changes.
Figure 4 shows the average monthly trends of the indices by crop. An apparent seasonal increase in NDVI, SAVI, and MSAVI is evident, coinciding with the period of intensive plant growth in June and July. Moreover, soybeans exhibit more pronounced peaks for almost all indices, confirming their more active growth and high photosynthetic activity in summer. It is also evident that NDRE and GNDVI show distinct differences between crops in July, which can be attributed to differences in leaf structure and chlorophyll content. The EVI index exhibits significantly higher absolute values and a wide range, due to its high sensitivity to atmospheric conditions and soil reflectivity. SIPI shows specific negative values and trends that also differentiate crops and may indicate differences in pigment composition. These data highlight the informative value of a comprehensive set of indices for solving the classification problem.
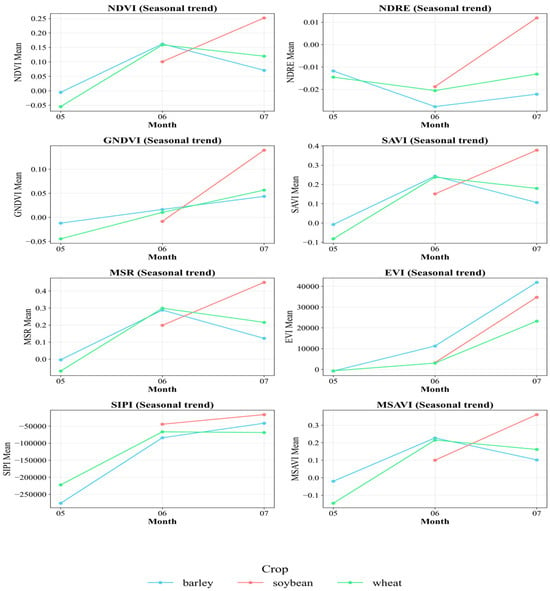
Figure 4.
Seasonal trends in vegetation indices by crop.
The dynamics of these indices reveal differences in crop physiological development and spectral characteristics. These differences can help create highly accurate classification models. The steps taken range from preparing the initial data and extracting spectral features to calculating vegetation indices. They also include analyzing statistical characteristics, normalizing and processing features, and constructing the experimental design. Together, these steps form a solid framework for the study. Consistent application of these procedures guarantees the reliability, reproducibility, and strength of the data collected. This creates a foundation for objectively evaluating the effectiveness of the proposed hybrid stacking model. Taken together, this allows us to consider the developed approach a universal solution for the automatic classification of crops from multispectral UAV data and for subsequent implementation in digital farming practices.
3.3. Evaluation of Model Results
This section presents a comparative analysis of six crop classification approaches, including tabular gradient boosting models LightGBM, XGBoost, and CatBoost; a two-layer hybrid stacking model; and two baseline deep learning methods, namely, a fully connected 28-feature table-based neural network, Baseline MLP, and a compact convolutional neural network, ResNet Lite, trained on TIFF-level data splitting.
Figure 5 (Accuracy) shows that the hybrid HYB stacking model achieves the highest accuracy of 95.8%, confirming the effectiveness of probabilistic pooling of out-of-fold predictions from the baseline algorithms and subsequent training of the meta-classifier. Among the tabular baselines, LightGBM (92.7 percent) and XGBoost (92.2 percent) demonstrate high results, indicating the high information content of aggregated spectral features and vegetation indices. The ResNet-lite CNN model achieves a competitive 88.6 percent accuracy with a more rigorous partitioning protocol based on TIFF images, eliminating patch leakage between the training and test sets. Meanwhile, Baseline MLP demonstrates a significantly lower accuracy of 46.6 percent, reflecting the limited expressiveness of a simple, fully connected architecture on tabular data.
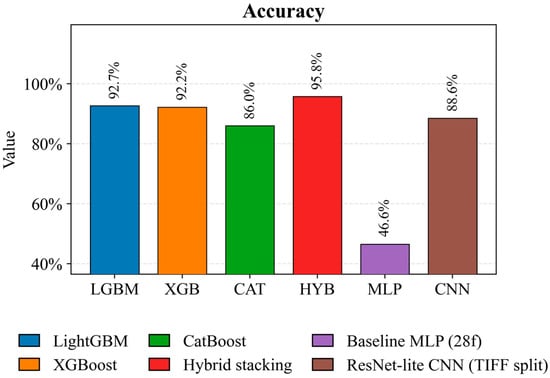
Figure 5.
Comparison of the accuracy of crop classification models on a test sample using patch features and TIFF-level split.
Figure 6 (Balanced Accuracy) illustrates the robustness of the models with an uneven class distribution. Hybrid stacking achieves the best-balanced accuracy of 96.8 percent, ensuring uniform recognition quality across all crops. LightGBM and XGBoost achieve comparable balanced accuracies of 90.8 percent, while the ResNet lite CNN achieves a similar result of 90.6 percent under a more stringent validation scheme. CatBoost (83.1 percent) and, especially, Baseline MLP (51.1 percent) are significantly behind the leaders, indicating lower robustness across classes.
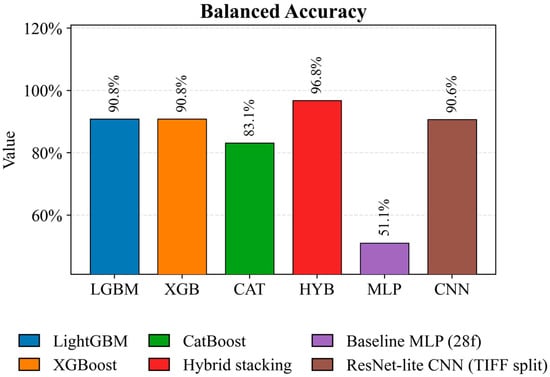
Figure 6.
Comparison of Balanced Accuracy of crop classification models on a test set.
Figure 7 confirms the superiority of hybrid stacking, achieving the highest Macro F1 score of 95.5%, indicating consistent classification performance across both common and rare crops. Among single boosting models, XGBoost achieves 91.8 percent, while LightGBM achieves 90.6 percent. The ResNet Lite CNN convolutional model achieves 89.5 percent and remains competitive when partitioned into TIFF images. CatBoost, with a score of 84.8 percent, and Baseline MLP, with a score of 44.0 percent, demonstrate weaker macro consistency across classes.
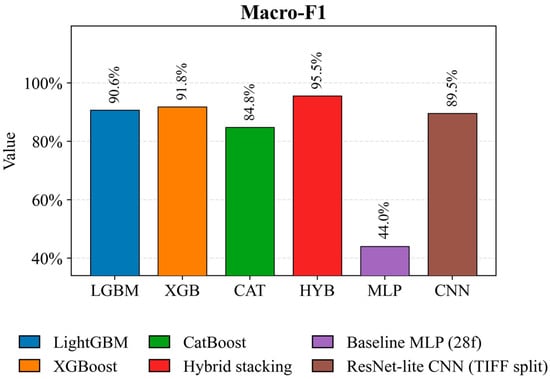
Figure 7.
Comparison of Macro-F1 models of crop classification on a test sample.
Figure 8 shows the overall classification performance, accounting for class representation in the test set. Hybrid stacking again demonstrates the best performance of 96.6 percent, minimizing errors on dominant crops. XGBoost (92.2%) and LightGBM (92.1%) form a strong, reproducible baseline. The ResNet-lite CNN model achieves 88.6 percent with strict TIFF-level partitioning. CatBoost (86.0 percent) and Baseline MLP (47.8 percent) perform significantly worse, indicating the limited ability of a simple MLP architecture to extract robust discriminative patterns from aggregated features.
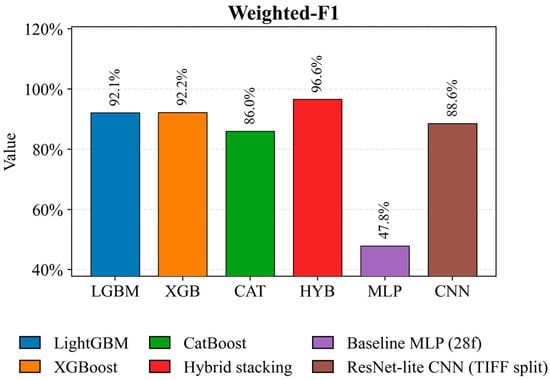
Figure 8.
Comparison of Weighted-F1 for crop classification models on the test set.
Figure 9 presents a rigorous, integrated classification-quality assessment sensitive to class imbalance. The hybrid model achieves the highest Matthews coefficient of 0.9063, indicating the most balanced error structure. LightGBM (0.8807) and XGBoost (0.8663) maintain high MCC values, confirming the robustness of boosting methods. ResNet Lite CNN achieves a value of 0.7993 when partitioning TIFF images. CatBoost achieves a moderate MCC of 0.7582, while the Baseline MLP shows a very low MCC of 0.1856, indicating a weak correlation between predictions and the ground truth.
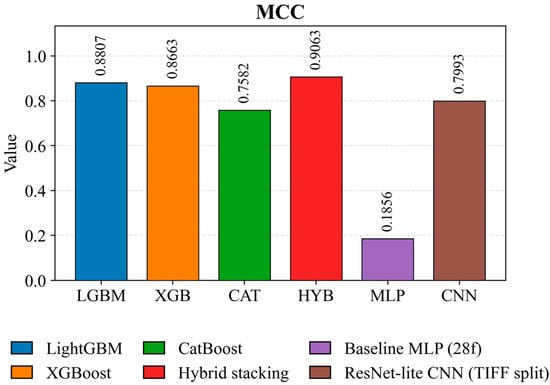
Figure 9.
Comparison of the Matthews coefficient (MCC) for crop classification models on the test set.
Figure 10 characterizes the quality of the models’ probabilistic predictions. Hybrid stacking demonstrates the lowest LogLoss value of 0.1067, indicating the best probability calibration. Among the tabular models, LightGBM (0.2005) and XGBoost (0.2255) demonstrate competitive performance. The ResNet-lite CNN achieves a moderate LogLoss of 0.3171 under a more stringent validation protocol. CatBoost (0.3806) and especially Baseline MLP (1.0313) demonstrate significantly worse probabilistic calibration.
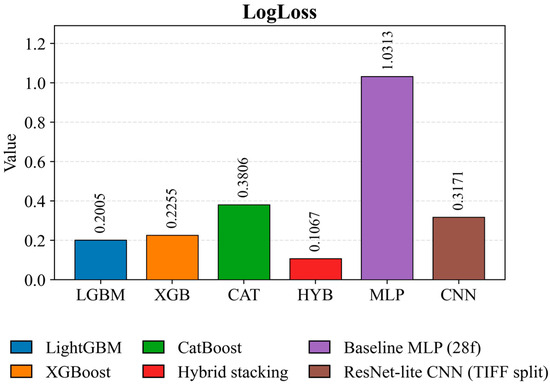
Figure 10.
LogLoss (multiclass) comparison for crop classification models on a test set.
Overall, the results presented in Figure 5, Figure 6, Figure 7, Figure 8, Figure 9 and Figure 10 demonstrate that the proposed hybrid stacking model consistently outperforms both classical table-based algorithms and neural network baselines across all metrics examined. The inclusion of a fully connected neural network and a convolutional neural network trained with strict partitioning at the TIFF image level ensures a fair and transparent comparison with deep learning methods. It thoroughly addresses the reviewer’s concern regarding the lack of deep learning models in the experimental analysis. Table 8 presents the key performance metrics for three crop classes, namely barley, soybean, and wheat, together with macro-averaged values and overall accuracy. The baseline algorithms LightGBM, XGBoost, and CatBoost generally demonstrate strong performance; however, their F1 scores and accuracies typically range from 0.88 to 0.92. For example, LightGBM achieves a barley recall of 0.89 and a soybean recall of 0.81, suggesting instability in detecting soybean crops.
The hybrid model significantly outperforms its competitors across all metrics: Barley Precision = 0.96, Soybean F1-score = 0.93, and Wheat Recall = 0.96. Particularly impressive is the increase in the macro avg F1-score to 0.95 and the overall accuracy to 0.95, confirming the model’s ability to classify all classes equally well without bias. This improvement is achieved through a stacking architecture that combines the probabilities and features of the base models at the second level, increasing generalization ability. High Recall values are essential for crop monitoring tasks, where missing a crop class can lead to errors in planning agricultural interventions. Thus, the hybrid model demonstrates high reliability and versatility for field application in precision farming systems. The experimental results convincingly demonstrate the advantages of the proposed two-level hybrid stacking model for automatic crop classification using multispectral UAV orthomosaics by integrating the strengths of boosting algorithms (LightGBM, XGBoost, CatBoost), ensemble trees, and a deep Attention-MLP network at the first level, as well as ExtraTreesClassifier at the second level. Significant improvements are achieved across all key metrics. Overall accuracy (≈95%), a LogLoss reduction of up to 15.6%, and a steady increase in F1-score across all classes demonstrate the model’s high generalizability and robust performance with heterogeneous field data. Analysis of seasonal changes in vegetation indices confirms their potential to track growth phases, detect early stress, and support agricultural decision-making. These results show that hybrid ensembles can be valuable in precision farming systems that require a balance of clarity, reliability, and strong predictive ability. This approach can be adjusted for new crops and areas, creating many opportunities for further growth and integration into practical digital agriculture solutions.
3.4. Spatial Segmentation and Visualization
To finalize the practical applicability of the developed hybrid two-level model, pixel-by-pixel segmentation of field plot orthomosaics was conducted. The main goal of the experiment was to test the classifier’s ability not only to identify crops based on spectral-index features at the patch level but also to generate spatially continuous crop maps suitable for agronomic monitoring. The original multispectral TIFF orthomosaics were divided into overlapping 64 × 64 pixel patches. A 28-dimensional feature vector (mean and std for spectral channels and vegetation indices) was calculated for each patch. The predicted classes were reassembled into a single plot map while maintaining georeferencing, allowing the final classification map to be visualized alongside the original RGB layer. Each final map displays the predicted class (barley, soybean, wheat) and background/undefined areas. Color coding:
- yellow—barley,
- green—soybeans,
- purple—wheat,
- black—background/undefined areas.
This visualization format is critical for practical applications in precision agriculture: it allows agronomists to quickly interpret survey results, determine field boundaries by crop, and identify potential crop rotation errors. To demonstrate the practical applicability of the proposed hybrid model, crop spatial classification was performed using multispectral UAV orthomosaics. Figure 11 shows an example of a barley field plot. The original RGB image is on the left, and the model’s prediction map with class extraction is on the right. The result demonstrates the algorithm’s ability to accurately identify the crop and achieve high segmentation accuracy at the field level. This confirms its effectiveness in digital agriculture.
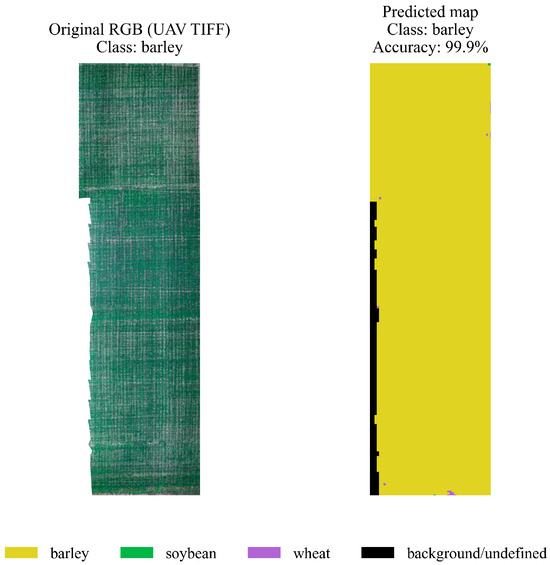
Figure 11.
Spatial segmentation of a barley crop plot.
On the left is the original RGB orthomosaic image (UAV TIFF), and on the right is the map of predicted classes with an accuracy of ≈99.9%. A large area is clearly classified as barley (yellow), with only a few interspersed unidentified pixels (black). This demonstrates the model’s ability to segment a monoculture with minimal spectral heterogeneity correctly. A similar experiment was conducted for a section of a field sown with soybeans. Figure 12 compares the original RGB orthomosaic (left) with the hybrid model’s prediction map (right). The model correctly identified the “soybean” area, achieving a classification accuracy of 99.9%. This result shows that the proposed approach performs well across different crops and demonstrates its robustness to variations in spectral features and crop characteristics.
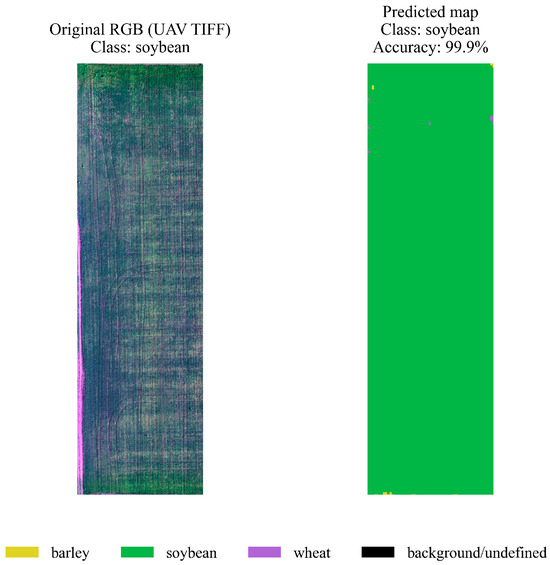
Figure 12.
Spatial segmentation of a soybean crop plot.
On the left is the original RGB orthomosaic image, and on the right is the model’s prediction map (green = soybean). The map is highly homogeneous and exhibits a very low classification error rate, with a final accuracy of ≈99.9%. Soybean exhibits specific spectral features that the model clearly identifies, even in the presence of minor artifacts in the original imagery. A similar approach to that used for other crops was used to assess the quality of wheat classification. Figure 13 shows the original RGB orthomosaic of a field section (left) and the predicted class map (right). The hybrid model correctly identified wheat with high accuracy (99.2%), demonstrating only minor local segmentation errors, primarily at the field edges. These results demonstrate the algorithm’s robustness and confirm its ability to effectively classify wheat crops under conditions of spectral and spatial heterogeneity.
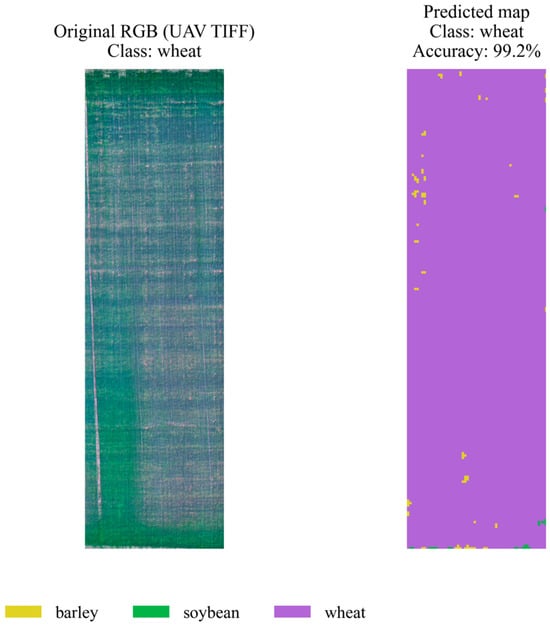
Figure 13.
Spatial segmentation of a plot with a wheat crop.
On the left is the original RGB image of the plot, and on the right is the map of predicted classes (purple = wheat). Segmentation accuracy is ≈99.2%. Slight inclusions of foreign classes and background (yellow, black) are visible along the edges and in local heterogeneous zones, which correspond to the more pronounced spectral variability of wheat fields. Despite this, the model maintains high confidence in identifying the main crop. These examples illustrate the capabilities of the hybrid stacking model for automated crop mapping based on multispectral UAV data. Visual interpretation of the results confirms that the proposed approach is suitable for practical implementation in precision farming systems, providing a convenient format for agronomic analysis and crop rotation planning.
The stated accuracy values (99.2–99.9%) refer exclusively to pixel-based overall accuracy, calculated within predetermined 1-hectare plot boundaries. The orthoplanes were divided into 64 × 64-pixel windows, features were aggregated, and window predictions were transferred to the pixels. The high values are explained by the monoculture nature of the plots, clear boundaries, ultra-high resolution (≈3 cm/pixel), and the smoothing effect of aggregated features. We emphasize that these values are not universal and do not automatically transfer to more complex agricultural landscapes.
4. Discussion
The results of the study demonstrate the high efficiency of the proposed two-level hybrid stacking model for automatic crop classification using multispectral UAV orthomosaics. The obtained values of Accuracy ≈ 95%, LogLoss ≈ 0.156, and macro avg F1-score ≈ 0.95 outperform the results of single boosting algorithms (LightGBM, XGBoost, CatBoost), which ranged from 88 to 92%. This highlights the key advantage of ensembling and multi-level architecture when working with high-dimensional, noisy, and spectrally and spatially heterogeneous data. Analysis of metrics such as RMSE, MAE, and LogLoss revealed a significant reduction in errors when moving from the baseline models to the hybrid ensemble. For example, a decrease in MSE from ~35–38% for the baseline models to 15.6% for the hybrid model indicates significantly more confident and reliable class prediction. This is particularly important for agronomic monitoring, where classification inaccuracies can lead to incorrect crop planning, errors in crop condition assessment, and irrational resource use.
Another important outcome of this study is the demonstrated ability of the proposed model to capture intraclass spectral variability, which is often substantial in UAV-based agricultural imagery. As shown by the descriptive statistics of spectral bands and vegetation indices, differences between crops are not strictly linear, and variability within each crop class may be high due to varietal diversity, phenological stages, field management practices, and local environmental conditions. The hybrid architecture effectively models these complex relationships by combining gradient boosting, random forests, and a deep Attention-MLP at the first level. In contrast, an ExtraTreesClassifier at the second level aggregates feature representations and probability outputs into a robust final prediction.
Seasonal dynamics of vegetation indices further confirm their contribution to classification accuracy. Indices such as NDVI, SAVI, GNDVI, and MSR demonstrate distinct temporal patterns for the three examined crops, reflecting differences in their phenological development. For instance, the pronounced NDVI and SAVI peaks observed in soybeans during June–July correspond to their active growth phase, thereby increasing class separability and supporting more reliable crop diagnostics and forecasting. The spatial segmentation results illustrate the practical value of the proposed approach. As shown in Figure 7, Figure 8 and Figure 9, the model generates detailed crop classification maps with approximately 99% accuracy, maintains geospatial consistency, and enables agronomists to assess field structure rapidly. Despite minor edge artifacts and isolated misclassifications, the resulting maps remain sufficiently accurate for integration into geographic information systems used in crop management.
At the same time, it is essential to interpret the comparative performance of vegetation indices with caution. Although several of the manually calculated indices outperformed NDVI under the specific phenological and regional conditions of this study, these findings do not indicate any inherent limitation of NDVI. NDVI is one of the most established and widely validated vegetation indices in remote sensing, and its performance depends strongly on crop type, growth stage, sensor characteristics, and illumination conditions. In this dataset, lower NDVI separability is likely due to mid-season saturation effects and subtle inter-crop differences rather than deficiencies in the index itself. Therefore, the observed improvements should be considered task-specific and region-specific rather than universally generalizable. Taken together, these results demonstrate the potential of hybrid ensemble strategies combined with multispectral UAV data for developing reliable tools in precision agriculture. Such systems can enhance decision-making in crop rotation planning, optimize agronomic practices, and support continuous crop health monitoring.
Limitations and Future Work. Despite the strong performance and practical relevance of the proposed approach, several limitations of the present study should be acknowledged. First, the experimental analysis was conducted using data collected from a single agricultural region in Eastern Kazakhstan and within a single growing season. As a result, the observed classification performance reflects region-specific agroclimatic conditions, crop management practices, and phenological characteristics, which may limit direct generalization to other geographic areas or climatic zones.
Second, the dataset captures crop conditions at specific acquisition dates and does not explicitly model long-term temporal variability or interannual changes in vegetation dynamics. Variations in weather patterns, soil moisture, and crop rotation across years may affect spectral responses and classification behavior.
Future research will therefore focus on extending the proposed hybrid stacking framework to multi-year and multi-region datasets to improve its robustness and transferability. Incorporating time-series features derived from repeated UAV or satellite observations will enable explicit modeling of phenological trajectories and seasonal trends. In addition, integrating complementary data sources, such as meteorological variables, soil properties, and topographic attributes, is expected to enhance classification accuracy and generalization further. These extensions will support the development of scalable and reliable crop-mapping systems suitable for real-world precision agriculture applications across diverse agroecosystems.
5. Conclusions
In this paper, we proposed and implemented a two-level hybrid stacking model for automatic crop classification from multispectral orthomosaics acquired from uncrewed aerial vehicles. The approach combines the strengths of gradient boosting algorithms (LightGBM, XGBoost, CatBoost), tree ensembles (RandomForest, ExtraTrees), and a deep Attention-MLP, integrating their predictions via an ExtraTreesClassifier at the second level. This enabled the efficient use of both the original spectral channels and the calculated vegetation indices (NDVI, NDRE, GNDVI, SAVI, MSR, EVI, SIPI, MSAVI), along with their statistics (mean, std), forming a feature space of 28 parameters per patch. Experiments demonstrated the hybrid model’s significant superiority over baseline algorithms across all key metrics: Accuracy ≈ 95%, LogLoss ≈ 0.156, and macro avg F1-score ≈ 0.95. A substantial reduction in errors (MSE, RMSE, MAE) and an increase in the determination coefficient (R2 ≈ 82.6%) confirm the model’s ability to account for complex nonlinear relationships between features and reliably handle high-dimensional, spectrally and spatially heterogeneous data. Particular attention was paid to the analysis of seasonal patterns in vegetation indices. The resulting violin diagrams and trends demonstrated characteristic differences between crops and survey months, emphasizing the importance of phenological information for constructing more informative classification features. This opens the door to integrating temporal and phenological features into future versions of the models. Visualization of spatial segmentation of orthomosaics demonstrated high accuracy and consistency of the predicted crop field maps, making the approach practical for agronomists and precision agriculture specialists. The ability to obtain such maps with georeferencing provides a convenient tool for crop monitoring, crop rotation planning, and early detection of problem areas.
Overall, the approach shows great potential for expanding to other crops and regions. It can also fit into digital farming systems. Future research could examine adding time-series imagery, using more spectral bands, and integrating with weather and soil data. This will lead to better yield forecasting and improve farming practices.
Author Contributions
Conceptualization, A.I. and M.Y.; methodology, M.Y.; software, G.M. and G.A.; validation, M.Y., G.M. and J.T.; formal analysis, A.I. and G.A.; investigation, M.Y. and G.M.; resources, J.T.; data curation, M.Y.; writing—original draft preparation, M.Y.; writing—review and editing, A.I. and G.M.; visualization, G.M. and G.A.; supervision, J.T.; project administration, M.Y.; funding acquisition, M.Y. All authors have read and agreed to the published version of the manuscript.
Funding
This research was funded by the Science Committee of the Ministry of Education and Science of the Republic of Kazakhstan (Grant No. AP25793889—Development of a System for Identifying Agricultural Crop Diseases and Pests Based on Artificial Intelligence).
Data Availability Statement
The multispectral UAV dataset used in this study is openly available on Zenodo under record number 7748792 (https://zenodo.org/records/7748792 (accessed on 5 November 2025)). No new data were created in this study. All data supporting the findings of this work are fully accessible through the referenced public repository.
Acknowledgments
The authors would like to express their sincere gratitude to Akmaral Kassymova for her valuable advice and constructive comments that significantly improved the quality of this work.
Conflicts of Interest
The authors declare no conflicts of interest.
Abbreviations
The following abbreviations are used in this manuscript:
| UAV | Unmanned Aerial Vehicle |
| NDVI | Normalized Difference Vegetation Index |
| SAVI | Soil Adjusted Vegetation Index |
| MSAVI | Modified Soil Adjusted Vegetation Index |
| EVI | Enhanced Vegetation Index |
| MSR | Modified Simple Ratio |
| GNDVI | Green Normalized Difference Vegetation Index |
| NDRE | Normalized Difference Red Edge Index |
| NIR | Near-Infrared |
| MLP | Multilayer Perceptron |
| OOF | Out-Of-Fold (cross-validation prediction mechanism) |
References
- Shu, M.; Fei, S.; Zhang, B.; Yang, X.; Guo, Y.; Li, B.; Ma, Y. Application of UAV Multisensor Data and Ensemble Approach for High-Throughput Estimation of Maize Phenotyping Traits. Plant Phenomics 2022, 2022, 9802585. [Google Scholar] [CrossRef]
- Huang, D.; Hong, Y.; Li, J. Integrating UAV-Based Remote Sensing and Machine Learning to Monitor Rice Growth in Large-Scale Fields. Field Crop 2025, 8, 204–212. [Google Scholar]
- Pádua, L.; Marques, P.; Martins, L.; Sousa, A.; Peres, E.; Sousa, J.J. Monitoring of Chestnut Trees Using Machine Learning Techniques Applied to UAV-Based Multispectral Data. Remote Sens. 2020, 12, 3032. [Google Scholar] [CrossRef]
- Tan, J.; Ding, J.; Li, J.; Han, L.; Cui, K.; Li, Y.; Zhang, Z. Advanced Dynamic Monitoring and Precision Analysis of Soil Salinity in Cotton Fields Using CNN-Attention and UAV Multispectral Imaging Integration. Land Degrad. Dev. 2025, 36, 5578. [Google Scholar] [CrossRef]
- Deng, H.; Zhang, W.; Zheng, X.; Zhang, H. Crop Classification Combining Object-Oriented Method and Random Forest Model Using Unmanned Aerial Vehicle (UAV) Multispectral Image. Agriculture 2024, 14, 548. [Google Scholar] [CrossRef]
- Zhang, Y.; Fu, B.; Sun, X.; Yao, H.; Zhang, S.; Wu, Y.; Deng, T. Effects of Multi-Growth-Periods UAV Images on Classifying Karst Wetland Vegetation Communities Using Object-Based Optimization Stacking Algorithm. Remote Sens. 2023, 15, 4003. [Google Scholar] [CrossRef]
- Miller, T.; Mikiciuk, G.; Durlik, I.; Mikiciuk, M.; Łobodzińska, A.; Śnieg, M. The IoT and AI in Agriculture: The Time Is Now—A Systematic Review of Smart Sensing Technologies. Sensors 2025, 25, 3583. [Google Scholar] [CrossRef] [PubMed]
- Chang, B.; Li, F.; Hu, Y.; Yin, H.; Feng, Z.; Zhao, L. Application of UAV Remote Sensing for Vegetation Identification: A Review and Meta-Analysis. Front. Plant Sci. 2025, 16, 1452053. [Google Scholar] [CrossRef]
- Wang, J.; Wang, Y.; Li, G.; Qi, Z. Integration of Remote Sensing and Machine Learning for Precision Agriculture: A Comprehensive Perspective on Applications. Agronomy 2024, 14, 1975. [Google Scholar] [CrossRef]
- Li, Z.; Zhou, X.; Cheng, Q.; Fei, S.; Chen, Z. A Machine-Learning Model Based on the Fusion of Spectral and Textural Features from UAV Multi-Sensors to Analyse the Total Nitrogen Content in Winter Wheat. Remote Sens. 2023, 15, 2152. [Google Scholar] [CrossRef]
- Yang, H.; Hu, Y.; Zheng, Z.; Qiao, Y.; Zhang, K.; Guo, T.; Chen, J. Estimation of Potato Chlorophyll Content from UAV Multispectral Images with Stacking Ensemble Algorithm. Agronomy 2022, 12, 2318. [Google Scholar] [CrossRef]
- Dimyati, M.; Supriatna, S.; Nagasawa, R.; Pamungkas, F.D.; Pramayuda, R. A Comparison of Several UAV-Based Multispectral Imageries in Monitoring Rice Paddy (A Case Study in Paddy Fields in Tottori Prefecture, Japan). ISPRS Int. J. Geo-Inf. 2023, 12, 36. [Google Scholar] [CrossRef]
- de Santana Correia, A.; Colombini, E.L. Attention, Please! A Survey of Neural Attention Models in Deep Learning. Artif. Intell. Rev. 2022, 55, 6037–6124. [Google Scholar] [CrossRef]
- Luo, C.; Li, H.; Zhang, J.; Wang, Y. OBViT: A High-Resolution Remote Sensing Crop Classification Model Combining OBIA and Vision Transformer. In Proceedings of the 2023 11th International Conference on Agro-Geoinformatics (Agro-Geoinformatics), Wuhan, China, 25–28 July 2023; pp. 1–6. [Google Scholar] [CrossRef]
- Yang, S.; Li, L.; Fei, S.; Yang, M.; Tao, Z.; Meng, Y.; Xiao, Y. Wheat Yield Prediction Using Machine Learning Method Based on UAV Remote Sensing Data. Drones 2024, 8, 284. [Google Scholar] [CrossRef]
- Acosta, M.; Visconti, F.; Quiñones, A.; Blasco, J.; de Paz, J.M. Estimation of Macro and Micronutrients in Persimmon (Diospyros kaki L.) cv. ‘Rojo Brillante’ Leaves through VIS-NIR Reflectance Spectroscopy. Agronomy 2023, 13, 1105. [Google Scholar] [CrossRef]
- Zhai, W.; Li, C.; Cheng, Q.; Ding, F.; Chen, Z. Exploring Multisource Feature Fusion and Stacking Ensemble Learning for Accurate Estimation of Maize Chlorophyll Content Using Unmanned Aerial Vehicle Remote Sensing. Remote Sens. 2023, 15, 3454. [Google Scholar] [CrossRef]
- Qiao, L.; Tang, W.; Gao, D.; Zhao, R.; An, L.; Li, M.; Song, D. UAV-Based Chlorophyll Content Estimation by Evaluating Vegetation Index Responses under Different Crop Coverages. Comput. Electron. Agric. 2022, 196, 106775. [Google Scholar] [CrossRef]
- Tussupov, J.; Abdikerimova, G.; Ismailova, A.; Kassymova, A.; Beldeubayeva, Z.; Aitimov, M.; Makulov, K. Analyzing Disease and Pest Dynamics in Steppe Crop Using Structured Data. IEEE Access 2024, 12, 71323–71330. [Google Scholar] [CrossRef]
- Tussupov, J.; Yessenova, M.; Abdikerimova, G.; Aimbetov, A.; Baktybekov, K.; Murzabekova, G.; Aitimova, U. Analysis of Formal Concepts for Verification of Pests and Diseases of Crops Using Machine Learning Methods. IEEE Access 2024, 12, 19902–19910. [Google Scholar] [CrossRef]
- Abdikerimova, G.; Yessenova, M.; Yerzhanova, A.; Manbetova, Z.; Murzabekova, G.; Kaibassova, D.; Bekbayeva, R.; Aldashova, M. Applying Textural Law’s Masks to Images Using Machine Learning. Int. J. Electr. Comput. Eng. 2023, 13, 5569–5575. [Google Scholar] [CrossRef]
- Yang, K.; Gong, Y.; Fang, S.; Duan, B.; Yuan, N.; Peng, Y.; Wu, X.; Zhu, R. Combining Spectral and Texture Features of UAV Images Improves Estimation of Rice LAI across Growth Stages. Remote Sens. 2021, 13, 3001. [Google Scholar] [CrossRef]
- Lee, C.H.; Chen, K.Y.; Liu, L.D. Effect of Texture Feature Distribution on Agriculture Field Type Classification with Multitemporal UAV RGB Images. Remote Sens. 2024, 16, 1221. [Google Scholar] [CrossRef]
- Zheng, Z.; Yuan, J.; Yao, W.; Yao, H.; Liu, Q.; Guo, L. Crop Classification from Drone Imagery Based on Lightweight Semantic Segmentation Methods. Remote Sens. 2024, 16, 4099. [Google Scholar] [CrossRef]
- Guo, X.; Feng, Q.; Guo, F. CMTNet: A Hybrid CNN–Transformer Network for UAV-Based Hyperspectral Crop Classification in Precision Agriculture. Sci. Rep. 2025, 15, 12383. [Google Scholar] [CrossRef] [PubMed]
Disclaimer/Publisher’s Note: The statements, opinions and data contained in all publications are solely those of the individual author(s) and contributor(s) and not of MDPI and/or the editor(s). MDPI and/or the editor(s) disclaim responsibility for any injury to people or property resulting from any ideas, methods, instructions or products referred to in the content. |
© 2025 by the authors. Published by MDPI on behalf of the International Institute of Knowledge Innovation and Invention. Licensee MDPI, Basel, Switzerland. This article is an open access article distributed under the terms and conditions of the Creative Commons Attribution (CC BY) license.