Abstract
The evaporation of a blood sessile droplet on a solid substrate generates distinctive desiccation patterns. These patterns have been identified as a potential tool for interpreting the pathological information of donors, since their morphological features encode pathological indicators linked to blood-related disorders. We collected two representative sets of blood samples from anonymous patients: healthy donors (normal haematocrit) and anaemia patients (low haematocrit). Our real-time observations of the morphological evolution during desiccation reveal distinct differences in pattern development. The macroscopic analysis indicates that blood sessile droplets from anaemia patients with abnormally low haematocrit levels experience divergent morphological trajectories, forming cracking patterns distinguishable from those of healthy donors. Our microscopic comparisons show that the blood desiccation patterns of healthy donors exhibit a longer coronal region and greater deposit coverage in the central region than those of anaemia patients. Our further analysis correlates these morphological variations to the effects of the haematocrit level of blood samples on material redistribution. This work proposes a facile strategy for health diagnostics through blood desiccation pattern analysis, highlighting its potential as a foundation for diagnostic platforms.
1. Introduction
The intricate patterns formed during the desiccation of blood sessile droplets on smooth, solid substrates have garnered growing scientific interest [1,2,3,4]. They have demonstrated physical correlations with biological composition variations induced by specific blood-related disorders (e.g., hyperlipidaemia, anaemia, and neonatal jaundice) [5,6,7,8,9,10,11]. Therefore, the interpretation of the pathological information conveyed in blood desiccation patterns has been suggested as a promising cost-effective methodology for point-of-care pathological assessment [12].
Current experimental approaches to the desiccation of blood sessile droplets typically employ either blood plasma or whole blood [9,13,14]. Among them, the whole blood desiccation proves particularly valuable for studying cellular pathologies, as variations in blood cellular components, e.g., red blood cells (RBCs), drive the formation of distinct morphological features characterised by diagnostic cracking patterns in desiccated deposits [15]. During blood sessile droplet evaporation, cellular components, predominantly RBCs, undergo redistribution via the “coffee ring” effect, accumulating at the droplet periphery while depleting from the central region [13]. As desiccation progresses, the heterogeneous local stresses develop spatiotemporally within the blood sessile droplet. After desiccation, three structurally distinct cracking regions emerge: a fine peripheral region exhibiting micron-scale orthoradial cracks, a coronal region with ordered radial cracks, and a central region with disordered cracks [5,6,7]. The RBC-induced variations in both the cellular redistribution and the development of the local stresses can be reflected by the locally morphological changes in the coronal region. This renders the coronal region a critical diagnostic marker for RBC-related pathologies, particularly those involving haematocrit-level abnormalities.
To interpret the pathological information encoded within blood desiccation patterns, it is necessary to control the critical physical parameters (non-pathological variables). These include the initial contact angle () of the blood sessile droplets on the supporting surface, and the temperature and relative humidity (RH) during desiccation [16,17,18]. These physical factors influence cracking morphologies by governing both the droplet’s initial geometry and its evaporation rate profile. We addressed this challenge by developing a standardised desiccation substrate with the controlled wettability of the sessile droplet, thereby isolating physical variables from pathological factors and ensuring the pattern’s reproducibility [19]. While significant progress has been made in correlating blood pattern morphologies with pathological indicators, knowledge gaps persist regarding the underlying mechanisms, particularly the role of cellular concentration. This mechanistic uncertainty constrains the diagnostic utility of blood desiccation analysis [20].
In this work, we aim to understand the effect of the cellular concentration on blood desiccation patterns to advance their diagnostic potential. Blood samples were obtained from two anonymised groups: five healthy donors (haematocrit: 0.39–0.45) and five anaemia patients (haematocrit: 0.22–0.27). Using real-time microscopic observations, we revealed that haematocrit-driven changes in material redistribution govern the pattern formation. We developed a semi-quantitative relationship between haematocrit levels and pattern features, demonstrating the viability of desiccation analysis as a diagnostic tool for RBC-related disorders, particularly anaemia.
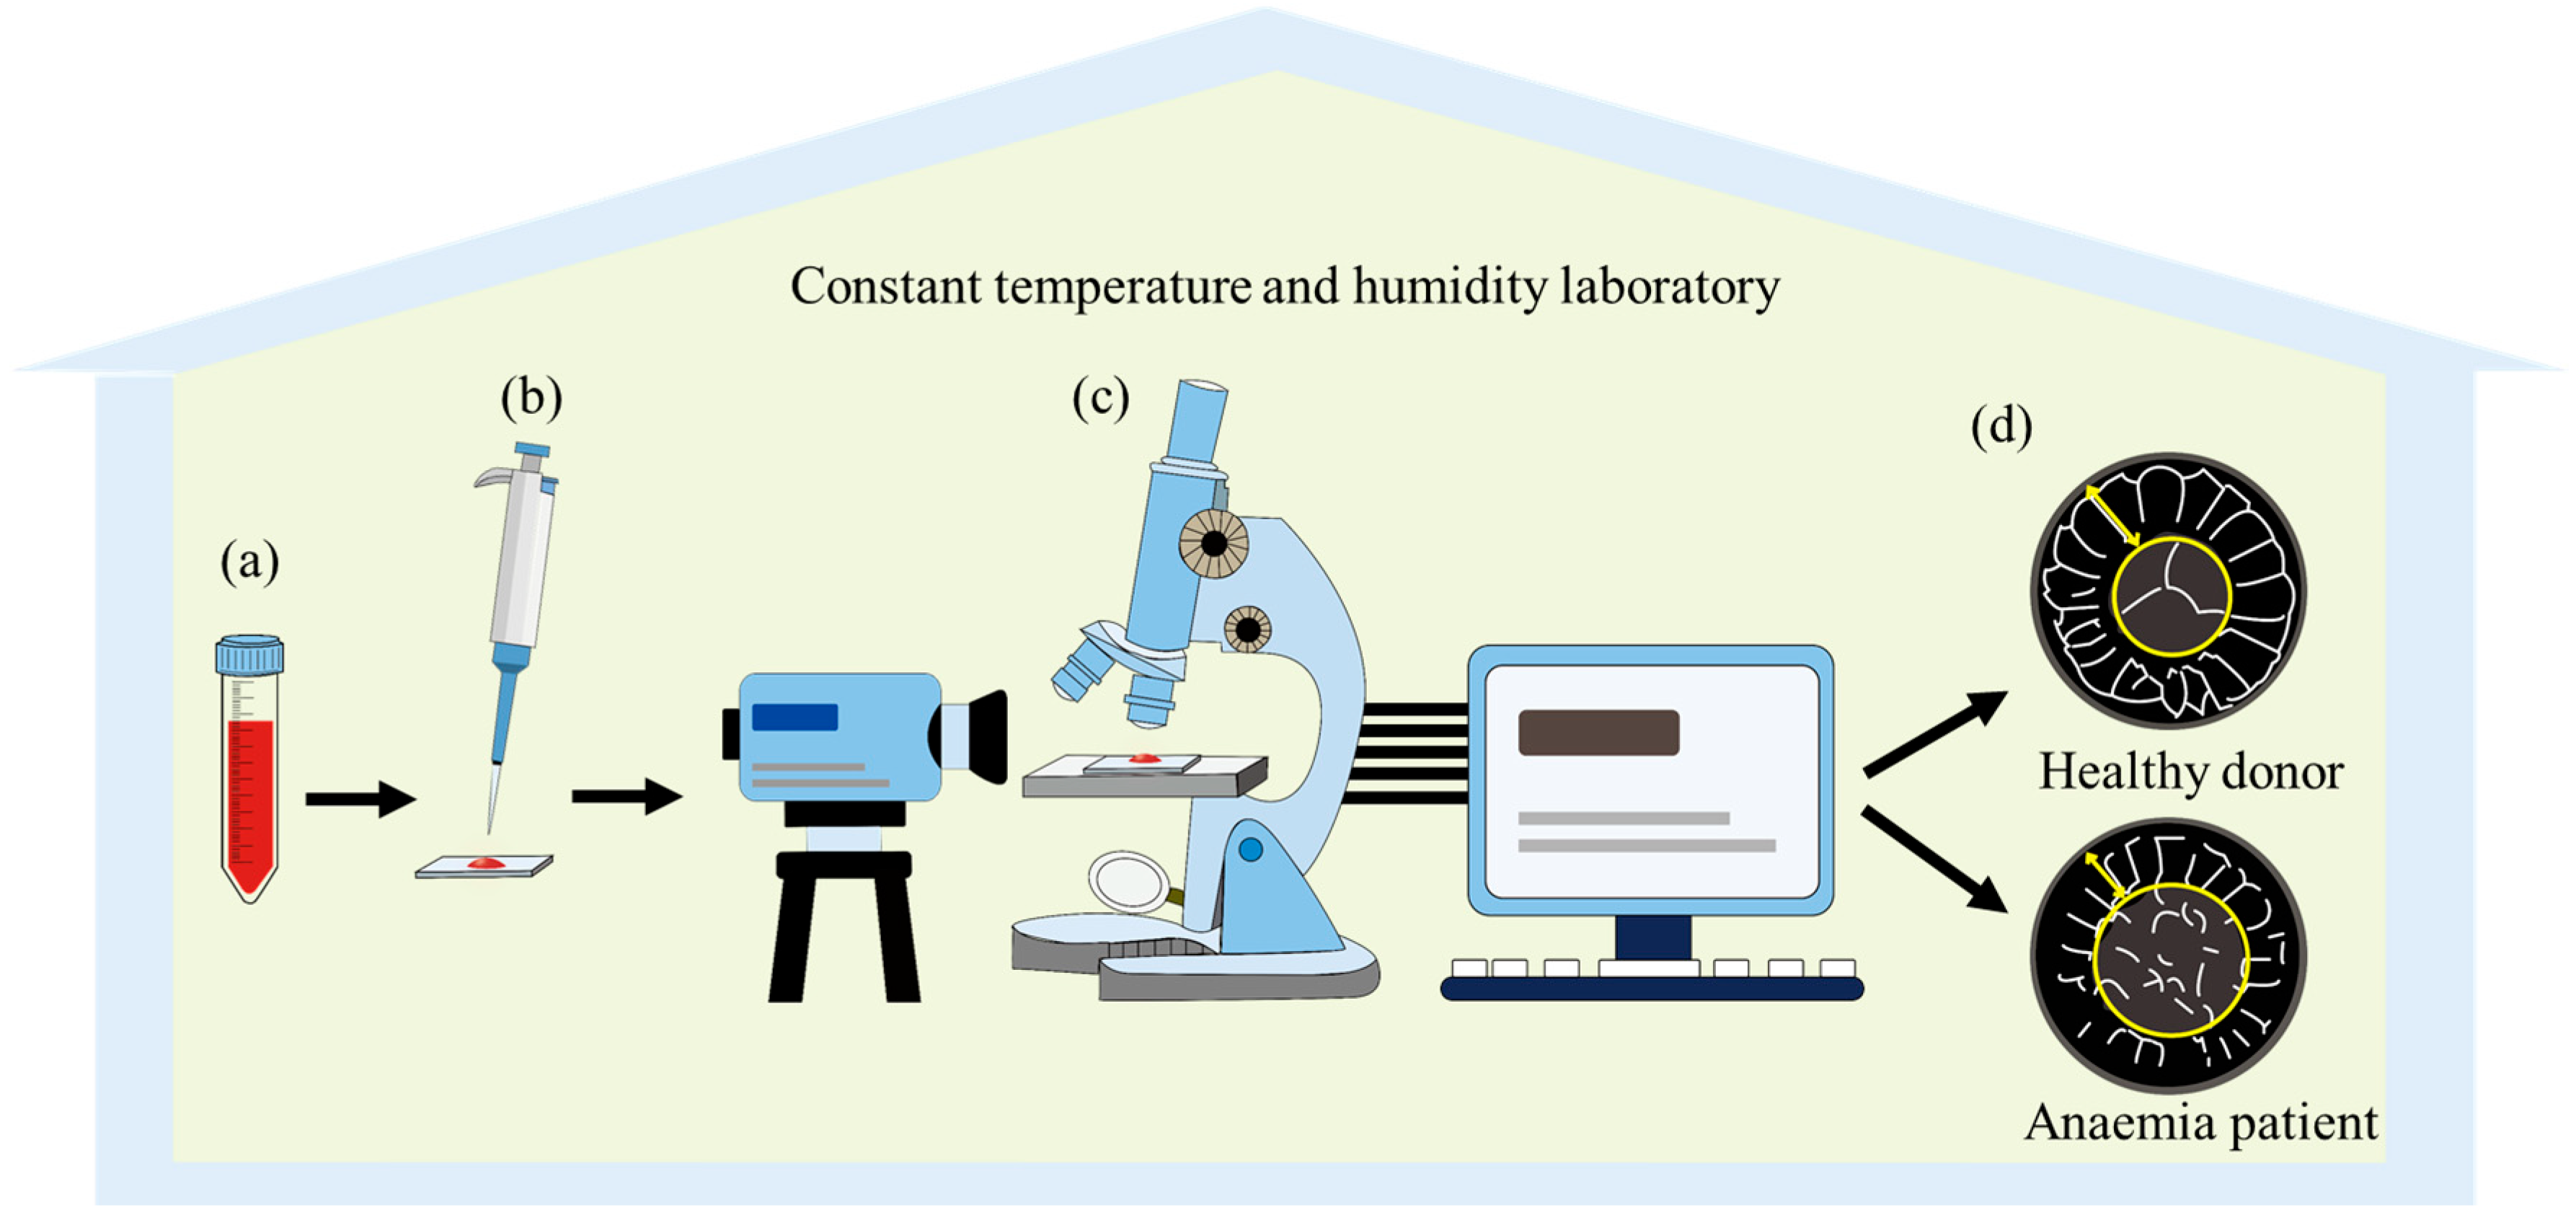
2. Materials and Methods
Blood samples were collected from two anonymised groups: five healthy adults with haematocrit levels of 0.39 and 0.45, and five anaemia patients with low haematocrit levels of 0.22 and 0.27. The haematocrit level of blood samples was determined by the laboratory and clinical haematologist. Blood samples were stored in Vacutainer® tubes (Bection Dickinson, Franklin Lakes, NJ, USA) containing heparin, citrate, and ethylene diamine tetra acetic acid (EDTA), which were used within 3 days of collection.
Glass microscope slides (Thermo Scientific, Waltham, MA, USA) were cleaned with the laboratory detergent solution, followed by exhaustive rinsing with the ethanol and Millipore water (18 MΩ∙cm), respectively. After thermal drying, the glass microscope slides were treated by using a K1050X Plasma Asher (Emitech, Lewes, UK) to remove the residue contaminations on their surfaces. Subsequently, these plasma-treated glass microscope slides were thoroughly rinsed using the ethanol and Millipore water, respectively.
The experimental procedures for blood sessile droplet evaporation are shown in Figure 1. A sessile drop of blood sample (~12 µL) was gently placed onto the glass microscope slide and desiccated in a controlled environment (22.5 ± 0.5 °C of the temperature and 45.0 ± 3.0% of the relative humidity). To obtain the repeatable data, the desiccation experiment on each sample was repeated at least five times. An OCAH-230 contact angle apparatus (Dataphysics, Filderstadt, Germany) was used to determine the initial apparent contact angle () of the blood sessile drops on the glass surface. An SMZ-168 optical microscope (Motic, Xiamen, China), installed with a high-resolution camera, was used to observe the morphological evolution of the blood sessile drop during desiccation. The colour micrographs of blood desiccation patterns captured experimentally were converted into black-and-white images using an ImageJ software (Version 1.54h) package.
Figure 1.
Schematic diagram of blood sessile droplet evaporation processes: (a) extraction of blood samples from patients with different health statuses; (b) deposition of a blood droplet onto an ultra-clean glass substrate; (c) real-time monitoring of pattern morphology evolution using an optical microscope coupled with a contact angle measurement system; (d) comparative analysis of morphological characteristics between blood samples from healthy donors and anaemia patients. All experimental procedures were performed under strictly controlled ambient conditions within a constant temperature and humidity laboratory.
3. Results and Discussion
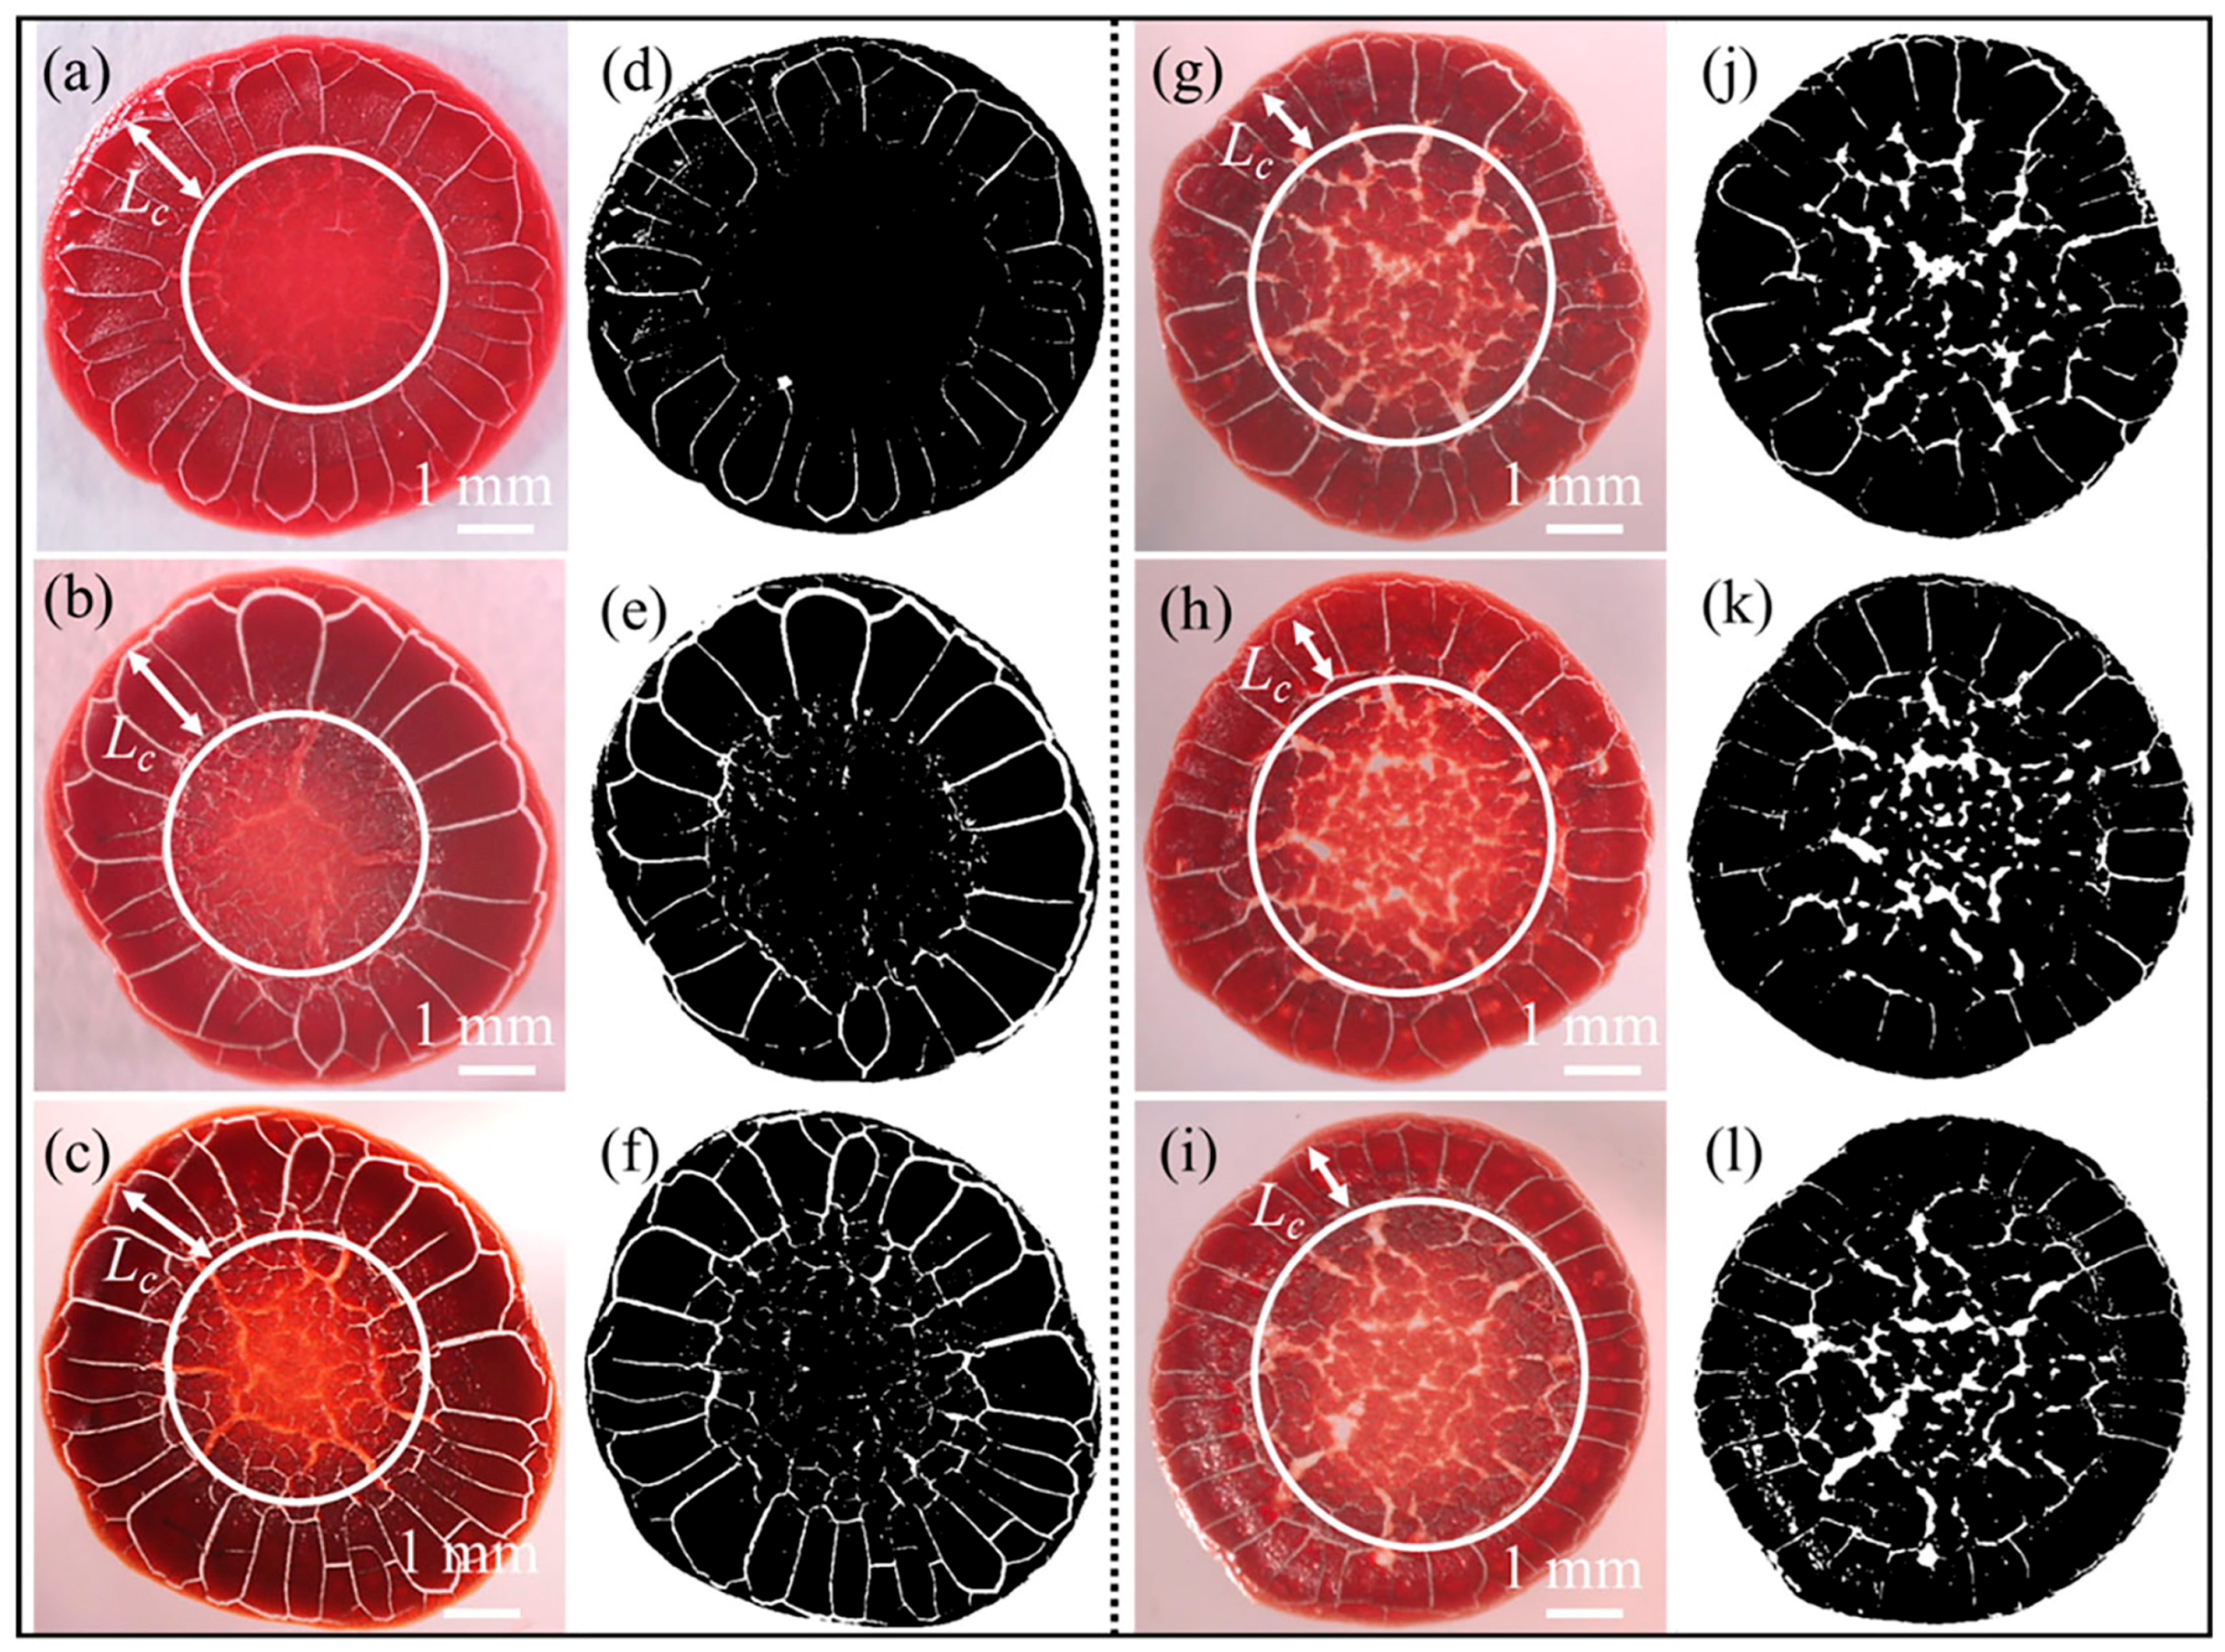
3.1. Potential Diagnostic Observations
The morphologies of the desiccation patterns of blood samples from healthy donors and those from patients are shown in Figure 2, respectively. The colourful images of these blood desiccation patterns were captured experimentally (Figure 2a–c,g–i), and have been converted to black-and-white images (Figure 2d–f,j,k) to highlight their morphological differences. All blood desiccation patterns exhibit broadly similar macroscopic cracking structures, comprising three distinct fracture regions. They are, from outer to inner, orthoradial micro-cracks in the peripheral region, ordered radial cracks in the coronal region, and disordered cracks in the central region. Notably, however, regional morphological details demonstrate significant sensitivity to sample haematocrit levels, as illustrated in Figure 2.
Figure 2.
(a–c) Desiccation patterns of blood samples from different healthy adult donors with normal haematocrit levels (0.39–0.45). (d–f) Conversion of colourful images in (a–c) to black-and-white images, respectively. (g–i) Desiccation patterns of blood samples from different adult patients with low haematocrit levels (0.22–0.27). (j–l) Conversion of the colour images in (g–i) to black-and-white images, respectively; white arrows indicate the length of the coronal region (); the area inside the white circle is defined as the central region of the desiccated blood sessile droplet.
To investigate morphological distinctions in blood desiccation patterns, we quantified the coronal region by calculating its normalised length (), derived from the ratio of the coronal region length () to the contact radius () of blood sessile droplets on glass substrates. Our quantitative analysis revealed that healthy donors with physiological haematocrit levels exhibited significantly larger normalised coronal region length () compared to anaemic patients displaying pathologically reduced haematocrit values (), as shown in Figure 3a. The appears to be positively correlated to the haematocrit levels of blood samples.
Figure 3.
(a) The normalised length of the coronal region () in desiccated blood sessile drops from healthy donors with normal haematocrit levels (green frame) and patients (red frame) with low haematocrit levels, respectively. Different symbols denote distinct experimental batches of repeated blood sample evaporation trials. (b) The initial apparent contact angle () of blood sessile drops in (a). (c) The coverage area of the desiccated blood deposits (%) in the central region; the insets show black-and-white images of the desiccation patterns in the central region. (d) The number of regularly ordered radial cracks in the coronal region.
We then analysed the initial drop profile by determining the initial apparent contact angle () of blood sessile droplets, as shown in Figure 3b. Interestingly, the of blood drops from healthy donors and patients has been determined at 20 ± 3°and 19 ± 3°, respectively. This near-identical contact angle indicates that the haematocrit levels exert negligible influence on both of the wettability of blood sessile droplets on glass substrates and their initial drop profiles.
We have further found the distinct morphological variations in desiccation patterns linked to haematocrit levels. Blood samples with pathologically low haematocrit exhibited reduced central deposit coverage (Figure 3c) alongside the increased prevalence of large-scale cracks, as evidenced by the expanded white regions in the monochrome insets. However, the number of the ordered radial cracks in the coronal region showed no statistically significant correlation with haematocrit values (Figure 3d). This observation suggests that stress generation and distribution mechanisms in the coronal region remain consistent across samples, potentially operating through similar mechanical pathways during desiccation.
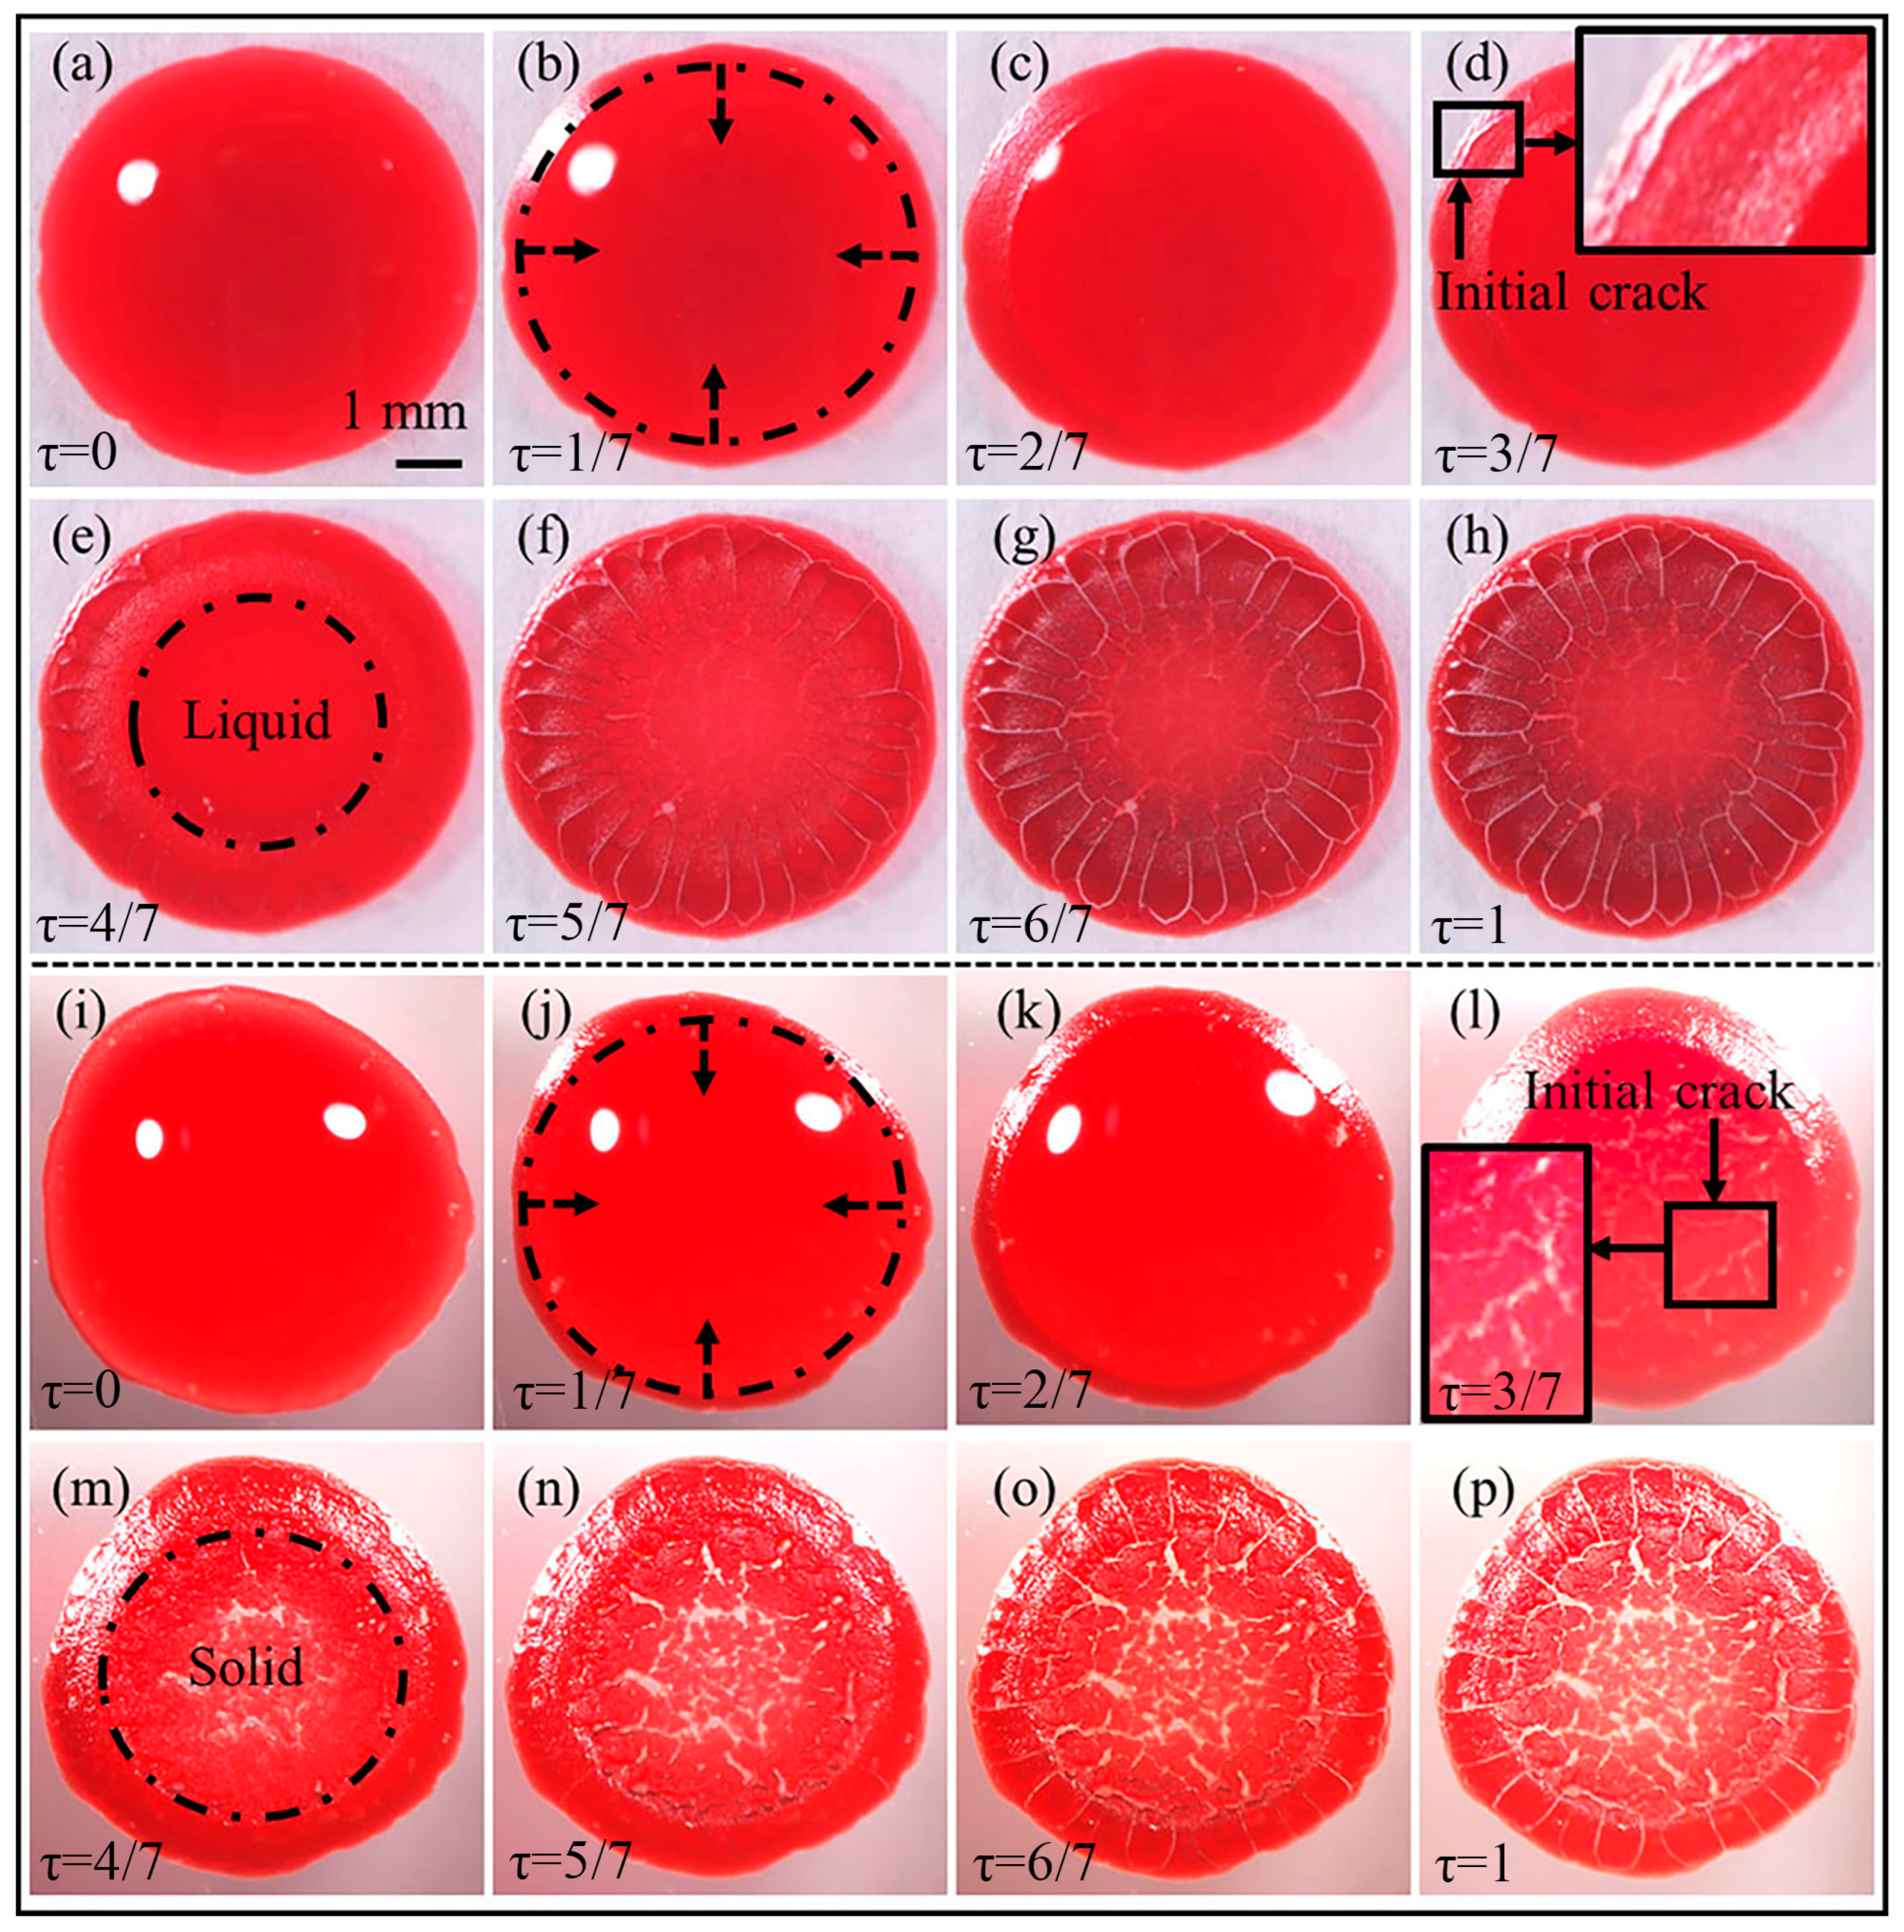
3.2. Differences in Morphological Evolution During Desiccation
The morphological differences observed in blood sessile droplets from healthy donors and anaemic patients (as shown in Figure 2 and Figure 3) imply the possibility of developing the blood desiccation patterns as a diagnostic tool. To better understand the mechanisms of the morphological differences, the morphological evolution of these blood sessile drops versus the desiccation time has been investigated. Figure 4 shows two representative cases of the real-time desiccation of blood sessile drops collected from a healthy adult with a normal haematocrit level of 0.43 (Figure 4a–h) and an adult patient with a low haematocrit level of 0.26 (Figure 4i–p).
Figure 4.
Morphological evolution of the desiccation patterns of blood samples collected from (a–h) a healthy adult donor with a normal haematocrit level of 0.43 and (i–p) an adult patient with a low haematocrit level of 0.26, respectively; the normalised evaporation time (), indicated in the left bottom of each image, was derived by scaling the instantaneous evaporation duration () against the total time required for complete desiccation (), i.e., ; the dashed circular line (black) represents the front line of the gelation process, which propagates from the drop edge to the drop centre (indicated by the dashed arrows); the insets in (d,l) show the locations of the initial cracks.
In the blood sample from a healthy adult donor, the small-sized orthoradial cracks initiate in the peripheral region of the blood sessile droplet (Figure 4d), driven by radially oriented stress gradients arising from the heterogeneous solidification of blood deposits [9]. As the gelation progresses toward the drop centre, the large-sized cracks are activated in the outer boundary of the coronal region (Figure 4e), subsequently propagating radially inward (Figure 4f) in response to orthoradial stress dominance. This mechanical competition stems from orthoradial shrinkage of desiccating blood components opposing their adhesion to the substrate. When the desiccation progresses to the last stage, the disordered cracks rapidly form in the central region (Figure 4f–h). The formation of the disordered cracks is attributed to the response to the lack of the local dominant stress in any direction, which is quite similar to the random cracks in mud. These observations align with the mechanistic frameworks detailed in our prior investigations [13,19].
However, in the blood sample from a patient with an abnormally low haematocrit level, the cracking patterns develop in a different path. The cracks initiate in the central region (Figure 4l), and there is in a significant depletion of RBCs. As the desiccation progresses, these cracks propagate to the large-sized cracks, and most of them will reach several hundred micrometres (white area in Figure 4m). On the other hand, the central region becomes solidified (as indicated in Figure 4m) before the formation of cracks in other regions. After the solidification of the central region, the orthoradial and radial cracks begin to form and propagate in the peripheral region and coronal region, respectively (Figure 4n,o). The directions of these cracks are quite similar to those of blood samples from healthy donors, implying the similar distribution of local dominant stress. Furthermore, the radial cracks in the coronal region are still widening after the completion of the disordered cracking in the central region, as shown in Figure 4n–p.
3.3. Mechanistic Interpretation of Pattern Differences
Below, we discuss the possible mechanisms of the differences in the pattern morphologies of these blood samples. During the evaporation of a blood sessile droplet on a glass substrate with an initial apparent contact angle () of ~20° (Figure 2b), the persistent contact line pinning maintains the constant contact radius evaporation regime; meanwhile, the enhanced local evaporation rate at the contact line induces the “coffee ring” effect, driving the transport of cellular components (predominantly RBCs) from the centre to the drop edge. This phenomenon, well-documented in previous studies [6,15], aligns with our previous findings demonstrating that the blood drop profile evolution was defined by , suggesting that the “coffee ring” effect in blood sessile droplets is governed by [13,19]. Accordingly, blood samples with equivalent values, regardless of haematocrit levels, exhibit a comparable “coffee ring” effect. However, the blood viscosity () demonstrates direct proportionality to the hematocrit level (), implying that the reduced haematocrit level facilitates RBC transport through the hydrodynamic capillary flow [21].
On the other hand, the volumetric capacity of the wedge-shaped space of the wetting front () of the blood sessile droplet can be estimated by using the geometric equation for a spherical cap and written as follows:
where is the total droplet volume, is the height of the drop apex, and is the local droplet height at the radial coordinate , in which . Equation (1) can, therefore, be conceptually expressed as follows:
Estimation by Equations (1) and (2) shows that the wedge-shaped space of the wetting front of the blood sessile droplets in different haematocrit levels have the similar volumetric capacities () to house the incoming RBCs driven by the “coffee ring” effect, as illustrated in Figure 4.
In a blood sessile droplets from patients, the low contents of RBCs could be insufficient to maintain the local drop profile across the inner side of the coronal region (the location has been indicated by the dashed circular line in Figure 4m). A reduced normalised coronal region length () emerges in desiccated blood sessile droplets. Meanwhile, the significant depletion of RBCs in the central region results in the plasma phase dominance, as illustrated in Figure 5. The gelled plasma phase demonstrates markedly lower fracture toughness compared to the RBC-rich gels, enabling local stresses to more readily exceed its critical failure threshold [9]. This mechanical disparity initiates preferential crack nucleation within the plasma matrix, with subsequent fracture propagation exhibiting RBC-avoidance behaviour [9]. These mechanisms collectively predict enhanced central fracturing in low-haematocrit samples. As desiccation progresses, the droplet shrinkage forces the local blood deposit to slide on the glass surface. This interfacial motion facilitates local stress dissipation, concurrently promoting crack widening. The widening of the cracks would, in turn, enhance the local evaporation rate, leading the local area to desiccate more rapidly (Figure 4m).
Figure 5.
Schematics of the desiccation process of blood sessile droplets from (a) healthy donors with normal haematocrit levels and (b) patients with low haematocrit levels; the blue arrows indicate that the RBCs transport from the drop centre to the drop contact line, driven by the “coffee ring” effect.
In the coronal region, the gelation front propagates gradually from the outer side to the inner side in a concentric circle, as shown in Figure 4. The asymmetric elasticity in the radial direction on the concentric circle (caused by the gradient of the solidification degree) could slow down the development of the local internal stress inside the concentric circle; by contrast, the symmetric elasticity in the orthoradial direction (tangent direction) on the concentric circle dominates the local stress distribution (in the orthoradial direction). According to the angular stress distribution, the angular () dependence of the stress () with respect to the direction of far-field stress () can be written as follows:
where is stress distribution around a circular flaw, which will reach the maximum of 3 at . This means that the crack propagates in perpendicular to the local dominant stress [9,22]. For the coronal region of desiccation blood droplet, once the local internal stress reaches the locally critical strength, the cracks will form in the radial direction, which is in perpendicular to the local stress distribution [22]. The formation and distribution of the radial cracks in the coronal region are, therefore, strongly dependent on the propagation of the gelation process, which has been found to be similar in the blood samples in different haematocrit levels (Figure 4). As a result, similar radial cracks will form in the coronal regions of these blood sessile droplets [9].
We note that the proposed mechanistic framework is grounded solely in interfacial science, offering a physical rationale for observed morphological distinctions. However, the inherent complexity of blood desiccation arises from the spatiotemporal coupling of multiple physical and biochemical processes during evaporation. This explanation of diagnostic pattern analysis remains in a nascent stage of development. Future works will prioritise the differentiation between physical dynamics and biochemical themes within desiccation patterns across the haematological conditions of donors to advance their clinical applicability.
4. Conclusions
In this work, the desiccation patterns of blood sessile droplets on glass substrates reveal the sample haematocrit levels. For blood sessile droplets with an abnormally low haematocrit, the consolidation and crack initiation commence in the central region before propagating peripherally. Conversely, in blood samples with a physiological haematocrit, these processes originate at the periphery and progress towards the central region. Notably, the coronal region length and central deposit coverage exhibit positive correlations with haematocrit values. These findings highlight the possibility of using blood desiccation patterns as a diagnostic tool for haematological health monitoring.
Author Contributions
Conceptualization, H.H.; methodology, L.X.; software, L.X. and Y.L.; validation, H.H., Y.L. and M.Z.; formal analysis, H.H.; investigation, H.H. and L.X.; resources, Y.L. and M.Z.; data curation, L.X. and J.M.; writing—original draft preparation, H.H.; writing—review and editing, H.H., L.X. and R.C.; visualisation, J.M.; supervision, J.M.; project administration, R.C.; funding acquisition, H.H. and R.C. All authors have read and agreed to the published version of the manuscript.
Funding
This research was funded by Shanghai Pujiang Program (No. 23PJ1401800), the Science Foundation of Zhejiang Sci-Tech University (ZSTU) (No. 22192136-Y), and Scientific Research Fund of Zhejiang Provincial Education Department (No. Y202354119).
Institutional Review Board Statement
All experiments were performed in compliance with the protocols approved by the Ethics Committee of East China University of Science and Technology (ECUST-2023-046) on 15 March 2023.
Data Availability Statement
The data presented are available on request from the corresponding author.
Conflicts of Interest
The authors declare no conflicts of interest.
References
- Wang, Z.; Orejon, D.; Takata, Y.; Sefiane, K. Wetting and evaporation of multicomponent droplets. Phys. Rep. 2022, 960, 1–37. [Google Scholar] [CrossRef]
- Brutin, D.; Starov, V. Recent advances in droplet wetting and evaporation. Chem. Soc. Rev. 2018, 47, 558–585. [Google Scholar] [CrossRef]
- Zang, D.; Tarafdar, S.; Tarasevich, Y.Y.; Dutta, C.M.; Dutta, T. Evaporation of a droplet: From physics to applications. Phys. Rep. 2019, 804, 1–56. [Google Scholar] [CrossRef]
- Kumar, B.; Chatterjee, S.; Agrawal, A.; Bhardwaj, R. Asymmetric deposits and crack formation during desiccation of a blood droplet on an inclined surface. Langmuir 2025, 41, 4c03767. [Google Scholar] [CrossRef]
- Sobac, B.; Brutin, D. Structural and evaporative evolutions in desiccating sessile drops of blood. Phys. Rev. E 2011, 84, 011603. [Google Scholar] [CrossRef] [PubMed]
- Sobac, B.; Brutin, D. Desiccation of a sessile drop of blood: Cracks, folds formation and delamination. Colloids Surf. A Physicochem. Eng. Asp. 2014, 448, 34–44. [Google Scholar] [CrossRef]
- Chen, R.; Zhang, L.; Zang, D.; Shen, W. Blood drop patterns: Formation and applications. Adv. Colloid Interface Sci. 2016, 231, 1–14. [Google Scholar] [CrossRef]
- Chen, R.; Zhang, L.; Zang, D.; Shen, W. Wetting and drying of colloidal droplets: Physics and pattern formation. Adv Colloid Sci. 2016, 1, 3–25. [Google Scholar] [CrossRef]
- Chen, R.; Zhang, L.; He, H.; Shen, W. Desiccation patterns of plasma sessile drops. ACS Sens. 2019, 4, 1701–1709. [Google Scholar] [CrossRef]
- Brutin, D.; Sobac, B.; Loquet, B.; Sampol, J. Pattern formation in drying drops of blood. J. Fluid Mech. 2011, 667, 85–95. [Google Scholar] [CrossRef]
- Bahmani, L.; Neysari, M.; Maleki, M. The study of drying and pattern formation of whole human blood drops and the effect of thalassaemia and neonatal jaundice on the patterns. Colloids Surf. A Physicochem. Eng. Asp. 2017, 513, 66–75. [Google Scholar] [CrossRef]
- Mukhopadhyay, M.; Ray, R.; Ayushman, M.; Sood, P.; Bhattacharyya, M.; Sarkar, D.; DasGupta, S. Interfacial energy driven distinctive pattern formation during the drying of blood droplets. J. Colloid Interface Sci. 2020, 573, 307–316. [Google Scholar] [CrossRef] [PubMed]
- Chen, R.; Zhang, L.; Zang, D.; Shen, W. Understanding desiccation patterns of blood sessile drops. J. Mater. Chem. B 2017, 5, 8991–8998. [Google Scholar] [CrossRef] [PubMed]
- Du, F.; Zhang, L.; Shen, W. The internal flow in an evaporating human blood plasma drop. J. Colloid Interface Sci. 2022, 609, 170–178. [Google Scholar] [CrossRef]
- Iqbal, R.; Shen, A.Q.; Sen, A.K. Understanding of the role of dilution on evaporative deposition patterns of blood droplets over hydrophilic and hydrophobic substrates. J. Colloid Interface Sci. 2020, 579, 541–550. [Google Scholar] [CrossRef]
- Brutin, D.; Sobac, B.; Nicloux, C. Influence of substrate nature on the evaporation of a sessile drop of blood. J. Heat Transf. 2012, 134, 061101. [Google Scholar] [CrossRef]
- Bou-Zeid, W.; Brutin, D. Effect of relative humidity on the spreading dynamics of sessile drops of blood. Colloids Surf. A Physicochem. Eng. Asp. 2014, 456, 273–285. [Google Scholar] [CrossRef]
- Bou Zeid, W.; Brutin, D. Influence of relative humidity on spreading, pattern formation and adhesion of a drying drop of whole blood. Colloids Surf. A Physicochem. Eng. Asp. 2013, 430, 1–7. [Google Scholar] [CrossRef]
- Chen, R.; Zhang, L.; Shen, W. Controlling the contact angle of biological sessile drops for study of their desiccated cracking patterns. J. Mater. Chem. B 2018, 6, 5867. [Google Scholar] [CrossRef]
- Pal, A.; Gope, A.; Sengupta, A. Drying of bio-colloidal sessile droplets: Advances, applications, and perspectives. Adv. Colloid Interface Sci. 2023, 314, 102870. [Google Scholar] [CrossRef]
- Jaber, A.; Vayron, R.; Harmand, S. Healthy and pathological porcine blood drop evaporation: Effect of the temperature. Langmuir 2023, 39, 4712–4719. [Google Scholar] [CrossRef] [PubMed]
- Goehring, L.; Nakahara, A.; Dutta, T.; Kitsunezaki, S.; Tarafdar, S. Desiccation Cracks and Their Patterns: Formation and Modelling in Science and Nature, 5th ed.; Wiley-VCH: Hoboken, NJ, USA, 2015; pp. 96–116. [Google Scholar] [CrossRef]
Disclaimer/Publisher’s Note: The statements, opinions and data contained in all publications are solely those of the individual author(s) and contributor(s) and not of MDPI and/or the editor(s). MDPI and/or the editor(s) disclaim responsibility for any injury to people or property resulting from any ideas, methods, instructions or products referred to in the content. |
© 2025 by the authors. Licensee MDPI, Basel, Switzerland. This article is an open access article distributed under the terms and conditions of the Creative Commons Attribution (CC BY) license (https://creativecommons.org/licenses/by/4.0/).