Abstract
In this communication, the single-element version of the fractional Maxwell model (single FMM) is adopted to quantify the observed behaviour of the interfacial dilational viscoelasticity. This mathematical tool is applied to the results obtained by the oscillating drop method for aqueous solutions of ethyl lauroyl arginate (LAE). The single FMM adequately fits the experimental results, fairly well characterizing the frequency dependence of the modulus and the inherent phase-shift angle of the complex physical quantity, i.e., the interfacial dilational viscoelasticity. Further speculations are envisaged to apply the FMM to step perturbations in the time domain, allowing for the same parameter set as in the frequency domain.
1. Introduction
The industrial formulation of a variety of products involving multicomponent interfacial fluid–fluid systems demands the understanding of their effective interfacial rheology behaviour, namely their interfacial viscoelasticity. The importance of developing the theoretical background and the operational methods for the relevant commercial distribution and for the final applications is highlighted in several reviews concerning many categories of widespread vital goods and life resources [1].
Interfacial (dilational or shear) viscoelasticity is a phenomenon occurring in disparate fluid–fluid multicomponent interfacial systems containing surface active agents. Specifically, the interfacial dilational viscoelasticity is measured by the value of the interfacial dilational viscoelastic modulus ε*(iω), a physical quantity properly defined as the ratio between the change of interfacial tension over the concomitant change of relative interfacial area.
In other words, according to the definition, ε*(iω) is the transfer function connecting the interfacial tension response to the relative interfacial area perturbation. In the condition of periodic perturbations of interfacial area, ε*(iω) is expressed as a frequency-dependent complex function. Essentially, ε*(iω) is an observable physical quantity that reveals dynamic molecular processes occurring in the proximity of both sides of the interface and at the interface layer. In principle, the definition of ε*(iω) does not imply any specific relaxation mechanism in the interfacial system.
Lucassen, van den Tempel and Hansen [2,3] originally proposed a theoretical model interpreting the dynamic behaviour of ε*(iω). This model (shortly LvT model) is based on a solution of the diffusion equation for specific initial and boundary conditions at the fluid–fluid interface. The fitting of the LvT model to the observed experimental results positively assesses and validates a molecular diffusion mechanism (diffusion-controlled mechanism) of the adsorption process at an interfacial layer with simple-structure surfactants.
In the case of mixtures of complex surfactants or of mixtures of surfactants with nanoparticles/proteins, multiple concomitant or consecutive molecular processes may take place at the interface in addition to molecular diffusion. In such circumstances, the distinction of each particular process may be difficult, and the adoption of an adequate model instead of the LvT model is necessary for characterizing the interfacial dilational modulus.
In the successive five decades since the definition of the LvT model, an increasing number of articles appeared in the literature, containing experimental results of ε*(iω), in the form of plots and tables, discussed either in qualitative terms or in terms of generalized Maxwell models.
Concerning complex interfacial systems, Jaishankar et al. proposed the application of a particular form of the generalized Maxwell model, namely the fractional Maxwell model (FMM) [4,5]. Henceforth, the FMM appeared as an adequate mathematical tool for describing and potentially predicting the interfacial behaviour of the interfacial dilational viscoelasticity results obtained by capillary pressure experiments under low-gravity conditions aboard the International Space Station for adsorption layers at the hydrocarbon/water interface [6].
In this communication, we present the adoption of the FMM for characterizing the interfacial dilational viscoelasticity of ethyl lauroyl arginate (LAE), a broadly applied surfactant in biomedical, cosmetic and food processing areas, which in aqueous solution gives rise to a multicomponent complex system due to the decomposition by hydrolysis into diverse surface-active components.
2. Measurement of the Interfacial Dilational Viscoelastic Modulus ε*(iω)
The values of ε*(iω) for an LAE aqueous solution at different concentrations were measured by the pendant drop technique with the tensiometer PAT-1M (SINTERFACE Technologies, Berlin, Germany) [7]. The size of the droplets in these experiments was 11 μL. The experiments were conducted by imposing cyclic oscillations to the drop area in the 0.01–0.1 Hz frequency range. The oscillation amplitude was less than 10% of the drop volume (6 to 8% for most of the experiments). The interfacial tension γ and the interfacial area A, as well as the respective variation amplitudes Δγ and ΔA, were acquired from the Laplace-equation fitting of the observed drop profile. Moreover, the phase shift φ was measured from the relative time difference between the minima/maxima of the imposed A sinusoidal cycles and the issuing γ cycles. Hence, the derived values of ε*(iω) were obtained by the definition equation:
where A0 is the mean interfacial area of the sinusoidal cycles, εr is the real part and εi is the imaginary part of the interfacial dilational viscoelasticity modulus.
ε*(iω) = Δγ/(ΔA/A0) = |ε*|exp(iφ) = εr + i εi = |ε*|cos(φ) + i |ε*|sin(φ)
The pendant drop measurements technique generates a reliable set of self-consistent results within the range of linearity γ responses [7].
3. Fractional Maxwell Model Fitting
3.1. Outline of the Fractional Scott Blair Element (or Fractional Scott Blair Model)
The generalized Maxwell model is constituted by a summation of single Maxwell elements, representing the behaviour of a parallel sequence of Maxwell springs/dashpots:
where Ei are the elastic moduli of the elements, τi are the characteristic relaxation times and ω is the angular frequency.
Such a generalized Maxwell model usually requires multiple exponential functions to calculate the relaxation time spectra for complex soft materials. An alternative approach can be built on the employment of the fractional Scott Blair model (see Appendix A.1 and Appendix A.2 for the mathematical details).
In particular, in the present study for the LAE aqueous solutions, a fractional single Maxwell element is employed as a mathematical representation of the complex interfacial dilational modulus ε*(iω).
Hence, the real and imaginary parts are given by the following equations (Appendix A.3):
where E is the elastic modulus, τ is the characteristic relaxation time and α is a dimensionless positive non-integer number (0 < α < 1). The modulus of the complex function ε*(iω), for a single-element fractional Maxwell model, also reads as
3.2. Fitting Procedure
The non-linear fitting of the model to the experimental values was performed according to the procedure of the Levenberg–Marquardt algorithm, using the proper built-in mathematical tools of the software Origin (version 5.0).
The calculation taxonomy, i.e., the order of consecutive arithmetic operations, was first carefully prepared for the FMM modulus |ε*(iω)|, as expressed by Equation (5), as well as for the FMM phase shift φ, as derived from Equations (3) and (4) and expressed by the following Equation (6):
φ = 57.29578 × arctan(εi/εr)
The parameters α and τ appear in both Equations (5) and (6), and hence, a minimized standard deviation between the model prediction and experimental points, SD, should be obtained in both the respective fitting processes bearing the same final α and τ parameter values. Concerning the non-linear fitting procedure for the present LAE-result plots, a good SD minimizing objective was in practice achieved by step-by-step constant-value constraints. That was achieved thanks to the high flexibility of the Origin’s non-linear least squares curve fitter, which enables it to take almost full control of the fitting process.
Actually, in the FMM phase-shift fitting process, the initial values were kept constant for τ, leaving α as the only variable to minimize the SD (i.e., fitting the slope of the curve). Then consecutively, the alternate step was actuated by keeping the obtained α-value constant and leaving τ only variable (i.e., fitting the position of the curve on the frequency axis). Then, the procedure was repeated until the SD was no longer minimized. Finally, having these two parameters α and τ found by fitting the phase shift, the third parameter E was obtained by the subsequent fitting of the modulus |ε*(iω)|, where just the parameter E was varied, while the final values of the other two parameters α and τ were kept constant.
4. Results and Discussion
The fitting parameters of the single FMM obtained for the results of six experiments conducted in [7] on LAE aqueous solutions at different concentrations are reported in Table 1.

Table 1.
Best fit parameters of the single FMM for the modulus |ε*(iω)| and for the phase shift φ of the complex surface dilational elasticity ε*(iω) of LAE solutions.
Note that, in Table 1, the 1.0 mM concentration was discarded from the pertinent fitting process because the phase shift rises to physically unsounded values of about 90° due to the concentration above the critical micellar concentration.
In [7] the experimental data for the real and imaginary parts of the dilational viscoelastic modulus for LAE solutions with concentrations between 0.2 mM and 1.5 mM have been analysed. In the present study, we considered the data for the modulus |ε*(iω)| and the phase shift φ for LAE solutions with concentrations between 0.1 mM and 0.8 mM. The original data from the files with experimental results stored by the tensiometer PAT-1M were reused for this new analysis.
It is worth noting that the FMM fitting calculation was applied to the experimental results of the modulus |ε*(iω)| and of the phase shift φ, which are the primary derived properties from the observed area and interfacial tension with the PAT methodology. In this connection, the fitting of the values of the real part or of the imaginary part of ε*(iω) should be neglected, with such values being subsequently derived properties, and hence twice affected by the measurement errors.
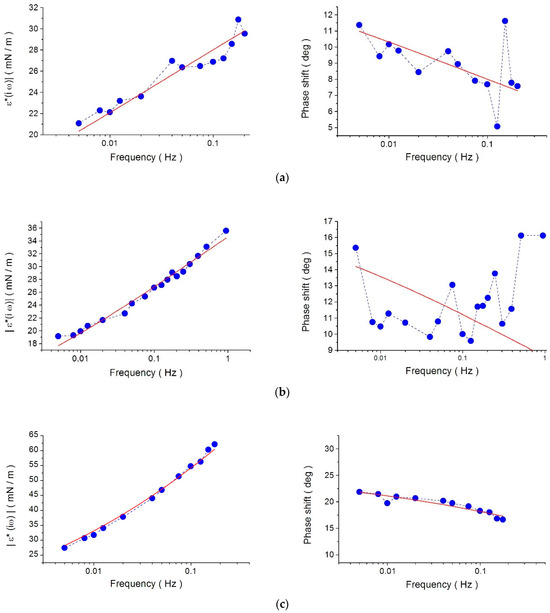
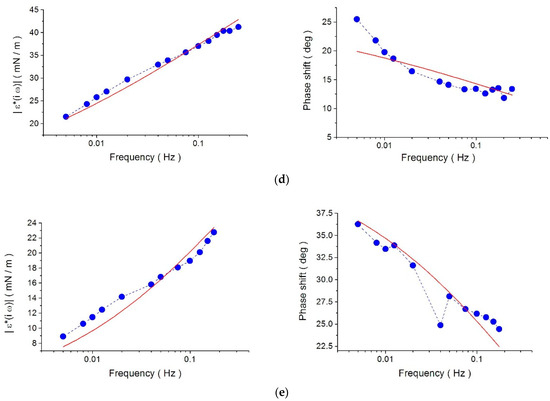
Figure 1 shows the Bode plots (i.e., the measured values of the modulus and phase shift) of the physical quantity ε*(iω) and the relevant fitting curve for different LAE bulk concentrations.


Figure 1.
Frequency dependence of the phase shift and modulus of the complex physical quantity ε*(iω), measured at different concentrations c: (a) c = 0.1 mM, (b) c = 0.2 mM, (c) c = 0.3 mM, (d) c = 0.5 mM, and (e) c = 0.8 mM (blue symbols). The lines are the results of calculations using the fractional Maxwell model (FMM), Equations (5) and (6), with the parameter set E, α and τ reported in Table 1 (red solid lines). The dashed lines are a guide for the eyes.
All experimental results, shown in Figure 1, demonstrate similar trends: the phase shift decreases with increasing frequency, whereas the modulus increases. At the lowest concentrations, the phase-shift values are scattered, affected by random errors caused by the irregular shape of the surface tension oscillation (see Figure 5 in ref. [7]).
The plots in Figure 1 demonstrate that the fitting is sufficiently good, that is, the fitting curve fairly matches, with the same set of parameters, the measured values in both plots, the phase shift and the modulus. The quality of fitting can be a criterion that the model is applicable for characterizing the interfacial dilational viscoelasticity of the considered LAE-solution system. In the Supplementary Materials, we compare the FMM predictions with those of the Lucassen and van den Tempel model, where the better quality of fitting was obtained by the FMM.
As in the case of the microgravity experiments [6], the addition of only one parameter in the FMM advantageously improves the fit to the observed interfacial dilational viscoelasticity values, in contrast to the complete ineffectiveness of the classical two-parameter Maxwell model. Finally, also note that the LvT-model approach leads to an illusory diffusion-driven adsorption mechanism in the case of complex systems.
5. Conclusions
Essentially, the fractional Maxwell model is a mathematical representation of the real behaviour, based on phenomenological observed values of interfacial dilational elasticity. When applying the FMM, the mechanism of the process is not resolved. The FMM approach is a renunciation of a theoretical approach, as in the case of the LvT model, and the real behaviour of the adsorption layer is followed by a technical model that is adequate to describe and predict the state of the system, even if it is not capable of interpreting it.
The FMM lacks theoretical foundations on the molecular level. Nevertheless, the FMM mechanical analogy is more than a simple mathematical description (as it is a three-parameter quadratic polynomial), because the FMM maintains its viscoelastic representative power. That is, the FMM effectively provides a predictive potential for any different stress–strain perturbations, issuing in the time-domain relaxation evolution or in the frequency-domain transfer function in periodic oscillations.
Mathematical FMM formulations concerning step interfacial perturbations have been recently reported in the literature [8,9]. Possible step experiments will be fruitful for analysing the interfacial relaxation response by the relevant time-domain FMM. A good time-domain fit with the same parameters as the frequency-domain fit will further validate the physical significance of the FMM.
Supplementary Materials
The following supporting information can be downloaded at: https://www.mdpi.com/article/10.3390/colloids8040044/s1, Figure S1: Frequency dependence of the modulus and phase shift of the complex physical quantity ε*(iω), measured at LAE concentration c = 0.1 mM. The lines are the results of calculations using the LvT model (top) and FMM (bottom) with the parameter sets reported in Table S1; Figure S2: The same for LAE concentration c = 0.2 mM; Figure S3: The same for LAE concentration c = 0.3 mM; Figure S4: The same for LAE concentration c = 0.5 mM; Figure S5: The same for LAE concentration c = 0.8 mM; Table S1: Best fit parameters of the LvT model and of the single FMM for the modulus and phase shift of the complex surface dilational viscoelasticity of LAE solutions.
Author Contributions
Conceptualization, G.L.; methodology, G.L., L.L. and R.M.; validation, V.I.K., M.K., L.L. and R.M.; formal analysis, G.L. and V.I.K.; investigation, A.C., E.J., M.K. and P.W.; resources, L.L.; data curation, G.L. and M.K.; writing—original draft preparation, G.L. and V.I.K.; writing—review and editing, E.J., V.I.K., M.K., L.L., R.M. and P.W.; visualization, G.L.; supervision, P.W.; project administration, L.L.; funding acquisition, L.L. All authors have read and agreed to the published version of the manuscript.
Funding
This work was partly funded by the European Space Agency under the MAP projects “Soft Matter Dynamics” and “Emulsion Dynamics and Droplet Interfaces” (EDDI) and by the E.U. in the framework of the FP Horizon 2020 project EHAWEDRY (Grant Agreement No. 964524).
Data Availability Statement
Data are available upon request.
Conflicts of Interest
The authors declare no conflicts of interest. The funders had no role in the design of the study; in the collection, analyses or interpretation of the data; in the writing of the manuscript; or in the decision to publish the results.
Appendix A
Appendix A.1. Fractional Derivatives
Fractional derivatives can be defined in different ways. We used the Caputo fractional derivative, which, in the simplest case, can be written as
where 0 < α < 1 is the order of the fractional derivative and Γ(x) is the Euler Gamma function.
Similarly to the ordinary derivatives, in the case of fractional derivatives, one can apply the rule
The Laplace transform is also similar (for zero initial conditions):
For the function , we will have
So, the fractional derivative for is proportional to , provided the integral exists for the given α and β.
Appendix A.2. Fractional Scott Blair Element (or Fractional Scott Blair Model)
Different fractional mechanical elements are defined in the literature. The fractional Scott Blair element is defined by the following fractional differential equation [10,11,12]:
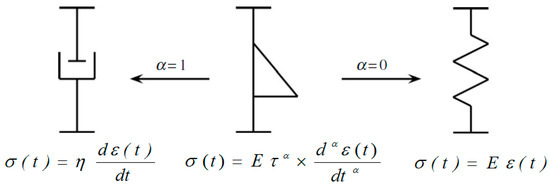
where σ(t) is the stress, ε(t) is the strain, τ is the characteristic time scale, E is the elastic modulus and α is a dimensionless non-integer positive number (0 < α < 1), assigning the order of the fractional derivative. The fractional Scott Blair element turns to a spring for α = 0 and to a dashpot for α = 1, and therefore, it is often called “spring-pot” (Figure A1).

Figure A1.
A spring and a dashpot as the particular cases of “spring-pot” (adapted with permission from Ref. [5]. Copyright 2012, Royal Society).
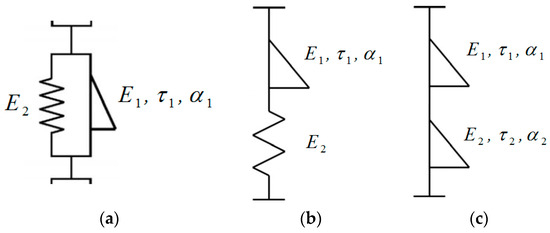
The fractional Scott Blair element can be included in more complicated models. For example, it can be combined with a spring or another “spring-pot” (Figure A2).

Figure A2.
(a) Fractional Voigt model (adapted with permission from Ref. [11]. Copyright 2009, Elsevier B.V.); (b) fractional Maxwell model [13]; (c) fractional Maxwell model (adapted with permission from Ref. [5]. Copyright 2012, Royal Society).
Appendix A.3. Fractional Maxwell Model
The models in Figure A2b,c are called fractional Maxwell models because they consist of two elements connected in a series, and at least one of them is a fractional (Scott Blair) element. They are called also fractional Maxwell elements because they can be included in even more complicated models. For example, in [13], a generalized fractional Maxwell model is considered, which includes N single fractional Maxwell elements of the type of Figure A2b connected in parallel with a Hookean spring.
In our study, we considered a single fractional Maxwell element presented in Figure A2b. The stresses for the “spring-pot” and spring included in this element are
For the elements connected in a series we have
The last Equation can be presented in the following form [12,13]:
where E = E2 and . The Laplace transform of this Equation results in
From Equation (A11), the viscoelasticity modulus can be obtained as
Then, replacing s with iω, we finally obtain the complex viscoelasticity modulus as a function of frequency
From Equation (A13), we obtain the real and imaginary parts:
These are Equations (3) and (4).
References
- Gonçalves dos Santos, R. Fundamentals of Surface Thermodynamics, Phase Behavior and Its Related Properties; Springer Nature: Cham, Switzerland, 2024; ISBN 978-3-031-52465-3. [Google Scholar]
- Lucassen, J.; Van den Tempel, M. Dynamic measurements of dilational properties of a liquid interface. Chem. Eng. Sci. 1972, 27, 1283–1291. [Google Scholar] [CrossRef]
- Lucassen, J.; Hansen, R.S. Damping of Waves on Monolayer-Covered Surfaces II. Influence of Bulk-to-Surface Diffusional Interchange on Ripple Characteristics. J. Colloid Interface Sci. 1967, 23, 319–328. [Google Scholar] [CrossRef]
- Jaishankar, A.; McKinley, G.H. A fractional K-BKZ constitutive formulation for describing the nonlinear rheology of multiscale complex fluids. J. Rheol. 2014, 58, 1751–1788. [Google Scholar] [CrossRef]
- Jaishankar, A.; MacKinley, G.H. Power-law rheology in the bulk and at the interface: Quasi-properties and fractional constitutive equations. Proc. R. Soc. A 2013, 469, 20120284. [Google Scholar] [CrossRef]
- Loglio, G.; Kovalchuk, V.I.; Bykov, A.G.; Ferrari, M.; Krägel, J.; Liggieri, L.; Miller, R.; Noskov, B.A.; Pandolfini, P.; Ravera, F.; et al. Interfacial Dilational Viscoelasticity of Adsorption Layers at the Hydrocarbon/Water Interface: The Fractional Maxwell Model. Colloids Interfaces 2019, 3, 66. [Google Scholar] [CrossRef]
- Czakaj, A.; Jarek, E.; Krzan, M.; Warszynski, P. Ethyl Lauroyl Arginate, an Inherently Multicomponent Surfactant System. Molecules 2021, 26, 5894. [Google Scholar] [CrossRef] [PubMed]
- Stankiewicz, A. On Applicability of the Relaxation Spectrum of Fractional Maxwell Model to Description of Unimodal Relaxation Spectra of Polymers. Polymers 2023, 15, 3552. [Google Scholar] [CrossRef] [PubMed]
- Stankiewicz, A.; Juściński, S. How to Make the Stress Relaxation Experiment for Polymers More Informative. Polymers 2023, 15, 4605. [Google Scholar] [CrossRef] [PubMed]
- Geri, M.; Keshavarz, B.; Divoux, T.; Clasen, C.; Curtis, D.J.; McKinley, G.H. Time-resolved mechanical spectroscopy of soft materials via optimally windowed chirps. Phys. Rev. X 2018, 8, 041042. [Google Scholar] [CrossRef]
- Meral, F.C.; Royston, T.J.; Magin, R. Fractional calculus in viscoelasicity: An experimental study. Commun. Nonlinear Sci. Numer. Simul. 2010, 15, 939–945. [Google Scholar] [CrossRef]
- Stankiewicz, A. Fractional Maxwell model of viscoelastic biological materials. In BIO Web of Conferences, Contemporary Research Trend in Agricultural Engineering; EDP Sciences: Les Ulis, France, 2018; Volume 10, p. 02032. [Google Scholar] [CrossRef]
- Costa, M.F.P.; Ribeiro, C. Generalized fractional Maxwell model: Parameter estimation of a viscoelastic material. AIP Conf. Proc. 2012, 1479, 790. [Google Scholar] [CrossRef]
Disclaimer/Publisher’s Note: The statements, opinions and data contained in all publications are solely those of the individual author(s) and contributor(s) and not of MDPI and/or the editor(s). MDPI and/or the editor(s) disclaim responsibility for any injury to people or property resulting from any ideas, methods, instructions or products referred to in the content. |
© 2024 by the authors. Licensee MDPI, Basel, Switzerland. This article is an open access article distributed under the terms and conditions of the Creative Commons Attribution (CC BY) license (https://creativecommons.org/licenses/by/4.0/).