Abstract
Hybrid dysprosium-doped borate glassy samples [B-Gly/Dy]HDG (Borate Glass/Dysprosium)Hybrid Doped Glass were prepared in this study via the melt-quenching method. Its linear/nonlinear optical, photoluminescence, hardness indentation, and micro-creep properties were analyzed. The amorphous structure for all the prepared samples was confirmed from the XRD patterns. In addition, density functional theory (DFT), optimized by TD-DFT and Crystal Sleuth, was used to study the structure and crystallinity of the [B-Gly/Dy]HDG as isolated molecules and agreed with the peaks of experimental XRD patterns. Additionally, theoretical lattice types were studied using Polymorph, a content studio software, and orthorhombic Pc21b (29) and triclinic P-1 (2) structures were provided. Both mechanical and optical properties were responses to different concentrations of Dy2O3 in the glassy borate system. It was found that the length of indentation increases by increasing the load time, and the hardness decreases by increasing the load time. The stress exponent value also increased from 4.1 to 6.3. The indentation strain increases by increasing the load time. The direct optical band gap was evaluated using the Davis–Mott relation. Urbach energy and its connection to the disorder degree in materials were studied depending on the Dy2O3 concentration. The acquired optical parameters were also analyzed to determine the nonlinear refractive index as well as the linear and third-order nonlinear optical susceptibility of the investigated glass samples. The photoluminescence emission spectra were recorded, and their attributed transitions were studied. The mechanical studies showed that the hardness values increased by increasing Dy2O3 concentrations from 4160.54 to 5631.58 Mpa. The stress exponent value also increased from 4.1 to 6.3. Therefore, the higher value of stress exponent (S) is more resistant to indentation creep.
1. Introduction
With the diversity of glass compositions and improved analysis methods, glass structures suitable for every technological need have been created. Recently, a glass system based on borate reinforced with several oxides has been widely scrutinized due to its outstanding properties [1]. Boric oxide is used to make glass using BO3 units alone, and the BO3 units are converted to BO4 units by adding various cations. Due to the rupturing of B-O-B and the splitting of bridged oxygen [2,3,4,5,6]. Zinc oxide is often employed as a glass matrix modifier, causing defects by breaking the B-O-B link, forming non-bridged oxygen atoms, and creating dangling bonds [7,8,9,10,11,12]. Because of their unique properties, such as effective radiation shielding, a broad glass formation zone, and low melting temperatures, lead borate glasses are highly favored in technical applications [13,14]. Essentially, borate glass frameworks containing lead oxide are notable for their increased visual transmittance [15]. Over glass systems, the essential and optimum utilization of zinc and lead oxide as network exchangers decreases phonon energy [16,17]. Because of their ornamental qualities, rare earth elements are employed in glass production [18,19]. Because of the qualities of glass doped with rare earth elements, it may be used in various applications, including laser materials, plasma screens, optical waveguides, fiber amplifiers, and efficient amplifiers [20,21,22,23].
All oxide glasses based on (B2O3, SiO2, TeO2, and P4O6) have been proven to be the most suitable host materials for the progress of optoelectronic components [24,25]. It is possible to assume that glass based on borate is the most frequent variety because of its excellent transparency, chemical resistance, and thermal stability [26]. The low phonon energy host glass extends lower non-radiative relaxation rates and strong quantum efficiencies [27,28,29]. The optical homogeneity of the glassy matrix causes RE ions to display a variety of latent laser transitions. The spectroscopic analysis of RE ions in glasses yields information on the excited states’ transition probabilities, lifetimes, and branching ratios, all of which are important in the design and growth of different electro-optic and optical systems [30,31,32,33].
Neoteric TDDFT applications (DMol3 and Crystal Sleuth) for researching the structure of glass matrix, stability phase, and nanocomposite compounds [34,35,36] are reviewed. The use of this complete energy-based method for the estimation and investigation of spectroscopic properties has received little attention. This article discusses the structural study using a limited programming language [37]. The objective is to demonstrate that the same atomistic modeling techniques may be consistently employed throughout the experimental inquiry to achieve high levels of precision [38]. In order of crystallinity investigations, Polymorph used content studio software to study the possible crystal sites for the compounds and predict the final crystal structure of the system [39].
In the present work, the impact of Dy2O3 additive on the optical and mechanical characteristics of a novel glass system with chemical composition; (50 − x)B2O3 + 40Pb3O4 + 10CaO + xDy2O3 with the different substitution ratio of Dy2O3 (x = 0, 1, 2, 3, 4 and 5) was prepared. To explore and describe the modification of the bandgap structure, the UV–Vis absorbance spectra of the studied glass samples were investigated. The effect of adding different ratios of Dy2O3 on indentation creep behavior and micro-hardness values has been analyzed.
2. Materials and Methods
2.1. Materials and Reagents
All the oxides (raw materials) used in the study (B2O3, Pb3O4, CaO, and Dy2O3) were purchased from Oxford Laboratory. In contrast, dysprosium oxide was obtained from (Sigma-Aldrich, MO, USA) at a purity of 99.9%.
2.2. Experimental Procedure
The nominal compositions for the six studied glass samples (50 − x)B2O3 + 40Pb3O4 + 10CaO + xDy2O3 with varied Dy2O3 content (x = 0, 1, 2, 3, 4, and 5 wt%) were produced using the traditional solid-state approach. Dy0 (x = 0), Dy1 (x = 1), Dy2 (x = 2), Dy3 (x = 3), Dy4 (x = 4), and Dy5 (x = 5) were used to code the glass samples. Boron oxide (B2O3), lead oxide (Pb3O4), calcium oxide, and dysprosium oxide (Dy2O3) were well mixed before being pre-heated for 120 min at 300 degrees Celsius. The resulting formulations were thermally heated in a porcelain crucible at 1100 °C for 30 min before being cast onto a stainless-steel mold to originate glass samples in a disc form. The melting temperature of Dy2O3 increased from 1100 °C to 1300 °C when the substitution ratio of Dy2O3 increased. Following quenching, the produced samples were directly annealed in a muffle furnace set to 300 °C [34]. The structure of the samples has been studied at room temperature by powder X-ray diffraction analysis using a Bruker, AXS D8 Advance, Germany (Cu-Kα radiation). UV-visible absorption was recorded using the Shimadzu UV-2450 spectrophotometer at a range of (190–900 nm); all the measurements were taken at room temperature. Photoluminescence emission spectra were measured by HoRiBA (IHR 320) using a He-Cd laser with a wavelength of 442 nm as an excitation source.
A digital Vickers microhardness tester was used to accurately measure the hardness of glass specimens (Model FM-7 Future-Tech. Corp. Tokyo Japan). Micro indentation creep methods have substantial benefits in terms of speed, non-destructiveness, accuracy, and accessibility. For all types of glasses and surface treatments, only one indenter type may be utilized [35,36]. Although testing the softest and hardest materials under varying loads is more adaptive and accurate, the surface is subjected to standard stress for a record period using a pyramid-shaped diamond. An indentation is a pyramid with opposite sides that meet at a 136-degree angle. It applies 10 gf of diamond pressure to the material’s surface, and the impression size (typically no more than 0.5 mm) is assessed using a microscope. The Vickers indenter leaves an impression of a black square on a light background, swinging the microscope over a specimen to measure a ±1/1000 mm square depression. The area is calculated by averaging 10 measurements made across the diagonals for each sample.
The following formula is used to compute the number of Vickers (HV) [40,41]:
meaning that HV = where (F) and (d) are the applied load force and average diagonal length.
3. Results
3.1. Structural, Optical, and Mechanical Properties
3.1.1. X-ray Diffraction Analysis
The XRD spectral characteristics of the manufactured [B-Gly] and [B-Gly/Dy]HDG were compared with the characteristics of the system-isolated matrix (by TD-DFT simulation). The X-ray diffraction patterns of the manufactured glasses with various quantities of Dy2O3 additions are shown in Figure 1. This distinctive proved a completely amorphous nature for all samples under study. By changing the concentration of Dy2O3, the position and the intensity of the broad prominent peak at 2θ ≈ (29°) are changed.
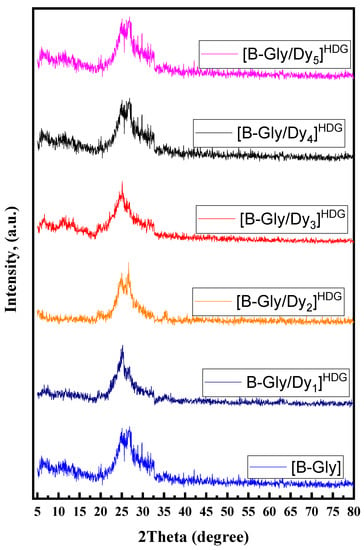
Figure 1.
XRD diffractogram for [B-Gly] with different concentrations of Dy2O3 glass system.
The XRD patterns in Figure 2a,b demonstrate that [B-Gly] and [B-Gly/Dy5]HHG are nearly identical. The XRD analysis in Figure 2a,b indicates that [B-Gly] and [B-Gly/Dy5]HNC are almost similar at 2θ = 25.77°. For the different doped concentrations of dysprosium (lanthanides of inert transition elements), two peaks appeared at 2θ = 6.81° and 2θ = 13.62°. Table 1 demonstrates the relationship between the miller index (hkl) and the estimated average crystallite size (D), and the full width at half maximum (FWHM) absolute values. A good agreement between the interplanar distances (d) and the data in database code amcsd 96-411-7035 [42,43] and 0019483 [44] were observed. Diffraction peaks that were quite close to the [B-Gly] and [B-Gly/Dy]HDG measured data were generated by TDDFT and Crystal Sleuth Microsoft applications [45].
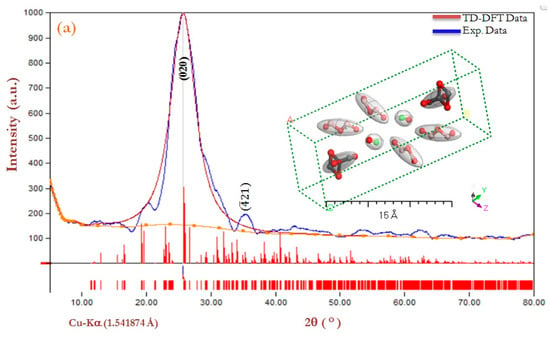
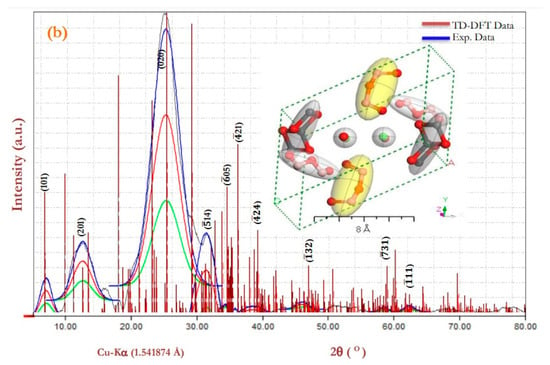
Figure 2.
(a) PXRD patterns (combined experimental and simulated) for [B-Gly] and [B-Gly]Iso isolate molecule. Insert is a 3D orthorhombic Pc21b (29) lattice-type computed using the Polymorph method. (b) [B-Gly/Dy]HDG and [B-Gly/Dy]Iso isolate molecule. Inset is a 3D Monoclinic P-1(2) lattice type.

Table 1.
The experimental and calculated XRD data using the Refine Version 3.0 (Carnegie Mellon University, Pennsylvania) Software Program (Kurt Barthelme’s & Bob Downs) for experimental [B-Gly] and [B-Gly/Dy]HDG and simulated parts [B-Gly]Iso and [B-Gly/Dy]Iso.
The X-ray diffraction pattern of [B-Gly] and [B-Gly/Dy]HDG was evaluated by applying the Debye–Scherrer relation, along with the Pesedo–Voigt function; the polarization nearly equal to 0.5 and , , in the range of 5 ≤ 2θ ≤ 80°. Using the formula of Scherer , where λ = 1.541838 Å, which is the wavelength of the X-ray [46,47]. As presented in Table 1, features such as peak intensity, d-spacing (d), Miller indices (hkl), the average crystallite size (D), and FWHM were studied using the X-ray diffraction data from [B-Gly] and [B-Gly/Dy]HDG. The average crystalline size is for [B-Gly] and [B-Gly/Dy]HDG, respectively [48,49,50]. Additionally, theoretical X-ray diffraction models were determined by content studio software computations used in Polymorph [see (Figure 2 Inset)]. The integrals performed on the Brillouin zone are shown in the inset of Figure 2 with (Polymorph [B-Gly] and [B-Gly/Dy]HDG. Estimated PXRD patterns were compared with the experimental XRD structures for the relevant experiment. There is only a slight difference in the position and strength of the specific peaks between the simulated and experimental XRD models; therefore, the general similarity has attracted much attention. Many factors influence the experimental XRD pattern, of which instrumentation and data collection techniques are only two [33].
The simulated XRD for [B-Gly]Iso and [B-Gly/Dy]Iso as isolated molecules provides orthorhombic Pc21b (29) and triclinic P-1 (2) structures, respectively. For the experimental patterns of [B-Gly] and [B-Gly/Dy]HDG, at 2θ equal to 25.77°, prominent peaks at hkl () appeared. Using the above assessment, the PXRD pattern accuracy of the fabricated material was validated. The atomic scale of [B-Gly]Iso and [B-Gly/Dy]Iso was estimated depending on the experimental and calculated PXRD patterns combination [51]. Additionally, the density of the defect was calculated by [52] specified as the dislocation line length per unit volume. The difference between average crystallite size calculation of borate glassy sample [B-Gly] and dysprosium doped borate glassy samples [B-Gly/Dy]HBG () by the equation of Scherrer and based on the highest peak of diffraction related to (020)1 crystal plane gives the value of ≅ ). It can be conculcated that the high-value difference in crystallite size is an attribute to the high atomic mass of dysprosium (Mol. WtDy = 162.50), which is doped in the borate glassy samples [53].
3.1.2. UV–Vis Spectrum Analysis
The glass samples’ UV–Vis absorbance spectra were recorded at room temperature to define and describe the changes in the bandgap structure. The UV–Vis absorption spectra of all produced glass samples are shown in Figure 3.
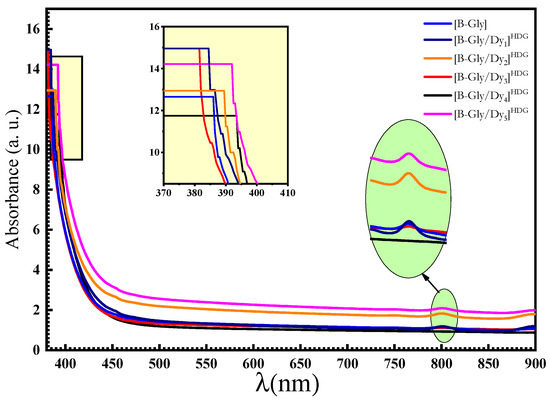
Figure 3.
UV–Vis absorption spectrum of the prepared glass samples; the inset figure shows the optical band gap as a function of Dy2O3 content.
The UV–Vis absorption spectra of the samples investigated demonstrate that the sample at x = 0 has a prominent UV absorption peak at around 432 nm. The glasses’ absorption band was expanded. Due to the amorphous nature of glass samples, there is no robust increase in absorption at energies near the band gap, which appears as an absorption edge in the UV–Vis absorption spectra. The broad band of near-visible light concentrated at around 425 nm shifted to a wider wavelength (redshift) of 435 nm, originating from band gap transitions with increasing Dy2O3 concentration levels. The absorbance spectrum shows an absorption band peak at 800 nm as Dy2O3 content was added to the glass: this peak is attributable to the spin-allowed transitions of Dy3+ at the ground state (6H15/2) into different exciting H states [49].
The Davis–Mott relation (2) has been utilized to generate optical energy gaps for the examined substances [54,55]:
where (Eg) denotes the optical energy band gap of the glass samples, (A) denotes a constant, (α) denotes the absorption coefficient, and hν denotes the incident spectrum photon energy. For direct transitions and plots of (αhν)2 vs. hν, calculated band gap energies for glass samples were studied using n = 2 and plots of (αhν)2 vs. hν, as shown in Figure 4. In the straight transition from 2.95 eV to 2.90 eV indicated in Table 2, the computed band gap energies were slightly adjusted from 3.07 eV for the sample at x = 0 to 3.09 eV at x = 5. As illustrated in Figure 3, the optical band gap reduces as the redshift in the absorption edge increases, resulting in a reduction in non-bridging oxygen (NBO). As a result, the glass structure is compressed [56,57].
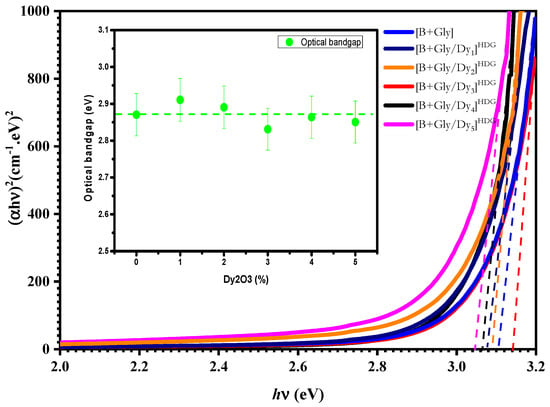
Figure 4.
The dependence of (αhν)2 on the photon energy (hν) for the prepared glass samples.

Table 2.
Concentration (C), Urbach energy (Eu), energy gap indirect (EOIn), energy gap direct (EOD), linear refractive index (n), ( linear and third-order nonlinear optical susceptibility for the prepared glass samples.
In addition to the refractive index of glass samples, direct and indirect transitions were investigated using Equation (3) [58,59,60,61]:
where K (=αλ/4π) is the extinction coefficient, λ is the incident photons wavelength, and α is the absorption coefficient [62,63].
Table 2 shows the refractive index values in reverse order from the optical energy band gaps data. The refractive indices results show that the proposed glass system is a good candidate for photo-electronic and optical filter devices. The following formula describing the width of band tails was used to compute the Urbach energy (Eu), defined by [8,64,65].
where (α) is the absorption coefficient, which is constant, and (Eu) is the Urbach energy.
(Eu) values have been extracted by plotting against and calculating the inverse of the slope for the curves that appear in Figure 5, giving Eu values. The values of the synthesized glass samples increased by increasing the Dy2O3 content, as shown in Table 2. The observed increase in Urbach’s energy in the range of 0.43–0.67 eV specifies the increase in the structural disorder of the glass samples [66].
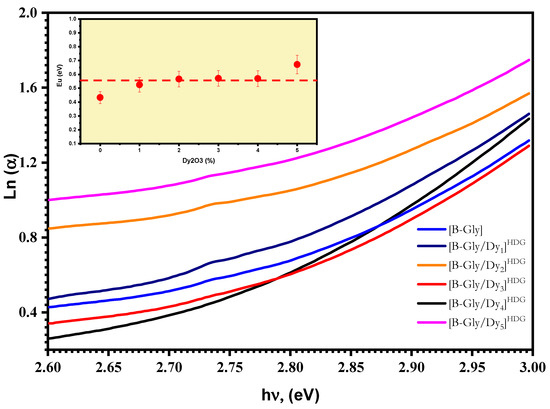
Figure 5.
The plot of ln(α) with hν of glass samples; inset shows the Eu as a function of Dy2O3 content.
The linear/nonlinear optical parameters were calculated; Figure 6a exhibits the studied glass samples’ refractive index variation versus the photon wavelength λ (nm). With the increasing wavelength, the refractive index decreases for all glass samples. The high refractive index below 380 nm is attributed to the effect of the main absorption. The refractive index is enhanced by increasing the Dy2O3 substitution in the glass system and reaches a minimum value at Dy2O3 content = 4 wt%. In general, this increase in the refractive index can be attributed to an increase in absorbance in the investigated samples, as given in Table 2 (1.5–1.49) and (0.89–4.13) for linear/nonlinear, respectively. The reflection increases for the fabricated glass samples due to the photons’ interaction on the samples with the filler compound ions and causing the photon to slow, and the refractive index also increases [67]. The value of the refractive index also increased with increases in the Dy2O3 content, owing to an increase in the atomic packing density by replacing the Dy element, which has a high relative atomic radius (162.5 pm), with a B element, which has a low relative atomic radius (84 pm). By adding the Dy2O3 to the glass lattice, the initial increase in the refractive is related to a change in the structural arrangements of the atoms in the glass matrix, which produces more non-bridging oxygen (NBO). NBOs are more polarizable than bridging oxygen (BO), which means increased polarizability of the glass through the increase in the NBOs produced due to Dy2O3 formation. Therefore, the invented samples are candidates used in photovoltaic and optical devices [6].
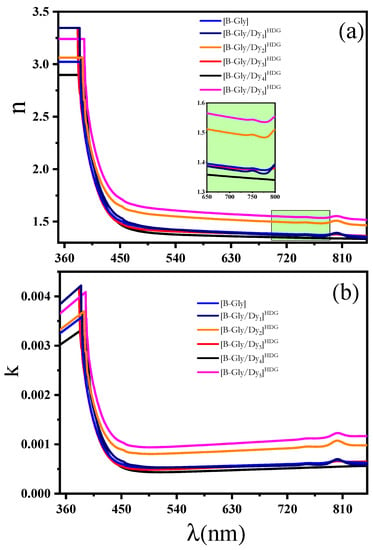
Figure 6.
The relationship between the investigated glass samples (a) refractive index (n) and (b) extinction coefficient (K) for different concentrations of Dy2O3 on the wavelength λ (nm).
The extinction coefficient is distinctive and determines how strongly a form absorbs and reflects radiation or light at a certain wavelength [58]. Figure 6b shows the extinction coefficient spectra of all the glasses samples. When compared to the original glass, it can be seen that Dy2O3 incorporation caused increased absorption. This behavior is most likely related to the absorption spectra [68].
The nonlinear optical properties of glasses are significant and of enormous interest for photonic devices to be utilized in various technological applications with a wide spectrum of phenomena, such as optical solitons, optical frequency conversion, Raman dispersion, and phase conjugation. To understand the interaction of high-intensity light with matter, the nonlinear optical parameters, i.e., optical susceptibility χ(1), third-order optical susceptibility χ(3), and nonlinear refractive index n2, are very important. These parameters are estimated through a linear refractive index [69,70]. The increase or decrease in the nonlinear parameter and the optical band gap Eg may refer to the formation of BO bonds and ions of higher polarizability. It is enjoyable to note that n and n2 are usually immediately linked, such that high index (n and n2). Therefore, materials with a lower band gap seam exhibit an increased nonlinear optical behavior (sample x = 3). In general, in multi-component oxides, BO and NBO oxygens are in the glass matrix, which affected the value of χ3. These glass materials are promising for application as components of nonlinear optical devices.
3.2. Structural, Optical, and Mechanical Properties
Photoluminescence emission spectra of the investigated glass system at the excitation wavelength (425 nm = 2.92 eV) are shown in Figure 7a, and the values of λemission were shown. The value of (energy gap of photoluminescence) is between 2.15 and 2.23 since the emission peak is at an approximately constant wavelength value. It can show from the emission spectra of Dy0 that the prominent peak appears around (2.23 eV), and as doping by Dy2O3 appears, six emission bands peak at (1.46, 1.65, 1.86, 2.15, 2.40, and 2.54 eV) attributed to the transition from the (4F9/2 − 6H5/2, 4F9/2 − 6H9/2, 4F9/2 − 6H11/2, 4F9/2 − 6H13/2, 4F9/2 − 6H15/2 and 4I13/2 − 6H13/2), respectively [71,72]. A procedure for the deconvolution of the experimental spectra was required for more information and analysis of PL emission due to overlapping emission bands. All experimental curves were fitted by a superposition of several Gaussian components (R2 ≥ 0.998) using the standard numeric procedure, as shown in Figure 7b–f.
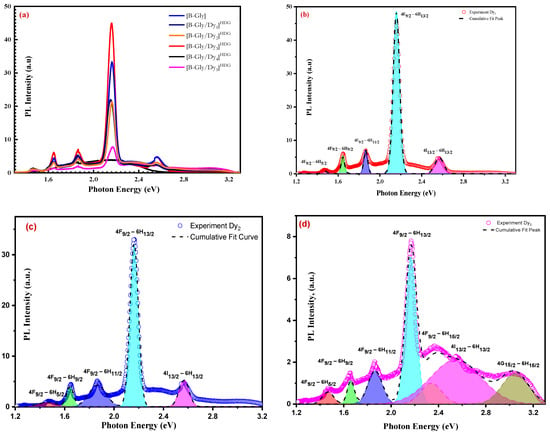
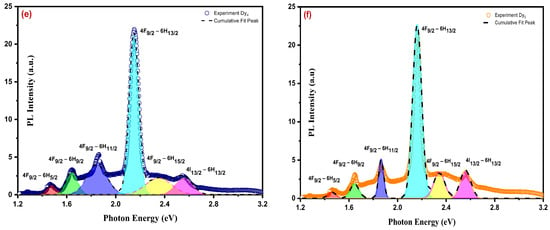
Figure 7.
Photoluminescence and deconvolution of photoluminescence spectra for different concentrations of Dy2O3 on the wavelength λ (530 nm).
Hardness Indentation and Micro-Creep Dependence of Dy2O3 Composition
The resistance of a material ordered to indentation by a much harder body is known as the hardness of this material. It represents a measure of the resistance against lattice destruction or the resistance to permanent deformation or damage. Information about the strength, molecular bindings, yield strength, and elastic constants of the material is impeded by the hardness of the crystal. The plasticity of the crystal could be understood by a microhardness study of the crystal. In the hardness technique, the crystal is subjected to relatively high pressure on a limited area.
Figure 8 shows the creep behavior of six glass samples containing 0, 1, 2, 3, 4, and 5 wt% Dy2O3 concentrations, respectively, using the Vickers hardness test. The length of indentation increases by increasing the time for each sample [73]. Figure 9 shows the relationship between Vickers hardness and indentation time [74]. The irreversible plastic deformation of the material is represented by Vickers hardness, calculated from the residual projected area. The hardness decreases with increases in time in the interval from 5 s to 100 s, which is inverse relation to the length of indentation. The average hardness numbers of Dy0, Dy1, Dy2, Dy3, Dy4, and Dy5 are listed in Table 3. It is noted that average hardness values at t = 5 s rise by increasing Dy2O3 concentrations from 4160.54 to 5631.58 MPa. The stress exponent is computed from Equation (5) and listed in Table 2 according to [75,76]:
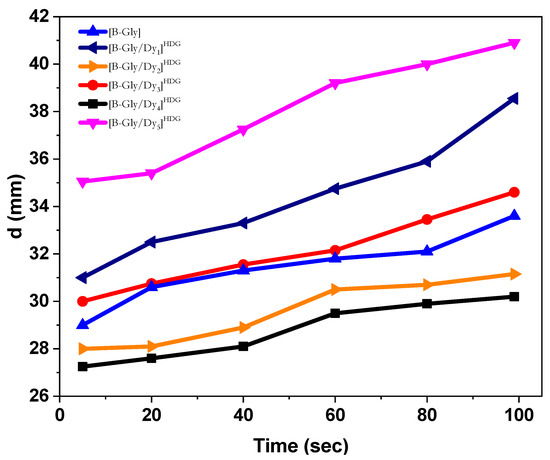
Figure 8.
Variation of indentation length with time at constant load 100 gf.
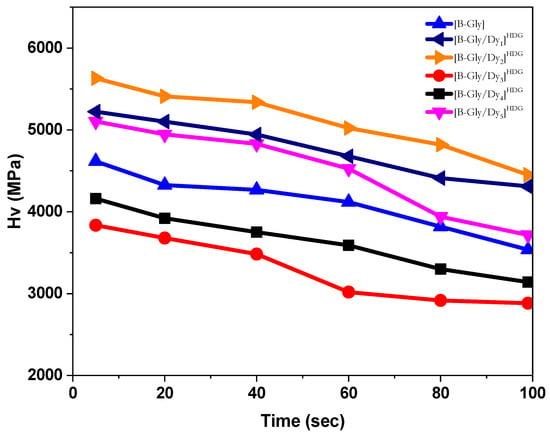
Figure 9.
Variation of hardness with time at constant load 100 gf.

Table 3.
Hardness and stress exponent value at 5 sec and load 100 gf.
The stress exponent studied using Equation (5) is used to define deformation mechanisms, where HV is the number of Vickers hardness, d is the length of indentation diagonal, and is a variable rate of diagonal indentation length. The slope of a straight line obtained by plotting against HV on the double logarithm scale is equal to the stress exponent (S), as shown in Figure 10 [77,78,79]. The stress exponent is an indication of the deformation mechanism at room temperature. The stress exponent (S) values range from 4.1 to 6.3, as shown in Table 2. Grain boundary sliding is related to n ≈ 2, and the dislocation movement, such as a creep, is related to n ≈ (5–7).
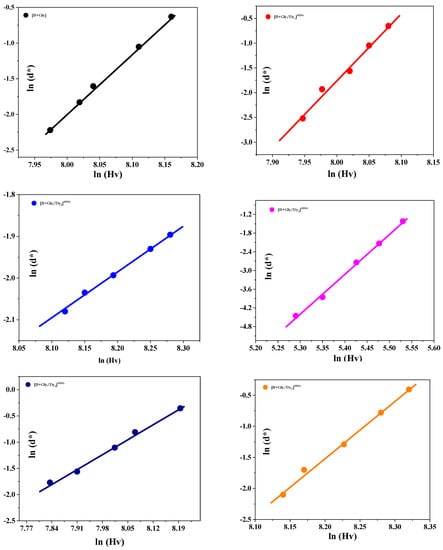
Figure 10.
ln-ln of the Vickers hardness numbers against the dwell time of indentation at load 100 gf.
The indentation creep behavior is shown in Figure 11 by plotting strain against indentation time (indentation creep curve) of all glass samples [80]. The first stage shows a faster increase in strain with indentation time, starting from the beginning to 10 sec of indentation time [81,82,83]. The second stage indicates a slow-increasing region for all glass samples where the strain has a slow increase. No specimen breakage occurs because the hardness test is a compression test [84,85,86]. Therefore, the third stage cannot be recorded as it did in an ordinary creep test. Thus, the higher stress exponent (S) value is more resistant to the indentation creep [87,88,89].
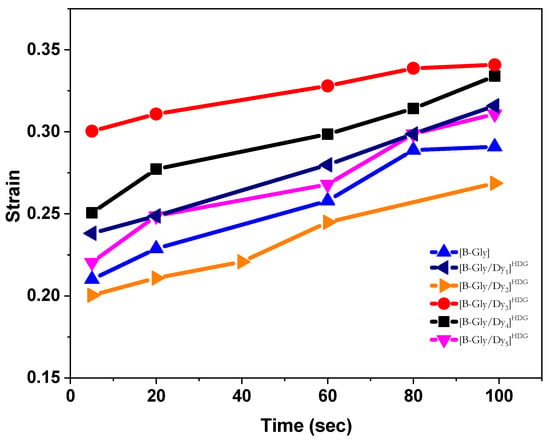
Figure 11.
The creep behavior of different concentrations of Dy2O3 glass system.
4. Conclusions
The effects of dysprosium oxide being added to the glass system with the chemical composition (50 − x)B2O3 + 40Pb3O4 + 10CaO + xDy2O3, along with different substitution ratios on the structure, optical and mechanical properties, were investigated. All studied glasses were prepared using the melt-quenching technique. XRD analysis confirms the amorphous phase of the samples. Theoretical structural studies agreed with the XRD experimental data and predicted the formation of orthorhombic Pc21b (29) and triclinic P-1 (2) structures for the isolated molecules. The UV–VIS spectra were also recorded to evaluate important optical properties such as direct and indirect optical band gap, Urbach energy, and refractive index. It was observed that it varied between 2.93 and 4.06 at a wavelength of 700 nm. The indirect energy gap fluctuated around 2.95 eV, and the direct value of the energy gap was decreased by increasing Dy2O3 to reach a maximum (3.14 eV) at x = 1.
In contrast, other essential properties such as χ3, χ1, and n2 enhanced with an increase in Dy2O3 concentration, which could be useful for optoelectronics and solar cell application. The mechanical studies showed that the hardness values increased by increasing Dy2O3 concentrations from 4160.54 to 5631.58 Mpa. The stress exponent value also increased from 4.1 to 6.3. Therefore, the higher value of stress exponent (S) is more resistant to the indentation creep.
Author Contributions
Conceptualization, A.M.H., E.A.A., R.M.S., A.R.G., I.A.W., A.V.T., S.V.T. and A.F.A.-H.; methodology, A.M.H., A.R.G., I.A.W., M.A.D. and A.F.A.-H.; software, M.A.D., and E.L.T.; validation, O.M.H., M.A.D. and E.L.T.; formal analysis, A.M.H., E.A.A., R.M.S., A.R.G. and E.L.T.; investigation, A.M.H., E.A.A., R.M.S., A.R.G., A.V.T., S.V.T. and N.A.A.; resources, M.A.D., A.V.T. and S.V.T.; data curation, M.A.D., A.V.T. and S.V.T.; writing—original draft preparation, O.M.H., E.A.A., R.M.S., I.A.W., A.V.T., S.V.T., A.F.A.-H. and N.A.A.; writing—review and editing, A.M.H., O.M.H., A.R.G., I.A.W., A.V.T., S.V.T., A.F.A.-H. and N.A.A.; visualization, M.A.D. and E.L.T.; supervision, O.M.H., A.V.T., S.V.T. and A.F.A.-H.; project administration, A.V.T. and S.V.T.; funding acquisition, E.L.T., A.V.T. and S.V.T. All authors have read and agreed to the published version of the manuscript.
Funding
I.A.W. thanks the Ministry of Science and Higher Education of Russia, research project no. FEUZ-2023-0014 for support.
Data Availability Statement
Not applicable.
Conflicts of Interest
The authors declare no conflict of interest.
References
- Juhasz, A.; Tasnadi, P.; Kovacs, I. Superplastic indentation creep of lead-tin eutectic. J. Mater. Sci. Lett. 1986, 5, 35–36. [Google Scholar] [CrossRef]
- Mahmudi, R.; Geranmayeh, A.; Mahmoodi, S.; Khalatbari, A. Effect of cooling rate on the room-temperature indentation creep of cast lead-free Sn–Bi solder alloys. Phys. Stat. Sol. A 2007, 204, 2302–2308. [Google Scholar] [CrossRef]
- Roumina, R.; Raeisinia, B.; Mahmudi, R. Room temperature indentation creep of cast Pb–Sb alloys. Scr. Mater. 2004, 51, 497–502. [Google Scholar] [CrossRef]
- Alibwaini, Y.; Hemeda, O.; El-Shater, R.; Sharshar, T.; Ashour, A.; Ajlouni, A.-W.; Arrasheed, E.; Henaish, A. Synthesis, characterizations, optical and photoluminescence properties of polymer blend PVA/PEG films doped eosin Y (EY) dye. Opt. Mater. 2021, 111, 110600. [Google Scholar] [CrossRef]
- Zakaly, H.M.; Issa, S.A.; Tekin, O.; Badawi, A.; Saudi, H.; Henaish, A.; Rammah, Y.S. An experimental evaluation of CdO/PbO-B2O3 glasses containing neodymium oxide: Structure, electrical conductivity, and gamma-ray resistance. Mater. Res. Bull. 2022, 151, 111828. [Google Scholar] [CrossRef]
- Saddek, Y.B.; Zakaly, H.M.; Sekher, K.C.; Issa, S.A.; Alharbi, T.; Badawi, A.; Shareefuddin, M. Investigations of mechanical and radiation shielding properties of BaTiO3-modified cadmium alkali borate glass. Appl. Phys. A 2022, 128, 260. [Google Scholar] [CrossRef]
- Zakaly, H.M.; Rashad, M.; Tekin, H.; Saudi, H.; Issa, S.A.; Henaish, A. Synthesis, optical, structural and physical properties of newly developed dolomite reinforced borate glasses for nuclear radiation shielding utilizations: An experimental and simulation study. Opt. Mater. 2021, 114, 110942. [Google Scholar] [CrossRef]
- Rammah, Y.S.; Issa, S.A.; Tekin, O.; Badawi, A.; Ene, A.; Zakaly, H.M. Binary contributions of Dy3+ ions on the mechanical and radiation resistance properties of oxyfluoroborotellurite Dyx-glasses. J. Mater. Res. Technol. 2022, 18, 820–829. [Google Scholar] [CrossRef]
- Issa, S.A.; Zakaly, H.M.; Tekin, O.; Saudi, H.; Badawi, A.; Pyshkina, N.; Susoy, G.; Elazaka, A.I.; Ene, A. Exploring the FTIR, Optical and Nuclear Radiation Shielding Properties of Samarium-Borate Glass: A Characterization through Experimental and Simulation Methods. Nanomaterials 2021, 11, 1713. [Google Scholar] [CrossRef]
- Issa, S.A.; Zakaly, H.M.; Badawi, A.; Elsaman, R.; Tekin, O.; Showahy, A.A.; Anjana, P.S.; Nath, D.R.; Gopakumar, N.; Saddek, Y.B. An experimental investigation on structural, mechanical and physical properties of Strontium–Silicon Borate glass system through Bismuth-Aluminum substitution. Opt. Mater. 2021, 117, 111124. [Google Scholar] [CrossRef]
- Henaish, A.; Issa, S.A.; Zakaly, H.M.; Tekin, H.; Abouhaswa, A. Characterization of optical and radiation shielding behaviors of ferric oxide reinforced bismuth borate glass. Phys. Scr. 2021, 96, 075801. [Google Scholar] [CrossRef]
- Weinstein, I.; Spiridonov, D.; Vokhmintsev, A.; Saraev, A.; Henaish, A. Spectral characterization of long-lived luminescence in h-BN powder under UV excitation. J. Alloys Compd. 2021, 871, 159471. [Google Scholar] [CrossRef]
- Kaewjaeng, S.; Wantana, N.; Kothan, S.; Rajaramakrishna, R.; Kim, H.; Limsuwan, P.; Kaewkhao, J. Effect of Gd2O3 on the radiation shielding, physical, optical and luminescence behaviors of Gd2O3–La2O3–ZnO–B2O3–Dy2O3 glasses. Rad. Phys. Chem. 2021, 185, 109500. [Google Scholar] [CrossRef]
- Rao, K.V.; Babu, S.; Venkataiah, G.; Ratnakaram, Y. Optical spectroscopy of Dy3+ doped borate glasses for luminescence applications. J. Mol. Struct. 2015, 1094, 274–280. [Google Scholar] [CrossRef]
- Eraiah, B. Experimental and theoretical approach on the physical, structural and optical properties of ZrO2-Na2O-B2O3 glasses doped with Dy2O3. J. Non-Cryst. Solids 2021, 551, 120394. [Google Scholar] [CrossRef]
- Dubrovin, V.; Zhu, X.; Mollaee, M.; Zong, J.; Peyghambarian, N. Highly Dy2O3 and Er2O3 doped boron-aluminosilicate glasses for magneto-optical devices operating at 2 µm. J. Non-Cryst. Solids 2021, 569, 120986. [Google Scholar] [CrossRef]
- Bhakta, N.; Das, A.; Das, D.; Yoshimura, K.; Bajorek, A.; Chakrabarti, P. Microstructural analysis, optical and magnetic properties of nanocrystalline Ni doped Dy2O3. Mater. Chem. Phys. 2019, 227, 332–339. [Google Scholar] [CrossRef]
- Ahamed, S.Z.A.; Reddy, C.M.; Raju, B.D.P. Structural, thermal and optical investigations of Dy3+ ions doped lead containing lithium fluoroborate glasses for simulation of white light. Opt. Mater. 2013, 35, 1385–1394. [Google Scholar] [CrossRef]
- Reddy, C.M.; Raju, B.D.P.; Sushma, N.J.; Dhoble, N.; Dhoble, S. A review on optical and photoluminescence studies of RE3+ (RE= Sm, Dy, Eu, Tb and Nd) ions doped LCZSFB glasses. Renew. Sustain. Energy Rev. 2015, 51, 566–584. [Google Scholar] [CrossRef]
- Elazaka, A.; Zakaly, H.M.; Issa, S.A.; Rashad, M.; Tekin, H.; Saudi, H.; Gillette, V.; Erguzel, T.; Mostafa, A. New approach to removal of hazardous bypass cement dust (BCD) from the environment: 20Na2O-20BaCl2-(60-x)B2O3-(x)BCD glass system and optical, mechanical, structural and nuclear radiation shielding competences. J. Hazard. Mater. 2021, 403, 123738. [Google Scholar] [CrossRef]
- Lim, T.Y.; Wagiran, H.; Hussin, R.; Hashim, S.; Saeed, M. Physical and optical properties of dysprosium ion doped strontium borate glasses. Phys. B Condens. Matt. 2014, 451, 63–67. [Google Scholar] [CrossRef]
- Rashad, M.; Saudi, H.; Zakaly, H.M.; Issa, S.A.; Abd-Elnaiem, A.M. Control optical characterizations of Ta+5–doped B2O3–Si2O–CaO–BaO glasses by irradiation dose. Opt. Mater. 2021, 112, 110613. [Google Scholar] [CrossRef]
- Mirzayev, M.N.; Donkov, A.A.; Popov, E.A.; Demir, E.; Jabarov, S.H.; Chkhartishvili, L.; Adeojo, S.A.; Doroshkevich, A.S.; Sidorin, A.A.; Asadov, A.G.; et al. Modeling and X-ray analysis of defect nanoclusters formation in B4C under ion irradiation. Nanomaterials 2022, 12, 2644. [Google Scholar] [CrossRef]
- Rajendran, V.; Mekala, R. Effect of pure and REM:(Nd, Ce)-doped Dy2O3 NPs via hydrothermal method and their magnetic, optical, electrochemical, antibacterial and photocatalytic activities. J. Alloys Compd. 2018, 741, 1055–1069. [Google Scholar] [CrossRef]
- El Azab, I.; Thabet, H.K.; Almotairi, S.A.; Saleh, M.; Mogharbel, R.; Mahmoud, S.; El-Rayyes, A.; Ibrahim, A.; Zoromba, M.S.; Abdel-Aziz, M. Synthesis of a novel coumarin heterocyclic derivative and fabrication of hybrid nanocomposite thin film with CoOFe2O4 for optoelectronic applications. J. Mol. Struct. 2021, 1241, 130640. [Google Scholar] [CrossRef]
- Torun, H.Ö.; Kırkgeçit, R.; Dokan, F.K.; Öztürk, E. Preparation of La-Dy-CeO2 ternary compound: Examination of photocatalytic and photoluminescence properties. J. Photochem. Photobiol. A Chem. 2021, 418, 113338. [Google Scholar] [CrossRef]
- Schuyt, J.; Williams, G. Photoluminescence of Dy3+ and Dy2+ in NaMgF3: Dy: A potential infrared radiophotoluminescence dosimeter. Rad. Meas. 2020, 134, 106326. [Google Scholar] [CrossRef]
- Ma, C.; Wang, Y.; Zhang, J.; Hu, Y.; Zhai, Z.; Wu, J.; Zhou, W.; Lv, X. Photoluminescence and optical temperature sensing properties of Dy3+-doped Na0.5Bi0.5TiO3 multifunctional ferroelectric ceramics. Spectr. Acta A Molec. Biomol. Spectr. 2021, 254, 119636. [Google Scholar] [CrossRef]
- Agayev, F.G.; Trukhanov, S.V.; Trukhanov, A.V.; Jabarov, S.H.; Ayyubova, G.S.; Mirzayev, M.N.; Trukhanova, E.L.; Vinnik, D.A.; Kozlovskiy, A.L.; Zdorovets, M.V.; et al. Study of structural features and thermal properties of barium hexaferrite upon indium doping. J. Therm. Anal. Calor. 2022, 147, 14107–14114. [Google Scholar] [CrossRef]
- Kaur, R.; Bhatia, V.; Kumar, D.; Rao, S.; Singh, S.P.; Kumar, A. Physical, structural, optical and thermoluminescence behavior of Dy2O3 doped sodium magnesium borosilicate glasses. Res. Phys. 2019, 12, 827–839. [Google Scholar] [CrossRef]
- Oliveira, R.G.M.; de Morais, J.E.V.; Souza, D.C.; Silva, M.A.S.; Gouveia, D.X.; Trukhanov, S.; Trukhanov, A.; Panina, L.; Singh, C.; Zhou, D.; et al. High-bandwidth microwave dielectric resonator antennas from BiVO4/ZnO composites. J. Aust. Ceram. Soc. 2021, 57, 369–377. [Google Scholar] [CrossRef]
- Rammah, Y.; Zakaly, H.M.; Issa, S.A.; Tekin, H.; Hessien, M.; Saudi, H.; Henaish, A. Fabrication, physical, structural, and optical investigation of cadmium lead-borate glasses doped with Nd3+ ions: An experimental study. J. Mater. Sci. Mater. Electron. 2022, 33, 1877–1887. [Google Scholar] [CrossRef]
- Ghazy, A.R.; Shalaby, M.G.; Ibrahim, A.; ElShaer, A.; Mahmoud, Y.A.-G.; Al-Hossainy, A.F. Synthesis, structural and optical properties of Fungal biosynthesized Cu2O nanoparticles doped Poly methyl methacrylate-co-Acrylonitrile copolymer nanocomposite films using experimental data and TD-DFT/DMOl3 computations. J. Mol. Struct. 2022, 1269, 133776. [Google Scholar] [CrossRef]
- Almessiere, M.A.; Slimani, Y.; Algarou, N.A.; Vakhitov, M.G.; Klygach, D.S.; Baykal, A.; Zubar, T.I.; Trukhanov, S.V.; Trukhanov, A.V.; Attia, H.; et al. Tuning the structure, magnetic and high frequency properties of Sc-doped Sr0.5Ba0.5ScxFe12-xO19/NiFe2O4 hard/soft nanocomposites. Adv. Electron. Mater. 2022, 8, 2101124. [Google Scholar] [CrossRef]
- Almessiere, M.A.; Algarou, N.A.; Slimani, Y.; Sadaqat, A.; Baykal, A.; Manikandan, A.; Trukhanov, S.V.; Trukhanov, A.V.; Ercan, I. Investigation of exchange coupling and microwave properties of hard/soft (SrNi0.02Zr0.01Fe11.96O19)/(CoFe2O4)x nanocomposites. Mater. Today Nano 2022, 18, 100186. [Google Scholar] [CrossRef]
- Kenawy, E.L.; Ghazy, A.; Al-Hossainy, A.; Rizk, H.F.; Shendy, S. Synthesis, characterization, TD-DFT method, and optical properties of novel nanofiber conjugated polymer. Synth. Met. 2022, 291, 117206. [Google Scholar] [CrossRef]
- El Azab, I.H.; Ibrahim, A.; Abdel El-Moneim, M.; Zoromba, M.S.; Abdel-Aziz, M.H.; Bassyouni, M.; Al-Hossainy, A. A combined experimental and TDDFT-DFT investigation of structural and optical properties of novel pyrazole-1, 2, 3-triazole hybrids as optoelectronic devices. Phase Trans. 2021, 94, 794–814. [Google Scholar] [CrossRef]
- Hammerschmidt, T.; Kratzer, P.; Scheffler, M. Analytic many-body potential for InAs/GaAs surfaces and nanostructures: Formation energy of InAs quantum dots. Phys. Rev. B 2008, 77, 235303. [Google Scholar] [CrossRef]
- Mohamed, N.S.; Ahmed, M.M.; Yahia, A.; Ibrahim, S.M.; Al-Hossainy, A.F. Development of azithromycin–Pd mono nanocomposite: Synthesis, physicochemical, characterization and TD-DFT calculations. J. Mol. Struct. 2022, 1263, 133126. [Google Scholar] [CrossRef]
- Al-Ghamdi, H.; Almuqrin, A.H.; Koubisy, M.; Mahmoud, K.; Sayyed, M.; Darwish, M.; Henaish, A. Zinc-lead-borate glasses doped with dysprosium oxide: Structure, optical, and radiation shielding features. Optik 2021, 246, 167765. [Google Scholar] [CrossRef]
- Saudi, H.; Zakaly, H.M.; Issa, S.A.; Tekin, H.; Hessien, M.; Rammah, Y.; Henaish, A. Fabrication, FTIR, physical characteristics and photon shielding efficacy of CeO2/sand reinforced borate glasses: Experimental and simulation studies. Rad. Phys. Chem. 2022, 191, 109837. [Google Scholar] [CrossRef]
- Abdelhakim, N.A.; Shalaby, R.M.; Kamal, M. A study of structure, thermal and mechanical properties of free machining Al-Zn-Sn-Bi alloys rapidly solidified from molten state. World J. Eng. Technol. 2018, 6, 637–650. [Google Scholar] [CrossRef]
- Gilardi, R.; Flippen-Anderson, J.; George, C.; Butcher, R.J. A new class of flexible energetic salts: The crystal structures of the ammonium, lithium, potassium, and cesium salts of dinitramide. J. Am. Chem. Soc. 1997, 119, 9411–9416. [Google Scholar] [CrossRef]
- Brunton, G. Refinement of the structure of K2Cr2O7. Mater. Res. Bull. 1973, 8, 271–274. [Google Scholar] [CrossRef]
- Orlandi, P.; Meerschaut, A.; Palvadeau, P.; Merlino, S. Lead-antimony sulfosalts from Tuscany (Italy). V. Definition and crystal structure of moëloite. Pb6Sb6S14 (S3), a new mineral from the Ceragiola marble quarry. Eur. J. Mineral. 2002, 14, 599–606. [Google Scholar] [CrossRef]
- Al-Hossainy, A.F.; Abdelaal, R.M.; El Sayed, W.N. Novel synthesis, structure characterization, DFT and investigation of the optical properties of cyanine dye/zinc oxide [4-CHMQI/ZnO] C nanocomposite thin film. J. Mol. Struct. 2021, 1224, 128989. [Google Scholar] [CrossRef]
- Baghdadi, N.; Zoromba, M.S.; Abdel-Aziz, M.; Al-Hossainy, A.; Bassyouni, M.; Salah, N. One-dimensional nanocomposites based on polypyrrole-carbon nanotubes and their thermoelectric performance. Polymers 2021, 13, 278. [Google Scholar] [CrossRef]
- Clarisse, J. Croissance Cristalline de Polymères de Coordination: Synthèse, Suivi Calorimétrique et Caractérisation Structurale. Ph.D. Thesis, Université Claude Bernard-Lyon I, Villeurbanne, France, 2013. Available online: https://theses.hal.science/tel-01160427/document (accessed on 9 December 2013).
- Zoromba, M.S.; Alshehri, A.; Al-Hossainy, A.; Abdel-Aziz, M. Doped-poly (anthranilic acid-co-o-phenylene diamine) thin film for optoelectronic applications. Opt. Mater. 2021, 111, 110621. [Google Scholar] [CrossRef]
- Abd-Elmageed, A.; Al-Hossainy, A.; Fawzy, E.; Almutlaq, N.; Eid, M.R.; Bourezgui, A.; Abdel-Hamid, S.; Elsharkawy, N.; Zwawi, M.; Abdel-Aziz, M. Synthesis, characterization and DFT molecular modeling of doped poly (para-nitroaniline-co-para-toluidine) thin film for optoelectronic devices applications. Opt. Mater. 2020, 99, 109593. [Google Scholar] [CrossRef]
- Abrahams, B.F.; Hudson, T.A.; McCormick, L.J.; Robson, R. Coordination polymers of 2, 5-dihydroxybenzoquinone and chloranilic acid with the (10, 3)-a topology. Cryst. Growth Des. 2011, 11, 2717–2720. [Google Scholar] [CrossRef]
- Mahmoud, S.A.; Al-Hossainy, A.F.; Shaaban, E.R. Effect of implanted copper into 1 μm cadmium telluride thick film by heat treatment for optoelectronics: Structural, optical, and electrical properties. Int. J. Energy Res. 2021, 45, 20258–20269. [Google Scholar] [CrossRef]
- Ibrahim, A.; Abdel-Aziz, M.; Zoromba, M.S.; Al-Hossainy, A. Structural, optical, and electrical properties of multi-walled carbon nanotubes/polyaniline/Fe3O4 ternary nanocomposites thin film. Synth. Met. 2018, 238, 1–13. [Google Scholar] [CrossRef]
- Al-Hossainy, A.F.; Ibrahim, A. Synthesis, structural and optical properties of novel 3-(3, 5-dimethyl-1H-pyrazol-1-yl)-1-(diphenylphosphino)-2-((diphenylphosphino) methyl)-3-methylbutanone-1, 2-diphenylethane-1, 2-diamine tungsten dicarbonyl (PyrPMB-W) nanostructure thin film. Opt. Mater. 2015, 46, 131–140. [Google Scholar] [CrossRef]
- Tauc, J. Amorphous and Liquid Semiconductors; Springer: Boston, MA, USA, 1974. [Google Scholar]
- Mahmoud, S.A.; Al-Dumiri, A.A.; Al-Hossainy, A.F. Combined experimental and DFT-TDDFT computational studies of doped [PoDA+ PpT/ZrO2] C nanofiber composites and its applications. Vacuum 2020, 182, 109777. [Google Scholar] [CrossRef]
- Shalaby, R. Effect of rapid solidification on mechanical properties of a lead free Sn–3.5 Ag solder. J. Alloys Compd. 2010, 505, 113–117. [Google Scholar] [CrossRef]
- Han, K.; Zhang, Y.; Cheng, T.; Fang, Z.; Gao, M.; Xu, Z.; Yin, X. Self-assembled synthesis and photoluminescence properties of uniform Dy2O3 microspheres and tripod-like structures. Mater. Chem. Phys. 2009, 114, 430–433. [Google Scholar] [CrossRef]
- Badawi, A. Enhancement of the optical properties of PVP using Zn1-xSnxS for UV-region optical applications. Appl. Phys. A 2021, 125, 51. [Google Scholar] [CrossRef]
- Badawi, A. Engineering the optical properties of PVA/PVP polymeric blend in situ using tin sulfde for optoelectronics. Appl. Phys. A 2020, 126, 315. [Google Scholar] [CrossRef]
- Alharthi, S.S.; Badawi, A. Tailoring the linear and nonlinear optical characteristics of PVA/PVP polymeric blend using Co0.9Cu0.1S nanoparticles for optical and photonic applications. Opt. Mater. 2022, 127, 138701. [Google Scholar] [CrossRef]
- Badawi, A.; Alharthi, S.S.; Assaedi, H.; Alharbi, A.N.; Althobaiti, M.G. Cd0.9Co0.1S nanostructures concentration study on the structural and optical properties of SWCNTs/PVA blend. Chem. Phys. Lett. 2021, 775, 112255. [Google Scholar] [CrossRef]
- Al-Hosiny, N.M.; Abdallah, S.; Moussa, M.A.A.; Badawi, A. Optical, thermophysical and electrical characterization of PMMA (CdSe QDs) composite films. J. Polym. Res. 2013, 20, 76. [Google Scholar] [CrossRef]
- Zoromba, M.S.; Tashkandi, M.; Alshehri, A.; Abdel-Aziz, M.; Bassyouni, M.; Mahmoud, S.; Slimane, A.B.; Al-Hossainy, A. Polymer solar cell based on doped o-anthranilic acid and o-aminophenol copolymer. Opt. Mater. 2020, 104, 109947. [Google Scholar] [CrossRef]
- Vokhmintsev, A.; Kamalov, R.; Petrenyov, I.; Weinstein, I. Effect of annealing on photoluminescence properties in zirconium dioxide nanotubes. AIP Conf. Proc. 2020, 2313, 030033. [Google Scholar] [CrossRef]
- Rammah, Y.; Gaafar, M.; Marzouk, S.; ElRashidy, H.; Olarinoye, I.; El-Mallawany, R. Ultrasonic waves, mechanical properties and radiation shielding competence of Er3+ doped lead borate glasses: Experimental and theoretical investigations. J. Aust. Ceram. Soc. 2021, 57, 1163–1176. [Google Scholar] [CrossRef]
- Zaid, M.; Sidek, H.; El-Mallawany, R.; Almasri, K.; Matori, K. Synthesis and characterization of samarium doped calcium soda–lime–silicate glass derived wollastonite glass–ceramics. J. Mater. Res. Technol. 2020, 9, 13153–13160. [Google Scholar] [CrossRef]
- Ibrahim, S.M.; Al-Hossainy, A.F. Synthesis, structural characterization, DFT, kinetics and mechanism of oxidation of bromothymol blue: Application to textile industrial wastewater treatment. Chem. Pap. 2021, 75, 297–309. [Google Scholar] [CrossRef]
- Gomaa, H.M.; Elkatlawy, S.M.; Yahia, I.; Saudi, H.; Abdel-Ghany, A. Influence of the gradual increase of TiO2-impurities on the structural and optical properties of some calcium sodium borate glasses. Optik 2021, 244, 167543. [Google Scholar] [CrossRef]
- Henaish, A.; Mostafa, M.; Salem, B.; Zakaly, H.M.; Issa, S.A.; Weinstein, I.; Hemeda, O. Spectral, electrical, magnetic and radiation shielding studies of Mg-doped Ni–Cu–Zn nanoferrites. J. Mater. Sci. Mater. Electron. 2020, 31, 20210–20222. [Google Scholar] [CrossRef]
- Ibrahim, A.; Al-Hossainy, A. Thickness dependence of structural and optical properties of novel 2-((1, 1-bis (diphenylphosphino)-2-phenylpropan-2-yl)-chromium tetracarbonyl-amino)-3-phenylpropanoic acid copper (II)(DPP-Cr-Palan-Cu) nanocrystalline thin film. Synth. Met. 2015, 209, 389–398. [Google Scholar] [CrossRef]
- Henaish, A.; Salem, B.; Meaz, T.; Alibwaini, Y.A.; Ajlouni, A.-W.; Hemeda, O.; Arrasheed, E.A. Synthesize, characterization, dielectric, linear and nonlinear optical properties of Ni–Al Ferrite/PANI nanocomposite film. Opt. Mater. 2021, 119, 111397. [Google Scholar] [CrossRef]
- Krbal, M.; Wagner, T.; Vlcek, M.; Vlcek, M.; Frumar, M. Optical properties and structure of amorphous films Agx(As0.33S0.67−ySey)100−x. J. Non-Cryst. Solids 2006, 352, 2662–2666. [Google Scholar] [CrossRef]
- Mahmoud, I.; Issa, S.A.; Zakaly, H.M.; Saudi, H.; Ali, A.S.; Saddeek, Y.B.; Alharbi, T.; Tekin, H. Material characterization of WO3/Bi2O3 substituted calcium-borosilicate glasses: Structural, physical, mechanical properties and gamma-ray resistance competencies. J. Alloys Compd. 2021, 888, 161419. [Google Scholar] [CrossRef]
- Henaish, A.; El-Sharkawy, A.; Shama, S.; Hemeda, O.; Ghazy, R. Structure and optical properties of nano NixCd1-xFe2O4 doped with optical dyes. J. Phys. Conf. Ser. 2019, 1253, 012024. [Google Scholar] [CrossRef]
- Ali, M.; Hemeda, O.; Henaish, A. Tailoring changes in the physical, structural and linear optical properties of SrCuTi2Fe14O27 W-type hexaferrite-doped PVA polymeric composite films. J. Mater. Sci. Mater. Electron. 2021, 32, 16038–16051. [Google Scholar] [CrossRef]
- Jain, A.; Banerjee, M.; Mukherjee, G. Effect of UV irradiation on optical properties of pristine and MnCl2 doped PVA films. Mater. Today Proc. 2021, 47, 697–703. [Google Scholar] [CrossRef]
- Suhail, M.H. Structural and optical properties for PVA-PEG-MnCl2 composites. Iraqi J. Phys. 2017, 15, 99–113. [Google Scholar] [CrossRef]
- Shibutani, T.; Yu, Q.; Shiratori, M. A study of deformation mechanism during nanoindentation creep in tin-based solder balls. J. Electron. Packag. 2007, 129, 71–75. [Google Scholar] [CrossRef]
- Cao, Z.; Li, P.; Meng, X. Nanoindentation creep behaviors of amorphous, tetragonal, and bcc Ta films. Mater. Sci. Eng. A 2009, 516, 253–258. [Google Scholar] [CrossRef]
- Tuleushev, A.Z.; Harrison, F.E.; Kozlovskiy, A.L.; Zdorovets, M.V. Evolution of the absorption edge of PET films irradiated with Kr ions after thermal annealing and ageing. Opt. Mater. 2021, 119, 111348. [Google Scholar] [CrossRef]
- Zdorovets, M.V.; Kozlovskiy, A.L.; Borgekov, D.B.; Shlimas, D.I. Influence of irradiation with heavy Kr15+ ions on the structural, optical and strength properties of BeO ceramic. J. Mater. Sci. Mater. Electron. 2021, 32, 15375–15385. [Google Scholar] [CrossRef]
- Kozlovskiy, A.L.; Alina, A.; Zdorovets, M.V. Study of the effect of ion irradiation on increasing the photocatalytic activity of WO3 microparticles. J. Mater. Sci. Mater. Electron. 2021, 32, 3863–3877. [Google Scholar] [CrossRef]
- Kozlovskiy, A.L.; Zdorovets, M.V. Study of hydrogenation processes in radiation-resistant nitride ceramics. J. Mater. Sci. Mater. Electron. 2020, 31, 11227–11237. [Google Scholar] [CrossRef]
- Korolkov, I.V.; Zhumanazar, N.; Gorin, Y.G.; Yeszhanov, A.B.; Zdorovets, M.V. Enhancement of electrochemical detection of Pb2+ by sensor based on track-etched membranes modified with interpolyelectrolyte complexes. J. Mater. Sci. Mater. Electron. 2020, 31, 20368–20377. [Google Scholar] [CrossRef]
- Shlimas, D.I.; Kozlovskiy, A.L.; Zdorovets, M.V. Study of the formation effect of the cubic phase of LiTiO2 on the structural, optical, and mechanical properties of Li2±xTi1±xO3 ceramics with different contents of the X component. J. Mater. Sci. Mater. Electron. 2021, 32, 7410–7422. [Google Scholar] [CrossRef]
- Kozlovskiy, A.L.; Shlimas, D.I.; Zdorovets, M.V. Synthesis, structural properties and shielding efficiency of glasses based on TeO2-(1-x)ZnO-xSm2O3. J. Mater. Sci. Mater. Electron. 2021, 32, 12111–12120. [Google Scholar] [CrossRef]
- Kozlovskiy, A.; Egizbek, K.; Zdorovets, M.V.; Ibragimova, M.; Shumskaya, A.; Rogachev, A.A.; Ignatovich, Z.V.; Kadyrzhanov, K. Evaluation of the efficiency of detection and capture of manganese in aqueous solutions of FeCeOx nanocomposites doped with Nb2O5. Sensors 2020, 20, 4851. [Google Scholar] [CrossRef] [PubMed]
- Zdorovets, M.V.; Kozlovskiy, A.L.; Shlimas, D.I.; Borgekov, D.B. Phase transformations in FeCo—Fe2CoO4/Co3O4-spinel nanostructures as a result of thermal annealing and their practical application. J. Mater. Sci. Mater. Electron. 2021, 32, 16694–16705. [Google Scholar] [CrossRef]
Disclaimer/Publisher’s Note: The statements, opinions and data contained in all publications are solely those of the individual author(s) and contributor(s) and not of MDPI and/or the editor(s). MDPI and/or the editor(s) disclaim responsibility for any injury to people or property resulting from any ideas, methods, instructions or products referred to in the content. |
© 2023 by the authors. Licensee MDPI, Basel, Switzerland. This article is an open access article distributed under the terms and conditions of the Creative Commons Attribution (CC BY) license (https://creativecommons.org/licenses/by/4.0/).