Article

Preparation of Ag/C Nanocomposites Based on Silver Maleate and Their Use for the Analysis of Iodine Ions

by
Igor E. Uflyand
1,*,
Marina O. Gorbunova
1,2,
Vladimir A. Zhinzhilo
1,
Tatiana S. Kolesnikova
1,
Anastasiya O. Zarubina
1,
Rose K. Baimuratova
3 and
Gulzhian I. Dzhardimalieva
3,4
1
Department of Chemistry, Southern Federal University, 344090 Rostov-on-Don, Russia
2
Rostov State Medical University of the Ministry of Healthcare of Russian Federation, 344022 Rostov-on-Don, Russia
3
Federal Research Center of Problems of Chemical Physics and Medicinal Chemistry, Russian Academy of Sciences, 142432 Chernogolovka, Russia
4
Moscow Aviation Institute, National Research University, 125993 Moscow, Russia
*
Author to whom correspondence should be addressed.
J. Compos. Sci. 2022, 6(12), 384; https://doi.org/10.3390/jcs6120384
Submission received: 31 October 2022 / Revised: 23 November 2022 / Accepted: 8 December 2022 / Published: 12 December 2022
(This article belongs to the Special Issue Metal Composites)

Abstract

:
In recent decades, metal-containing nanocomposites have attracted considerable attention from researchers. In the present study, a detailed analysis of the preparation of Ag/C nanocomposites through the thermolysis of silver maleate was carried out. Thermolysis products are nanocomposites containing silver nanoparticles (NPs) uniformly distributed in a stabilizing carbon matrix. The composition, structure, and properties of the obtained nanocomposites were studied using IR-spectroscopy, X-ray diffraction (XRD), atomic force microscopy (AFM), scanning electron microscopy (SEM), transmission electron microscopy (TEM), and energy dispersive X-ray spectroscopy (EDS). This article reports on the possibility of using Ag/C nanocomposites to create new indicator papers that are sensitive to iodide ions in the concentration range of 0.03–1.6 mg/L (0.24–12.6 μM). The developed papers are used in a technique based on the oxidation of iodides with the formation of molecular iodine, which is extracted in an air stream and transferred to a sensitive paper layer containing silver NPs. The interaction of silver NPs with iodine leads to optical changes that can be tracked using a conventional scanner.

1. Introduction

At present, numerous methods have been developed for obtaining functional metal-containing nanocomposites [1,2,3,4]. The most important task of increasing the aggregative stability of reactive nanoparticles (NPs) with an advanced surface is the passivation of their surface with the help of various stabilizers [5]. The properties of such materials depend on the synergy between NPs and the matrix and are determined by the nano/microstructure, as well as the degree of their organization. The synthesis of metal-containing nanocomposites is based on two groups of methods: ex situ and in situ [6,7]. The ex situ method includes the preliminary production of metal NPs and their subsequent introduction into the matrix by pre- or post-synthesis methods. The widespread use of this approach is explained by the absence of restrictions in the choice of the nature of metal NPs and, in most cases, the matrix. Difficulties in the application of this method are associated with the complexity of the dispersion of metal NPs.
Such difficulties can be avoided by obtaining metal-containing nanocomposites by the in situ method, which combines in situ formation of metal NPs and (or) in situ formation of a matrix. The use of this method is more promising due to the one-step procedure, which uses a matrix with the required molecular weight, composition, and structure, and metal NPs are formed in situ through the dissolution of inorganic precursors in a suitable solvent.
Thermolysis of suitable precursors is a universal, convenient, and generally well reproducible method for obtaining nanocomposites [8]. Under certain conditions, this process is environmentally friendly and easily controlled. At the thermolysis stage, it is convenient to introduce various additives into matrices, including metal-containing additives, which simultaneously change the thermolysis mechanism and lead to several interesting products [9]. One of the practical directions of thermolysis is the production of carbon nanomaterials, various ceramics, and nanocomposites with a “core-shell” structure. On the other hand, thermolysis is a complex process, during which the whole spectrum of chemical transformations is manifested: destruction, crosslinking of chains, transformation of functional groups, and intramolecular rearrangements [10]. It should be noted that the study of such reactions is also relevant for many accompanying processes; for example, the combustion of polymers, components of solid rocket fuels, polymeric binders for the thermal protection of spacecraft, etc. An analysis of the literature data shows that the approach based on (co)polymerization and transformations of metal-containing monomers is recognized as one of the promising one-stage methods for creating functional metal-containing nanocomposites [11]. It is convenient to use and versatile in terms of the type of products obtained.
Recently, the thermolysis of metal-containing monomers, which act as single-source precursors for obtaining a nanocomposite contained metal nanoparticles (NPs) in a carbon or polymer shell, has been actively studied [12]. Metal-containing monomers have been studied most extensively by the example of unsaturated metal carboxylates, the simplest representatives of which are the corresponding acrylates [13,14,15]. In addition, carboxylate complexes have an interesting structure, which is mainly due to the different ways of binding metal ions with carboxylate groups [14]. Metal derivatives of unsaturated carboxylic acids constitute a large group of metal-containing monomers that are of interest both in terms of coordination and polymer chemistry [16,17,18,19].
Silver NPs favorably stand out among various metal NPs due to the manifestation of a wide range of properties: plasmonic, antibacterial, and catalytic activity, chemical stability, and good thermal and electrical conductivity [20,21,22,23,24]. An undoubtable advantage of this is that the integration of silver NPs into carbon-containing nanomaterials will not only increase their antibacterial efficacy, biocompatibility, and durability, but also reduce their biotoxicity and make these materials more environmentally friendly [25].
It should be noted that silver-containing salts of unsaturated mono- [26,27,28] and dicarboxylic [29,30,31,32,33,34] acids attract the attention of chemists as precursors of various nanocomposites. They make it possible to obtain a wide variety of Ag/C nanocomposites [35,36,37,38,39,40,41,42], which can subsequently be used in many areas, including chemical analysis [43,44,45,46,47,48]. The use of carbon as a matrix is due to its very promising physical, chemical and mechanical properties. The properties of metal-carbon nanocomposites depend on the character of the phase interaction and the structure of the interfacial regions, the volume fraction of which can reach 50%. Interfacial regions have specific mechanical properties that differ from those of both the matrix and metal NPs. In nanocomposites, the surface of NPs is bound to the carbon matrix and forms ionic and coordination bonds that limit the mobility of molecular chains and their segments.
Previously, we described the use of silver NPs in the analysis of halides [49,50,51,52,53,54,55,56]. In continuation of these studies, in this work, we investigated the possibility of using Ag/C nanocomposites to obtain new test strips that change their color upon contact with iodine. Considering that iodine in molecular form is quite rare in the objects of analysis, the determination of iodide ions is of greater interest. Therefore, we suggest first oxidizing iodides in solution, then extracting iodine with an air stream to interact with Ag/C nanocomposites on the surface of the test strip outside the analyzed solution.

2. Materials and Methods

2.1. Starting Materials

Silver nitrate (AgNO3, ≥99.0%), maleic acid (C4H4O4, ≥99.0%), and sodium hydroxide (≥99.0%) were purchased from Sigma-Aldrich and used without further purification. Sulfuric acid, potassium permanganate, potassium iodide and xylene, corresponding to the qualification “pure for analysis”, were purchased from the trading company “Vekton” (Russia).

2.2. Synthesis of Silver Maleate

The preparation procedure is carried out in a room with diffused light or under illumination through a red-light filter. A sample of NaOH (0.4 g, 0.1 mol) was dissolved in 50 mL of bidistilled water and maleic acid (0.58 g, 0.05 mol) was added to it with constant stirring, and the reagents were completely dissolved. In another beaker, AgNO3 (1.7 g, 0.1 mol) and 20 mL of bidistilled water were placed. The contents of both glasses are gradually mixed with constant stirring on a magnetic stirrer. The formation of a white precipitate was observed, and the rate of its formation increased with time. The resulting precipitate was left for 12 h. After the specified time, it was filtered through a porous glass plate, protected from direct light. The precipitate was dried first in air at room temperature, and then heated to 60 °C for 8 h. In total, 1.7 g of a white crystalline powder was obtained, which is 92.9% of the theoretical yield in terms of silver maleate dihydrate. Found, %: C—12.99; H—1.72; Ag—59.7; O—25.59 (by calculation). Calculated for C4H6O6Ag2 (C4H2O4Ag2·2H2O), %: C—13.11; H—1.6; Ag—59.01; O—26.28 (by calculation).

2.3. Characterization Techniques

Elemental analysis was performed using a CHNOS vario EL cube analyzer (Elementar Analysensysteme GmbH, Langenselbold, Germany). Silver was determined on an energy dispersive X-ray fluorescence spectrometer «X-Art M» (Comita, St. Petersburg, Russian) or atomic absorption spectrometer «MGA-915» (Lumex, Russia). The Fourier transform IR (FTIR) spectra were recorded with a Perkin Elmer Spectrum 100 FTIR spectrometer (Perkin Elmer, Waltham, MA, USA) from KBr pellets using Softspectra data analysis software (Shelton, CT, USA). Thermal analysis (TA) and differential scanning calorimetry (DSC) were carried out on a synchronous thermal analyzer STA 409CLuxx coupled to quadrupole mass spectrometer QMS 403CAeolos (NETZSCH, Selb, Germany) and on a Perkin-Elmer Diamond TG/DTA derivatograph (Perkin Elmer, Waltham, MA, USA) in a helium flow (powders weighing from 0.3 to 0.4 g) with standard α-Al2O3, the rate was 2°/min in temperature range 20–500 °C. X-ray diffraction (XRD) analysis was carried out on the diffractometers DRON-UM-2 (JSC “Burevestnik”, St. Petersburg, Russia), Philips PW 1050 (Philips Analytical X-Ray B.V., Almelo, The Netherlands) and ARL™ X’TRA Powder (Thermo Fisher Scientific, Waltham, MA, USA) with CuKα radiation (λCu = 1.54184 Å) in the range of 2θ = 5–80° angles 2θ with a scanning speed of 5°/min and a temperature of 25 °C to determine the phase composition and crystallite size. The sizes of the crystallites of nanomaterials (D, nm) were determined by the Debye-Scherrer Equation (1) [57]:
D = K   λ   β cos θ ;
where K is a constant (ca. 0.9); λ is the X-ray wavelength used in XRD (1.5418 Å); θ is the Bragg angle; β is the pure diffraction broadening of the peak at half-height, i.e., the broadening due to the size of the crystallites.
Scanning electron microscopic (SEM) images were obtained using a ZEISS Crossbeam 340 device (Carl Zeiss, Jena, Germany) at an accelerating voltage of 3 kV. Secondary electrons were recorded with an Everhart-Thornley detector (SE2). The distribution of chemical elements on the surface of the samples was determined by X-ray energy dispersive microanalysis (EDX) on an Oxford X-max 80 microanalyzer with an electron probe energy of ≤10 keV. High-resolution transmission electron microscopy (HRTEM) was performed on a Tecnai G2 Spirit BioTWIN FEI high-resolution transmission microscope (The Netherlands). The samples were prepared as follows: a suspension of the powder in hexane was prepared, deposited on a carbon-coated copper grid, and the solvent was dried in air.
Atomic force microscopy (AFM) was performed on a PHYWE Compact AFM (PHYWE, Göttingen, Germany) in the semicontact mode using a wide-range piezoelectric scanner that provides lateral scanning up to 105 μm (x-y) and scanning in the vertical (z) direction up to 5000 μm at a scanning speed of 1000 μm × 1000 μm/min. Scanning was carried out with a probe made of single-crystal silicon with an aluminum coating, with a resonant frequency of 190 ± 60 kHz and a constant hardness of 48 N/m. The scanning speed is 0.3 ms/line. Before the AFM analysis of the synthesized metal powders, they were sonicated in ethanol for 30 min. Then, the colloidal solution was applied to a cover glass and dried in air. The AFM images were analyzed using the Gwyddion 2.10 program [58].

2.4. Thermolysis of Silver Maleate

Thermolysis of the silver maleate was carried out under two conditions: solid-state thermolysis and thermolysis in xylene.
In the case of solid-state thermolysis, the silver maleate (0.9 g) was introduced into a quartz test tube with a height of 10 cm and diameter of 2.8 cm, which was then placed into a quartz tube, 30 cm long and 6 cm in diameter, sealed at one end. The assembled device is evacuated to a residual pressure of 4 mm Hg and filled with argon (99.99%) through a hydraulic seal, in which silicone oil was used as a sealing fluid. After that, the assembled device was heated to 400 °C (heating rate was 5 °C/min), after which the argon and thermolysis products were pumped out, creating a residual vacuum of 4–6 mm Hg and kept in dynamic vacuum at the indicated temperature for 1 h. After the time had elapsed, the heating was turned off and the reaction mixture was left to reach room temperature in a dynamic vacuum. As a result, 0.32 g of black powder was obtained.
In the case of thermolysis in xylene, a weighed portion of silver maleate was placed in a flask with o-xylene, a reflux condenser was attached, and maintained at the boiling point of xylene (144 °C) for 8 h (Figure 1). The thermolysis product was separated using a porous plate under vacuum, washed with three portions of hexane, 50 mL each, dried first in air and then in vacuum at 80 °C for 6 h. Thus, a black powder was obtained. IR spectrum, cm−1: 3420, 1608, 1542, 1382, 768, 631, 620. Elemental analysis, %: C—15.63; H—2.67; Ag—69.74; O—11.96.

2.5. Study of the Thermolysis Kinetics

The kinetics of the isothermal transformations of silver maleate was studied based on gas evolution using a membrane zero manometer. Thermolysis was carried out under static isothermal conditions at temperatures Texp in an argon atmosphere. At the end of the experiments, the weight loss of the sample (Δm, wt.%) and the amounts of gaseous products at ~20 °C were determined. The volume of the heated tube did not exceed 0.05 V. The ratio m0/V = (0.60 − 3.85) × 103 g cm3, where m0 is the initial weight of the sample.

2.6. Preparation of the Nanocomposites

To obtain nanocomposites, we used the classical method: a sample of silver maleate (0.8 g) was placed in a quartz test tube (height of 10 cm and diameter of 2.8 cm), located in a quartz tube (height of 30 cm and diameter of 6 cm) sealed at one end. The assembled device was evacuated to a residual pressure of 6 mm Hg and filled with nitrogen (99.99%) through a hydraulic seal, in which silicone oil was used as a sealing liquid. Then, the assembled device was heated to a temperature of 400 °C, the heating rate was 5°/min. Nitrogen and thermolysis products were pumped out, maintaining a residual vacuum of 4–6 mm Hg, and left in dynamic vacuum at the given temperature for 1 h. Then, the heating was turned off and the setup was cooled to room temperature in a dynamic vacuum. The products were removed in the form of a porous column 20–25 mm high and crushed. As a result, 0.6 g of black powder was synthesized.

2.7. Procedure of Analysis of Iodine Ions

Working solutions were prepared by dissolving their weighed portions and dilution in deionized water obtained using Millipore Simplicity water purification system (Merk Millipore, Burlington, MA, USA). For the manufacture of the paper test strips, modified with Ag NPs, we used Whatman Grade 113 paper (Whatman International Ltd., Maidstone, UK). The weight of the substances was determined on an analytical balance of the 2nd class VLR-20 (Gosmeter) with an error of ±0.0001 g. The initial solution containing iodide ions had a concentration of 0.01 g L1.
The working solutions were placed in a setup for dynamic gas extraction, shown in Figure 2. It consisted of a glass vessel for the analyzed solution (3) closed with a rubber stopper (1), inside which there was a test strips holder (4) with a clamped test strip (2), an air microcompressor (8) connected to a glass bubbler (6), soldered into the vessel, with a polymer hose (7). Then, the solutions of potassium permanganate and sulfuric acid were added to the working solutions. A Hailea Aco-6601 microcompressor was used to pump air through the reactive system under laboratory conditions. The strips were removed and scanned using Canon CanoScan LiDE 210 (Canon) against a white background at 300 ppi. The scanned images were processed in Adobe Photoshop 7.0 in the RGB mode by averaging the RGB color coordinates of individual pixels within a circular reactive zone.

2.8. Preparation of Paper Test Strips Modified with Ag NPs

The modification of the paper with Ag NPs was performed by impregnation. A 1.5 mL portion of Ag NPs solution, with a concentration of Ag NPs of 0.62 mg/mL, was placed into a Petri dish. Then, a Whatman Grade 113 paper strip (6.0 × 7.0 cm, m = 0.47 g) was placed into the dish to cover the solution portion. This was accompanied by the rapid and quite uniform distribution of the solution across the paper. Then, the paper strip was dried in air for 36 h. The operation was repeated 3 times. The content of Ag NPs on the paper was calculated based on the added total amount of the Ag NP solution. In this case, this corresponds to the amount of precipitated Ag NPs 0.62 mg/g. The modified paper was cut into test strips and placed inside the test strip holder of the reaction system for analysis.

2.9. Calibration

To construct a calibration curve, 0.3-; 0.5-; 1.0-; 2.0-; 4.0-; 8.0-, and 16.0-mL aliquots of 0.01 g L−1 iodide solution were pipetted into 100 mL volumetric flasks and diluted up to the mark with distilled water. These solutions were successively placed into the reaction glass vessel (see Figure 2). Then, 2 mL of concentrated sulfuric acid and 10 mL of 0.2 M KMnO4 were added. The neck of the vessel was tightly closed with a stopper containing a test strips holder with the Ag NPs modified test strip attached. An air microcompressor was switched on and the air was bubbled through the solution at a rate of 2.8–3.0 L min−1 for 15 min. Then, the test strip was removed and scanned. The resulting image was analyzed in terms of the R-, G-, B-color coordinates. The color coordinate B was used to plot the calibration curve.

3. Results

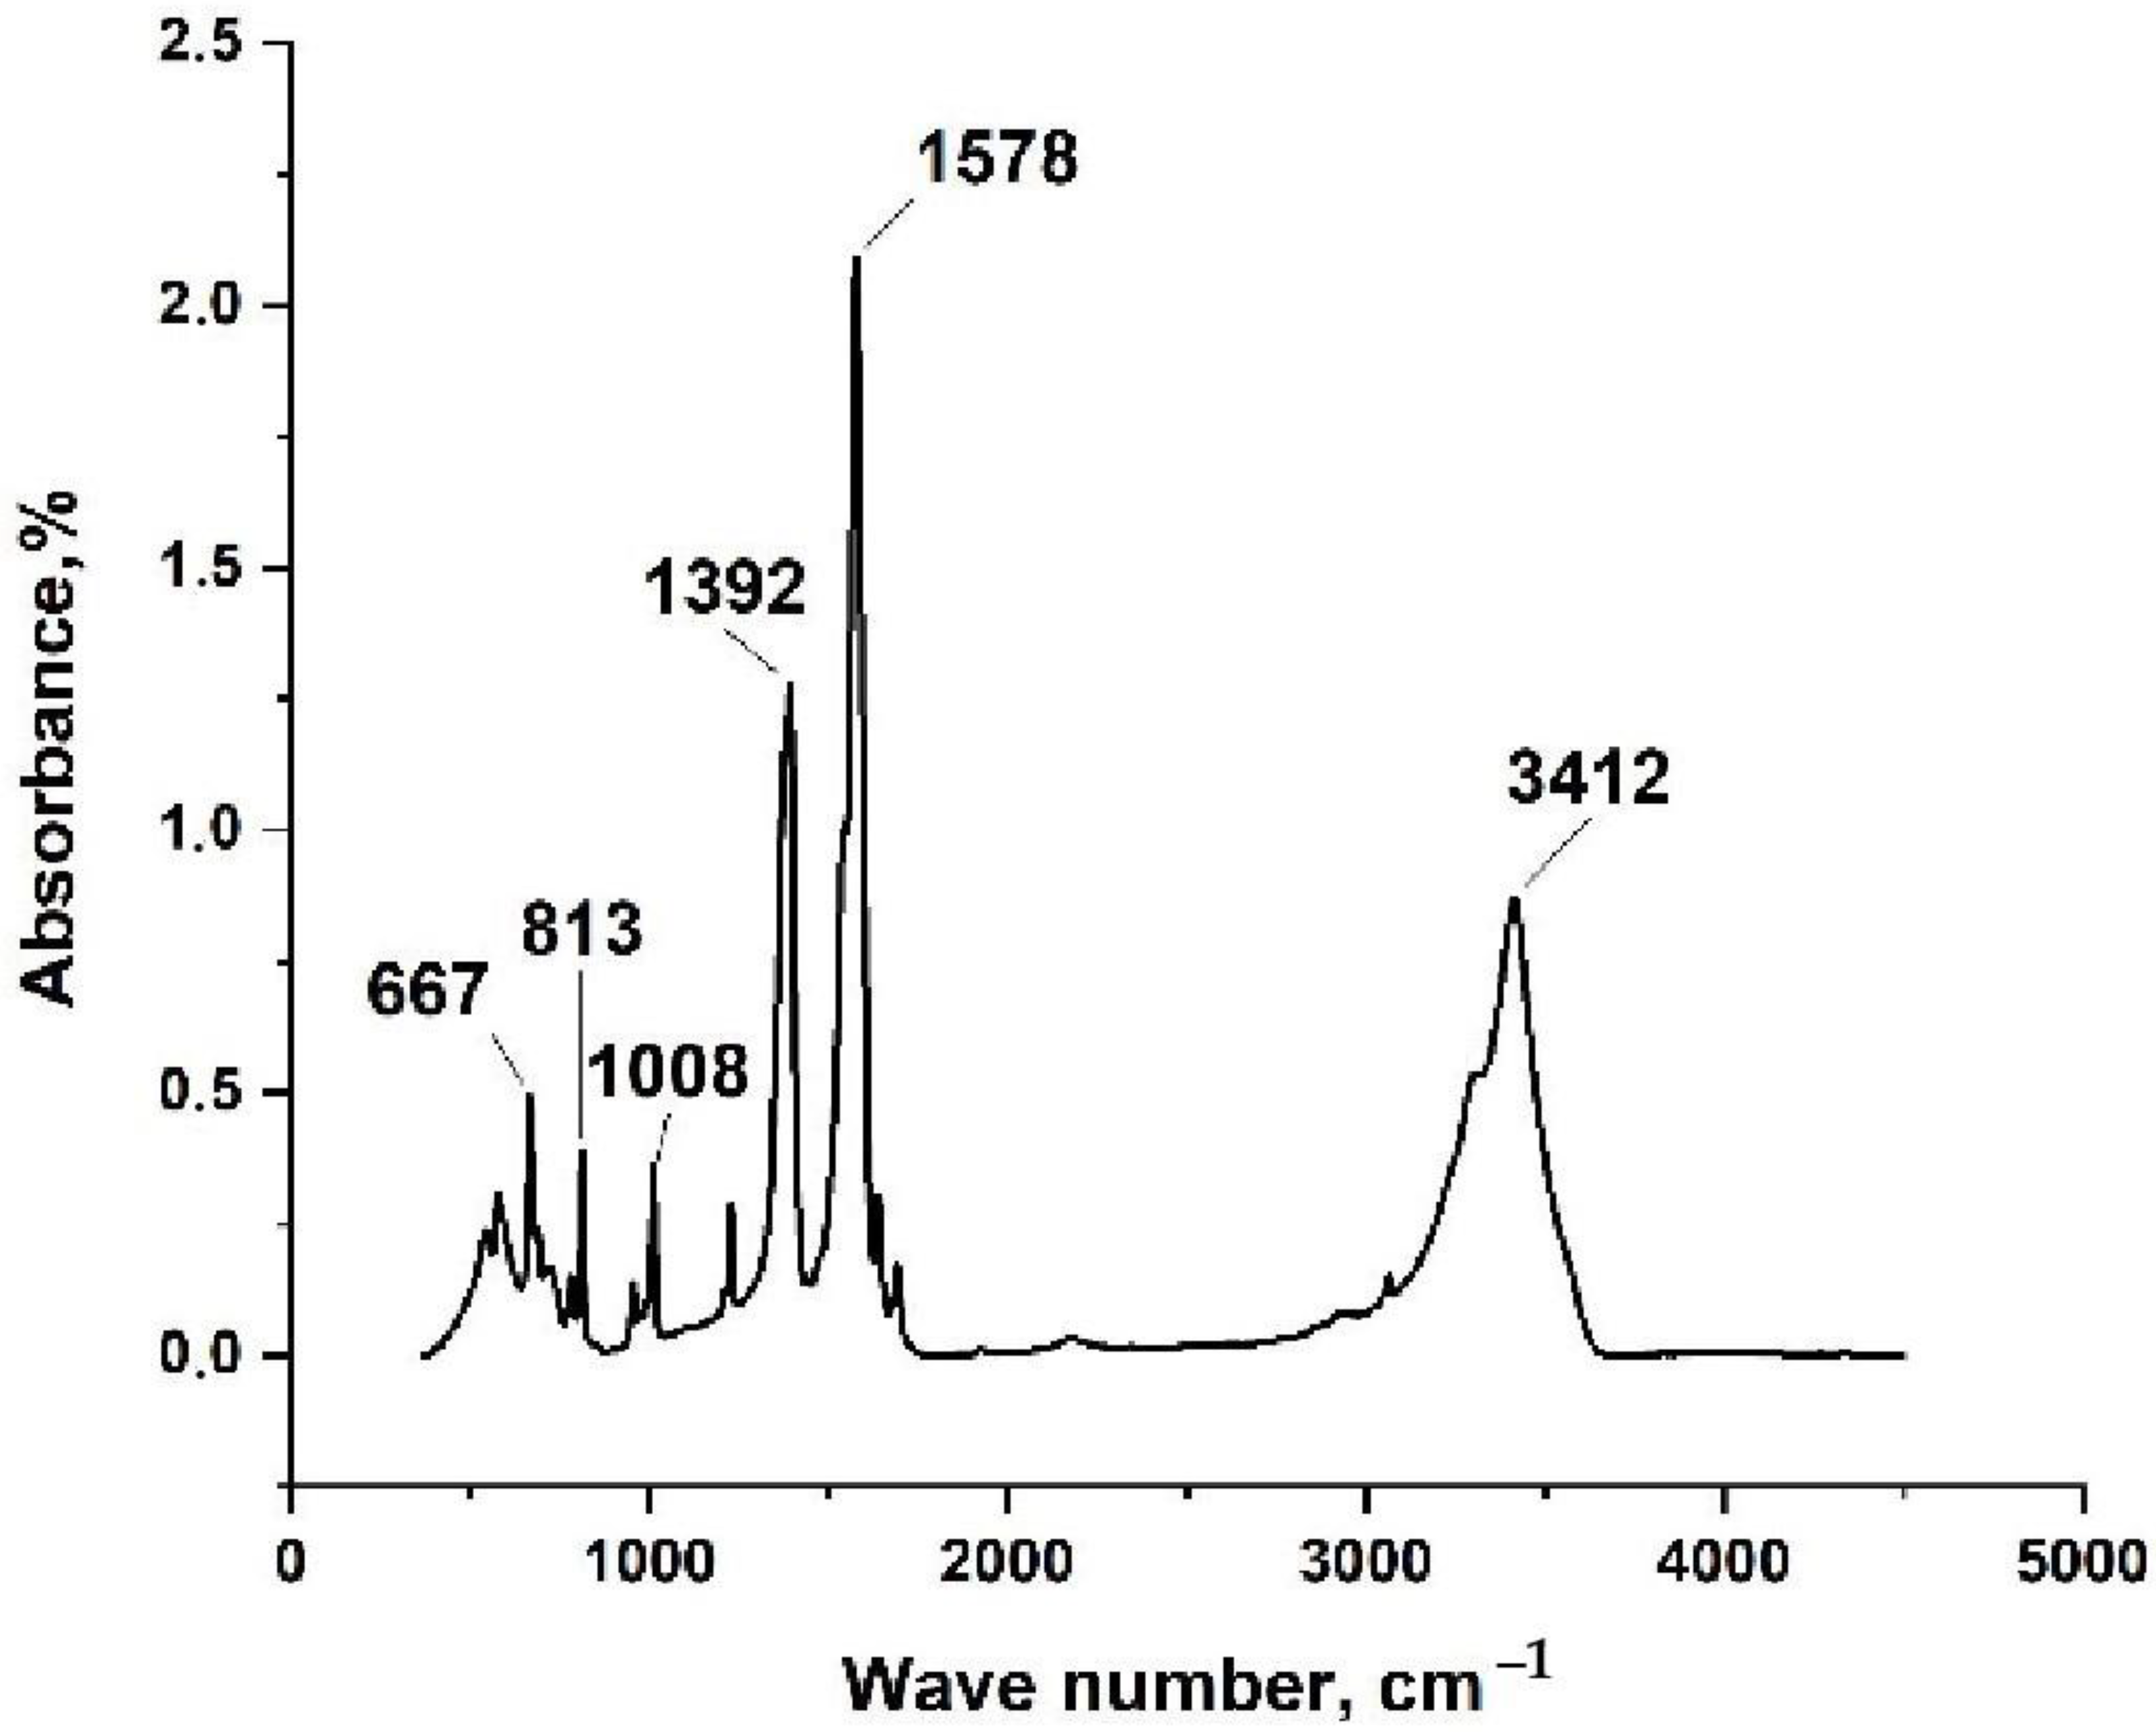
3.1. Synthesis and Characterization of Silver Maleate

In this study, silver maleate was obtained through the direct interaction of silver nitrate with maleic acid by mixing their aqueous solutions in an alkaline medium. FT-IR, TGA, and DSC were first used to confirm the structure of silver maleate. In the IR spectrum of silver maleate (Figure 3), the band at 3412 cm1 corresponds to crystallization water; the bands at 1392 and 1578 cm1 refer to symmetric and asymmetric vibrations of the carboxyl group. The obtained value Δν is 186 cm1, which may indicate a bidentate method of coordination of the metal-carboxyl group bond (C symmetry) [59,60].
The thermogram of silver maleate is shown in Figure 4. Thermal evolution proceeds in three stages. At the first stage, a weight loss of 11% is observed in the temperature range of 225–262 °C (red line). The decrease in weight can be explained by the dehydration of the compound, which agrees satisfactorily with the theoretical calculation (9.8%). The second stage begins almost immediately after the dehydration stage and proceeds in the temperature range of 263.2–307.96 °C. At this stage, intense gas evolution is observed and an impression of the formation of a “boiling solid layer” is created in the vessel, accompanied by an explosive release of a part of the thermolysis product in the temperature range of 290–300 °C. The weight loss at this stage of thermolysis is 15.93%, which is explained by complete decarboxylation and also satisfactorily correlates with the theoretical calculation (15.27%) (yellow line). The third stage is associated with deep destructive processes and is characterized by an insignificant weight loss (2.92%) in a wide temperature range of 309–600 °C (pink line).
The dynamics of changes in the degree of carbon dioxide conversion during thermolysis is shown in Figure 5. When the sample is heated in the temperature range between 263 and 286 °C, a relatively slow evolution of gas occurs, which corresponds to no more than 10% of the thermal destruction of the substance. In a very narrow range, between 288 and 298 °C, an explosive release of carbon dioxide occurs, corresponding to the decomposition of almost 80% of the initially taken substance, and then, again, a low intensity of gas release is observed.
Three peaks are observed on the DSC curve (Figure 6). The first peak was recorded in the temperature range of between 231.82 and 249.57 °C. It reaches its maximum at 242.61 °C and has a mixed character: starting from an endothermic effect, the peak turns into an exothermic effect, characterized by a small thermal value of 72.9 mJ. The first peak almost immediately passes into the second peak, for which an exothermic effect is observed. The beginning of the peak was recorded at a temperature of 245.7 °C, the maximum at 258.92 °C, and the end at 262.57 °C. It should be noted that the second peak is pronounced. The thermal effect is 278.29 mJ. The third section of the DSC curve can be characterized as a wide, but slowly developing, exothermic effect with a rather pronounced heat balance of 278.29 mJ. It starts at 275.87 °C, reaches its maximum at 300 °C, and ends at 318.27 °C. According to its characteristics, it coincides with the second stage of thermal destruction of silver maleate.

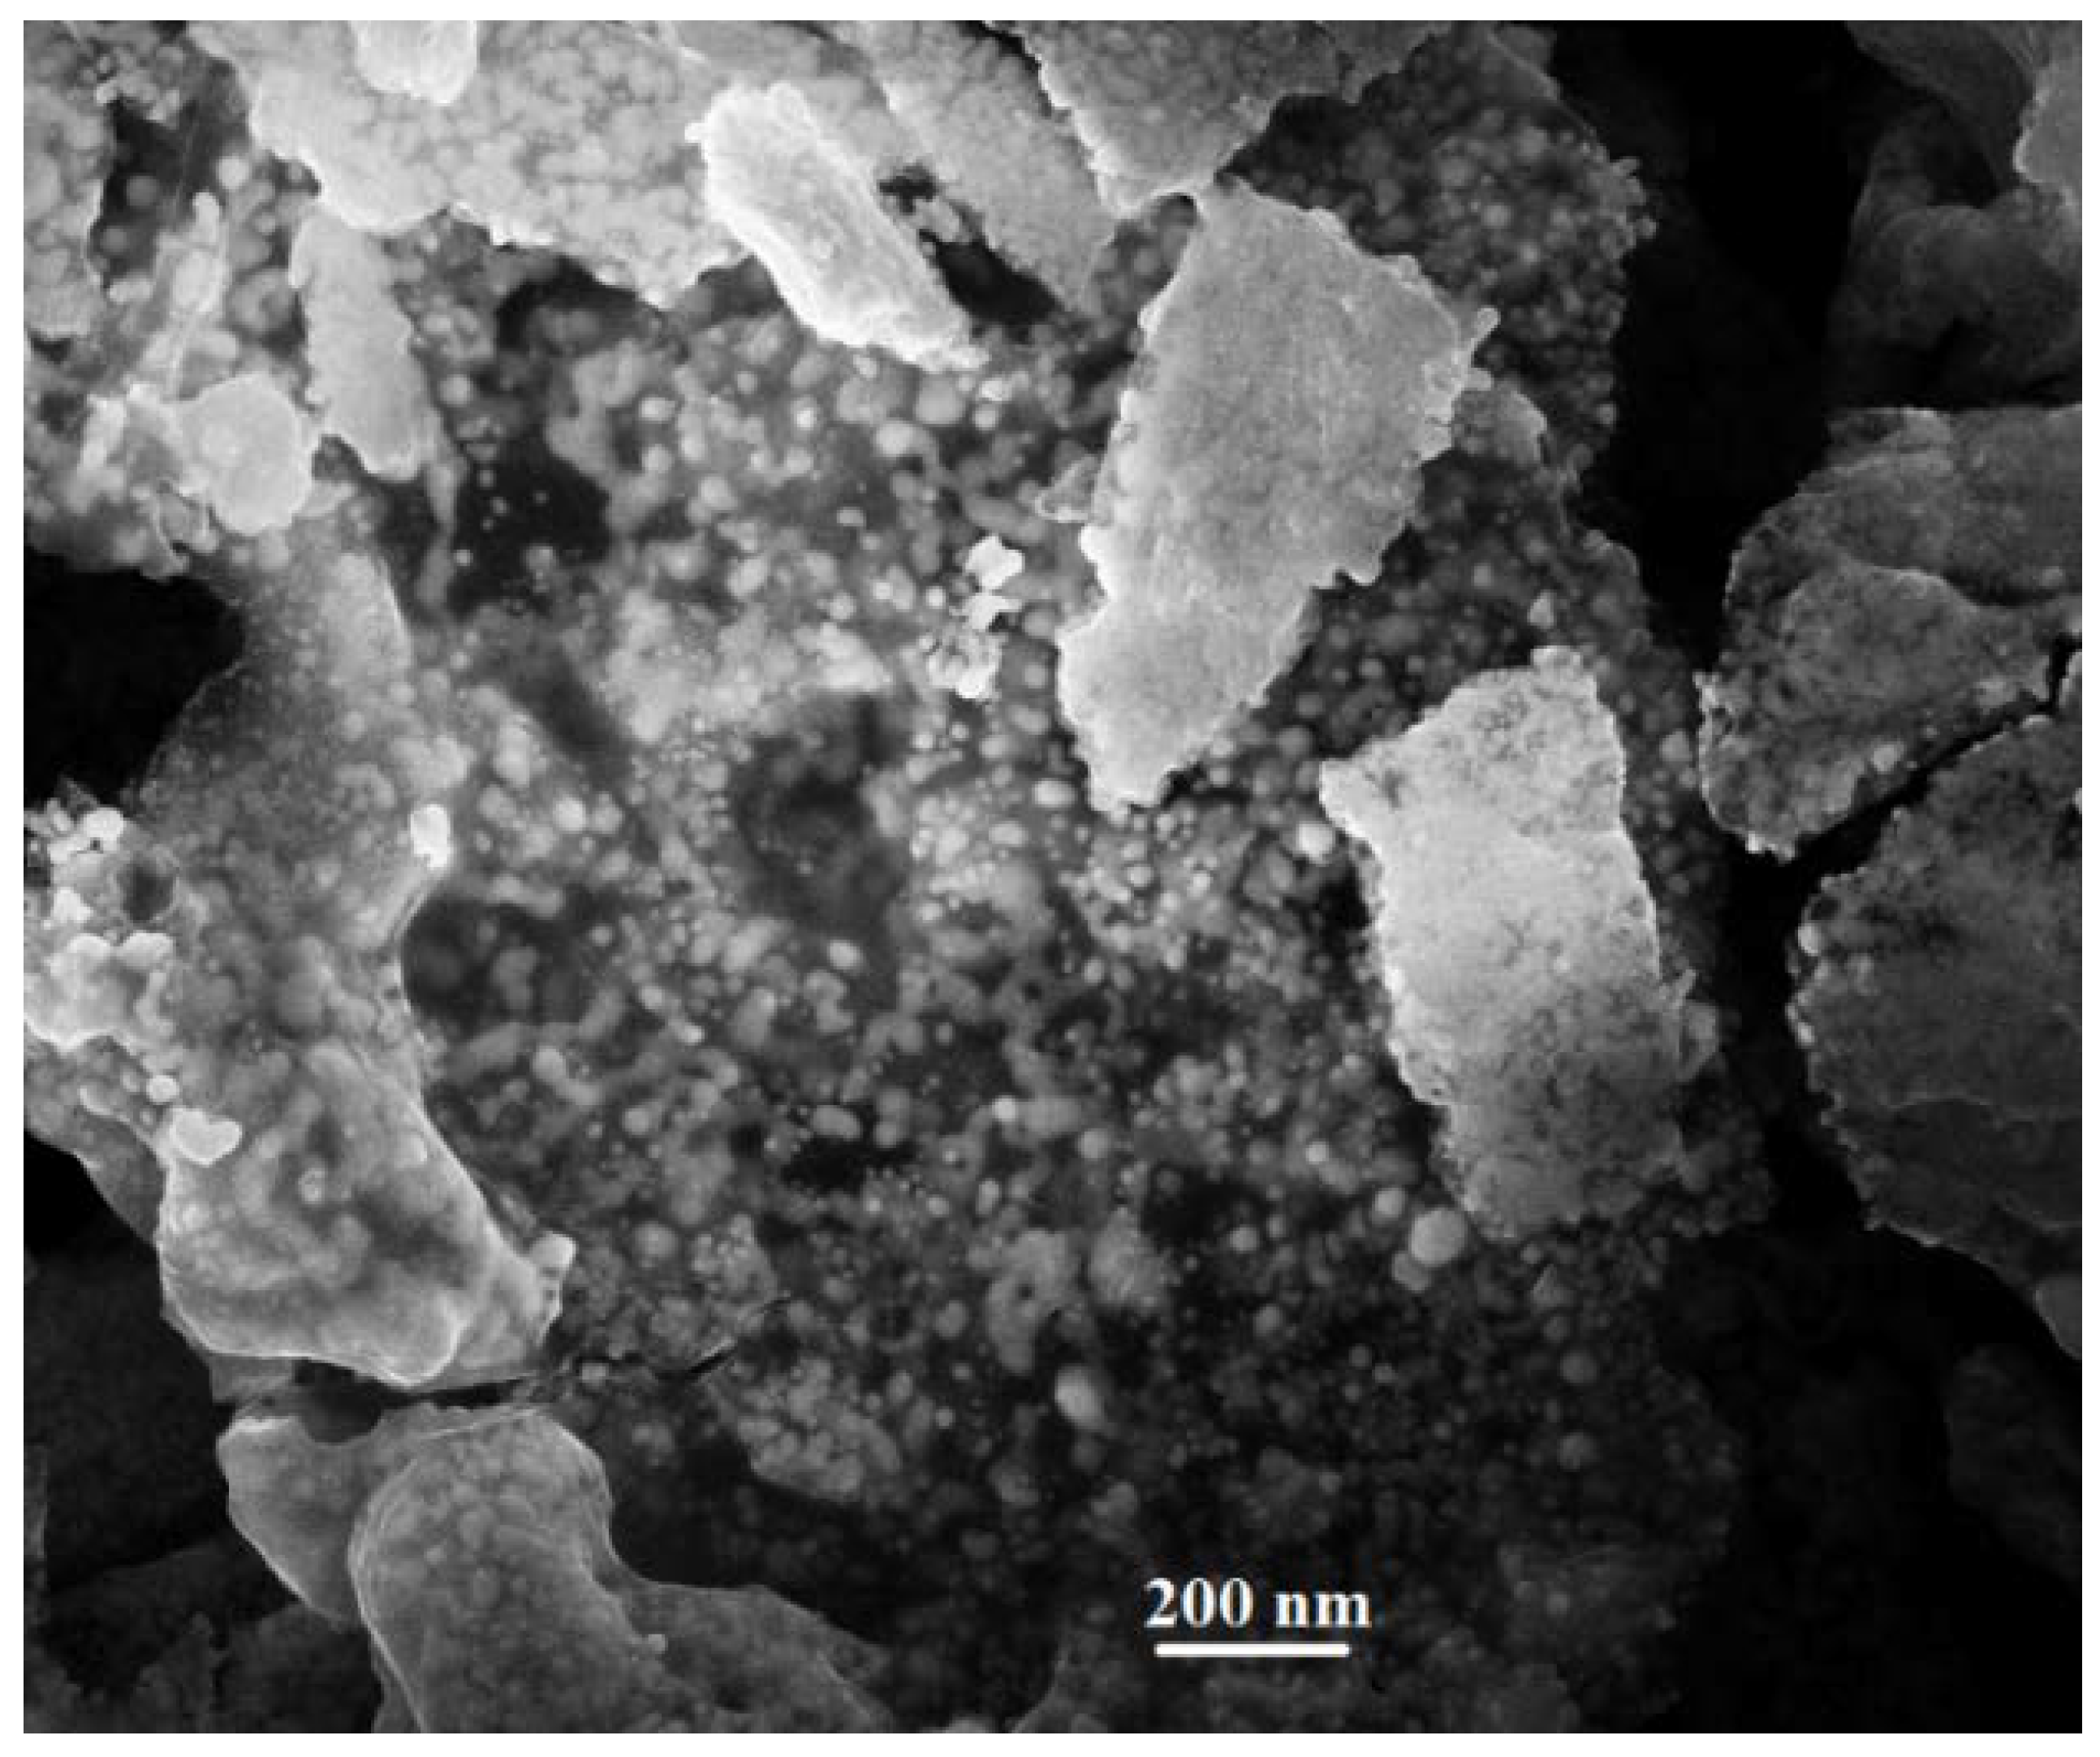
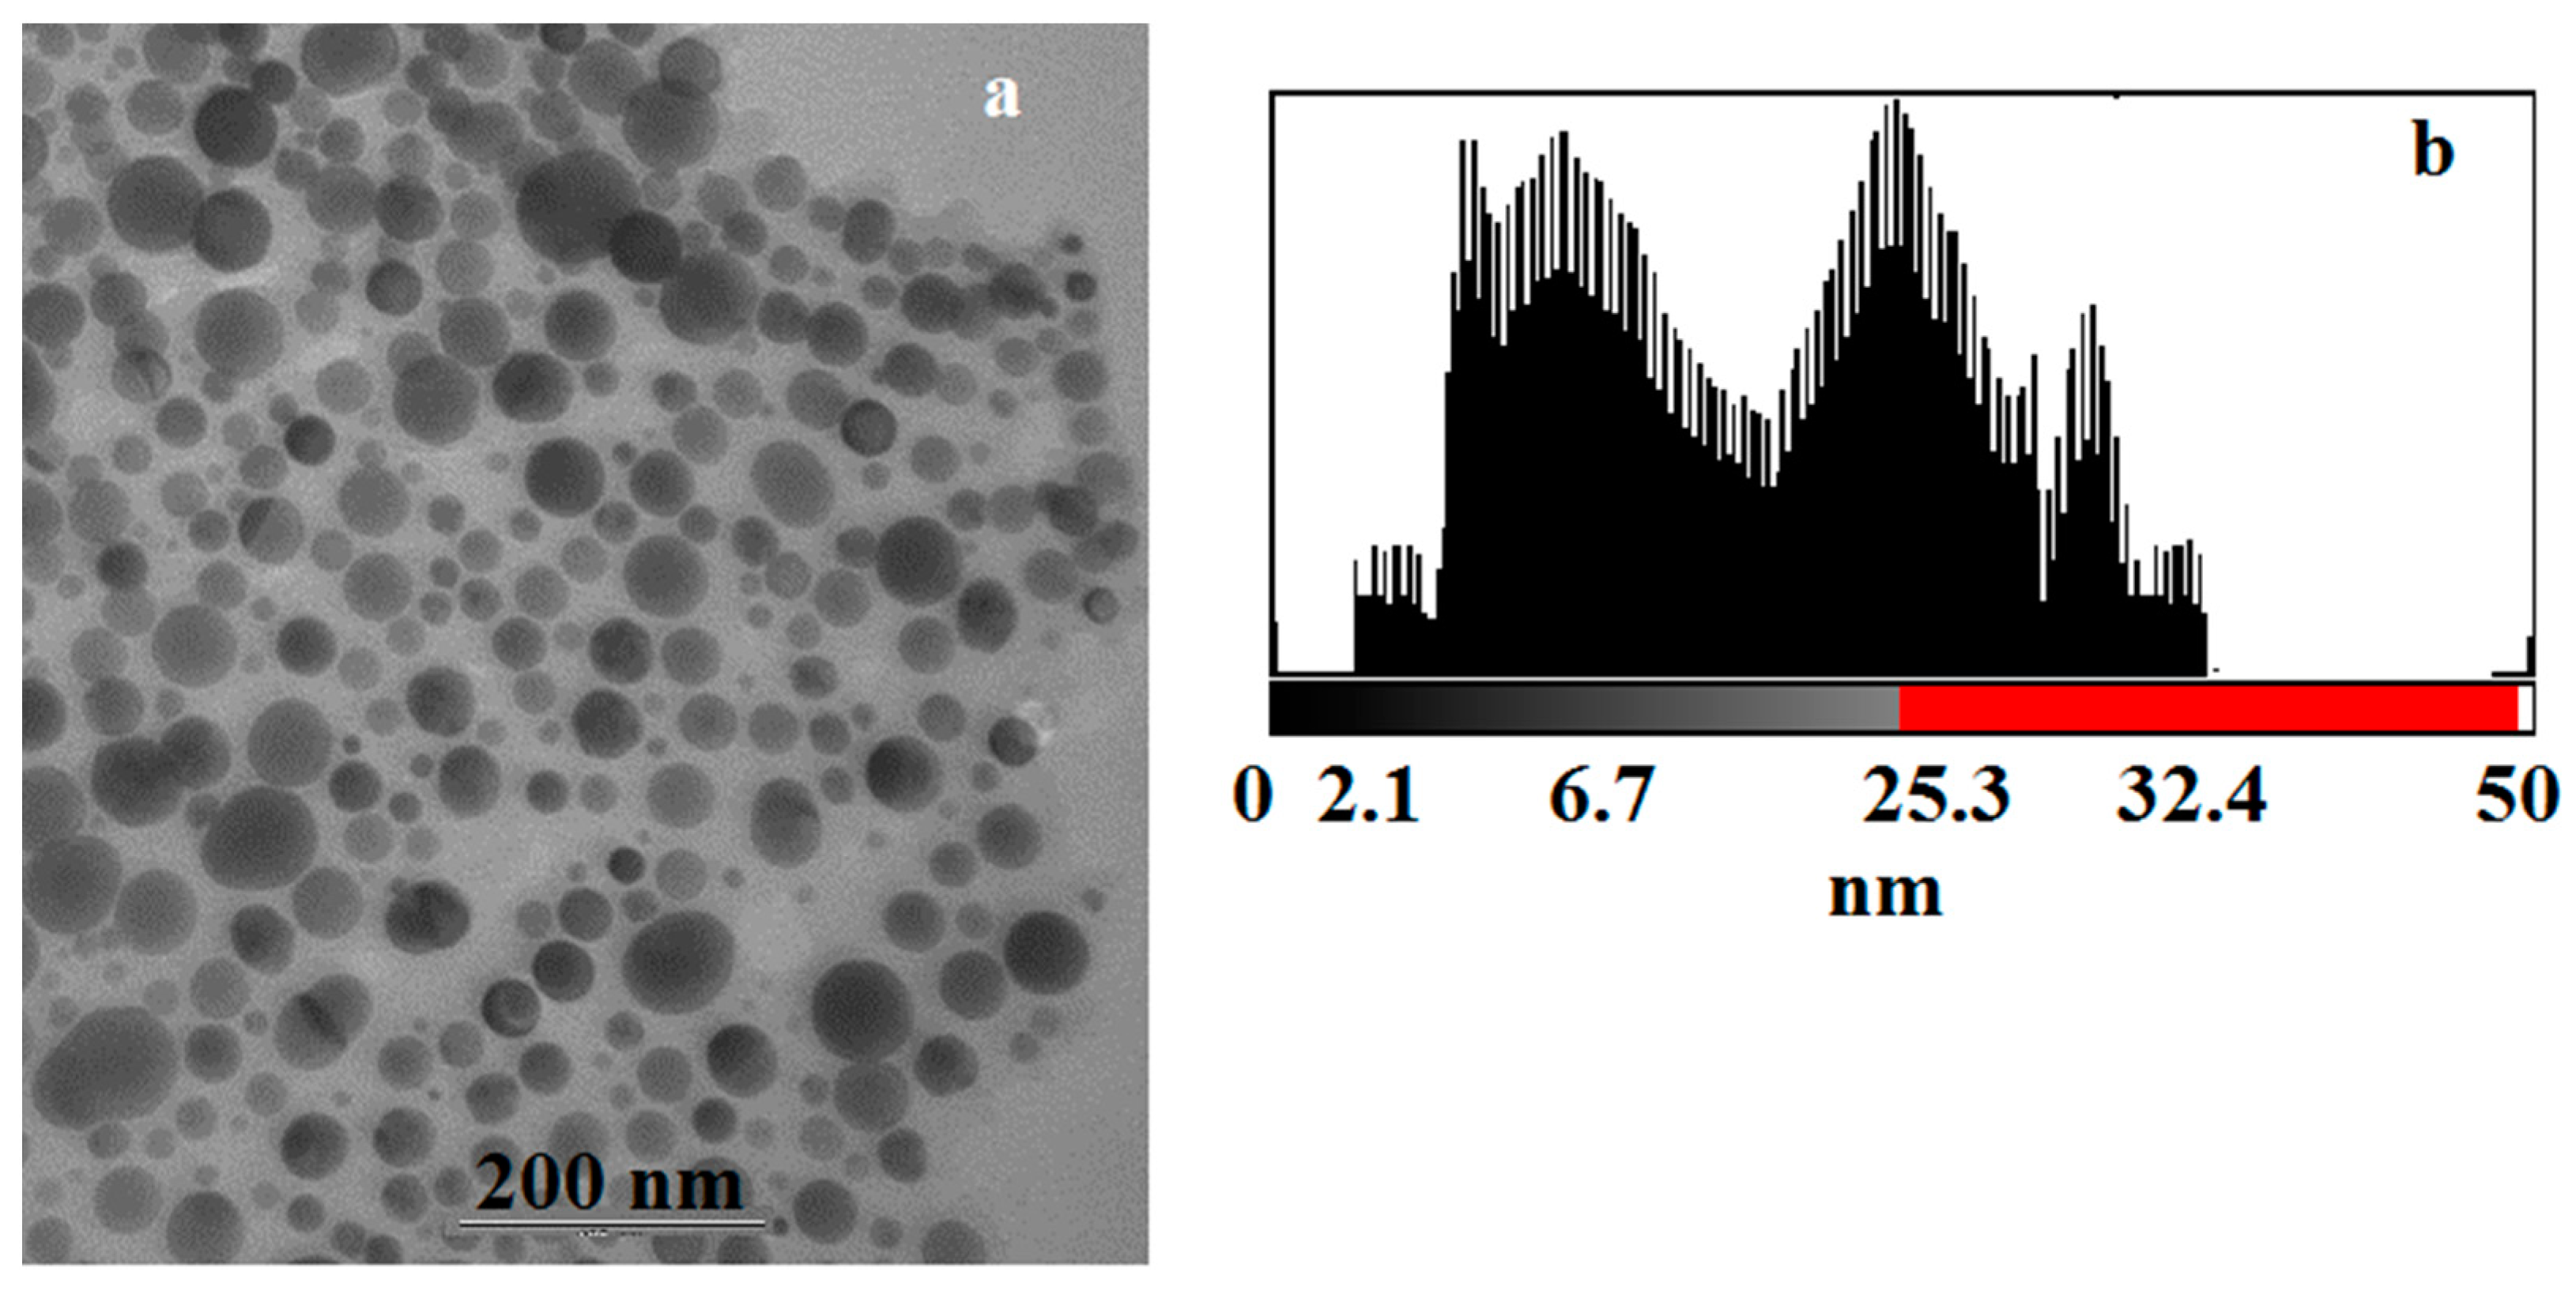
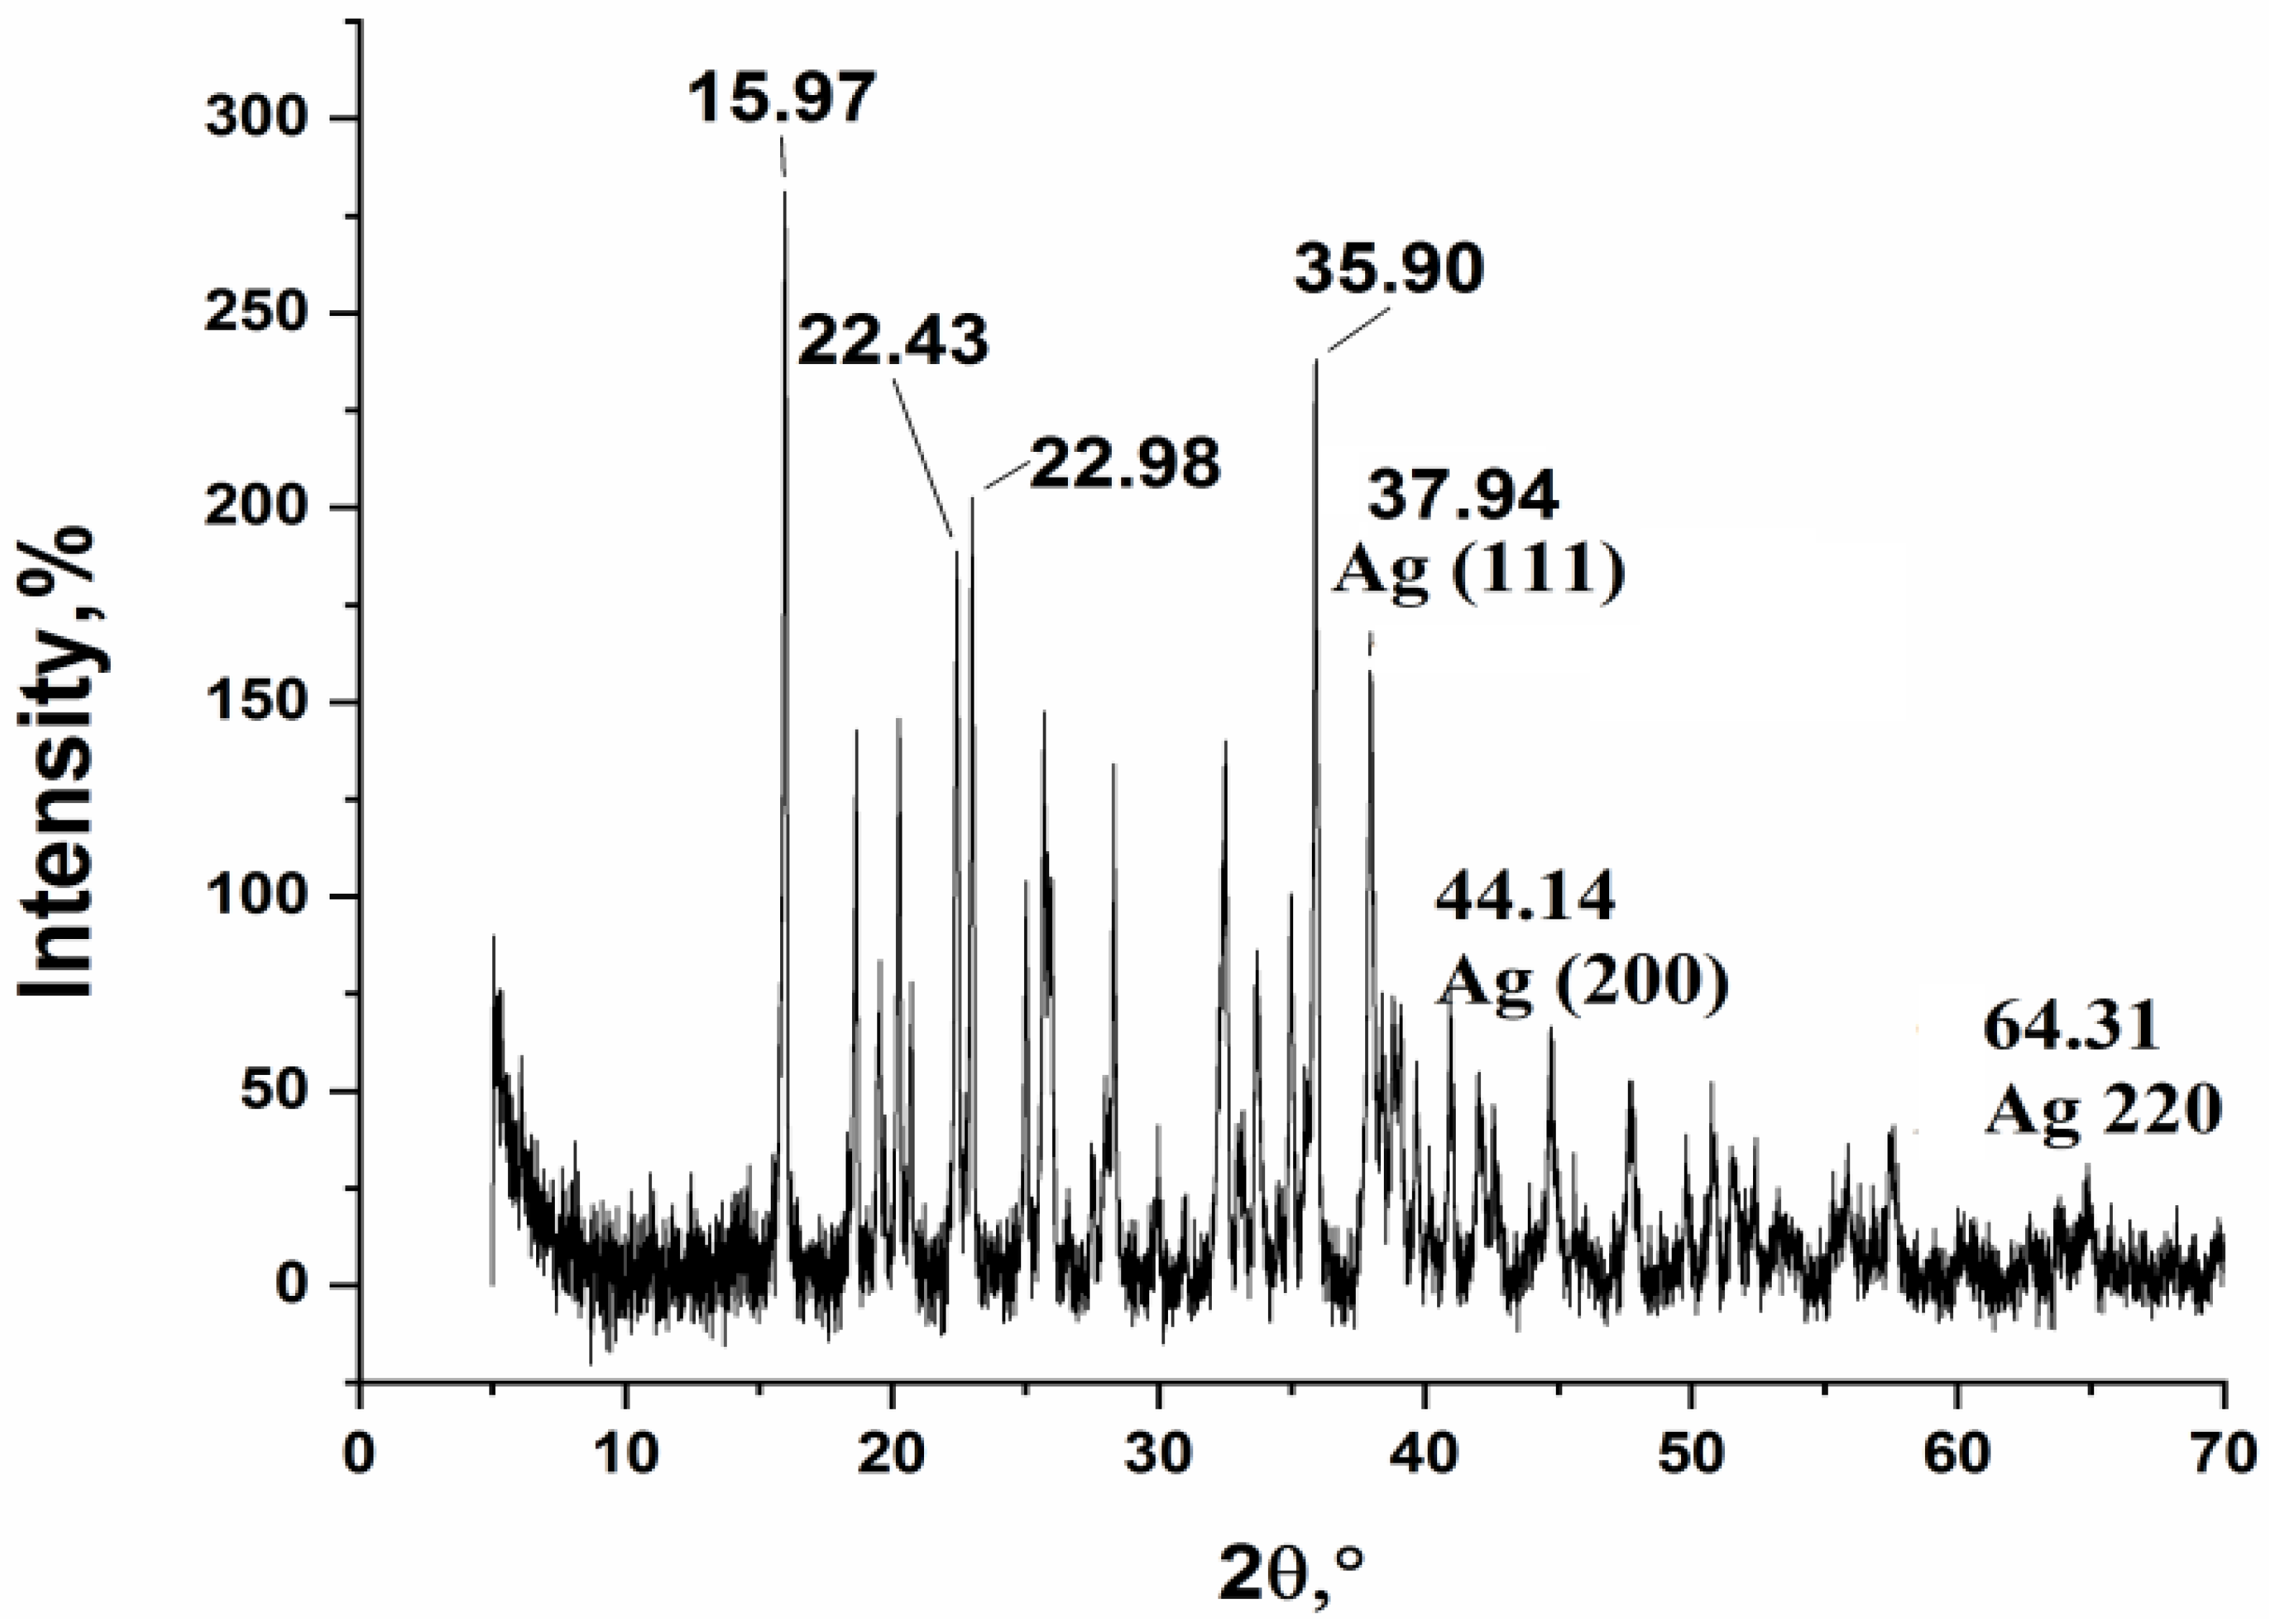
3.2. Thermolysis of Silver Maleate

The solid-state thermolysis product of silver maleate is a black, free-flowing powder and was characterized by IR spectroscopy, elemental analysis, XRD, SEM, TEM, AFM and EDX. Elemental composition according to the EDX analysis without destroying the object (according to SEM data, Figure 7), %: C—9.58; O—1.56; Ag—88.86; according to chemical analysis, %: C—10.33, H—3.32, Ag—86.35.
In the IR spectrum (Figure 8), there are two low intensity peaks in the region of 2931 and 1560 cm−1 and a peak of medium intensity at 452 cm−1. Vibrations in the region of 2931 cm−1 may correspond to the stretching vibrations of the C–H bonds in the aromatic systems. The doublet of bands in the region of 1560 cm−1 characterizes the vibrations of C–C bonds in the aromatic system [59,60,61].
The SEM image (Figure 9) visualizes both free-lying and in a carbon-containing matrix silver particles, mostly spherical in shape, 6.5–82.4 nm in size.
The XRD analysis data (Figure 10) show that the thermolysis product contains metallic silver. The calculation of the size of the silver crystallites using the Debye-Scherrer formula gives the values 7.4, 8.6, 11.3, 27.5, and 43.8 nm.
The product of the solid-state thermolysis of silver maleate was studied using TEM (Figure 11a). The TEM image visualizes spherical silver particles located in the stroma of the carbon material. The particle size of silver is between 2 and 32 nm. The particle distribution histogram is shown in Figure 11b.
The thermolysis product of silver maleate was additionally analyzed by AFM (Figure 12). Topographically, silver particles are located relatively evenly in the object, the amplitude during scanning in a given direction allows us to state that the particles have a shape closer to spherical, while some of the large particles, about 30 nm, are aggregates of smaller particles formed during thermolysis.
In the IR spectrum of thermolysis product of silver maleate in xylene (Figure 13), there is a wide band of crystallization water at 3420 cm−1, two low intensity peaks in the region of 3050 and 1542 cm−1 and a peak of medium intensity at 620 cm−1. Vibrations in the region of 3050 cm−1 may correspond to stretching vibrations of C–H bonds in aromatic systems. The doublet of bands in the region of 1542 cm−1 characterizes the vibrations of the C–C bonds in the aromatic system [59,60,61].
An analysis of the XRD spectrum (Figure 14) shows a greater number of peaks than in the solid-phase thermolysis product, which suggests the presence of crystalline structures that are products of incomplete thermolysis, as well as the presence of graphitized carbon. The size for silver crystallites, calculated by the Debye-Scherrer formula, is 27.4, 33.7, and 45.4 nm.
The TEM image (Figure 15) shows a large number of elongated elliptical elements, which are more electron-dense than similar elements in the solid-state thermolysis product. It can be assumed that on the surface of the silver NPs there is a rather large layer of a polymer matrix containing graphite, which ultimately increased the optical density of the particles. The particle size varies from 18.8 to 30 nm. In comparison with the particles obtained by solid-state thermolysis, the spread of particle sizes in this case is much smaller, but the particles are larger and more elongated.

3.3. Determination of Iodide

The proposed method combines three processes that occur simultaneously. These are the oxidation of iodides in solution with the formation of molecular iodine, the extraction of iodine by an air flow, and the interaction of iodine with silver NPs on the surface of test strips. The dynamic gas extraction enables iodine to be spatially separated from interfering ions and other nonvolatile compounds in the solution by an air barrier, whereas Ag NPs-modified paper ensures its sensitive detection. The reaction of iodine with immobilized Ag NPs results in their oxidation and a change in the color of the test strip, depending on the concentration of iodides, which is shown in Figure 16.
A change in the color can be monitored by an ordinary scanner in the native RGB color space to construct a calibration curve for the determination of iodide content. The graphical dependence of the R-, G-, B-coordinates on the concentration of iodides has the form of an increasing exponential (see Figure 16) and is described by the equation [62].
y = y0 + A(1 − e−c/t),
where y0, A, t are the parameters of the regression equation describing the location and shape of the curve; y is the color coordinate varying between 0 and 255; c is the concentration of iodides (iodine), mg/L.
Table 1 presents the parameters of the equations, which show that the maximum value of A/t (characterizes the steepness of the graph) is observed for the B-coordinate. This means that this coordinate is the most sensitive to the iodide concentration and can be chosen as the optimal analytical signal in the developed technique.
Any substance with a potential greater than E0(I3/3I) = 0.54 V can be used as an oxidizing agent. We used potassium permanganate because we conducted a study on model solutions. This oxidizing agent can be used in the analysis of objects in which bromides and chlorides are definitely absent. For example, it may be used in some iodide-containing pharmaceutical preparations. When using the technique in the analysis of objects containing simultaneously I, Br, and Cl ions, a milder oxidizing agent should be used to avoid the interfering effect of bromides and chlorides.

4. Conclusions

Analysis of the data presented shows that the thermolysis of silver maleate leads to the formation of Ag/C nanocomposites containing metal nanoparticles uniformly distributed in a stabilizing carbon matrix. The nanomaterials obtained are characterized by stability over time; that is, when they are stored for a long time, there are no changes in the chemical composition, size, and shape of the nanoparticles. The proposed method for obtaining nanocomposites is simple, mild, and cheap, which makes it very suitable for scale-up production. It has been established that the size of the silver crystallites obtained by solid-phase thermolysis varies between 2.1 and 32.4 nm. For the thermolysis product in xylene, a greater number of peaks are observed than in the solid-phase thermolysis product, which indicates the presence of crystalline structures that are products of incomplete thermolysis, as well as the presence of graphitized carbon. In this case, the size of the silver crystallites is 27.4, 33.7 and 45.4 nm. The optical properties of the Ag/C nanocomposites obtained by solid-state thermolysis make it possible to use them to create new indicator papers that change their color depending on the concentration of iodides in the solution. The method for determining iodides, based on the oxidation of iodides and the extraction of the resulting iodine with an air stream, is completed through digital colorimetric detection and is the basis for obtaining the dependences of the color of test strips on the concentration of iodides. The use of gas extraction in the developed method makes it possible to divide the space of two-color reactions and increase the selectivity of the determination. Simultaneously carrying out of the processes of iodide oxidation, gas extraction of iodine, and the reaction of iodine with Ag/C nanocomposites ensures rapid determination, which is another advantage of the method.

Author Contributions

Conceptualization, M.O.G., G.I.D. and I.E.U.; investigation, T.S.K., A.O.Z., R.K.B. and V.A.Z.; methodology, M.O.G. and I.E.U.; validation, G.I.D.; visualization, T.S.K. and R.K.B.; writing—original draft, M.O.G., G.I.D. and I.E.U.; writing—review and editing, M.O.G., G.I.D. and I.E.U. All authors have read and agreed to the published version of the manuscript.

Funding

This work was financially supported by the Russian Science Foundation (Project No. 22-13-00260).

Data Availability Statement

Not applicable.

Conflicts of Interest

The authors declare no conflict of interest.

References

  1. Pomogailo, A.D.; Dzhardimalieva, G.I. Nanostructured Materials Preparation via Condensation Ways; Springer: Dordrecht, The Netherlands, 2014. [Google Scholar]
  2. Pan, S.; Jin, K.; Wang, T.; Zhang, Z.; Zheng, L.; Umehara, N. Metal matrix nanocomposites in tribology: Manufacturing, performance, and mechanisms. Friction 2022, 10, 1596–1634. [Google Scholar] [CrossRef]
  3. Liu, J.; Ma, Q.; Huang, Z.; Liu, G.; Zhang, H. Recent progress in graphene-based noble-metal nanocomposites for electrocatalytic applications. Adv. Mater. 2019, 31, 1800696. [Google Scholar] [CrossRef] [PubMed]
  4. Pan, S.; Wang, T.; Jin, K.; Cai, X. Understanding and designing metal matrix nanocomposites with high electrical conductivity: A review. J. Mater. Sci. 2022, 57, 6487–6523. [Google Scholar] [CrossRef]
  5. Liu, P.; Qin, R.; Fu, G.; Zheng, N. Surface Coordination Chemistry of Metal Nanomaterials. J. Am. Chem. Soc. 2017, 139, 2122–2131. [Google Scholar] [CrossRef] [PubMed]
  6. Manojkumar, K.; Sivaramakrishna, A.; Vijayakrishna, K. A short review on stable metal nanoparticles using ionic liquids, supported ionic liquids, and poly(ionic liquids). J. Nanopart. Res. 2016, 18, 103. [Google Scholar] [CrossRef]
  7. Divya, V.; Sangaranarayanan, M.V. Metal-polymer composites at liquid/liquid interfaces: New morphological investigations using ex situ and in situ studies. J. Polym. Res. 2016, 23, 149. [Google Scholar] [CrossRef]
  8. Dzhardimalieva, G.I.; Uflyand, I.E. Nanomaterials Preparation by Thermolysis of Metal Chelates; Springer: Cham, Switzerland, 2018. [Google Scholar]
  9. Hahladakis, J.N.; Velis, C.A.; Weber, R.; Iacovidou, E.; Purnell, P. An overview of chemical additives present in plastics: Migration, release, fate and environmental impact during their use, disposal and recycling. J. Hazard. Mater. 2018, 344, 179–199. [Google Scholar] [CrossRef]
  10. Liu, X.; Gao, C.; Sangwan, P.; Yu, L.; Tong, Z. Accelerating the degradation of polyolefins through additives and blending. J. Appl. Polym. Sci. 2014, 131, 40750. [Google Scholar] [CrossRef]
  11. Dzhardimalieva, G.I.; Uflyand, I.E. Conjugated Thermolysis of Metal-Containing Monomers: Toward Core–Shell Nanostructured Advanced Materials. J. Inorg. Organomet. Polym. Mater. 2020, 30, 88–110. [Google Scholar] [CrossRef]
  12. Uflyand, I.E.; Dzhardimalieva, G.I. Chalcogen-containing metal chelates as single-source precursors of nanostructured materials: Recent advances and future development. J. Coord. Chem. 2019, 72, 1425–1465. [Google Scholar]
  13. Chekhomova, O.A.; Klepov, V.V.; Pushkin, D.V.; Alekseev, E.V.; Vologzhanina, A.V.; Serezhkina, L.B.; Serezhkin, V.N. Structural features of uranyl acrylate complexes with s-, p-, and d-monovalent metals. Z. Krist.-Cryst. Mater. 2019, 234, 247–256. [Google Scholar] [CrossRef]
  14. Dzhardimalieva, G.I.; Pomogailo, A.D. Macromolecular metal carboxylates. Russ. Chem. Rev. 2008, 77, 259–301. [Google Scholar] [CrossRef]
  15. Dzhardimalieva, G.I.; Semenov, S.A.; Knerelman, E.I.; Davydova, G.I.; Kydralieva, K.A. Preparation and Reactivity of Metal-Containing Monomers. 78. Scandium-Containing Monomers and Polymers: Synthesis, Structure and Properties. J. Inorg. Organomet. Polym. Mater. 2016, 26, 1441–1451. [Google Scholar] [CrossRef]
  16. Porollo, N.P.; Aliev, Z.G.; Dzhardimalieva, G.I.; Ivleva, I.N.; Uflyand, I.E.; Pomogailo, A.D.; Ovanesyan, N.S. Synthesis and reactivity of metal-containing monomers 47. Synthesis and structure of salts of unsaturated dicarboxylic acid. Russ. Chem. Bull. 1997, 46, 362–370. [Google Scholar] [CrossRef]
  17. Shershnev, V.; Kudryavtsev, P.; Knerelman, E.; Davydova, G.; Zarrelli, M.; Dzhardimalieva, G. Core-shell nanocomposites produced from metal dicarboxylates. Mater. Today Proc. 2021, 34, 235–238. [Google Scholar] [CrossRef]
  18. Semenov, S.A.; Musatova, V.Y.; Drobot, D.V.; Dzhardimalieva, G.I. Thermal Decomposition of Acidic Cobalt(II) Carboxylates with Unsaturated Dicarboxylic Anions. Russ. J. Inorg. Chem. 2020, 65, 61–68. [Google Scholar] [CrossRef]
  19. Semenov, S.A.; Musatova, V.Y.; Drobot, D.V.; Dzhardimalieva, G.I. Nickel Itaconate Thermolysis. Russ. J. Inorg. Chem. 2019, 64, 786–797. [Google Scholar] [CrossRef]
  20. Morones, J.R.; Elechiguerra, J.L.; Camacho, A.; Holt, K.; Kouri, J.B.; Ramírez, J.T.; Yacaman, M.J. The bactericidal effect of silver nanoparticles. Nanotechnology 2005, 16, 2346. [Google Scholar] [CrossRef] [Green Version]
  21. Dror-Ehre, A.; Mamane, H.; Belenkova, T.; Markovich, G.; Adin, A. Silver nanoparticle–E. coli colloidal interaction in water and effect on E. coli survival. J. Colloid Interface Sci. 2009, 339, 521–526. [Google Scholar] [CrossRef]
  22. Li, W.; Shi, Q.; Chen, Y.B.; Ouyang, Y.-S.; Duan, S.-S. Antifungal effects of citronella oil against Aspergillus niger ATCC 16404. Appl. Microbiol. Biotechnol. 2013, 97, 7483–7492. [Google Scholar] [CrossRef]
  23. Sharma, V.K.; Yngard, R.A.; Lin, Y. Silver nanoparticles: Green synthesis and their antimicrobial activities. Adv. Colloid Interface Sci. 2009, 145, 83–96. [Google Scholar] [CrossRef] [PubMed]
  24. Vasileva, P.; Donkova, B.; Karadjova, I.; Dushkin, C. Synthesis of starch-stabilized silver nanoparticles and their application as a surface plasmon resonance-based sensor of hydrogen peroxide. Colloids Surf. A 2011, 382, 203–210. [Google Scholar] [CrossRef]
  25. Seo, Y.; Hwang, J.; Kim, J.; Jeong, Y.; Hwang, M.P.; Choi, J. Antibacterial activity and cytotoxicity of multi-walled carbon nanotubes decorated with silver nanoparticles. Int. J. Nanomed. 2014, 9, 4621–4629. [Google Scholar]
  26. Aktitiz, İ.; Varol, R.; Akkurt, N.; Saraç, M.F. In-situ synthesis of 3D printable mono- and Bi-metallic (Cu/Ag) nanoparticles embedded polymeric structures with enhanced electromechanical properties. Polym. Test. 2020, 90, 106724. [Google Scholar] [CrossRef]
  27. Taormina, G.; Sciancalepore, C.; Bondioli, F.; Messori, M. Special Resins for Stereolithography: In Situ Generation of Silver Nanoparticles. Polymers 2018, 10, 212. [Google Scholar] [CrossRef] [Green Version]
  28. Shu, F.; Kiyoshi, N.; Shigetake, M.; Michio, Y. The Hunsdiecker Reaction of Silver Acrylate and Methacrylate. Bull. Chem. Soc. Jpn. 1967, 40, 594–596. [Google Scholar]
  29. Yang, W.; Wang, C.; Arrighi, V. Preparation and Characterization of Organic Silver Precursors for Conductive Ink. Int. J. Electron. Commun. 2018, 12, 670–677. [Google Scholar]
  30. Do, J.; Lee, Y.; Kang, J.; Jacobson, A.J. A twofold interpenetrating network constructed from silver ions coordinated to fumaric acid and pyrazine: Ag2(fum)(H2fum)(pyz)2 (fum = fumarate, pyz = pyrazine). Inorg. Chim. Acta 2012, 382, 191–194. [Google Scholar] [CrossRef]
  31. Li, X.; Wang, Y.; Li, Y.; Gou, Y.; Wang, Q. Synthesis, Characterization and Biological Evaluation of Two Silver(I) trans-Cinnamate Complexes as Urease Inhibitors. Z. Anorg. Allg. Chem. 2014, 640, 423–428. [Google Scholar] [CrossRef]
  32. Mohamed, M.A.; Mansour, S.A.A.; Hussien, G.A.M. Non-isothermal decomposition of silver maleate dihydrate and anhydrous silver fumarate. J. Therm. Anal. 1994, 41, 405–417. [Google Scholar] [CrossRef]
  33. Smith, G.; Sagatys, D.S.; Dahlgren, C.; Lynch, D.E.; Bott, R.C.; Byriel, K.A.; Kennard, C.H.L. Structures of the silver (I) complexes with maleic and fumaric acids: Silver(I) hydrogen maleate, silver(I) maleate and silver (I) fumarate. Z. Krist. New Cryst. Struct. 1995, 210, 44–48. [Google Scholar] [CrossRef]
  34. You, Z.-L.; Zhu, H.-L.; Liu, W.-S. catena-Poly[[silver(I)-μ-hexane-1,6-diamine-k2N:N’] cinnamate dihydrate]. Acta Crystallogr. Sect. C Cryst. Struct. Commun. 2004, C60, m231–m232. [Google Scholar] [CrossRef] [PubMed] [Green Version]
  35. Hamouda, H.I.; Abdel-Ghafar, H.M.; Mahmoud, M.H.H. Multi-walled carbon nanotubes decorated with silver nanoparticles for antimicrobial applications. J. Environ. Chem. Eng. 2021, 9, 105034. [Google Scholar] [CrossRef]
  36. Hernández-Vargas, J.; López-Tinoco, J.; Huirache-Acuña, R.; Rangel-Segura, R.; González-Campos, J.B.; Villegas, J.; Paraguay-Delgado, F.; González-Hernández, J.C.; Lara-Romero, J. Synthesis of silver nanoparticles supported on multiwalled carbon nanotubes via a surfactant-assisted microwave method and their antimicrobial assessment in solution. Chem. Pap. 2021, 75, 4687–4695. [Google Scholar] [CrossRef]
  37. Hoyos-Palacio, L.M.; Cuesta Castro, D.P.; Ortiz-Trujillo, I.C.; Palacio, L.E.; Upegui, B.J.; Escobar Mora, N.J.; Carlos Cornelio, J.A. Compounds of carbon nanotubes decorated with silver nanoparticles via in-situ by chemical vapor deposition (CVD). J. Mater. Res. Technol. 2019, 8, 5893–5898. [Google Scholar] [CrossRef]
  38. Mohan, S.; Oluwafemi, O.S.; Songca, S.P.; Rouxel, D.; Miska, P.; Lewu, F.B.; Kalarikkal, N.; Thomas, S. Completely green synthesis of silver nanoparticle decorated MWCNT and its antibacterial and catalytic properties. Pure Appl. Chem. 2016, 88, 71–81. [Google Scholar] [CrossRef]
  39. Schulman, O.; Samira, R.; Lachman, N. Composites Made of Carbon Nanotubes and Silver Nanoparticles for Conductive Aerosol-Jet Deposition Ink: The Double-Edged Sword of Functionalization. Front. Mater. 2022, 9, 827740. [Google Scholar] [CrossRef]
  40. Shahriari, M.; Hemmati, S.; Zangeneh, A.; Zangeneh, M.M. Decoration of silver nanoparticles on multi-walled carbon nanotubes: Investigation of its anti-acute leukemia property against acute myeloid leukemia and acute T cell leukemia. Appl. Organomet. Chem. 2020, 34, e5476. [Google Scholar] [CrossRef]
  41. Silva, M.M.; Ribeiro, D.; Cunha, E.; Proença, M.F.; Young, R.J.; Paiva, M.C. A simple method for anchoring silver and copper nanoparticles on single wall carbon nanotubes. Nanomaterials 2019, 9, 1416. [Google Scholar] [CrossRef] [Green Version]
  42. Yousif, T.Y.; Naje, A.N. Characterization of carbon nanotube decorated silver nanoparticles. J. Phys. Conf. Ser. 2021, 1879, 032093. [Google Scholar] [CrossRef]
  43. Zhang, X.; Zhang, J.; Quan, J.; Wang, N.; Zhu, Y. Surface-enhanced Raman scattering activities of carbon nanotubes decorated with silver nanoparticles. Analyst 2016, 141, 5527–5534. [Google Scholar] [CrossRef] [PubMed]
  44. Anshori, I.; Nuraviana Rizalputri, L.; Rona Althof, R.; Surjadi, S.S.; Harimurti, S.; Gumilar, G.; Yuliarto, B.; Handayani, M. Functionalized multi-walled carbon nanotube/silver nanoparticle (f-MWCNT/AgNP) nanocomposites as non-enzymatic electrochemical biosensors for dopamine detection. Nanocomposites 2021, 7, 97–108. [Google Scholar] [CrossRef]
  45. Lee, J.-W.; Cho, J.Y.; Kim, M.J.; Kim, J.H.; Park, J.H.; Jeong, S.Y.; Seo, S.H.; Lee, G.-W.; Jeong, H.J.; Han, J.T. Synthesis of silver nanoparticles embedded with single-walled carbon nanotubes for printable elastic electrodes and sensors with high stability. Sci. Rep. 2021, 11, 5140. [Google Scholar] [CrossRef] [PubMed]
  46. Santos-Ramos, I.; Chávez, K.; Figueroa, S.J.; Zárate-Medina, J.; Rosas, G. Carbon nanotubes decorated with silver nanoparticles by a facile method, and their electrochemical and catalytic evaluation. Appl. Phys. A Mater. Sci. Proc. 2021, 127, 778. [Google Scholar] [CrossRef]
  47. Wan, F.; Lei, Y.; Wang, C.; Zhang, X.; He, H.; Jia, L.; Wang, T.; Chen, W. Highly sensitive and reproducible CNTs@Ag modified Flower-Like silver nanoparticles for SERS situ detection of transformer Oil-dissolved furfural. Spectrochim. Acta Part A Mol. Biomol. Spectrosc. 2022, 273, 121067. [Google Scholar] [CrossRef] [PubMed]
  48. Wang, W.-F.; Nsanzamahoro, S.; Zhang, Y.; Wang, C.-B.; Shi, Y.-P.; Yang, J.-L. A highly sensitive colorimetric sensing platform based on silver nanocomposites for alkaline phosphatase. Anal. Methods 2022, 14, 2431–2438. [Google Scholar] [CrossRef]
  49. Gorbunova, M.O.; Apyari, V.V.; Baulina, A.A.; Garshina, M.S.; Kulyaginova, M.S.; Shevchenko, A.V.; Furletov, A.A.; Dmitrienko, S.G.; Zolotov, Y.A. An improved step-by-step airflow/paper-based colorimetric method for highly selective determination of halides in complex matrices. Talanta 2020, 219, 121254. [Google Scholar] [CrossRef]
  50. Gorbunova, M.O.; Garshina, M.S.; Kulyaginova, M.S.; Apyari, V.V.; Furletov, A.A.; Garshev, A.V.; Dmitrienko, S.G.; Zolotov, Y.A. A dynamic gas extraction-assisted paper-based method for colorimetric determination of bromides. Anal. Methods 2020, 12, 587–594. [Google Scholar] [CrossRef]
  51. Gorbunova, M.O.; Baulina, A.A.; Kulyaginova, M.S.; Apyari, V.V.; Furletov, A.A.; Garshev, A.V.; Dmitrienko, S.G. Determination of iodide based on dynamic gas extraction and colorimetric detection by paper modified with silver triangular nanoplates. Microchem. J. 2019, 145, 729–736. [Google Scholar] [CrossRef]
  52. Gorbunova, M.O.; Bayan, E.M. A novel paper-based sensor for determination of halogens and halides by dynamic gas extraction. Talanta 2019, 199, 513–521. [Google Scholar] [CrossRef]
  53. Gorbunova, M.O.; Baulina, A.A.; Kulyaginova, M.S.; Apyari, V.V.; Furletov, A.A.; Volkov, P.A.; Bochenkov, V.E.; Starukhin, A.S.; Dmitrienko, S.G. Dynamic gas extraction of iodine in combination with a silver triangular nanoplate-modified paper strip for colorimetric determination of iodine and of iodine-interacting compounds. Microchim. Acta 2019, 186, 188. [Google Scholar] [CrossRef] [PubMed]
  54. Apyari, V.V.; Gorbunova, M.O.; Shevchenko, A.V.; Furletov, A.A.; Volkov, P.A.; Garshev, A.V.; Dmitrienko, S.G.; Zolotov, Y.A. Towards highly selective detection using metal nanoparticles: A case of silver triangular nanoplates and chlorine. Talanta 2018, 176, 406–411. [Google Scholar] [CrossRef] [PubMed]
  55. Gorbunova, M.O.; Shevchenko, A.V.; Apyari, V.V.; Furletov, A.A.; Volkov, P.A.; Garshev, A.V.; Dmitrienko, S.G. Selective determination of chloride ions using silver triangular nanoplates and dynamic gas extraction. Sens. Actuators B 2018, 256, 699–705. [Google Scholar] [CrossRef]
  56. Apyari, V.V.; Furletov, A.A.; Garshev, A.V.; Volkov, P.A.; Gorbunova, M.O.; Shevchenko, A.V. Preparation of Reagent Indicator Papers with Silver Triangular Nanoplates for Chemical Analysis. Mosc. Univ. Chem. Bull. 2017, 72, 167–173. [Google Scholar] [CrossRef]
  57. Jenkins, R.; Snyder, R.L. Chemical Analysis: Introduction to X-ray Powder Diffractometry; Wiley: Weinheim, Germany, 1996. [Google Scholar]
  58. Nečas, D.; Klapetek, P. Gwyddion: An open-source software for SPM data analysis. Centr. Eur. J. Phys. 2012, 10, 181–188. [Google Scholar] [CrossRef]
  59. Nakamoto, K. Infrared and Raman Spectra of Inorganic and Coordination Compounds, Part B: Applications in Coordination, Organometallic, and Bioinorganic Chemistry, 6th ed.; Wiley: Hoboken, NJ, USA, 2009. [Google Scholar]
  60. Miller, F.A. Amides, Carboxylate Ion, and C–O Single Bonds in Course Notes on the Interpretation of Infrared and Raman Spectra. In Course Notes on the Interpretation of Infrared and Raman Spectra; Mayo, D.W., Miller, F.A., Hannah, R.W., Eds.; Wiley: Hoboken, NJ, USA, 2004; pp. 205–215. [Google Scholar]
  61. Pomogailo, A.D.; Dzhardimalieva, G.I.; Rozenberg, A.S.; Muraviev, D.N. Kinetics and mechanism of in situ simultaneous formation of metal nanoparticles in stabilizing polymer matrix. J. Nanopart. Res. 2003, 5, 497–519. [Google Scholar] [CrossRef]
  62. Apyari, V.V.; Dmitrienko, S.G. Using a digital camera and computer data processing for the determination of organic substances with diazotized polyurethane foams. J. Anal. Chem. 2008, 63, 530–537. [Google Scholar] [CrossRef]
Figure 1. Image of the setup for the thermolysis of silver maleate in xylene.
Jcs 06 00384 g001
Figure 2. Setup for dynamic gas extraction: 1—rubber stopper; 2—test strip; 3—glass vessel for the analyzed solution; 4—holder of test strips; 5—reaction mixture; 6—glass bubbler; 7—polymer hose; 8—air microcompressor.
Jcs 06 00384 g002
Figure 3. IR spectrum of silver maleate.
Jcs 06 00384 g003
Figure 4. Thermogram of silver maleate.
Jcs 06 00384 g004
Figure 5. Dynamics of the degree of conversion of silver maleate.
Jcs 06 00384 g005
Figure 6. DSC curve of a silver maleate.
Jcs 06 00384 g006
Figure 7. Energy dispersive analysis data for the thermolysis product of silver maleate. (a) spectrum removal area, (b) EDX spectrum.
Jcs 06 00384 g007
Figure 8. IR spectrum of the product of solid-state thermolysis of silver maleate.
Jcs 06 00384 g008
Figure 9. SEM image of a sample of the thermolysis product of silver maleate.
Jcs 06 00384 g009
Figure 10. X-ray diffraction pattern of the thermolysis product of silver maleate.
Jcs 06 00384 g010
Figure 11. (a) TEM image of the silver maleate thermolysis product; (b) a histogram illustrating particle size distribution.
Jcs 06 00384 g011
Figure 12. AFM image of a sample of the thermolysis product of silver maleate: (a) 2D-surface topography image, (b) 2D-amplitude image, (c) 3D-surface image.
Jcs 06 00384 g012
Figure 13. IR spectrum of the thermolysis product of silver maleate in xylene.
Jcs 06 00384 g013
Figure 14. XRD of a sample of the thermolysis product of silver maleate in xylene.
Jcs 06 00384 g014
Figure 15. (a) TEM image of the thermolysis product of silver maleate in xylene; (b) histogram illustrating the particle size distribution in the thermolysis product of silver maleate in xylene.
Jcs 06 00384 g015
Figure 16. Changes in color and R-, G-, and B-color coordinates of Ag NPs-modified paper on the concentration of iodide ions in the analyzed solution.
Jcs 06 00384 g016
Table 1. Coefficients of exponential equations of color coordinates.
Red Coordinate (R)Green Coordinate (G)Blue Coordinate (B)
y0115 ± 2103 ± 294 ± 2
A90 ± 381 ± 272 ± 2
t0.34 ± 0.030.29 ± 0.020.17 ± 0.02
A/t265279424
R20.99000.99470.9917
Publisher’s Note: MDPI stays neutral with regard to jurisdictional claims in published maps and institutional affiliations.

