Abstract
The improvement of high temperature materials with lower heat transfer coefficients lead to the development of thermal barrier coatings (TBCs). One of the most widely used materials for thermal barrier coatings is Y2O3 stabilized ZrO2 (Y-TZP) because of its excellent shock resistance, low thermal conductivity, and relatively high coefficient of thermal expansion. The aim of this work is to study the TBCs mechanical behavior with the addition of SiC into the suspension of Y-TZP/Al2O3 by acoustic emission (AE). Additionally, a microstructural analysis and a finite elements model were carried out in order to compare results. The coatings were made by suspension plasma spray (SPS) on metal plates of 70 × 12 × 2 mm3. An intermetallic was deposited as a bond coating, followed by a coating of Y-TZP/Al2O3 with and without 15 wt.% SiC, with thicknesses between 87 and 161 μm. The AE becomes a fundamental tool in the study of the mechanical behavior of thermal barriers. The use of wavelet transforms streamlines the study and analysis of recorded sound spectra. The crack generation arises at very low stress levels.
1. Introduction
Nowadays, the world is clamoring for more efficient and eco-friendly machines, resulting in more efforts toward achieving that goal. The mainstream way is to increase the pressure or temperature on engines and thermomechanical machines. In gas turbines, it is common to raise inlet air temperature, increasing the efficiency of the process described by Kristen et al. [1], but it entails development of more heat resistant materials or better thermal insulators.
Many studies have been done on ceramic coatings because it has a double function. These are thermal insulation, which reduces the components’ temperature, and protection improvement, which reduces corrosion. These materials are called thermal barrier coatings (TBCs).
The TBCs are basically composed of refractory ceramic oxides, generally titania, alumina magnesia or mixes of these; nevertheless, yttria stabilized zirconia (Y-TZP) represents the most settled as a consequence of its excellent behavior at high temperatures, such as low thermal conductivity, chemical inertness, low probability of phase transformations, and high melting point, among others identified by Van der Zwaag et al. [2].
There are different techniques for producing TBCs. One group of these are thermal spraying techniques, which are coating processes in which a heated material is sprayed to a surface. Atmospheric plasma spraying (APS) is preferable when the feedstock is in the form of powders. When suspension is required, the suspension plasma spraying (SPS) or precursor plasma spraying (SPPS) is performed. These techniques heat the feedstock which is then fed into a plasma torch, where they are vaporized and propelled to the substrate forming a coating [3].
Atmospheric plasma spraying (APS) is commonly used because of its economic and technical feasibility, while suspension plasma spray (SPS) is used as it is able to spray very fine and poor flowability powders [4,5,6].
Turbines operate at higher temperatures to improve the engine efficiency. However, these conditions produce thermal stress in the blades and rotors that increases the probability of mechanical failure. This leads to the development and growth of cracks and delamination [1]. Some researchers have proposed a new generation of TBCs with self-healing ability, which will endure the working conditions of the turbines and prolong their life [4]. SiC was reported as an efficient ceramic self-healing material, though other metals and alloys are being investigated [5,7].
The sealing ability involves the filling of the cracks in the TBCs at the same time they are generated. Hot gases and high temperatures during the operation gives energy to activate restoration. The self-healing process is the volume growth of self-healing particles when the oxygen in high temperature environments goes through the crack, giving rise to the oxidation of self-healing particles located on the edge of the crack and conquering the crack [7].
However, self-healing functionality in TBCs has scarcely developed. In the case of SiC, it is more problematic because it cannot be easily deposited by plasma spray since it is oxidized in the torch before melting [8].
SPS is an incipient thermal spray process, in which the powder feedstock is replaced by a suspension. Important advantages of the SPS process are that it is possible to spray very fine or poor flowability powders and avoid oxidation of the sealing material because a lot of the plasma energy is destined for solvent (water) evaporation [3,4,5,9,10].
The use of infrared thermography and acoustic emission techniques to monitor crack evolution is quite common in literature [11,12,13,14,15].
The acoustic emission (AE) technique is a non-destructive method and can follow the crack initiation growth and propagation through analysis of the AE parameters. Some researchers, such as Wang et al. [11], suggest that there is a frequency band for each cracking phenomenon which is associated to the materials’ characteristics. Others, such as Ma et al. [13], consider effects, such as ringdown count, rise time, or wave configuration, associated to crack evolution.
In this work, the thermal barrier coatings (TBCs) were obtained using Y-TZP as raw material and applying the suspension plasma spray (SPS), with and without the addition of SIC. At the same time, TBCs were tested and monitored by the acoustic emission technique (AE), and two different schedules were performed.
2. Materials and Methods
More than forty tests were conducted to recognize the noise and sounds of the machine, the base metal, and the anchor layer. Six tests were performed in each series to recognize the behavior of TBCs. Results were averaged or pooled in repeating patterns.
2.1. Samples
Samples of stainless steel AISI 304 of 70 × 12 × 2 mm3, which were previously mechanically cleaned and shot blasted in order to generate an anchor surface with a roughness of 2.1 ± 0.2 μm, were subsequently cleaned with ethanol.
On these, using APS, an intermetallic layer of NiCoCrAlTaY (Amdry997 Sulzer-Oerlikon, Germany) was deposited as a bonding layer with thicknesses of 100 ± 13 µm with plasma spray suspension (SPS) on stainless steel plates, using a plasma torch (F4-MB, Sulzer Metco, Wohlen, Switzerland) powered by a six-axis robot (IRB 1400, ABB, Zürich, Switzerland).
The raw coating material for the R series was a tetragonal zirconia with 3 mol% Y2O3 (TZ-3YS, Tosoh, Japan) and an α-alumina (CT3000SG, Almatis, Germany) with a weight ratio of 60/40 of zirconia/alumina.
For the S series, a 15 wt.% of α-SiC (UF-15, Hermann C. Starck, Germany) was added to the suspension previously described.
The R series samples (TZ-3YS/Al2O3) were prepared with a thickness between 115 and 147 μm.
The S series specimens (TZ-3YS/Al2O3 + 15 wt.% SiC) were obtained, achieving thicknesses between 87 and 161 μm.
Coat following the anchor layer was the same as in the R series, and the outer coat had the same constituents of the S series, whose whole thickness ranged from 83 to 112 μm, composed of a coat of Y-TZP/Al2O3 with a thickness of 50 to 75 μm and an external layer of Y-TZP/Al2O3 + 15% SiC with thicknesses from 23 to 40 μm.
2.2. Mechanical Tests
In order to generate cracks in the coatings, the three-point flexural test, one of the methods most collected in the literature for this purpose, was performed [12,14,15], with a configuration like the one presented in Figure 1a,b.
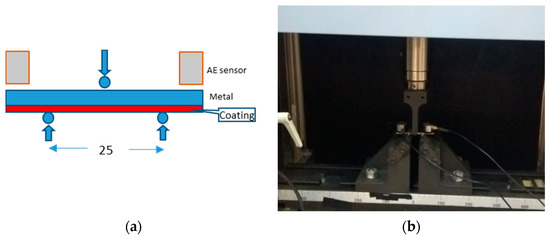
Figure 1.
Flexural test (a) layout scheme and (b) test.
To know the stress state of the ceramic coating at a given moment, Equation (1) is used [16], which allows the calculation of the maximum stress on the thermal barrier as a function of the load applied during the three-point flexural test.
where P is the load applied in an instant, L the distance between supports, b is the base, and h is the height of the cross-section of the specimen.
σm = (3*P*L)/(2*b*h^2),
The three-point bending test was carried out on a universal Shimadzu model AG X plus 100KN test machine, with a distance between supports of 25 mm as shown in Figure 1b, using two different test protocols as synthesized in Table 1 and Table 2.

Table 1.
Bending test steps 1.
Table 2.
Bending test steps 2.
2.3. Acoustic Emission
Data acquisition by AE, during the flexural test, was performed in a Vallen AMSY-5 with VS. 150 M probes with peak sensitivity at 150 KHz and limited sensitivity up to 500 kHz, and a VS. 700 D with gain peaks at 350 kHz, 600 kHz, and 750 kHz.
The acquisition was made in two channels, with a threshold of 45.2 dB, gain of 34 dB, sampling rate of 3333 MHz, and 1024 samples per transient group. More than forty tests were done in order to recognize machine, base metal, base metal, and anchor layer noise and sounds. Six tests were done on each series to acknowledge the TBCs behavior. The results were averaged or grouped into repetitive patterns.
3. Results and Discussion
The results were divided into different categories: a microstructural characterization; subsequent analysis of the acoustic emission events that, in turn, was subdivided into a study of the accumulated energy; then, the amount of energy released in each event; and the number of acoustic events. These results will be substantiated with an analysis of finite elements method, and finally a study of failure mode frequencies patterns.
3.1. Microstructural Characterization
The microstructural characterization was carried out in a FE-SEM (Ultra 55, Zeiss, Germany) on the surface and cross section, at 10 kV. The samples were polished up to 0.25 µm. A microanalysis of scattered X-ray energies (Oxford Instrumental, Abingdon, United Kingdom) were done in different areas of the coating.
The R series, a Y-TZP/Al2O3 coating, as seen in Figure 2a; the S series, a Al2O3 + 15 wt.% SiC in Figure 2b; and a bilayered R + S series, composed of a R series coat between the anchor layer and the external one, and an external coat like the S series in Figure 2c, generally show a laminar structure formed by molten splats and unfused particles, as is usual in SPS and SPPS coatings [6,8,17]. In addition, the unfused areas have an elongated shape and are located between the molten splats, forming an intercalated structure.
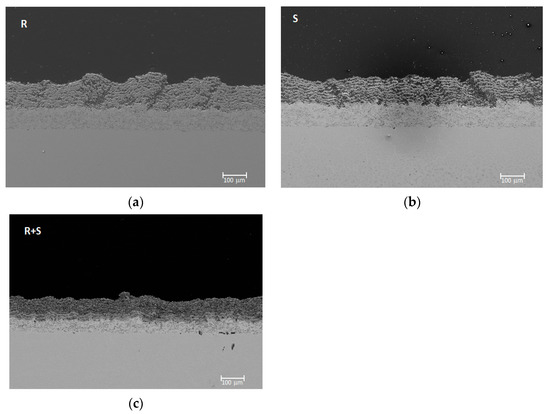
Figure 2.
Cross section of the thermal barriers: (a) Y-TZP/Al2O3, (b) Y-TZP/Al2O3 + 15% SiC, and (c) bilayered 100×.
Figure 3a shows a close view of R series microstructure: lamellar like molten splats with thicknesses of 5 to 25 μm, and zones rich in unfused particles with thickness between 4 and 13 μm for R series.
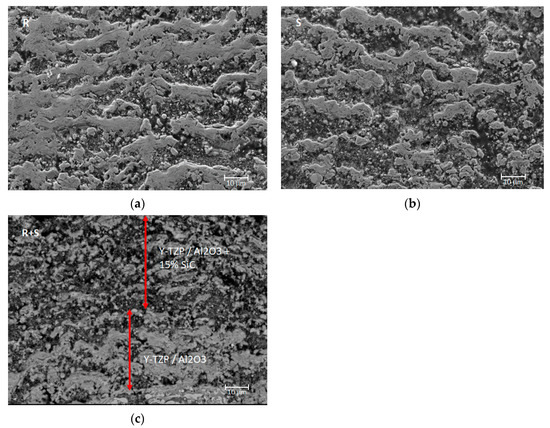
Figure 3.
Cross section of the thermal barriers: (a) Y-TZP/Al2O3, (b) Y-TZP/Al2O3 + 15% SiC 1000×, and (c) bilayered Y-TZP/Al2O3 and Y-TZP/Al2O3 + 15% SiC. 1000×.
In the case of the S series (Y-TZP/Al2O3 + 15% SiC) in Figure 3b, the molten lamellar zones vary from 4 to 10 μm, and the unfused zone from 3 to 30 μm. In the case of R + S series in Figure 3c, the zone corresponding to a Y-TZP/Al2O3 is just the same as R series; however, in the case of the layer corresponding to Y-TZP/Al2O3 + 15% SiC, the molten zones are from 2 to 6 μm and less lamellar like microstructures, so the addition of SiC seems to generate more discrete fused zones than ones obtained in the Y-TZP/Al2O3 layer.
Figure 4 shows the different phases of a coating of Al2O3-Y-TZP+ 15% SiC. The light areas correspond to regions rich in Y-TZP, while the dark angular areas correspond to SiC particles, and those black, rounded to pores. In the unfused areas shown in Figure 4b, the Y-TZP particles of Al2O3 and SiC are seen. In the molten areas, the grey regions with a mixture of Al2O3 and Y-TZP corresponds to a homogeneous mixture which is consistent to a eutectic compound with particles of SiC embedded Carnicer et al. [8].
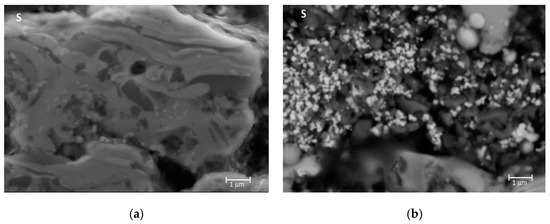
Figure 4.
FE-SEM 10,000× micrograph of an Al2O3/Y-TZP + SiC coating. (a) Molten area. (b) Unfused zone.
Figure 5 shows the level of both unfused Al2O3/Y-TZP and SiC at the surface level. It is to be intuited that unfused Al2O3/Y-TZP and SiC are responsible for the separation between layers observed in Figure 2 and Figure 3.
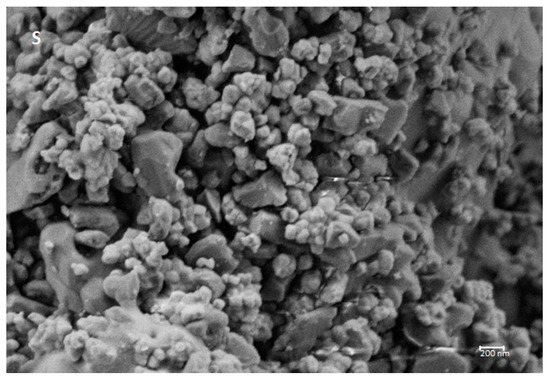
Figure 5.
FE-SEM micrograph at 25,000× of Al2O3/Y-TZP SiC reinforced.
3.2. AE Event Analysis
Figure 6 shows a graph of the substantial damping of the number of events in each new load cycle, even in the elastic range of the base metal. Nevertheless, new cracks are generated in the thermal barrier in each cycle, and those create acoustic events.
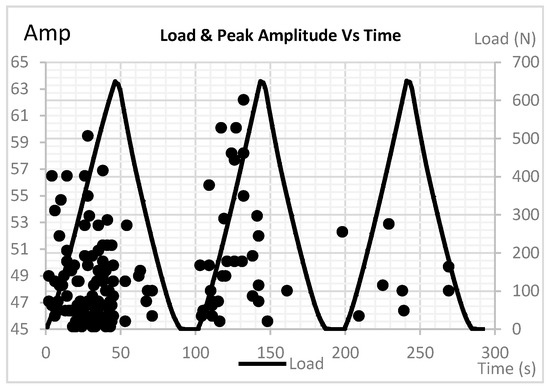
Figure 6.
Overlap peak amplitude and load as function of time.
Remarkable AE events were generated during the discharge, due to an identified pattern of frequencies associated with Mode I and II cracks, an event that Eleni et al. [18] attributed to the separation and sliding of the reinforcement in their material. In this case, it may be due to a rearrangement of fractured surfaces because the delamination processes are not yet present.
To evaluate this fact, a second test was developed, where, instead of discharging the load in each cycle, a relaxation time of 5 s at a given load was performed, then continued to load until a determined deformation, as defined in Table 2.
A large concentration of events in the first 40 s are shown on Figure 7. That happens at forces lower than 470 N. Therefore, using Equation (1), at a load of 470 N, the effort in the layer of the thermal barrier is 333 MPa. Therefore, it is astonishing that mostly failure events appear from the beginning of the test up to 333 MPa, as opposed to the values presented by Kondoh et al. [19], where, for a material similar to that used, they obtained tensile creep stresses greater than 700 MPa. Additionally, Surgeon [20] finds events at high levels of effort in BMAS (barium magnesium aluminium silicate) reinforced. Likewise, Boatemaa [21] suggested that the magnitude of the residual effort in the deposited thermal barrier depends on the coefficient of thermal expansion and the elastic modulus of the material. This clearly indicates that the high density of discontinuities, unfused areas, and porosity are, per se, large stress concentrators, as shown in Figure 8. These microstructural residual tensions arise from the deposition process and thermal shocks, enhancing this poor behaviour.
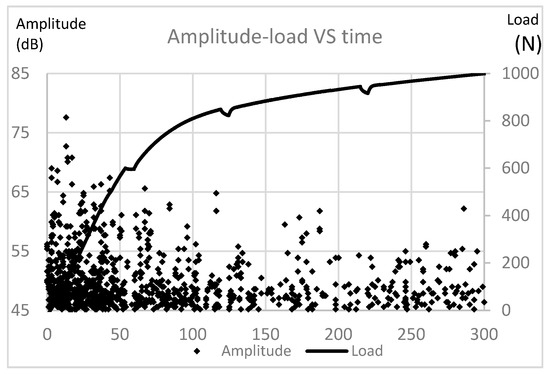
Figure 7.
Overlap of peak amplitude of events and load vs. time.
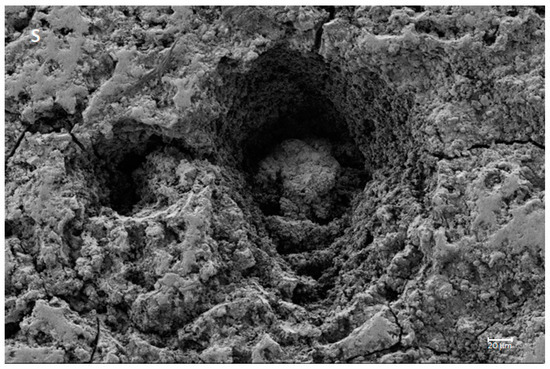
Figure 8.
FE-SEM 250×, series S surface.
In addition, in the intervals of relaxation, the stationary times, and at the same displacement, between the seconds 54 to 59 or 119 to 124 an events silence appears. Then, after the load is resumed, new events appear immediately. This clearly reveals that in the ceramic coating there is no relaxation or stress relief during the relaxation period.
The relaxation period exhibits a clear decrease in stresses from 849 to 822 N, an almost 4% elastic recovery with no AE events. The AE silence could be attributed to no relaxation in the ceramic coating.
3.3. Cumulative Energy Analysis
Figure 9 represents the mean behaviour of cumulative energy-counts vs. time series R and S of the six samples of the series studied. Examining the curves corresponding to the Al2O3/Y-TZP (yellow and grey), in the R series, there are two clearly identified zones: the first one, up to approximately 400 s, where the energy and the number of accounts is proportional with a ratio of 3.21; and the second, where the energy–account ratio is slightly lower with a value of 3.02, see Table 3.
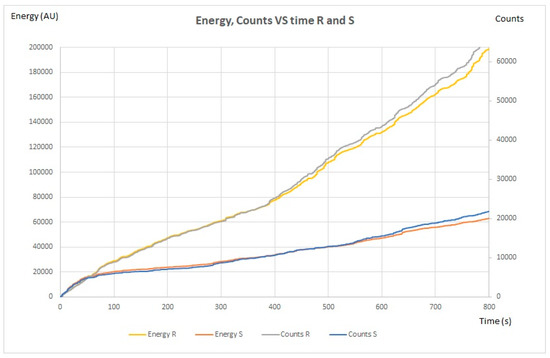
Figure 9.
Cumulative energy counts vs. time series R and S.
Table 3.
Energy-counts ratio.
Observing the blue and orange curves in Figure 9 of the S series, Al2O3/Y-TZP + SiC 15 wt.%, which represents the cumulative energy counts vs. time, there are three clearly identified areas. The first one from 0 to 20 s where the energy and the number of accounts are proportional, with a factor of 3.23; a second region of 20 to 400 s where the energy is slightly higher than the number of accounts, with a factor of 3.32; and a third that goes from 400 to 800 s, with a rate of 3.02, as summarized in Table 3.
In the case of the R + S bi-layer series, with an internal coating of Y-TZP/Al2O3 and external coating of Y-TZP/Al2O3 + 15% SiC, Figure 10 exhibits three clearly differentiated zones: the first with an exponential growth of events similar to R and S series, a second zone basically without events, and a third zone again with an exponential growth of these. Analysing the values of the released energy ratio, in the first zone from 0 to 20 s, the value is 2.92, a value significantly lower than those in the previous cases and with a deviation of 0.83. This is a noticeable finding that indicates there is great dispersion in the energy release rate. This difference, with respect to the previous cases, may be the product of short delaminations between layers R and S, as shown in Figure 11a with low energy and some others with same energy as previous series like the crack in Mode I in Figure 11b. Figure 11c shows a micrograph with a delamination between the layer and bond coat.
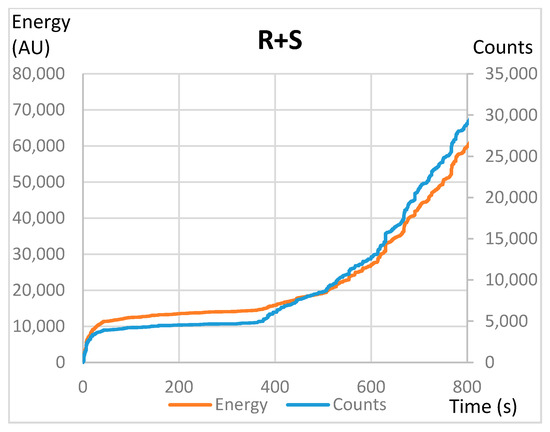
Figure 10.
Cumulative energy counts vs. time of the R + S bilayer series.
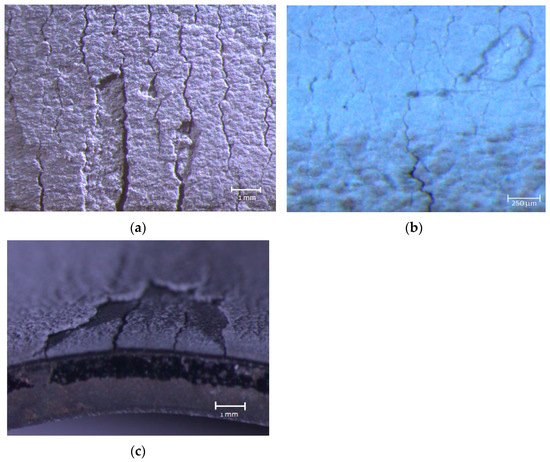
Figure 11.
(a) Delamination between layers. (b) Fracture Mode I. (c) Delamination between layer and bond coat.
Figure 12 shows a scheme of the crack type in Modes I and II, and delaminations that arise in a TBC.
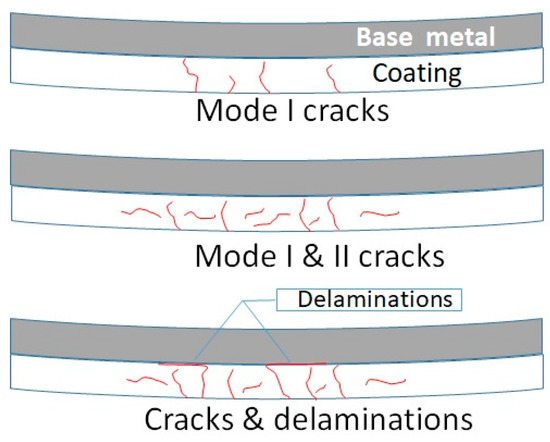
Figure 12.
Failure mode scheme.
In all cases for series R (Y-TZP/Al2O3), S (Y-TZP/Al2O3 + 15% SiC), and R + S ((Y-TZP/Al2O3) + (Y-TZP/Al2O3 + 15% SiC)), in the first zone 0–20 s, the energy release is due to the formation of Mode I cracks in the ceramic. This is due to normal stresses in the ceramic layer. In the case of energy relationship events of 3.22 for the S series and 3.23 in the R, these values are basically similar. However, in the case of the R + S bilayer, this ratio is 2.92, which indicates that in this first stage, the energy release in general is less than in the previous ones. This phenomenon can be attributed to the creation of perpendicular cracks in Mode I, with an energy release similar to the previous ones. However, these cracks can trigger small cracks between layers with low energy release, which leads to the rise of energy release variation.
In the second stage, 20–400 s, it was revealed that the addition of SiC in the coating (S series) increases the energy events ratio. In this case, with a comparatively higher value of 3.32 against 3.21 in the R series, it clearly indicates a greater release of energy per event. The addition of SiC in the Al2O3/Y-TZP matrix acts as a stress concentrator that aids the formation of cracks in Mode II, releasing a greater amount of energy per event.
The third zone, 400–800 s, has a lower energy-counts ratio, due to the propagation of delaminations in thermal barriers that can generate different modes of fracture [22]. In this case, some delaminations are generated with a high energy level, and some by the collapse of many small cracks of short length in Mode I and II with very low energy level as described by Keshtgar and Modarres [23].
3.4. Energy Analysis between Series
As noticed in Table 3, despite the microstructural difference, it was detected that the mean energy–event ratio was generally 3.10 for the R series and 3.18 for the S series (Y-TZP/Al2O3 + 15% SiC). From these results, it can be inferred that the S series releases slightly more energy due to SiC stress concentrator.
However, as seen in Figure 13, in the first 20 s, the energy released ratio is similar in both series R and S. The degree of porosity, unfused, and inclusions of SiC present in the S series do not seem to be important in this first stage, which is settled in the study by Berndt et al. [24] where the acoustic emission activity is due to micro cracking between pores as seen in Figure 8, and in “bridges” between fragments as shown in Figure 14. However, in the case of the bilayer, the dispersion of energy release is greater. This is attributed to the fact that after Mode I cracking, micro delaminations occur between layers with low energy, hence resulting in the diminution in energy and the larger dispersion in the energy release rate.
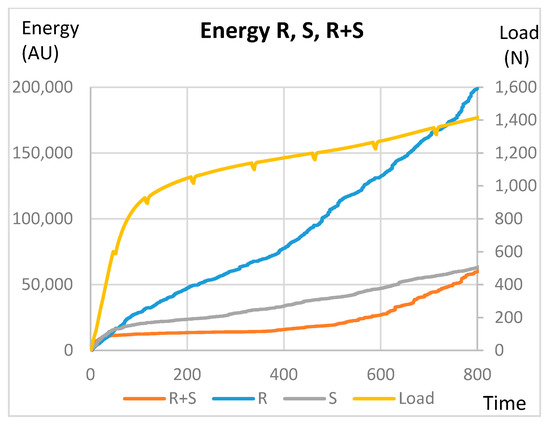
Figure 13.
Energy released and load vs. time of series R, S, and R + S.
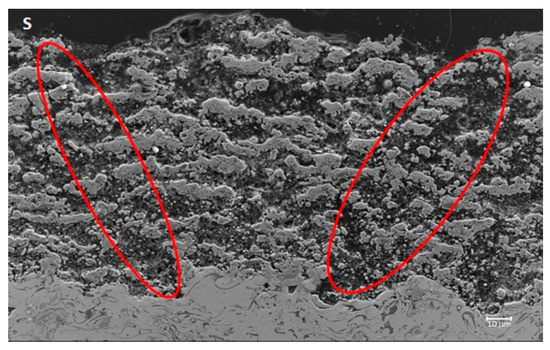
Figure 14.
SEM cross section series S 500×.
Figure 13 shows that from 400 s on the R and R + S series, the energy slope slightly increases. This phenomenon is justified by the appearance of delaminations between the anchor layer and the Al2O3/Y-TZP layer. These turn into release of tensions and reorientation of the ceramic layer and lead to new cracks in Mode I.
3.5. Analysis Number of Events Per Series
It is important to note, as can be seen in Figure 15, that under the same test, the R-series specimens (Y-TZP/Al2O3) generate a greater number of events than those corresponding to the S and R + S series. This is due to the large number of unfused particles combined with the high level of porosity, defects, and inclusions of SiC that make it fundamentally pre-cracked, resulting in its low level of events as proposed by Park et al. [25].
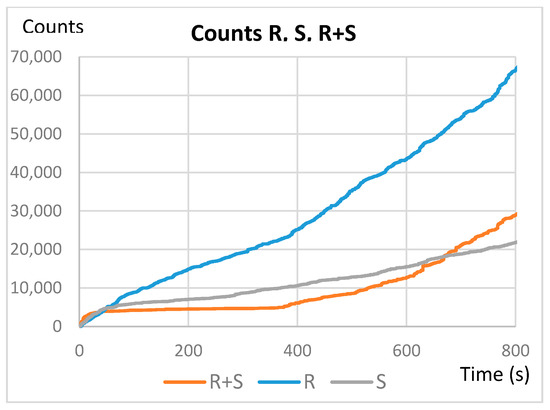
Figure 15.
Comparison of the number of hits between the S, R, and R + S series.
It should be noted that in the R + S series, despite the silence of events in the interval of 20–400 s approximately, it has a slope increase. This phenomenon is fundamentally attributed to the delamination process between the substrate and the Al2O3/Y-TZP layer. Additionally, it can be seen that by the end of the first stage (20 s), the number of events is relatively similar in all series. However, at the end of the test, the R + S series had 43% of the R events and the S series only 32%. This clearly indicates that the anchoring of the R layer plays an important role in the mechanical behaviour of the barrier.
3.6. Finite Elements Analysis
To corroborate the aforementioned, an ANSYS finite element simulation was performed on a model with a continuous barrier (Figure 16a) and with a segmented barrier of 10 mm in length (Figure 16b). The latter emulates the fragmentation presented in the S series, as seen in Figure 14. This model shows that just by sectioning the material into ten fragments, contrary to what might be expected, there is a slight stress increase in the ceramic coating approximately at one third of each section (Figure 16b). This certainly justifies the increase in energy release presented by the S series (Y-TZP/Al2O3 + 15% SiC) with respect to the R series in the second stage, because this is the triggering effect for fractures in Modes I and II with a higher energy level. It accords with Palacio [26], who points out that coating voids and cracks represent structure discontinuities, facilitating the development of stress gradients around such gaps, and increasing the sensitivity to localized damage in areas adjacent to discontinuities in the coating.
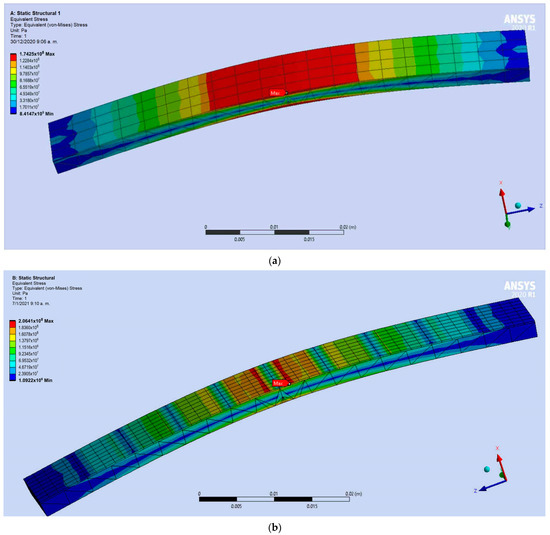
Figure 16.
Finite elements simulation of a (a) plate with continuous coating and a (b) plate with segmented coating.
However, this does not account for the decrease in events presented by the S and R + S series in the second stage after 20 s. For this, a model was made where in the central area of the specimen the segments were a little smaller, in this case 1 mm (Figure 17a), getting closer to the microstructural reality of the layer as the bridges between segments are fractured. In this model (Figure 17a), the reduction of efforts in the ceramic barrier is notorious. This fact clarifies the decrease of events in the second zone observed in Figure 15. However, this does not justify the increase in events presented by the R + S series after 400 s.
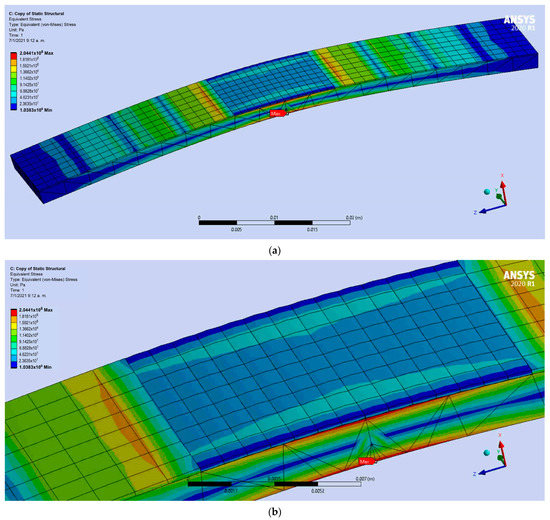
Figure 17.
(a) Finite element simulation of stress reduction due to fragmentation into 1 mm segments. (b) Enlarged image of simulation.
Figure 17b is a zoomed in image of Figure 17a. It can explain the R + S behaviour, because the Al2O3/Y-TZP layer shows better anchorage performance so a higher level of stress is needed to delaminate this, which would justify this increase in events, such as short-range delamination processes with very low energy, which is corroborated with the appearance of 600 and 700 KHz events.
3.7. Frequency Analysis
Several authors infer that the frequency content of the wave is affected by the type of crack [12,27]. Wang et al. [12] defines three frequency bands of AE for the substrate base metal (superalloy-intermetallic), and four for the base metal-substrate-coating set in the range of 125–175, 175–225, 225–300, and 300–400 KHz. Additionally, they express that the frequencies vary depending on the base metal and/or type of coating. On the other hand, Zhou [27] indicated that the frequencies of 140 KHz correspond to the deformation of the substrate, 220–250 KHz to vertical cracks, and 80–100 KHz to interfacial delamination.
As referenced [12], the frequency range between 130–160 KHz is attributed to dislocation slip in the base metal and the peak sensitivity of the sensor to the frequency (150 KHz) that is –64 dB.
Comparing the results obtained with the sensors VS. 150 M and VS. 700 D, it was initially noted that certain patterns attributed to a phenomenon with a sensor do not appear or are less noticeable with another sensor. This can be clarified when observing the sensitivity parameters of the sensors. The peak sensitivity of the VS. 150 M sensor is at 150 KHz, with 20 dB more than the sensitivity of the VS. 700 D at the same frequency. In the same way, the sensitivity at 400 KHz for the VS. 700 D sensor has a sensitivity 12 dB lower. However, at higher frequencies, the sensitivity of the VS. 700 is much better.
The wavelet transforms are a mathematical method which transmutes waves so, the wavelet coefficients can be obtained as a function of the frequency of each event (Figure 18, Figure 19 and Figure 20). These graphs provide information on the maximum energy of an event depending on the frequency during that period (blue line) and also the energy at a given moment with its corresponding frequency distribution (red line).
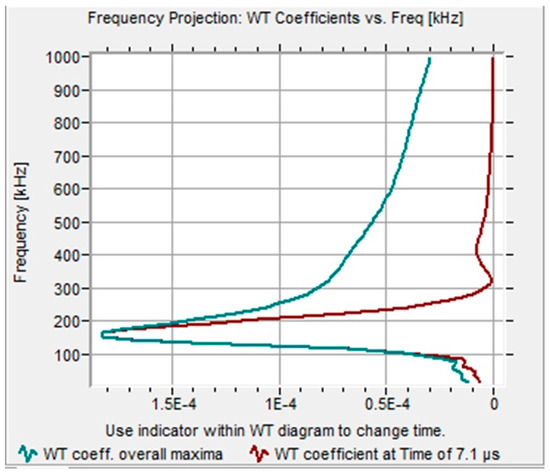
Figure 18.
Wavelet of base metal dislocation slip.
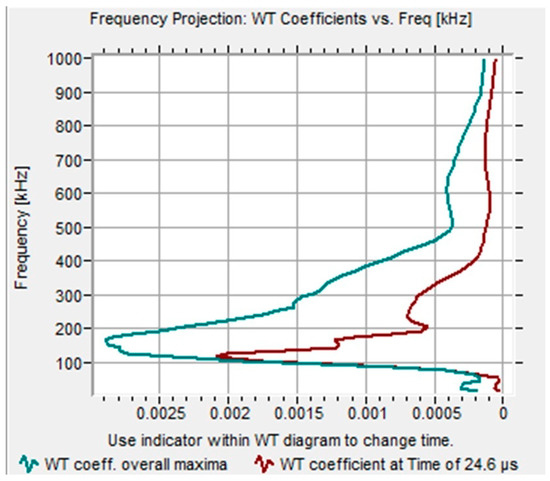
Figure 19.
R series wavelet at 2 s.
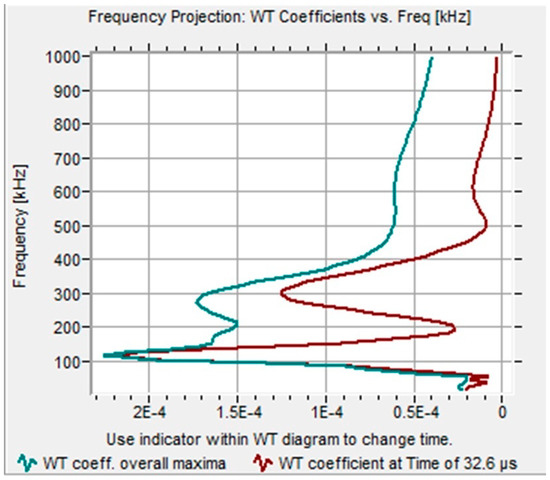
Figure 20.
Series S Wavelet associated to Mode I and II cracks.
To discriminate between the events and frequencies associated with the base metal and intermediate layer, tests were carried out with base metal specimens + intermediate layer with both VS. 150 M and VS. 700 D sensors. It was seen that the frequencies of 175 KHz on sensor VS. 150 M, and 175 and 275 KHz on sensor VS. 700 D were the frequencies associated with the dislocation slip in this intermediate substrate.
In the tests of the R, S, and R + S series specimens, a range of frequencies appears to be associated with different types of failure. Figure 18 represents a single peak over 175 KHz which is related to the shift of dislocations in the base metal.
Taken as a starting point, the division of the stages exposed in Section 3.3 as the start of the test, in the first period of 0–20 s, the stress level on the bending test led to Mode I cracks perpendicular to surface, with acoustic events of relatively low frequencies, a cluster around 100–120 KHz on both kind of sensors. Figure 19 shows that at 2 s of the test, 24.6 μs after the event initiation (red curve), there is a peak over 110 KHz associated with a Mode I fracture. Nevertheless, as can be seen, the blue curve shows one other important fact, a 175 KHz frequency was associated with a dislocation slip. It is quite normal to find more than one emission in one event at different stages of it.
In the second stage, 20–400 s, events begin to appear at higher frequencies of up to 300 KHz. In the case of the S series, the addition of SiC generates stress concentrators and discontinuities increasing fragility, which enhances failure generation in Mode II which is associated with frequencies between 250–325 KHz.
Figure 20, corresponding to the second stage (20 to 400 s), shows peaks at 120 and 275 KHz. The first one is associated to a Mode I crack, and the second a Mode II crack.
It is important to highlight that in the same event recorded, many patterns of frequencies are registered. This phenomenon can be observed in Figure 21a,b, where at 37.6 μs (red curve), Figure 21a, a Mode II crack (250 KHz) appears, triggering a delamination (600 KHz) at 53.4 μs as shown in Figure 21b.
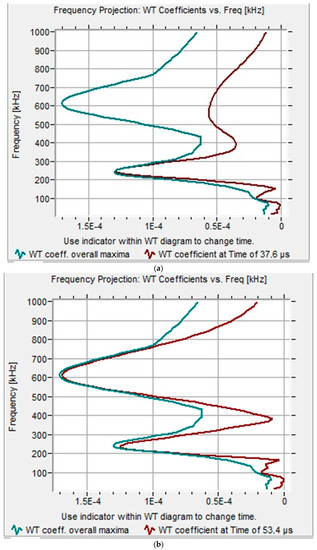
Figure 21.
Wavelet associated to Mode II crack and delamination. (a) Crack pattern at 37.6 μs, (b) delamination pattern at 53.4 μs.
Zone III (400–800 s) is characterized by the beginning of delamination processes, which is revealed with the appearance of high frequency acoustic events of 400 KHz with VS. 150 M sensor and 400, 600, or 800 KHz on VS. 700 D sensor, as shown in Figure 21a,b.
The delamination events occur at the end-half of the test, with a ceramic stress higher than 785 MPa in the S series, 845 MPa in the R series, and 790 MPa in R + S series.
4. Conclusions
From the study carried out, it can be concluded that acoustic emission is a fundamental tool in the study of the mechanical behavior of thermal barriers. Proper selection of the EA sensor eases frequency discrimination and analysis. The analysis by wavelet transforms aids the study and analysis of the recorded sound spectra.
The high density of microstructural defects, porosity, and unfused particles, combined with the thermal stresses in the barrier itself leads to a brittle behavior.
In the flexural test, generation of cracks were detected at very low stress levels, as well as in the high rate of events in the thermal barriers studied.
The addition of SiC substantially reduced the cracking capacity, with up to three times fewer events with stresses greater than 300 MPa. In the same way, there is a marked decrease in events with respect to the barrier that does not contain the sealing agent, 57% less events in the case of the bilayer, and 68% less in the case of the SiC monolayer. The addition of SiC plays an important role in the mechanical behavior of the barrier, substantially decreasing the mechanical resistance of the barrier. Nevertheless, at the end of the first stage (20 s), the number of events were relatively similar in all series.
The SiC addition enhance the unfused zones, forming a more porous like material.
The delamination process between the substrate and the Al2O3/Y-TZP layer was noticed at stresses higher than 845 MPa in the R series (Y-TZP/Al2O3), 785 MPa in the S series (Y-TZP/Al2O3 + 15% SiC), and 790 MPa in the bilayered R + S.
Three frequency patterns associated with the thermal barrier cracking mode were detected and identified. There was a pattern of 100–120 KHz for Mode I fractures, another pattern of 150 and 250–325 KHz for Mode II and III fractures, and finally, a pattern of 400, 600, and 800 KHz for delaminations.
Author Contributions
D.J.B. was involved in the conceptualization, methodology, validation, and investigation. C.B. participated in conceptualization of the research and methodology, developing the three-point bending test and acoustic emission, the data management, FEA, writing, reviewing, and editing. A.B. took part in microstructural analysis, investigation, and funding acquisition. M.D.S. was involved in the conceptualization, methodology, validation, writing, reviewing, editing, supervising, and funding acquisition. All authors have read and agreed to the published version of the manuscript.
Funding
This research was funded by Ministry of Economy, Industry, and Competitiveness of the Government of Spain, (MINECO), to the RTI 2018-099033-B-C32-RETOS and Ramón y Cajal-2016-20915.
Acknowledgments
The authors wish to thank the financial contribution of the Ministry of Economy, Industry, and Competitiveness of the Government of Spain, (MINECO), and to the RTI 2018-099033-B-C32-RETOS. A. Borrel acknowledges her contract (RyC-2016-20915).
Conflicts of Interest
The funders had no role in the design of the study: in the collection, analyses, or interpretation of data; in the writing of the manuscript; or in the decision to publish the results.
References
- Marino, K.A.; Hinnemann, B.; Carter, E.A. Atomic-scale insight and design principles for turbine engine thermal barrier coatings from theory. Proc. Natl. Acad. Sci. USA 2011, 108, 5480–5487. [Google Scholar] [CrossRef]
- Van der Zwaag, S.; Van Dijk, N.H.; Jonkers, H.M.; Mookhoek, S.D.; Sloof, W.G. Self-healing behaviour in man-made engineering materials: Bioinspired but taking into account their intrinsic character. Philos. Trans. R. Soc. A 2009, 367, 1689–1704. [Google Scholar] [CrossRef]
- Moreno, R. Better ceramics through colloid chemistry. J. Eur. Ceram. Soc. 2020, 40, 559–587. [Google Scholar] [CrossRef]
- Bekas, D.; Tsirka, K.; Baltzis, D.; Paipetis, A. Self-healing materials: A Review of advances in materials, evaluation, characterization and monitoring techniques. Compos. Part B 2016, 87, 92–119. [Google Scholar] [CrossRef]
- Ouyang, T.; Fang, X.; Zhang, Y.; Liu, D.; Wang, Y.; Feng, S.; Zhou, T.; Cai, S.; Suo, J. Enhancement of high temperature oxidation resistance and spallation resistance of SiC-self-healing thermal barrier coatings. Surf. Coat. Technol. 2016, 286, 365–375. [Google Scholar] [CrossRef]
- Carnicer, V.; Martinez-Julian, F.A.; Orts, M.J.; Sánchez, E.A.; Moreno, R.B. Effect of fructose-containing feedstocks on the microstructure of multicomponent coatings deposited by suspension plasma spraying. J. Eur. Ceram. Soc. 2019, 39, 3433–3441. [Google Scholar] [CrossRef]
- Quemard, L.; Rebillat, F.; Guette, A.; Tawil, H.; Louchet-Pouillerie, C. Self-healing mechanisms of a SiC fiber reinforced multi-layered ceramic matrix composite in high pressure steam environments. J. Eur. Ceram. Soc. 2007, 27, 2085–2094. [Google Scholar] [CrossRef]
- Carnicer, V.; Orts, M.J.; Moreno, R.; Sánchez, E. Microstructure assessment of suspension plasma spraying coatings from multicomponent submicroscopic Y-TZP/Al2O3/SiC particles. Ceram. Int. 2018, 44, 12014–12020. [Google Scholar] [CrossRef]
- Károly, Z.; Bartha, C.; Mohai, I.; Balázsi, C.; Sajõ, I.E.; Szépvölgyi, J. Deposition of silicon carbide and nitride-based coatings by atmospheric plasma spraying. Int. J. Appl. Ceram. Technol. 2013, 10, 72–78. [Google Scholar]
- Pawlowski, L. Suspension and solution thermal spray coatings. Surf. Coat. Technol. 2009, 203, 2807–2829. [Google Scholar] [CrossRef]
- Dassios, K.; Kordatos, E.; Aggelis, D.; Matikas, T. Crack Growth Monitoring in Ceramic Matrix Composites by Combined Infrared Thermography and Acoustic Emission. J. Am. Ceram. Soc. 2014, 97, 251–257. [Google Scholar] [CrossRef]
- Wang, L.; Ni, J.X.; Shao, F.; Yang, J.S.; Zhong, X.H.; Zhao, H.Y.; Liu, C.G.; Tao, Y.; Wang, Y.; Li, D.Y. Failure behaviour of plasma sprayed Yttria-Stabilized Zirconia Thermal Barrier Coatings Under Three-Point Bending Test via Acoustic Emission Technique. J. Therm. Spray Technol. 2017, 26, 116–131. [Google Scholar] [CrossRef]
- Ma, X.Q.; Cho, S.; Takemoto, M. Acoustic emission source analysis of plasma sprayed thermal barriers coatings during four point bend tests. Surf. Coat. Technol. 2001, 139, 55–62. [Google Scholar] [CrossRef]
- Drozdov, A.; Galenko, V.; Gogotsi, G.; Swain, M. Acoustic Emission during Micro- and Macrocrack Growth in Mg-PSZ. J. Am. Ceram. Soc. 2005, 74, 1922–1927. [Google Scholar] [CrossRef]
- Stavrakasa, I.; Triantisa, D.; Kourkoulisb, S.K.; Pasioub, E.D.; Dakanalib, I. Acoustic Emission Analysis of Cement Mortar Specimens during Three Point Bending Tests. Lat. Am. J. Solids Struct. 2016, 13, 2283–2297. [Google Scholar] [CrossRef]
- Budynas, R.G.; Nisbett, J.K. Diseño en Ingeniería Mecánica de Shigley, 8th ed.; McGraw-Hill: Mexico City, Mexico, 2008; pp. 85, 86, 995. [Google Scholar]
- Carpio, P.; Candidato, R., Jr.; Pawlowsky, L.; Salvador, M.D. Solution concentration effect on mechanical injection and deposition of YSZ coatings using the solution precursor plasma spraying. Surf. Coat. Technol. 2019, 371, 124–130. [Google Scholar] [CrossRef]
- Eleni, T.; Livitsanos, G.; Remy, O.; Aggelis, D.G. Damage assessment of novel pre-fabricated concrete elements based on acoustic emission measurements and kaiser/felicity effect analysis. In Proceedings of the 14th International Conference of the Slovenian Society for Non-Destructive Testing (NDT-Slovenia 2017), Bernardin, Slovenia, 4–6 September 2017; pp. 299–304. [Google Scholar]
- Kondoh, J.; Shiota, H.; Kawachi, K.; Nakatani, T. Yttria concentration dependence of tensile strength in yttria-stabilized zirconia. J. Alloys Compd. 2004, 365, 253–258. [Google Scholar] [CrossRef]
- Surgeon, M.; Vanswijgenhoven, E.; Wevers, M.; Van der Biest, O. Acoustic emission during tensile testing of SiC-fibre-reinforced BMAS glass-ceramic composites. Compos. Part A 1997, 28A, 473–480. [Google Scholar] [CrossRef]
- Boatemaa, L. Self-Healing Al2O3 Ceramics: Selection and Testing of Novel Healing Particles. Ph.D. Thesis, Delft University of Technology, Delft, The Netherlands, 2018. [Google Scholar]
- Jiang, P.; Fan, X.; Sun, Y.; Li, D.; Li, B.; Wang, T. Competition mechanism of interfacial cracks in thermal barrier coating system. Mater. Des. 2017, 132, 559–566. [Google Scholar] [CrossRef]
- Keshtgar, A.; Modarres, M. Detecting Crack Initiation Based on Acoustic Emission. Chem. Eng. Trans. 2013, 33, 547–552. [Google Scholar]
- Berndt, C.C.; Lin, C.K.; Leigh, S.-H. Characterization of Cracking within Thermal Spray Deposits by an Acoustic Emission Method Extended Abstract. J. Therm. Spray Technol. 1998, 7, 334–336. [Google Scholar] [CrossRef]
- Park, J.H.; Kim, J.S.; Lee, K.H. Acoustic emission Characteristics for diagnosis of TBC damaged by high temperature thermal fatigue. J. Mater. Process. Technol. 2007, 187–188, 537–541. [Google Scholar] [CrossRef]
- Palacio, C. Análisis de la respuesta mecánica de recubrimientos elaborados mediante proyección térmica por plasma usando la medición de esfuerzos residuales y el método de elementos finitos a escala estructural: Efecto de la red de poros. Rev. Chil. Ing. 2011, 19, 323–335. [Google Scholar] [CrossRef]
- Zhou, M.; Yao, W.B.; Yang, X.S.; Peng, Z.B.; Li, K.K.; Dai, C.Y.; Mao, W.G.; Zhou, Y.C.; Lu, C. In-situ and real-time tests on the damage evolution and fracture of thermal barrier coatings under tension: A coupled acoustic emission and digital image correlation method. Surf. Coat. Technol. 2014, 240, 40–47. [Google Scholar] [CrossRef]


Publisher’s Note: MDPI stays neutral with regard to jurisdictional claims in published maps and institutional affiliations. |
© 2021 by the authors. Licensee MDPI, Basel, Switzerland. This article is an open access article distributed under the terms and conditions of the Creative Commons Attribution (CC BY) license (http://creativecommons.org/licenses/by/4.0/).