Abstract
In this work, the manufacturing characteristics and a performance evaluation of carbon fiber–reinforced epoxy honeycombs are reported. The vacuum-assisted resin transfer molding process, using a central injection point, is used to infuse a unidirectional dry slit tape with the epoxy resin system Prime 20 LV in a wax mold. The compression behavior of the manufactured honeycomb structure was evaluated by subjecting samples to quasi-static compression loading. Failure criteria for the reinforced honeycombs were developed and failure maps were constructed. These maps can be used to evaluate the reliability of the core for a prescribed loading condition. Improvements in the load-carrying capacity for the reinforced samples, as compared with unreinforced specimens, are discussed and the theoretical predictions are compared with the experimental data. The compression test results highlight a load-carrying capacity up to 26 kN (~143 MPa) for a single hexagonal cell (unit cell) and 160 kN (~170 MPa) for cores consisting of 2.5 × 3.5 cells. The failure map indicates buckling to be the predominant mode of failure at low relative densities, shifting to cell wall fracture at relative densities closer to a value of 10−1. The resulting energy absorption diagram shows a monotonic increase in energy absorption with the increasing t/l ratio of the honeycomb core cell walls.
1. Introduction
Honeycomb cores are predominantly used in sandwich panels finding applications in a variety of lightweight structures in the aerospace sector. Common aircraft structures in which honeycombs are used include fairings, spoilers, helicopter blades, galleys, flooring, wall panels, and so forth [1]. Many of these structures use aluminum and/or aramid paper–based honeycombs, due to their high strength-to-weight ratio and excellent fire, smoke, and toxicity performance. Aramid-based cores such as Nomex™ offer advantages that include a lower cost and density compared to aluminum cores. However, both cores are sensitive to moisture and exhibit structural deficiencies under prolonged moisture exposure. Therefore, to overcome these drawbacks whilst improving strength and stiffness, the search for structurally-efficient materials has led to the development of fiber-reinforced composite honeycombs. For example, Rao and co-workers [2] produced honeycomb cores that were made using short fiber–reinforced thermoplastic composites and reported a significant improvement in the mechanical and functional properties [3]. Petrone et al. [4,5] investigated the effect of short and long fiber reinforcements in the cell walls on the dynamic behavior of the core and reported substantial improvements in the load-carrying capacity when the short fibers are replaced by continuous filaments. Vivolo et al. [6] investigated the noise, vibration, and harshness (NVH) behavior of fiber-reinforced thermoplastic cores and reported improvements in transmission loss values after reinforcement. Manufacturing details of such cores, along with mechanical and functional properties, can be found in the monograph by Rao et al. [7]. Further literature focusing on a similar theme but different structures, such as the pyramidal truss or lattice and foldcore designs, based on fiber-reinforced composites is available in References [8,9,10,11,12,13]. In the continuous quest for improving properties, several researchers have sought to understand the behavior of such materials by modelling them theoretically. However, due to manufacturing difficulties, little work has been undertaken to assess the properties of honeycomb structures manufactured using carbon fiber epoxy composites. One notable work is that by Russell et al. [14], who manufactured and conducted experiments and numerical analyses on carbon fiber epoxy composite cores based on a square geometry. The manufacturing technique involved slotting rectangular sheets together, assembling them into a square honeycomb configuration, and adhesively bonding the composite laminate sheets. The authors showed that the compressive strength of such structures is strongly dependent on the fiber orientation and laminate type. They also noted that the composite honeycombs failed by either elastic buckling or plastic micro-buckling when loaded in compression.
One important application of honeycombs is energy absorption whereby the kinetic energy due to impact is absorbed by the cell walls through plastic deformation. A detailed review of such mechanisms, along with the mechanical properties of several other cellular solids is available in Gibson and Ashby [15]. The authors introduced a key design concept of maps based on failure modes of the structure, from which Petras and Sutcliffe [16] developed failure-mode maps for Nomex honeycomb core sandwich panels under three-point bending. The failure mechanisms involved included yielding of the top skin, intra-cell buckling, face wrinkling, core shear, and indentation. Many earlier efforts [17,18,19,20] focusing on the determination of the honeycomb crush behavior and energy absorption capability have concentrated on out-of-plane compressive loading. Failure initiation and propagation in a honeycomb under quasi-static and impact loading have both been described in detail [16]. Khan et al. [18] undertook a series of in-plane and out-of-plane quasi-static compression tests on aluminum samples. The authors noted that the core showed a greater ability to absorb energy when loaded in the out-of-plane direction, due to the fact that the cell walls collapsed plastically in a combination of global and local buckling. This was also observed in a recent study by Ivañez et al. [19] where it was found that the specific energy absorption values in the out-of-plane direction were two orders of magnitude greater than in the in-plane directions. Meran et al. [20] explored a number of crashworthiness parameters for honeycombs, both experimentally and numerically, and observed that energy absorption is influenced by the material properties, geometry, thickness, and angle of the cell walls.
The focus of this study is on the manufacturing and testing of composite honeycomb structures made from a dry carbon slit tape. Here, a novel and practical methodology to fabricate the composite honeycomb core structures using the vacuum-assisted resin transfer molding (VARTM) method is introduced. The mechanical performance of the composite honeycombs subjected to out-of-plane compressive loading was investigated. Finally, failure criteria were developed, and failure maps were constructed to predict the mechanical properties of the composite honeycomb core structures. The energy absorption characteristics were determined experimentally using quasi-static compression tests and predicted for a number of other core densities using finite element analysis techniques. Energy absorption maps were developed, based on experimental and numerical data for several core densities.
2. Materials and Methods
A honeycomb core template was manufactured from acrylonitrile butadiene styrene (ABS) polymer using a 3D printer, Connex 260, with a build volume of 260 × 260 × 200 mm. The resolution was maintained at its finest level (600 × 600 dpi) to ensure a smooth finish. Liquid wax was poured into the template allowing the wax to cool and take the shape of the honeycomb mold, Figure 1, after which the plastic template was carefully extracted. Dry fiber Automated Fiber Placement (AFP) slit tapes, PRISM TX1100, having an areal weight of 196 g/m2, obtained from Cytec, was cut to match the height of the hexagonal struts in the mold and then compacted under vacuum for 30 min. The pre-compacted tapes were then inserted between the gaps of the hexagonal struts. An infusion mesh (Knitflow 40 with an areal density of 172 g/m2 from Gurit, Zurich, Switzerland) was used as a flow medium under the injection port extending to 50 mm from the periphery of the mold. Strips of Nylon peel ply (82 g/m2) from Airtech was used at the four corners of the mold to direct the resin flow towards the flow distribution media at the mold boundary. A central injection method on the part was chosen to infuse the structure to avoid race tracking and resin-rich areas, which facilitates a uniform in-plane flow, followed by out-of-plane resin permeation through the fiber bundles. A schematic of the setup is shown in Figure 1. Prior to infusion, the assembly was bagged and held under 98% vacuum for 6 h during which time vacuum levels were measured every 5 min to check for leaks. The measurements taken over 6 h showed the leak to be lower than 5 mbar. An infusion resin (Prime 20 LV, 400g with a slow hardener (mixing ratio 100:26 g) from Gurit) was used to infuse the mold after degassing for 15 min in a vacuum pot. A central radial injection method was used to infuse the assembly using an 8 mm diameter 0.5 m long Poly Vinyl Chloride (PVC) hose. The infusion duration for the resin to reach the edge of the mold was approximately 35 min and 70 min to the outlet, after which the inlet was clamped and the assembly was cured at room temperature for 36 h. The core was then post-cured in a convection oven at 65°C for 7 h during which time the wax mold melted, leaving behind the fully cured carbon fiber–reinforced hexagonal core. The cells in the core had an inscribed circle diameter of 15 mm, a cell wall thickness of 1.5 mm and a cell wall length of 10 mm. The cured hexagonal core was trimmed to a height of 20 mm on a table saw using a diamond tip rotary tool in preparation for mechanical testing. Cores with a fiber volume fraction of 0.70 were manufactured in order to investigate the effect of carbon fiber reinforcement on the compressive properties.
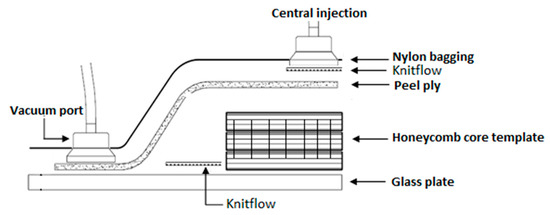
Figure 1.
A schematic of the vacuum-assisted resin transfer molding (VARTM) process used to manufacture the hexagonal honeycombs.
3. Testing
The 20 mm high core was cut to samples with dimensions 62 × 62 mm, resulting in 2.5 × 3.5 cells and 20 × 20 mm, resulting in a single unit cell. Five specimens of each type were tested in compression as per standard ASTM C 365. A crosshead speed of 2 mm/min was chosen and a self-aligning spherical block was used to ensure that the load application was normal at all times. A standard preload of 45 N was applied and the load vs. deflection traces were recorded at a sampling rate of five data points per second. The chord modulus was taken over the 25% and 45% deflection range of the load vs. deflection trace and the compression strength was calculated from the peak stress and the effective area of the honeycomb core. To determine fiber volume fraction in the cell walls, polished cross-sections of individual cell walls were examined under a stereo microscope, Zeiss AX10 (Oberkochen, Germany), and the fiber volume fraction was determined by analyzing micrographs using the image analysis package in Matlab.
To determine energy absorption, the honeycombs were tested under flatwise-bare compression, as per standard ASTM C 365, on a universal testing machine, MTS DBSL-30t. Unit cells and 2.5 × 3.5 cell specimens of 20 mm height were subjected to compressive loading at a crosshead displacement rate of 5 mm/min until densification.
4. Results
4.1. Fiber Volume Fraction
Three regions (shaded white in Figure 2) in the micrographs of images captured at magnifications of 10× and 20× were used to calculate the fiber volume fraction. Three specimens in total were sampled, and their respective volume fractions along with averages and standard deviations are listed in Table 1. From the micrographs, it is evident that the fibers are uniformly distributed within the matrix, with no trace of large resin-rich areas or inadequate compaction. Only a marginal difference (7%) between the target and measured volume fraction was observed.
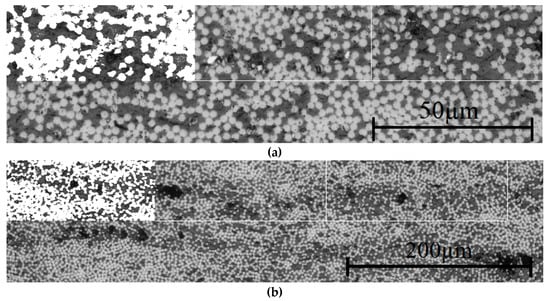
Figure 2.
Cross-sectional micrographs of the cell wall of the manufactured honeycomb at magnifications of (a) 10× and (b) 20×. Region 1, with region 2 and 3 lying beside it demarcated in white, was chosen to calculate the fiber volume fraction and is shaded in white.

Table 1.
Region-wise listing of fiber volume in percentage of three samples of carbon fiber–reinforced cores.
4.2. Compression Tests
From the compression stress vs. strain traces for the unit cell and the 2.5 × 3.5 cells, both structures exhibit an initial linear response before reaching maximum values of approximately 245 and 235 MPa, respectively. The cell walls in the unit cell exhibit a maximum strain of 0.03%, following which they deform by bending, buckling, and finally collapsing.
Failure instability initiates at 0.02% strain due to cell wall kinking (Figure 3(i,iii)) at the bottom support at a compressive stress of approximately 185 MPa in the single unit cell and 175 MPa in the 2.5 × 3.5 cells. The cell walls then buckle at approximately 225 MPa for the case of the unit cell and 200 MPa for the 2.5 × 3.5 cell samples. Vertical cracks start to develop at the junction of the inclined and the vertical cell walls shortly afterwards (indicated by the white arrows in Figure 3(ii,iv)), followed by the progressive collapsing of the cell wall after the peak compressive stress.
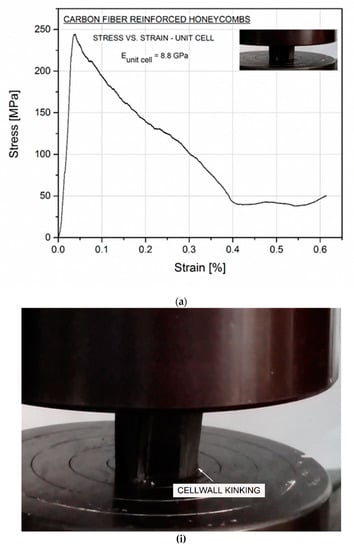
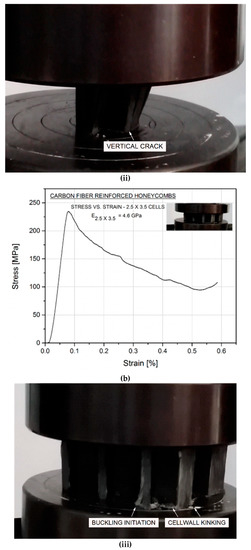
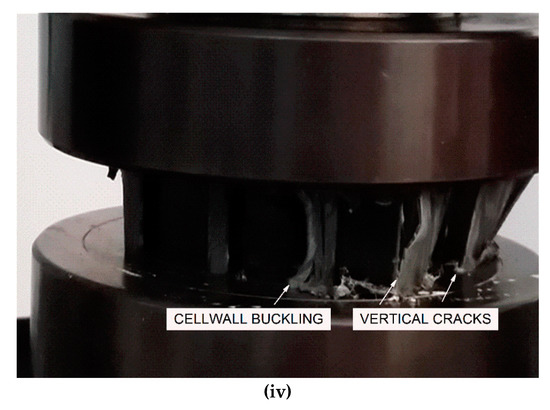
Figure 3.
Stress vs. strain traces of fiber-reinforced honeycombs used to calculate elastic modulus of (a) unit cell and (b) cores based on 2.5 × 3.5 cells. (i) Unit cell cell-wall kinking at supports, (ii) vertical cracks developed at supports, (iii) cell wall buckling initiation and kinking of 2.5 × 3.5 cell core (iv), and core failure due to buckling-initiated cell wall rupture.
4.3. Failure Maps
The failure criteria were established for cores with uniform cell wall thickness and the material being linear elastic specially orthotropic. The unit cell approach used here considers the periodicity and symmetry in the honeycomb structure. The equations for the failure criteria were derived by equating the mass per unit thickness of the core and considering force equilibrium in the loading plane as per the literature [2,15]. Two common failure criteria (compression buckling and cell wall fracture) were chosen to develop failure maps for cores with relative densities () between 10−2 and 101, as presented in Table 2. The critical buckling stress of the honeycomb core is equal to that of the inclined members, neglecting post-buckling effects. The effect of fiber volume fraction on the failure mode is considered by treating the core height as a constant (20 mm) for all cell wall volume fractions in this study. Other material constants used to establish the failure criteria are listed in Table 3 and Table 4.
Table 2.
Common failure modes observed in honeycomb cores used to develop failure mode map [7].
Table 3.
Material properties of the matrix and reinforcement used [21,22].
Table 4.
Elastic constants as a function of fiber volume fraction using the mechanics of the materials approach.
Since a linear buckling analysis is adopted here, the failure maps (Figure 4) developed in the Matlab environment were created for the two fiber volume fractions (0.35 and 0.7), assuming linearity. The plot shows the maximum load-carrying capacity as a function of relative density, based on specially-orthotropic material. The load index on the y-axis in the maps was normalized by the Young’s modulus, E11, of the respective cell wall fiber volume fractions. At lower relative densities (0.04–0.09), compressive buckling of cell walls appeared to be the dominating mode of failure which transitioned briefly to cell wall fracture between relative densities of 0.09 and 0.18. The point of confluence in Figure 4 is obtained by equating σz(fracture) and σz(buckling) and eliminating . The density at that point is the balanced relative density that indicates the occurrence of both buckling and fracture simultaneously and represents the optimum relative density for the core. With any further increase in relative density beyond this point, the dominant failure mode changes from cell wall fracture to buckling. The load indices at the point of confluence for cores with cell wall fiber volume fractions of 0.35 and 0.7 are 1.76 × 10⁻³ and 1.68 × 10⁻³, respectively. The corresponding compressive stresses are 147 MPa and 272 MPa, and the relative density at that point is 0.23 for both fiber volume fractions. Compared with the experimental results, for the core of relative density 0.15, the failure mode (buckling) is in clear agreement with analytical predictions in Figure 3(i,ii).
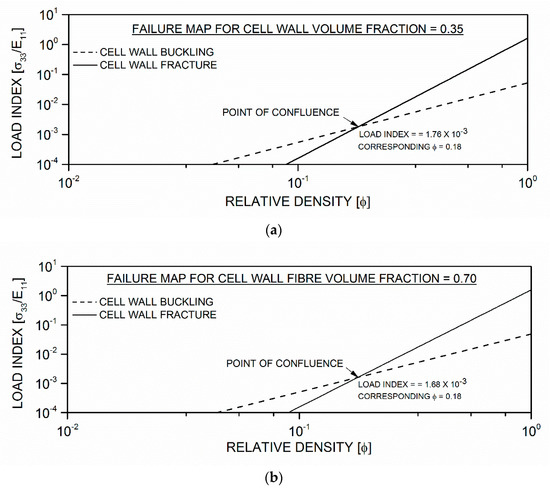
Figure 4.
Failure mode map for fiber-reinforced honeycombs with cell wall fiber volume fractions of (a) 0.35 (b) 0.7.
4.4. Energy Absorption
The load vs. displacement traces (Figure 5) were used to determine the energy absorption (), using Equation (1) [20],
where is the applied force and is the corresponding incremental displacement during the crushing process. The specific energy absorption (SEA) of a structure is the energy per unit mass, as given by Equation (2).
where is the mass of the material, is the volume, and is the composite density.
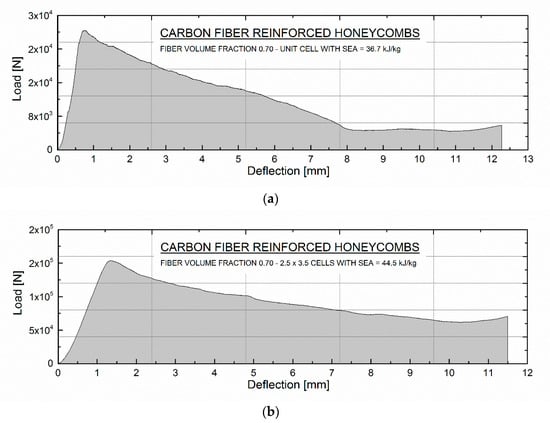
Figure 5.
Energy absorption calculated as the area under the stress vs. deflection trace of (a) unit cell and (b) 2.5 × 3.5 cell core.
Figure 5 shows the load-displacement responses and the computed specific energy absorption values of the unit cell and 2.5 × 3.5 cell samples subjected to quasi-static axial crushing. The crushing process of the unit cell and 2.5 × 3.5 cell honeycomb structures is shown in Figure 3. For both the unit cell and the array, the structure exhibits an initial linear response before reaching peak loads of approximately 26 and 150 kN, respectively. After the critical compressive peak load, a large drop in the crushing load was observed due to cell wall collapse through bending and local buckling. Based on the test results, the 2.5 × 3.5 cells exhibit specific energy absorption values of 44.5 and 36.7 kJ/kg, respectively. From the images in the insert of Figure 3a, the unconstrained cell walls in the single unit cell appear to be free to slide during the crushing process, indicating an unstable and less efficient energy absorption mode. However, as the number of cells increases (2.5 × 3.5), the cell walls within the periphery of the specimen appear to collapse more progressively, due to the change in the restraint conditions, which in effect contributes to a higher energy absorption.
4.5. Energy Absorption Diagram
Energy absorption in these carbon fiber–reinforced honeycombs occurs in four regions, namely the linear elastic region up to the maximum compression strength (peak stress), the elastic-plastic region following the peak stress, the plastic region of uniform stress, and finally, the densification region where the cell walls begin to close up and densify. For honeycombs, a longer plastic region, preferably horizontal, provides a higher energy absorption, since the work done to plastically deform the cell walls consumes the kinetic energy. However, for the purposes of the total energy absorbed by the structure in this study, all the regions are considered, given that pre-crushed samples were used. The energy absorption diagram for cell wall thickness to length ratios (t/l) of 0.08 and 0.04 were developed using results from a finite element model that was validated with experimental results from cores with a t/l ratio of 0.15. SHELL 181 elements (four-node element with six degrees of freedom at each node offering both bending and membrane capabilities) were used to model the honeycomb core. ANSYS Parametric Design Language (APDL) scripting was used to generate the hexagonal honeycomb core, and the material properties for the core were obtained from experimental data. A Young’s modulus of 83.34 GPa, a yield stress of 2.5 GPa, and a tangent modulus of 1.4 GPa were taken for the carbon composite sheet from Table 3 and Reference [21], respectively. Given that there is no way to obtain an exact value for the yield stress for such elastic-plastic materials, this value was assumed based on experimental data. The Poisson’s ratio was taken to be 0.37. The Young’s modulus and the tangent modulus were corrected by the relative density using the relative density function in Table 2. The assumption that the core is isotropic is appropriate, given that the error between the experimental and Finite Element (FE) prediction is less than 10%.
A convergence study was carried out using 5, 15, 25, 30, and 50 elements along the thickness of the core. The FE model was validated by comparing the experimental load vs. deflection trace with that from the FE analysis. The study indicated that 30 elements were sufficient (Figure 6), by exhibiting a discrepancy of less than 10% from the experimental results. Therefore, 30 elements along the thickness of the core were used to analyze the honeycombs based on the two t/l ratios. The load vs. deflection trace obtained from the analysis was used to predict the energy absorbed, and cumulative energy was plotted against stress to construct the energy diagram shown in Figure 7.
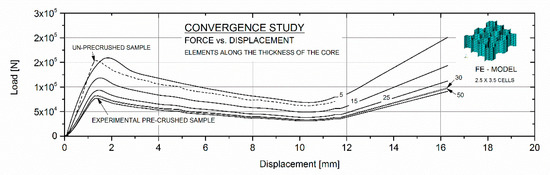
Figure 6.
Convergence study conducted using a finite element model of the 2.5 × 3.5 cell core.
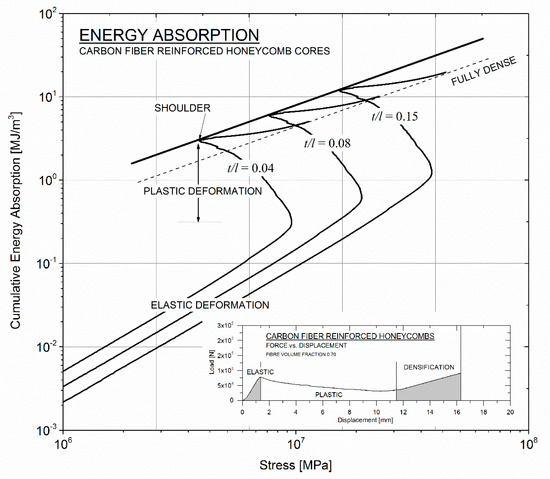
Figure 7.
Energy absorption diagram for the carbon fiber–reinforced cores with three different t/l ratios.
It is evident that the total energy absorption increases with increasing cell wall t/l ratio, with higher absorption occurring in the elastic region, followed by the plastic region, and then the densification region. Optimal energy absorption is given by the curve linking the inflection points of all of the t/l traces in the diagram, denoted as a bold black line in Figure 7. These diagrams can be used to characterize the cushioning properties of the cores and hence to optimize their structures.
5. Summary
In this study, carbon fiber–reinforced honeycomb cores were manufactured using the vacuum-assisted resin transfer molding (VARTM) method. Wax templates were extracted from molds that were printed using a 3D printer. Pre-compacted dry carbon tapes were used as the reinforcement in the cell walls. The mechanical performance of composite honeycombs was determined by subjecting them to out-of-plane compression loading. Failure maps were constructed for two fiber volume fractions, and energy absorption maps were developed using experimental and numerical data. The compression test results showed a load-carrying capacity of up to 26 kN (~143 MPa) for a single hexagonal cell (unit cell) and 160 kN (~170 MPa) for cores consisting of 2.5 × 3.5 cells. The failure map indicates buckling to be the predominant mode of failure at lower relative densities, shifting to cell wall fracture at relative densities closer to a value of 10−1. The energy absorption diagram shows a monotonic increase in energy absorption with an increase in the t/l ratio of the honeycomb core cell walls.
Author Contributions
J.T. has assisted in the manufacturing and testing of the specimens, A.A. has contributed in analyzing energy absorption characteristics of the honeycombs, W.C. has contributed in developing the wax template and thoroughly editing the manuscript, and S.R. has written this article and contributed in analyzing the results as well as in developing failure and energy absorption maps.
Funding
This research was performed as part of the Aerospace Research & Innovation Center (ARIC) program which is jointly funded by Mubadala Aerospace & Khalifa University. The authors thank Mubadala Aerospace for funding this work and the Department of Aerospace Engineering for the use of their equipment.
Acknowledgments
Authors would like to thank Aishah Al Hefeiti for the assistance in honeycomb manufacturing and Prabhu Raja for assisting in testing the honeycombs.
Conflicts of Interest
The authors declare no conflict of interest.
References
- Bitzer, T. Honeycomb Technology: Materials, Design, Manufacturing, Applications and Testing; Chapman & Hall: London, UK, 1997. [Google Scholar]
- Rao, S.; Jayaraman, K.; Bhattacharyya, D. Short fibre reinforced cores and their sandwich panels: Processing and evaluation. Composites Part A 2011, 42, 1236–1246. [Google Scholar] [CrossRef]
- Rao, S.; Jayaraman, K.; Bhattacharyya, D. Micro and macro analysis of sisal fibre composites hollow core sandwich panels. Composites Part B 2012, 43, 2738–2745. [Google Scholar] [CrossRef]
- Petrone, G.; Rao, S.; De Rosa, S.; Mace, B.R.; Franco, F.; Bhattacharyya, D. Behaviour of fibre-reinforced honeycomb core under low velocity impact loading. Compos. Struct. 2013, 100, 356–362. [Google Scholar] [CrossRef]
- Petrone, G.; Rao, S.; De Rosa, S.; Mace, B.R.; Franco, F.; Bhattacharyya, D. Initial experimental investigations on natural fibre reinforced honeycomb core panels. Composites Part B 2013, 55, 400–406. [Google Scholar] [CrossRef]
- Vivolo, M.; Rao, S.; Vandepitte, D.; Desmet, W.; Mace, B.R.; Bhattacharyya, D. Effects of Core Geometry on the Vibro-Acoustic Behaviour of Fibre Reinforced Corrugated Core Sandwich Panels. In Proceedings of the 15th European Conference on Composite Materials (ECCM15), Venice, Italy, 24–28 June 2012. [Google Scholar]
- Rao, S.; Jayaraman, K.; Bhattacharyya, D. Hollow Core BioPanels: Manufacturing and Analysis; LAP Lambert Academic Publishing: Saarbrücken, Germany, 2011. [Google Scholar]
- Ashby, M.F.; Bréchet, Y.J.M. Designing hybrid materials. Acta Mater. 2003, 51, 5801–5821. [Google Scholar] [CrossRef]
- Finnegan, K.; Kooistra, G.; Wadley, H.N.G.; Deshpande, V.S. The compressive response of carbon fiber composite pyramidal truss sandwich cores. Int. J. Mater. Res. 2007, 98, 1264–1272. [Google Scholar] [CrossRef]
- Fan, H.L.; Meng, F.H.; Yang, W. Sandwich panels with Kagome lattice cores reinforced by carbon fibers. Compos. Struct. 2007, 81, 533–539. [Google Scholar]
- Fan, H.; Fang, D.; Chen, L.; Dai, Z.; Yang, W. Manufacturing and testing of a CFRC sandwich cylinder with Kagome cores. Compos. Sci. Technol. 2009, 69, 2695–2700. [Google Scholar] [CrossRef]
- Heimbs, S.; Cichosz, J.; Klaus, M.; Kilchert, S.; Johnson, A.F. Sandwich structures with textile-reinforced composite foldcores under impact loads. Compos. Struct. 2010, 92, 1485–1497. [Google Scholar] [CrossRef]
- George, T.; Deshpande, V.S.; Sharp, K.; Wadley, H.N.G. Hybrid core carbon fiber composite sandwich panels: Fabrication and mechanical response. Compos. Struct. 2014, 108, 696–710. [Google Scholar] [CrossRef]
- Russell, B.; Deshpande, V.; Wadley, H.N.G. Quasistatic deformation and failure modes of composite square honeycombs. J. Mech. Mater. Struct. 2008, 3, 1315–1340. [Google Scholar] [CrossRef]
- Gibson, L.J.; Ashby, M.F. Cellular Solids: Structure and Properties; Cambridge University Press: Cambridge, UK, 1997. [Google Scholar]
- Petras, A.; Sutcliffe, M.P.F. Failure mode maps for honeycomb sandwich panels. Compos. Struct. 1999, 44, 237–252. [Google Scholar] [CrossRef]
- Othman, A.R.; Barton, D.C. Failure initiation and propagation characteristics of honeycomb sandwich composites. Compos. Struct. 2008, 85, 126–138. [Google Scholar] [CrossRef]
- Khan, M.K.; Baig, T.; Mirza, S. Experimental investigation of in-plane and out-of-plane crushing of aluminum honeycomb. Mater. Sci. Eng. A 2012, 539, 135–142. [Google Scholar] [CrossRef]
- Ivañez, I.; Fernandez-Cañadas, L.M.; Sanchez-Saez, S. Compressive deformation and energy-absorption capability of aluminium honeycomb core. Compos. Struct. 2017, 174, 123–133. [Google Scholar] [CrossRef]
- Meran, A.P.; Toprak, T.; Muǧan, A. Numerical and experimental study of crashworthiness parameters of honeycomb structures. Thin Walled Struct. 2014, 78, 87–94. [Google Scholar] [CrossRef]
- PRIMETM 20LV Laminating. Available online: http://www.gurit.com/sitecore/content/Old-Product-Pages/Other-Products/Laminating-Infusion-Systems/PRIME-20LV (accessed on 20 July 2018).
- Rodriguez, A. A robust UD dry tape product for automated manufacturing of composites. In Proceedings of the SC Aerospace Conference & Expo (ACE’ 16), South Carolina, SC, USA, 24–25 August 2016. [Google Scholar]
© 2019 by the authors. Licensee MDPI, Basel, Switzerland. This article is an open access article distributed under the terms and conditions of the Creative Commons Attribution (CC BY) license (http://creativecommons.org/licenses/by/4.0/).